

Abstract
The tumor immune microenvironment is increasingly becoming a key consideration in developing treatment regimens for aggressive cancers, with evidence that regulatory T cells (Tregs) attenuate the antitumor response by interrupting cytotoxic T cells (CD8+). Here, we hypothesized the prognostic relevance of the proportions of Tregs (marked by forkhead box protein 3 [FOXP3]) and CD8+ cells in diffuse, non‐Epstein–Barr virus (EBV)/non‐microsatellite instability (MSI)‐high gastroesophageal adenocarcinomas (GEAs), which are clinically characterized as more aggressive, immunologically inactive tumors as compared with their intestinal counterparts. Cell‐count ratios of FOXP3+/CD8+ expression were calculated at the intratumoral region and invasive margin discretely on digital images from 303 chemo‐naive non‐EBV/non‐MSI‐high esophagogastric junction (EGJ) adenocarcinomas. A significant modifying prognostic effect of tumor histology was observed between 5‐year EGJ cancer‐specific survival and the FOXP3+/CD8+ ratio at the invasive margin in pStage I–III tumors (p for interaction = 0.022; hazard ratio [HR] = 8.47 and 95% confidence interval [CI], 2.04–35.19 for high ratio [vs. low] for diffuse; HR = 1.57 and 95% CI, 0.88–2.83 for high ratio [vs. low] for intestinal). A high FOXP3+/CD8+ ratio at the invasive margin was associated with RUNX3 methylation (p = 0.035) and poor prognosis in RUNX3‐methylated diffuse histological subtype (5‐year EGJ cancer‐specific survival, 52.3% for high and 100% for low, p = 0.015). Multiomics data from The Cancer Genome Atlas linked CCL28 with RUNX3‐suppressed diffuse histological subtypes of non‐EBV/non‐MSI‐high GEA. Our data suggest that a high FOXP3+/CD8+ ratio at the invasive margin might indicate tumor immune escape via CCL28, particularly in the RUNX3‐methylated diffuse histological subtype.
Keywords: chemokine, diffuse histology, effector T cell, esophagogastric junction adenocarcinoma, regulatory T cell
Epstein–Barr virus (EBV)‐associated and microsatellite instability (MSI)‐high tumors evade antitumor immunity mainly by expressing programmed death‐ligand 1. However, little is known about the tumor immune microenvironment of non‐EBV/non‐MSI‐high tumors. Here, we show that the FOXP3+/CD8+ ratio differs by histology, with a high ratio at the invasive margin associated with an unfavorable prognosis in the diffuse histological subtype of non‐EBV/non‐MSI‐high esophagogastric junction adenocarcinoma. This is particularly evident in RUNX3−methylated tumors, which might be linked to CCL28 production.

Abbreviations
- CI
confidence interval
- COL2A
collagen 2A1 gene
- EBER
Epstein–Barr virus‐encoded RNA
- EBV
Epstein–Barr virus
- EGJ
esophagogastric junction
- FFPE
formalin‐fixed, paraffin‐embedded
- FOXP3
forkhead box protein 3
- GEA
gastroesophageal adenocarcinoma
- HR
hazard ratio
- IHC
immunohistochemical
- ISH
in situ hybridization
- MSI
microsatellite instability
- PD‐1
programmed death‐1
- PD‐L1
programmed death‐ligand 1
- PMR
programmed death‐1percentage of the methylated reference
- TCGA
The Cancer Genome Atlas
- TPS
tumor proportion score
- Treg
regulatory T cell
- UICC
Union for International Cancer Control
1. INTRODUCTION
Gastroesophageal adenocarcinoma (GEA) can be classified into four molecular subtypes: Epstein–Barr virus (EBV)‐associated, microsatellite instability (MSI)‐high, genomically stable (GS), and chromosomally instable (CIN) tumors. 1 , 2 Among these, EBV‐associated and MSI‐high tumors are immunologically active, sharing increased lymphocytic infiltration and elevated programmed death‐ligand 1 (PD‐L1) expression. 3 , 4 , 5 , 6 , 7 Understanding the tumor immune microenvironment is essential for the discovery of novel targets for cancer immunotherapy. In recent years, immune checkpoint inhibitors have emerged as novel antitumor drugs for these and various other types of malignant tumors through inhibition of the programmed death‐1 (PD‐1)/PD‐L1 axis. 8 , 9 However, there is still lack of understanding of the tumor microenvironment for non‐EBV/non‐MSI‐high tumors (i.e., GS and CIN tumors).
Lauren classification is widely used for histological subtyping of GEA and categorizes tumors into diffuse or intestinal histological subtypes (histotypes). 10 Diffuse histology, which is clinically characterized by aggressive tumors with lower chemosensitivity and worse prognosis, is genetically associated with the GS subtype by molecular subtyping, 1 , 10 and is represented as an immunologically “cold tumor,” due to a lower count of tumor‐infiltrating lymphocytes (TILs) and infrequent PD‐L1 expression. The underlying immunosuppressive mechanisms of the tumor, however, are unknown. 11 , 12
In the tumor immune microenvironment, cytotoxic T lymphocytes, also known as CD8+ T cells, exert an antitumor immune response by releasing perforin, granzymes, and a plethora of cytokines, such as interferon‐γ (IFN‐γ) and tumor necrosis factor‐α (TNF‐α). 13 , 14 , 15 In various types of malignant tumors, counts of tumor infiltrating CD8+ T cells is considered to be a promising biomarker. 16 In contrast, regulatory T cells (Tregs)—also referred to as forkhead box protein 3‐positive (FOXP3+) T cells—negatively regulate the antitumor immune response by suppressing CD8+ T cells. 17 , 18 , 19 , 20 As such, the balance between CD8+ T cells and FOXP3+ T cells is an important consideration within the tumor immune microenvironment. 21 , 22 However, the underlying mechanism affecting this balance remains unclear.
In this study, we hypothesized that the balance between FOXP3+ and CD8+ T cell counts may differ by tumor histological type and focused on non‐EBV/non‐MSI‐high esophagogastric junction (EGJ) adenocarcinoma. We evaluated the ratios of FOXP3+ cell counts to CD8+ cell counts (FOXP3+/CD8+ ratio) at the invasive margin and at intratumoral regions in relation to various clinical, pathological, and molecular factors, including epigenetic changes, with cases stratified by histotype.
2. MATERIALS AND METHODS
2.1. Study population
Esophagogastric junction adenocarcinoma was specified by Siewert classification: type I, defined as tumors of the distal esophagus, in which the epicenter of the tumor is located 1–5 cm above the anatomical EGJ; type II, true junctional tumors, in which the epicenter is located 1 cm above and 2 cm below the EGJ; and type III, gastric tumors that infiltrate into the esophagus, for which the epicenter is located between 2 and 5 cm below the EGJ. 23 This study included Siewert type I–III tumors.
The study population was a retrospective cohort of 386 consecutive patients with EGJ adenocarcinoma who underwent surgical resection at one of four academic institutions in Japan between February 2000 and January 2015 (Figure S1). Disease staging for EGJ adenocarcinoma was based on the 7th edition of the Union for International Cancer Control (UICC) classification of esophageal cancer. 24 Written informed consent was obtained from all patients before specimen collection.
To eliminate any confounding effects from chemotherapy or radiotherapy, 68 patients treated with neoadjuvant chemotherapy (N = 65) or neoadjuvant chemoradiotherapy (N = 3) were excluded. Further 21 cases were removed due to a lack of paired tumor and normal DNA. Next, we removed cases that were EBV associated (N = 9) or MSI high (N = 28) to restrict cases to non‐EBV/non‐MSI‐high tumors. Specifically, cases with microscopic nuclear Epstein–Barr virus‐encoded RNA (EBER) expression in the tumor cells, detected using EBER in situ hybridization (ISH) analysis, were confirmed as “EBV+” and excluded, 25 and cases presenting with two or more instability markers using an MSI‐PCR assay (BAT25, BAT26, BAT40, D2S123, D5S346, and D17S250) were defined as MSI high and excluded. Microsatellite‐stable cases had an absence of markers and were retained. 25 Finally, 32 cases that were unsuitable for cell counting were excluded. The reasons were tissue defects caused by unclear cutting (N = 10), regions that were too small or large to distinguish the invasive margin from the intratumoral region (N = 6), or the presence of mucosal tumors (pT1a) (N = 16) that were too shallow to distinguish the invasive margin from the intratumoral region. As a result, a final cohort of 303 patients with non‐EBV/non‐MSI‐high EGJ adenocarcinoma were eligible for this study.
2.2. Histopathological evaluation and immunohistochemical (IHC) staining analyses
Serial sections were taken from formalin‐fixed, paraffin‐embedded (FFPE) tissue blocks for IHC staining and DNA extraction. The largest central cut of the entire tumor was chosen as a representative block of the tumor tissue sample; gastric normal mucosa of the resected stomach was used as the normal tissue sample. IHC staining was carried out on a fully automated IHC staining system, as previously described. 25 Histological subtype was categorized by Lauren classification, with the dominant histology applied in the case of histologically heterogenic tumors. 10
Lymphocytic infiltration was evaluated by counting the proportion of FOXP3+ (clone 236A/E7, Abcam) and CD8+ (clone C8/144B, Nichirei Bioscience) cells at the invasive margin or within the tumor tissue (intratumor) separately. Using a pan‐cytokeratin (CK) slide as a reference, the tumor border was traced on CK‐stained slides. 25 The “invasive margin” was defined as the tumor border, where the tumor area represents half of the field of view on a 20× objective, whereas “intratumor” was defined as the area inside the tumor border. 26 , 27 For each invasive margin and intratumoral region, three of the most lymphocyte‐rich areas (hotspots) were selected for counting on H&E‐stained slides. Obvious lymphoid follicles were excluded from hot spots. Digital images were captured, and the counts per square millimeter of FOXP3+ or CD8+ cells were counted using ImageJ software (Figure 1). IHC staining for Ki‐67, HER2, and PD‐L1 was performed as previously described, and IHC for CCL28 (clone PA5–28821, Invitrogen) was performed in a similar manner. 25 PD‐L1 expression was quantified using tumor proportion score (TPS), and positive PD‐L1 expression was defined as TPS ≥1%. 28 Multiplex fluorescence IHC for CCL28, CK, and FOXP3 was also employed and scanned by Vectra Polaris (AKOYA Biosciences) as previously described. 29
FIGURE 1.
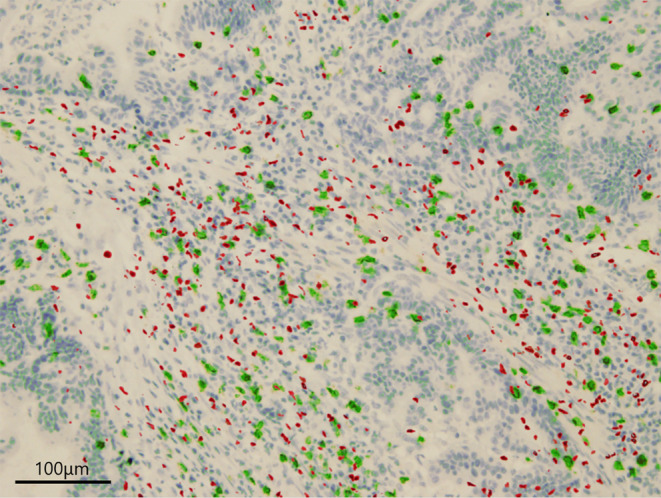
Merged immunohistochemical staining for FOXP3 and CD8. Merged immunohistochemical staining for FOXP3 (red) and CD8 (green) in esophagogastric junction adenocarcinoma.
2.3. Calculating FOXP3+/CD8+ at the invasive margin or intratumor
Three hotspots enriched with lymphocytes were selected at the invasive margin or the intratumoral region on H&E‐stained sections. Obvious lymphoid follicles were excluded from the hotspots. The numbers of FOXP3+ or CD8+ cells were counted at each hotspot using ImageJ software on a digitally captured whole‐image slide to determine the average FOXP3+/CD8+ ratio. 25 Patients were divided into high‐ and low‐FOXP3+/CD8+ ratio groups for the invasive margin and intratumoral regions, separately by these median values of the FOXP3+/CD8+ ratio as the cutoff.
2.4. Methylation analysis for the selected CpG islands and TP53 sequencing
The methylation levels of 11 CpG island promoter regions frequently altered in GEA (MLH1, CDKN2A, MGMT, CHFR, CDH1, IGF2, RUNX3, CRABP1, NEUROG1, CACNA1G, SOCS1, and LINE‐1) were quantified by Real‐time PCR (MethyLight), as previously described. 25 Collagen 2A1 gene (COL2A) was used to normalize the amount of the bisulfite‐converted DNA. The percentage of the methylated reference (PMR, i.e., degree of methylation) at a specific locus of the CpG island promoter region (GENE X, as a simplification) was calculated by dividing the GENE X: COL2A1 ratio in the sample by the GENE X:COL2A1 ratio in the Universal Methylated DNA Standard (Zymo Research) and multiplying this value by 100. The level of positive methylation was set to PMR ≥ 4, as previously validated. 30
The entire TP53 coding region was sequenced using a HiSeq2500 or MiSeq platform (Illumina), as previously described. 25 Multiplex PCR and library construction for TP53 was performed using the Ampliseq for Illumina suite.
2.5. Transcriptional data for FOPX3, CD8A, and chemokines effecting the FOXP3+/CD8+ ratio using TCGA database of gastroesophageal tumors
Histological and multiomics data for gastroesophageal tumors were obtained from The Cancer Genome Atlas (TCGA). 2 Transcriptional data for FOXP3, CD8A, and 29 types of CC, CXC, C, or CX3C chemokines were acquired from cBioPortal for Cancer Genomics (https://www.cbioportal.org).
2.6. Statistical analysis
All statistical analyses were performed using JMP13 software (Version 13.2.1, SAS Institute). All p‐values were two sided. Univariate analyses were performed to investigate clinicopathological and molecular characteristics according to the FOXP3+/CD8+ ratio status (high vs. low) at the intratumoral region or invasive margin. Categorical data were assessed using Chi‐squared or Fisher's exact tests, whereas continuous data were assessed using Student's t‐test, Wilcoxon test, or Kruskal–Wallis test. The Kaplan–Meier method was used to estimate survival distribution, and the log‐rank test to compare the survival distributions according to FOXP3+/CD8+ ratio status. EGJ cancer‐specific survival time for each case was calculated from the date of surgical resection until the date of death from the EGJ adenocarcinoma or January 31st, 2019, whichever came first. Cox proportional hazards models were used to estimate mortality hazard ratios (HRs) and 95% confidence intervals (CIs) for the FOXP3+/CD8+ ratio status, using “FOXP3+/CD8+ ratio low” as a reference in the analysis of intratumor or invasive margin.
The multivariate model initially included the following clinicopathological and molecular variables, with less than 10% of patients showing missing information: sex (male vs. female), age (median split, <66 vs. ≥67), year of surgery (median split, before December 2009 vs. after January 2010), body mass index (BMI, median split, <22.5 vs. ≥22.5 kg/m2), tumor macroscopic diameter in specimen (median split, <50 vs. ≥50 mm), tumor location according to Siewert classification (type I vs. II vs. III), coincident Barrett's esophagus (identified by endoscopy or surgical pathology reports; presence vs. absence), disease stage according to the 7th UICC TNM classification of esophageal cancer (I vs. II vs. III vs. IV), dominant histological type by Lauren's classification (diffuse vs. intestinal), lymphatic invasion (presence vs. absence), venous invasion (presence vs. absence), Ki‐67 index (0%–9% vs. 10%–29% vs. 30%–49% vs. 50%–79% vs. 80%–100%), surgical approach (transthoracic vs. transhiatal), operative time (median split, <309 vs. ≥309 min), blood loss volume (median split, <350 vs. ≥350 g), blood transfusion (presence vs. absence), resection margin (R0 vs. R1 vs. R2), postoperative complications according to Clavien–Dindo classification (none or I–II vs. IIIa–V), adjuvant chemotherapy (presence vs. absence), HER2 overexpression (negative‐equivocal [0–2+] vs. positive [3+]), TP53 mutation (not detected vs. mutated), LINE‐1 methylation (median split, <66% vs. ≥66%), and tumor PD‐L1 expression (positive [TPS ≥1%] vs. negative [TPS <1%]). A backward elimination was performed with a threshold of p = 0.10 to avoid overfitting. We confirmed that the exclusion of cases due to missing information did not substantially alter the results (data not shown). An interaction was assessed by the Wald test on the cross product of the FOXP3+/CD8+ ratio status and histological type in a multivariate Cox model.
3. RESULTS
3.1. Baseline characteristics of 303 cases of EGJ adenocarcinoma
The clinical, pathological, and molecular characteristics of all patients enrolled (N = 303) are summarized in Table S1. There were 223 cases (73.6%) of intestinal‐subtype and 80 cases (26.4%) of diffuse‐subtype EGJ adenocarcinoma. FOXP3+ and CD8+ T cell counts were the same between invasive margin and intratumoral region in all cases examined (Figure S2A,B). However, those distributions were different according to histotypes. In the intestinal subtype, although FOXP3+ cell counts were similar between two regions (Figure S2C), CD8+ cell count at the invasive margin was significantly higher as compared with that at intratumoral region (p = 0.012, Figure S2D). In the diffuse subtype, both FOXP3+ and CD8+ T cell count at the invasive margin was significantly lower as compared with those at the intratumoral region (Figure S2E,F).
The FOXP3+/CD8+ ratio was significantly lower in the invasive margin than the intratumoral region (p = 0.0002, Figure 2A), and this trend was also observed in the intestinal histotype, but not in the diffuse histotype (Figure 2B,C). The median value of the FOXP3+/CD8+ ratio was 0.48 (range, 0.10–2.66) at the invasive margin and 0.60 (range, 0.027–11.2) in the intratumoral region (Figure 2A). For subsequent analyses, patients were divided into high‐ and low‐FOXP3+/CD8+ ratio groups using these median values as the cutoff, with diffuse and intestinal histological subtypes assessed separately.
FIGURE 2.
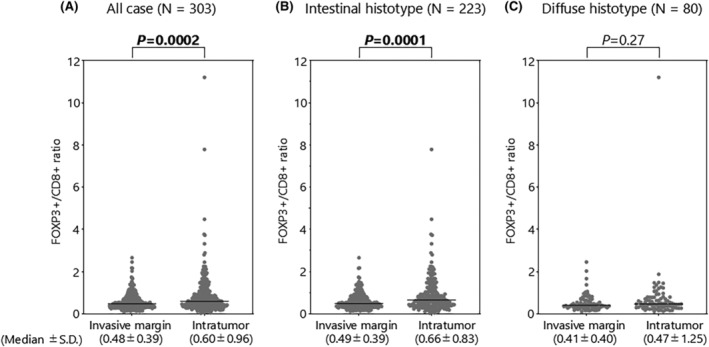
FOXP3+/CD8+ ratio at the intratumoral region and invasive margin. (A) FOXP3+/CD8+ ratio in all cases (N = 303). (B) FOXP3+/CD8+ ratio in intestinal histotype (N = 223). (C) FOXP3+/CD8+ ratio in diffuse histotype (N = 80). SD, standard deviation.
3.2. Relation between FOXP3+/CD8+ ratio status and survival according to histotype
Survival analyses were used to examine the clinical phenotype of patients with a high FOXP3+/CD8+ ratio at the invasive margin or the intratumoral region. At the invasive margin, Kaplan–Meier analysis showed that high FOXP3+/CD8+ ratios were associated with worse outcomes among patients with diffuse histology (Figure 3A) with an inverse trend observed for those with intestinal histology (Figure 3B). In the multivariate analysis, there was no differential effect for tumor histology on the association between FOXP3+/CD8+ status and patient outcome (Figure 3C).
FIGURE 3.
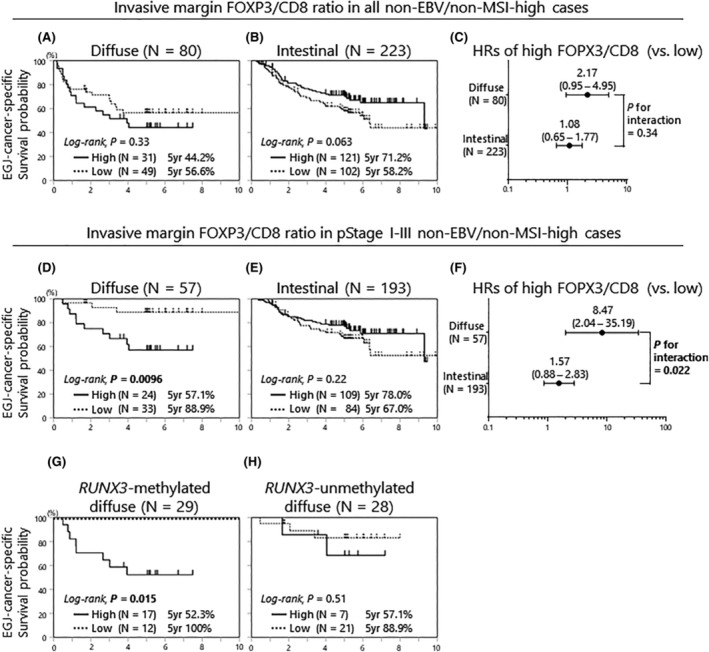
Esophagogastric junction cancer‐specific survival according to FOXP3+/CD8+ ratio at the invasive margin, stratified by histological subtypes and pathological stage. (A) Kaplan–Meier curves of pStage I–IV diffuse histological subtype in non‐EBV/non‐MSI‐high tumors (N = 80). (B) Kaplan–Meier curves of pStage I–IV intestinal histological subtype in non‐EBV/non‐MSI‐high tumors (N = 223). (C) Hazard ratios of the high‐ and low‐FOXP3+/CD8+ ratio cases provided by multivariate Cox proportional hazards models (pStage I–IV). The p‐value for the interaction was provided by the Wald test on the cross product of FOXP3+/CD8+ ratio status and histological subtypes, in a multivariate Cox model. (D) Kaplan–Meier curves of pStage I–III diffuse histological subtype of non‐EBV/non‐MSI‐high tumors (N = 57). (E) Kaplan–Meier curves of pStage I–III intestinal histological subtype of non‐EBV/non‐MSI‐high tumors (N = 193). (F) Hazard ratios of the high and low FOXP3+/CD8+ ratio cases provided by multivariate Cox proportional hazards models (pStage I–III). The p‐value for the interaction was provided as in (C). (G) Kaplan–Meier curves of pStage I–III RUNX3‐methylated diffuse histological subtype of non‐EBV/non‐MSI‐high tumors (N = 29). (H) Kaplan–Meier curves of pStage I–III RUNX3‐unmethylated diffuse histological subtype of non‐EBV/non‐MSI‐high tumors (N = 28). EBV, Epstein–Barr virus; FOXP3, forkhead box protein 3; MSI, microsatellite instability.
In EGJ adenocarcinoma, patients with pStage IV cancer have already reached the systemic disease stage, and therefore the microenvironment of the primary tumor is unlikely to influence patient survival. Thus, subsequent subgroup analyses focused only on patients with pStage I–III disease. The HRs for high FOXP3+/CD8+ ratio (vs. low) were 8.47 (95% CI, 2.04–35.19, p = 0.0033) and 1.57 (95% CI, 0.88–2.83, p = 0.13) for the diffuse and intestinal types, respectively (Figure 3D,E). Among these patients, we observed a significant modifying effect of tumor histology on the relation between FOXP3+/CD8+ high ratio and patient survival (p for interaction = 0.022 in multivariate analysis; Figure 3F).
At the intratumoral region, there was no interaction between intratumoral FOXP3+/CD8+ ratio and histological subtype in relation to patient outcomes for all cases or after excluding pStage IV (Figure S3A–F).
3.3. Clinicopathological and molecular features of diffuse tumors, according to FOXP3+/CD8+ ratio
To clarify why high FOXP3+/CD8+ ratios at the invasive margin were associated with worse prognosis in patients with diffuse tumors, we investigated the clinicopathological features of the diffuse‐type pStage I–III cases (N = 57, Table 1). Focusing on the tumor invasive margin, patients with high FOXP3+/CD8+ ratios were more frequently classified as Siewert type I (p = 0.035) and less frequently underwent adjuvant chemotherapy via an oral intake of S‐1, which is a combination cytotoxic drug containing tegafur/gimeracil/oteracil (p = 0.048). This lower administration of adjuvant chemotherapy might have contributed to the worsened outcomes observed among the cohort. To test this, a subgroup analysis was performed according to the use of neoadjuvant chemotherapy (N = 56). Unexpectedly, there was no benefit observed from treatment with adjuvant chemotherapy, with high FOXP3+/CD8+ ratio cases still experiencing significantly worse outcomes than low‐ratio cases (N = 34, p = 0.0007, Figure S4A). This same association was not observed in patients not treated with adjuvant chemotherapy (Figure S4B).
TABLE 1.
Clinicopathological characteristics of the diffuse histological subtype of esophagogastric junction adenocarcinoma according to intratumoral or invasive‐margin FOXP3+/CD8+ ratio status (pStage I–III).
| Clinicopathological features | Invasive margin FOXP3+/CD8+ ratio | Intratumoral FOXP3+/CD8+ ratio | ||||||
|---|---|---|---|---|---|---|---|---|
| Total no. | High (N = 24) | Low (N = 33) | p | Total no. | High (N = 23) | Low (N = 34) | p | |
| Sex | 0.76 a | 0.76 a | ||||||
| Female | 14 (25%) | 5 (21%) | 9 (27%) | 14 (25%) | 5 (22%) | 9 (26%) | ||
| Male | 43 (75%) | 19 (79%) | 24 (73%) | 43 (75%) | 18 (78%) | 25 (74%) | ||
| Age at surgery (year, mean ± SD) | 61.6 ± 13.1 | 64.1 ± 13.0 | 59.8 ± 13.2 | 0.24 | 61.6 ± 13.1 | 62.5 ± 11.4 | 61.0 ± 14.3 | 0.69 |
| Year of surgery | 0.11 | 0.058 | ||||||
| Prior to Dec. 2009 | 26 (46%) | 8 (33%) | 18 (54%) | 26 (46%) | 7 (30%) | 19 (56%) | ||
| Jan. 2010–Jan. 2015 | 31 (54%) | 16 (67%) | 15 (46%) | 31 (54%) | 16 (70%) | 15 (44%) | ||
| Body mass index (kg/m2, mean ± SD) | 22.6 ± 3.6 | 22.5 ± 4.1 | 22.7 ± 3.2 | 0.75 | 22.6 ± 3.6 | 22.2 ± 4.1 | 22.9 ± 3.2 | 0.31 |
| Macroscopic tumor diameter (mm, mean ± SD) | 54.5 ± 27.4 | 51.8 ± 32.1 | 56.4 ± 23.8 | 0.18 | 54.5 ± 27.4 | 60.4 ± 35.9 | 50.5 ± 19.3 | 0.62 |
| Siewert classification | 0.035 | 0.14 | ||||||
| Type I | 7 (12%) | 6 (25%) | 1 (3%) | 7 (12%) | 5 (22%) | 2 (6%) | ||
| Type II | 42 (74%) | 16 (67%) | 26 (79%) | 42 (74%) | 14 (61%) | 28 (82%) | ||
| Type III | 8 (14%) | 2 (8%) | 6 (18%) | 8 (14%) | 4 (17%) | 4 (12%) | ||
| Barrett's esophagus | 0.21 | 0.18 | ||||||
| Absent | 42 (74%) | 16 (67%) | 26 (79%) | 42 (74%) | 17 (74%) | 25 (73%) | ||
| SSBE | 13 (23%) | 6 (25%) | 7 (21%) | 13 (23%) | 4 (17%) | 9 (27%) | ||
| LSBE | 2 (3%) | 2 (8%) | 0 | 2 (3%) | 2 (9%) | 0 | ||
| Disease stage (7th UICC) | 0.99 | 0.89 | ||||||
| I | 9 (16%) | 4 (17%) | 5 (15%) | 9 (16%) | 3 (13%) | 6 (18%) | ||
| II | 7 (12%) | 3 (13%) | 4 (12%) | 7 (12%) | 3 (13%) | 4 (12%) | ||
| III | 41 (72%) | 17 (70%) | 24 (73%) | 41 (72%) | 17 (74%) | 24 (70%) | ||
| Lymphatic invasion | 0.99 a | 0.22 | ||||||
| Absent | 7 (12%) | 3 (13%) | 4 (12%) | 7 (12%) | 1 (4%) | 6 (18%) | ||
| Present | 50 (88%) | 21 (87%) | 29 (88%) | 50 (88%) | 22 (96%) | 28 (82%) | ||
| Venous invasion | 0.93 | 0.93 | ||||||
| Absent | 17 (30%) | 7 (29%) | 10 (30%) | 17 (30%) | 7 (30%) | 10 (29%) | ||
| Present | 40 (70%) | 17 (71%) | 23 (70%) | 40 (70%) | 16 (70%) | 24 (71%) | ||
| Surgical approach | 0.95 | 0.40 | ||||||
| Transhiatal | 43 (75%) | 18 (75%) | 25 (76%) | 43 (75%) | 16 (70%) | 27 (79%) | ||
| Transthoracic | 14 (25%) | 6 (25%) | 8 (24%) | 14 (25%) | 7 (30%) | 7 (21%) | ||
| Operative time (minutes, mean ± SD) | 357 ± 158 | 384 ± 176 | 338 ± 143 | 0.44 | 357 ± 158 | 384 ± 167 | 339 ± 151 | 0.31 |
| Blood loss volume (gram, mean ± SD) | 379 ± 435 | 373 ± 499 | 383 ± 390 | 0.24 | 379 ± 435 | 380 ± 480 | 378 ± 409 | 0.97 |
| Absent | 54 (95%) | 23 (96%) | 31 (94%) | 54 (95%) | 22 (96%) | 32 (94%) | ||
| Present | 3 (5%) | 1 (4%) | 2 (6%) | 3 (5%) | 1 (4%) | 2 (6%) | ||
| Resection margin | 0.64 a | 0.99 a | ||||||
| R0 | 52 (91%) | 21 (87%) | 31 (94%) | 52 (91%) | 21 (91%) | 31 (91%) | ||
| R1 | 5 (9%) | 3 (13%) | 2 (6%) | 5 (9%) | 2 (9%) | 3 (9%) | ||
| R2 | 0 | 0 | 0 | 0 | 0 | 0 | ||
| Postoperative complications | 0.74 | 0.99 a | ||||||
| None or Clavien–Dindo <IIIa | 44 (77%) | 18 (75%) | 26 (79%) | 44 (77%) | 18 (78%) | 26 (77%) | ||
| Clavien–Dindo ≥IIIa | 13 (23%) | 6 (25%) | 7 (21%) | 13 (23%) | 5 (22%) | 8 (23%) | ||
| Adjuvant chemotherapy | 0.048 | 0.27 | ||||||
| Absent | 22 (39%) | 13 (54%) | 9 (28%) | 22 (39%) | 11 (48%) | 11 (33%) | ||
| Present | 34 (61%) | 11 (46%) | 23 (72%) | 34 (61%) | 12 (52%) | 22 (67%) | ||
| The first site of recurrence | ||||||||
| Peritoneum | 0.073 a | 0.99 a | ||||||
| Absent | 51 (89%) | 19 (79%) | 32 (97%) | 51 (89%) | 21 (91%) | 30 (88%) | ||
| Present | 6 (11%) | 5 (21%) | 1 (3%) | 6 (11%) | 2 (9%) | 4 (12%) | ||
| Lung | 0.42 a | 0.40 a | ||||||
| Absent | 56 (98%) | 23 (96%) | 33 (100%) | 56 (98%) | 22 (96%) | 34 (100%) | ||
| Present | 1 (2%) | 1 (4%) | 0 | 1 (2%) | 1 (4%) | 0 | ||
| Bone | 0.42 a | 0.99 a | ||||||
| Absent | 56 (98%) | 23 (96%) | 33 (100%) | 56 (98%) | 23 (100%) | 33 (97%) | ||
| Present | 1 (2%) | 1 (4%) | 0 | 1 (2%) | 0 | 1 (3%) | ||
| Adrenal | 0.99 a | 56 (98%) | 22 (96%) | 34 (100%) | 0.40 a | |||
| Absent | 56 (98%) | 24 (100%) | 32 (97%) | 1 (2%) | 1 (4%) | 0 | ||
| Present | 1 (2%) | 0 | 1 (3%) | |||||
| Lymph node | 0.15 a | 0.15 a | ||||||
| Absent | 52 (91%) | 20 (83%) | 32 (97%) | 52 (91%) | 19 (83%) | 33 (97%) | ||
| Present | 5 (9%) | 4 (17%) | 1 (3%) | 5 (9%) | 4 (17%) | 1 (3%) | ||
Note: (%) indicates the proportion of cases with a specific clinicopathological feature among each FOXP3+/CD8+ ratio status group.
Abbreviation: LSBE, Long segment Barrett’s esophagus; SD, standard deviation; SSBE, Short segment Barrett’s esophagus.
Fisher's exact test.
We further assessed the molecular features according to FOXP3+/CD8+ ratio status in Table 2. Among diffuse‐type, pStage I–III cases (N = 57, Table 2), there was a trend toward an increased Ki‐67 index observed in tumors with a high FOXP3+/CD8+ ratio; albeit this was not significant (p = 0.052). Among the 11 CpG island promoter regions, CDH1 and RUNX3 are known as key initiators of the diffuse histological subtype of gastric adenocarcinoma. 31 , 32 However, there was no significant difference in CDH1 methylation, regardless of location. In contrast, RUNX3 was significantly methylated in tumors with a high FOXP3+/CD8+ ratio at the invasive margin than in tumors with a low ratio (71% vs. 36% at the invasive margin, p = 0.010, Table 2). Simultaneously, RUNX3‐methylated tumors exhibited significantly higher FOXP3+/CD8+ ratio than unmethylated tumors (p = 0.027, Figure S4C).
TABLE 2.
Molecular characteristic of the diffuse histological subtype of esophagogastric junction adenocarcinoma according to intratumoral or invasive‐margin FOXP3+/CD8+ ratio status (pStage I–III).
| Molecular features | Invasive margin FOXP3+/CD8+ ratio | Intratumoral FOXP3+/CD8+ ratio | ||||||
|---|---|---|---|---|---|---|---|---|
| Total no. | High (N = 24) | Low (N = 33) | p | Total no. | High (N = 23) | Low (N = 34) | p | |
| Ki‐67 index | 0.052 | 0.26 | ||||||
| 0%–9% | 3 (5%) | 0 | 3 (9%) | 3 (5%) | 0 | 3 (9%) | ||
| 10%–29% | 10 (18%) | 3 (13%) | 7 (21%) | 10 (18%) | 3 (13%) | 7 (21%) | ||
| 30%–49% | 15 (26%) | 5 (22%) | 10 (31%) | 15 (26%) | 5 (22%) | 10 (28%) | ||
| 50%–79% | 21 (37%) | 14 (58%) | 7 (21%) | 21 (37%) | 12 (52%) | 9 (27%) | ||
| 80%–100% | 8 (14%) | 2 (8%) | 6 (18%) | 8 (14%) | 3 (13%) | 5 (15%) | ||
| HER2 overexpression (IHC ≥ 3+ and 10%) | ||||||||
| Absent | 48 (100%) | 23 (100%) | 25 (100%) | 48 (100%) | 21 (100%) | 27 (100%) | ||
| Present | 0 | 0 | 0 | 0 | 0 | 0 | ||
| TP53 mutation | 0.90 | 0.56 | ||||||
| Mutation | 34 (62%) | 14 (61%) | 20 (62%) | 34 (62%) | 14 (67%) | 20 (59%) | ||
| WT | 21 (38%) | 9 (39%) | 12 (38%) | 21 (38%) | 7 (33%) | 14 (41%) | ||
| LINE‐1 methylation level (mean ± SD) | 67.3 ± 8.2 | 66.4 ± 8.4 | 67.9 ± 8.2 | 0.44 | 67.3 ± 8.2 | 66.1 ± 8.5 | 68.1 ± 8.1 | 0.32 |
| PD‐L1 tumor proportion score ≥ 1 | 0.99 a | 0.99 a | ||||||
| Absent | 56 (98%) | 24 (100%) | 32 (97%) | 56 (98%) | 23 (100%) | 33 (97%) | ||
| Present | 1 (2%) | 0 | 1 (3%) | 1 (2%) | 0 | 1 (3%) | ||
| MLH1 methylation | 0.99 a | 0.56 a | ||||||
| Absent | 54 (95%) | 23 (96%) | 31 (94%) | 54 (95%) | 21 (91%) | 33 (97%) | ||
| Present | 3 (5%) | 1 (4%) | 2 (6%) | 3 (5%) | 2 (9%) | 1 (3%) | ||
| CDKN2A methylation | 0.28 | 0.21 | ||||||
| Absent | 40 (70%) | 15 (62%) | 25 (76%) | 40 (70%) | 14 (61%) | 26 (76%) | ||
| Present | 17 (30%) | 9 (38%) | 8 (24%) | 17 (30%) | 9 (39%) | 8 (24%) | ||
| MGMT methylation | 0.059 a | 0.25 a | ||||||
| Absent | 49 (86%) | 18 (75%) | 31 (94%) | 49 (86%) | 18 (78%) | 31 (91%) | ||
| Present | 8 (14%) | 6 (25%) | 2 (6%) | 8 (14%) | 5 (22%) | 3 (9%) | ||
| CHFR methylation | 0.14 | 0.21 | ||||||
| Absent | 34 (60%) | 17 (71%) | 17 (51%) | 34 (60%) | 16 (70%) | 18 (53%) | ||
| Present | 23 (40%) | 7 (29%) | 16 (49%) | 23 (40%) | 7 (30%) | 16 (47%) | ||
| CDH1 methylation | 0.74 a | 0.99 a | ||||||
| Absent | 36 (75%) | 18 (78%) | 18 (72%) | 36 (75%) | 16 (76%) | 20 (74%) | ||
| Present | 12 (25%) | 5 (22%) | 7 (28%) | 12 (25%) | 5 (24%) | 7 (26%) | ||
| IGF2 methylation | 0.47 | 0.34 | ||||||
| Absent | 34 (60%) | 13 (54%) | 21 (64%) | 34 (60%) | 12 (52%) | 22 (65%) | ||
| Present | 23 (40%) | 11 (46%) | 12 (36%) | 23 (40%) | 11 (48%) | 12 (35%) | ||
| RUNX3 methylation | 0.010 | 0.075 | ||||||
| Absent | 28 (49%) | 7 (29%) | 21 (64%) | 28 (49%) | 8 (35%) | 20 (59%) | ||
| Present | 29 (51%) | 17 (71%) | 12 (36%) | 29 (51%) | 15 (65%) | 14 (41%) | ||
| CRABP1 methylation | 0.42 | 0.97 | ||||||
| Absent | 20 (35%) | 7 (29%) | 13 (39%) | 20 (35%) | 8 (35%) | 12 (35%) | ||
| Present | 37 (65%) | 17 (71%) | 20 (61%) | 37 (65%) | 15 (65%) | 22 (65%) | ||
| NEUROG1 methylation | 0.55 | 0.71 | ||||||
| Absent | 24 (42%) | 9 (38%) | 15 (46%) | 24 (42%) | 9 (39%) | 15 (44%) | ||
| Present | 33 (58%) | 15 (62%) | 18 (54%) | 33 (58%) | 14 (61%) | 19 (56%) | ||
| CACNA1G methylation | 0.62 | 0.61 | ||||||
| Absent | 40 (70%) | 16 (67%) | 24 (73%) | 40 (70%) | 17 (74%) | 23 (68%) | ||
| Present | 17 (30%) | 8 (33%) | 9 (27%) | 17 (30%) | 6 (26%) | 11 (32%) | ||
| SOCS1 methylation | 0.45 a | 0.99 a | ||||||
| Absent | 49 (86%) | 22 (92%) | 27 (82%) | 49 (86%) | 20 (87%) | 29 (85%) | ||
| Present | 8 (14%) | 2 (8%) | 6 (18%) | 8 (14%) | 3 (13%) | 5 (15%) | ||
Note: (%) indicates the proportion of cases with a specific molecular feature among each FOXP3+/CD8+ ratio status group.
Abbreviation: SD, standard deviation.
Fisher's exact test.
In gastric adenocarcinoma, epigenetic loss of RUNX3 is a known mediator of tumor initiation to diffuse histology through dysregulation of TGF‐β and Wnt signaling. 32 , 33 , 34 Therefore, we assessed survival rates according to RUNX3 methylation status in pStage I–III patients with diffuse histological subtype. The survival impact of a high FOXP3+/CD8+ ratio was evident in RUNX3‐methylated diffuse histological subtype over RUNX3‐unmethylated cases (Figure 3G,H).
At the intratumoral region, there were no significant differences in the clinicopathological or molecular features between the high‐ and low‐FOXP3+/CD8+ ratio groups (Tables 1 and 2 for pStage I–III, and Tables S2 and S3 for pStage I–IV).
4. DISCUSSION
Here, we show the differential prognostic impact of the FOXP3+/CD8+ ratio at the invasive margin but not at the intratumoral region of non‐EBV/non‐MSI‐high EGJ adenocarcinoma. Specifically, a high FOXP3+/CD8+ ratio at the invasive margin was significantly associated with EGJ cancer‐specific prognosis in the diffuse histological subtype of pStage I–III EGJ adenocarcinoma. This trend was also evident in the RUNX3‐methylated diffuse histological subtype and may be linked with CCL28‐mediated attraction of Tregs, as supported by TCGA gastric tumor multiomics data.
Previous studies have examined the survival impact of FOXP3+/CD8+ ratios in gastric adenocarcinoma, which shares some histological and molecular characteristics with EGJ adenocarcinoma. However, there has been no study to date that specifically examines the specific relevance of the location of the cells at either the intratumoral region or the invasive margin. 35 , 36 , 37 Shen et al. reported a high FOXP3+/CD8+ ratio at the intratumoral region as being an independent predictor for worse prognosis among patients with resectable gastric cancer, which contradicts our findings. 35 However, this difference may be due to differences in laboratory methods, as not only was a definition of the invasive margin not specified but IHC staining was performed using tissue microarray (TMA) for only 133 patients with gastric cancer. TMA is composed of small tissue cores from different donors, and may not be representative of the whole tumor microenvironment. Other studies investigated only the intratumoral FOXP3+/CD8+ ratio in gastric cancer without specifying whether this included the invasive margin area. 36 , 37 The recently proposed guidelines for the assessment of TILs recommends evaluations of the tumor microenvironment to be carried out at the invasive margin and at intratumoral regions, discretely. 26 , 27 In such cases, careful microscopic observations are required when drawing the tumor border, particularly for diffuse histotypes where tumor cells are often scattered at the invasive front. Thus, we surmise that the FOXP3+/CD8+ ratio at the invasive margin might not have been assessed adequately in previous reports. In the present study, the tumor border was defined according to the guidelines using CK staining on serial sections of the largest central cut of the entire tumor, and the FOXP3+/CD8+ ratio was measured at three lymphocyte‐rich hotspots of the invasive margin and intratumoral region, discretely, on digitally captured, whole‐slide images.
In this study, the patients with high a FOXP3+/CD8+ ratio at the invasive margin less frequently received adjuvant chemotherapy, and this might have worsened their survival. However, it was unlikely to affect our rationale due to the following two reasons: Firstly, the presence or absence of adjuvant chemotherapy has already been adjusted in the multivariate interaction survival analysis (Figure 3F). Secondly, the subgroup survival analysis limiting the patients with adjuvant chemotherapy showed that high‐FOXP3+/CD8+ diffuse histological cases still experienced worse outcome than low‐ratio cases. Based on this observation, a high‐FOXP3+/CD8+ diffuse‐histotype tumor may be less sensitive to the conventional adjuvant chemotherapy using S‐1. Further study would be necessary to discover an effective adjuvant chemotherapy for those patients.
Based on the significant association between the high FOXP3+/CD8+ ratio and RUNX3 methylation, we hypothesized a role for chemokines in the attraction of Tregs, which, in turn, could influence the high FOXP3+/CD8+ ratio at the tumor microenvironment of RUNX3‐methylated diffuse histological tumors. To this end, we explored multiomics GEA data from TCGA. 2 Limiting the cases to those resembling our patients (i.e., cases with non‐EBV/non‐MSI‐high tumors with diffuse histology in pStage I–III), transcriptional data for 51 patients were available. Z‐scores were used for the level of gene expression. We searched for elevated chemokine gene expression with decreased RUNX3 expression (i.e., negatively associated) because RUNX3 expression should be suppressed in the RUNX3‐methlyated diffuse histological subtype. Overall, six chemokines were negatively associated with RUNX3 expression—CCL28, CXCL6, CXCL17, CXCL3, CXCL2, and CXCL8 (Figure 4A)—of which CCL28 was the only one significantly associated with a negative expression of RUNX3 (p = 0.0046). Thus, the FOXP3+/CD8+ ratio may have increased via an increased CCL28 production in the tumor microenvironment of the RUNX3‐methylated diffuse histological subtype of EGJ adenocarcinoma (Figure 4B); this hypothesis is supported by earlier studies showing CCL28 upregulation in RUNX3‐knock‐down oral squamous cell carcinoma cell lines and Treg attraction by CCL28 in the tumor microenvironment of a mouse gastric cancer model. 38 , 39 We observed that diffuse‐histotype tumor cells with RUNX3 methylation expressed CCL28 on conventional IHC staining (Figure 4C and Figure S5A–C), attracting FOXP3+ cells at the invasive margin on multiplex fluorescent IHC staining (Figure 4C). In contrast, RUNX3‐unmethylated tumor cells expressed only minimal CCL28 (Figure 4D, and Figure S5D–F), resulting in less recruitment of FOXP3+ cells (Figure 4D). In addition, overall survival analyses were employed utilizing TCGA GEA cases which were available for transcriptional data of FOXP3 and CD8A gene expression. FOXP3 expression status was not associated with patient outcome; however, a significant survival difference was observed according to CD8A expression status (Figure S6A,B). Lower CD8A expression was significantly associated with worse outcome in the patients with diffuse‐histotype tumor (p = 0.0068), but not in those with intestinal subtype (Figure S6C,D). Due to the uncertainty of the region where the frozen tissue was obtained, this analysis is for reference only, and it is not possible to directly compare with our observations.
FIGURE 4.
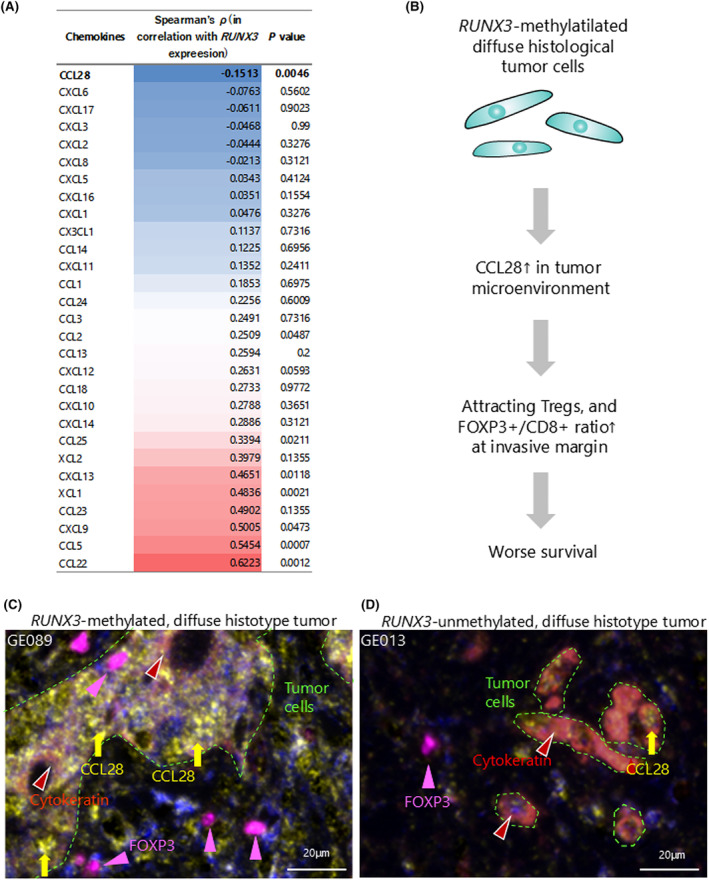
Chemokine analysis in RUNX3‐downregulated gastroesophageal adenocarcinoma with diffuse histological subtype of non‐EBV/non‐MSI‐high gastroesophageal adenocarcinoma in TCGA data, and multiplex fluorescence IHC staining in this study. (A) Chemokines are ranked in order of negative correlation with RUNX3 expression using TCGA multiomics data of diffuse histological subtype of non‐EBV/non‐MSI‐high gastroesophageal adenocarcinoma. (B) Schematic of the tumor microenvironment of RUNX3‐methylated (i.e., RUNX3‐downregulated) diffuse histological subtype of non‐EBV/non‐MSI‐high esophagogastric junction adenocarcinoma. (C) Multiplex fluorescence IHC staining for CCL28 (yellow arrows), cytokeratin (brown arrow heads), and FOXP3 (pink arrow heads) in a RUNX3‐methylated diffuse‐histotype case. Tumor cells are surrounded by green dotted lines. (D) Multiplex fluorescence IHC staining for CCL28 (yellow arrows), cytokeratin (brown arrow heads), and FOXP3 (pink arrow heads) in a RUNX3‐unmethylated diffuse‐histotype case. Tumor cells are surrounded by green dotted lines. CCL28, CC chemokine ligand 28; EBV, Epstein–Barr virus; FOXP3, forkhead box protein 3; IHC, immunohistochemical; MSI, microsatellite instability; TCGA, The Cancer Genome Atlas.
The high FOXP3+/CD8+ ratio at the invasive margin was significantly associated with worse survival in patients with the diffuse histotype, particularly those with RUNX3‐methylated tumors in EGJ adenocarcinoma. RUNX3 is a major growth regulator of gastric epithelial cells, and the epigenetic loss of RUNX3 causes spontaneous epithelial–mesenchymal transition (EMT) by dysregulating TGF‐β and Wnt signaling, resulting in a mesenchymal‐like population of cells known as a diffuse histological tumor. 32 , 33 , 34 In this study, RUNX3 methylation was observed in 51% of diffuse histological EGJ adenocarcinoma, and even more frequently observed (71%) in tumors exhibiting a high FOXP3+/CD8+ ratio at the invasive margin.
In addition, the epigenetic loss of RUNX3 was linked to CCL28 in the multiomics data from TCGA GEA. Consistently, CCL28 expression is upregulated in RUNX3‐knockdown oral squamous cell carcinoma cell lines 38 and, in gastric adenocarcinoma, is reported to recruit Tregs and cause a subsequent decrease in CD8+ T cells, resulting in tumor progression through β‐catenin activation. 39 We suggest that CCL28 production might be a key chemokine linked with the high FOXP3+/CD8+ ratio at the invasive margin of RUNX3‐methylated diffuse histological EGJ adenocarcinoma and, thus, the unfavorable outcomes for patients with these tumors. Hence, suppressing Tregs, such as via the use of cytotoxic T lymphocyte protein 4 (CTLA‐4) inhibitors, may be an effective treatment option for patients with high ratios. CTLA‐4 is constitutively expressed on Tregs and an essential molecule for activating Tregs to suppress the immune response. 40 , 41 , 42 Ipilimumab, a monoclonal antibody against CTLA‐4, is already available in current clinical practice. A phase II study (CheckMate‐032) is presently examining the benefits of ipilimumab plus nivolumab for advanced gastric or EGJ adenocarcinoma as compared with nivolumab alone, and has already shown significantly improved overall survival; albeit a subgroup survival analysis according to histology has not been included in the study. 43 Further basic experimental or clinical studies would be necessary to examine whether such a treatment strategy to suppress Tregs is effective against RUNX3‐methylated diffuse histological GEA.
One limitation of this study was that we only evaluated three hot spots to calculate the FOXP3+/CD8+ ratios at the invasive margin and the intratumoral region instead of examining the whole slide. While providing less data, this method is quicker based on the digitally captured slide and image software and therefore more useful in clinical practice. Another limitation is the absence of a comprehensive genetic analysis through next‐generation sequencing. Restricted by the paucity of fresh‐frozen tissues, we were unable to perform bisulfite sequencing or immune signature analysis. Nevertheless, transcriptional data of 29 types of chemokines derived from a similar population to our study provided a sufficient method for isolating a candidate for assessment. The key molecular and immunological factors linked to gastroesophageal cancer were analyzed using chemo‐naïve FFPE tissue samples. These samples were taken from serial sections adjacent to those used for IHC staining. This approach allowed for a detailed examination of the tumor’s biological and immune characteristics before any chemotherapy treatment. Newer technology with transcriptomics is expected to provide us with a better understanding of the tumor immune microenvironment and can inform the current analysis.
In conclusion, using data from over 300 chemo‐naïve EGJ adenocarcinoma cases, this study linked high a FOXP3+/CD8+ ratio with poor prognosis in diffuse‐histotype EGJ adenocarcinoma, particularly among RUNX3‐methylated tumors. CCL28 might be associated with the high FOXP3+/CD8+ ratio in these tumor immune microenvironments and point to targeting Tregs as a beneficial treatment for diffuse‐histotype EGJ adenocarcinoma.
AUTHOR CONTRIBUTIONS
Suguru Maruyama: Writing – original draft. Yu Imamura: Conceptualization; funding acquisition; project administration; writing – review and editing. Tasuku Toihata: Formal analysis; methodology. Ikumi Haraguchi: Data curation; investigation; methodology. Manabu Takamatsu: Supervision. Makiko Yamashita: Methodology. Yuichiro Nakashima: Resources. Eiji Oki: Resources. Kenichi Taguchi: Resources. Manabu Yamamoto: Resources. Shinji Mine: Resources. Akihiko Okamura: Resources. Jun Kanamori: Resources. Souya Nunobe: Resources. Takeshi Sano: Resources. Shigehisa Kitano: Methodology. Tetsuo Noda: Conceptualization; supervision. Masayuki Watanabe: Funding acquisition; project administration; resources.
FUNDING INFORMATION
Funding for Promotion of Cancer Research; Japan Research Foundation for Clinical Pharmacology; The Uehara Memorial Foundation; Japan Society for the Promotion of Science, Grant/Award Numbers: JP19K09161, JP19K09231, JP20K09046, JP24K11921.
CONFLICT OF INTEREST STATEMENT
S. Kitano received research fund, remuneration as an advisor, and lecture fee from Astra Zeneca, Chugai, Eisai, GSK, MSD, and Pfizer; research fund and remuneration as an advisor from Nippon Boehringer Ingelheim; research fund and lecture fee from Daiichi‐Sankyo, Merk KGaA, Ono Pharmaceutical Co., Ltd. and Takeda; research fund from Astellas, Eli Lilly/LOXO Oncology, Incyte, and Takara Bio Inc.; remuneration as an advisor from ImmuniT Research Inc., Rakuten Medical, Sumitomo Pharma, and United Immunity; and lecture fee from Bristol‐Myers Squibb, Novartis, and Taiho.
ETHICS STATEMENT
Approval of the research protocol by an institutional review board: Our study protocol was approved by the human ethics review committee in each hospital (institutional review board numbers: 2015‐1107 for Cancer Institute Hospital, 858 for Kumamoto University Hospital, 820‐00 for Kyushu University Hospital and 2015‐26 and 2020‐6 for Kyushu Cancer Center).
Informed Consent: Written informed consent was obtained from all patients before specimen collection.
Registry and the Registration No. of the study/trial: N/A.
Animal studies: N/A.
Supporting information
Table S1. Clinicopathological characteristics of all cases enrolled in this study (N = 303).
Table S2. Clinicopathological characteristics of the diffuse histological subtype of esophagogastric junction adenocarcinoma according to intratumoral or invasive‐margin FOXP3+/CD8+ ratio status (pStage I–IV).
Table S3. Molecular characteristics of the diffuse histological subtype of esophagogastric junction adenocarcinoma according to intratumoral or invasive‐margin FOXP3+/CD8+ ratio status (pStage I–IV).
Figure S1. Patient flow chart of this study.
Figure S2. FOXP3+ and CD8+ T cell counts at the intratumoral region and invasive margin according to tumor histotypes.
Figure S3. Esophagogastric junction cancer‐specific survival according to intratumoral FOXP3+/CD8+ ratio status, stratified by histological subtypes and pathological stage.
Figure S4. Esophagogastric junction cancer‐specific survival according to FOXP3+/CD8+ ratio at the invasive margin.
Figure S5. Immunohistochemical staining for CCL28, cytokeratin, and FOXP3 in the selected diffuse‐histotype cases in this study.
Figure S6. Overall survival according to FOXP3 and CD8A gene expression, stratified by histological subtypes, in TCGA gastroesophageal adenocarcinoma cases which were available for those transcriptional data.
ACKNOWLEDGMENTS
We would like to express our sincere appreciation for data acquisition and sample preparation to Yoko Ogata (Kumamoto University), Yuko Kubota (Kyushu University), and Motoyoshi Iwakoshi (Cancer Institute Hospital).
Maruyama S, Imamura Y, Toihata T, et al. FOXP3+/CD8+ ratio associated with aggressive behavior in RUNX3 ‐methylated diffuse esophagogastric junction tumor. Cancer Sci. 2025;116:178‐191. doi: 10.1111/cas.16373
Suguru Maruyama and Yu Imamura contributed equally to this work.
REFERENCES
- 1. Network TCGAR . Comprehensive molecular characterization of gastric adenocarcinoma. Nature. 2014;513:202‐209. [DOI] [PMC free article] [PubMed] [Google Scholar]
- 2. The‐Cancer‐Genome‐Atlas‐Research‐Network . Integrated genomic characterization of oesophageal carcinoma. Nature. 2017;541:169‐175. [DOI] [PMC free article] [PubMed] [Google Scholar]
- 3. Setia N, Agoston AT, Han HS, et al. A protein and mRNA expression‐based classification of gastric cancer. Mod Pathol. 2016;29:772‐784. [DOI] [PubMed] [Google Scholar]
- 4. Ahn S, Lee SJ, Kim Y, et al. High‐throughput protein and mRNA expression‐based classification of gastric cancers can identify clinically distinct subtypes, concordant with recent molecular classifications. Am J Surg Pathol. 2017;41:106‐115. [DOI] [PubMed] [Google Scholar]
- 5. Shitara K, Özgüroğlu M, Bang YJ, et al. Pembrolizumab versus paclitaxel for previously treated, advanced gastric or gastro‐oesophageal junction cancer (KEYNOTE‐061): a randomised, open‐label, controlled, phase 3 trial. Lancet. 2018;392:123‐133. [DOI] [PubMed] [Google Scholar]
- 6. Kim ST, Cristescu R, Bass AJ, et al. Comprehensive molecular characterization of clinical responses to PD‐1 inhibition in metastatic gastric cancer. Nat Med. 2018;24:1449‐1458. [DOI] [PubMed] [Google Scholar]
- 7. Kwak Y, Seo AN, Lee HE, Lee HS. Tumor immune response and immunotherapy in gastric cancer. J Pathol Transl Med. 2020;54:20‐33. [DOI] [PMC free article] [PubMed] [Google Scholar]
- 8. Dong H, Strome SE, Salomao DR, et al. Tumor‐associated B7‐H1 promotes T‐cell apoptosis: a potential mechanism of immune evasion. Nat Med. 2002;8:793‐800. [DOI] [PubMed] [Google Scholar]
- 9. Kang YK, Boku N, Satoh T, et al. Nivolumab in patients with advanced gastric or gastro‐oesophageal junction cancer refractory to, or intolerant of, at least two previous chemotherapy regimens (ONO‐4538‐12, ATTRACTION‐2): a randomised, double‐blind, placebo‐controlled, phase 3 trial. Lancet. 2017;390:2461‐2471. [DOI] [PubMed] [Google Scholar]
- 10. Lauren P. The two histological main types of gastric carcinoma: diffuse and so‐called intestinal‐type carcinoma. An attempt at a histo‐clinical classification. Acta Pathol Microbiol Scand. 1965;64:31‐49. [DOI] [PubMed] [Google Scholar]
- 11. Hohenberger P, Gretschel S. Gastric cancer. Lancet. 2003;362:305‐315. [DOI] [PubMed] [Google Scholar]
- 12. Taghavi S, Jayarajan SN, Davey A, Willis AI. Prognostic significance of signet ring gastric cancer. J Clin Oncol. 2012;30:3493‐3498. [DOI] [PMC free article] [PubMed] [Google Scholar]
- 13. Kalia V, Sarkar S, Subramaniam S, Haining WN, Smith KA, Ahmed R. Prolonged interleukin‐2Ralpha expression on virus‐specific CD8+ T cells favors terminal‐effector differentiation in vivo. Immunity. 2010;32:91‐103. [DOI] [PubMed] [Google Scholar]
- 14. Pipkin ME, Sacks JA, Cruz‐Guilloty F, Lichtenheld MG, Bevan MJ, Rao A. Interleukin‐2 and inflammation induce distinct transcriptional programs that promote the differentiation of effector cytolytic T cells. Immunity. 2010;32:79‐90. [DOI] [PMC free article] [PubMed] [Google Scholar]
- 15. Reiser J, Banerjee A. Effector, memory, and dysfunctional CD8(+) T cell fates in the antitumor immune response. J Immunol Res. 2016;2016:8941260. [DOI] [PMC free article] [PubMed] [Google Scholar]
- 16. Gooden MJ, de Bock GH, Leffers N, Daemen T, Nijman HW. The prognostic influence of tumour‐infiltrating lymphocytes in cancer: a systematic review with meta‐analysis. Br J Cancer. 2011;105:93‐103. [DOI] [PMC free article] [PubMed] [Google Scholar]
- 17. Salama P, Phillips M, Grieu F, et al. Tumor‐infiltrating FOXP3+ T regulatory cells show strong prognostic significance in colorectal cancer. J Clin Oncol. 2009;27:186‐192. [DOI] [PubMed] [Google Scholar]
- 18. Mougiakakos D, Johansson CC, Trocme E, et al. Intratumoral forkhead box P3‐positive regulatory T cells predict poor survival in cyclooxygenase‐2‐positive uveal melanoma. Cancer. 2010;116:2224‐2233. [DOI] [PubMed] [Google Scholar]
- 19. Curiel TJ, Coukos G, Zou L, et al. Specific recruitment of regulatory T cells in ovarian carcinoma fosters immune privilege and predicts reduced survival. Nat Med. 2004;10:942‐949. [DOI] [PubMed] [Google Scholar]
- 20. Bates GJ, Fox SB, Han C, et al. Quantification of regulatory T cells enables the identification of high‐risk breast cancer patients and those at risk of late relapse. J Clin Oncol. 2006;24:5373‐5380. [DOI] [PubMed] [Google Scholar]
- 21. Sato E, Olson SH, Ahn J, et al. Intraepithelial CD8+ tumor‐infiltrating lymphocytes and a high CD8+/regulatory T cell ratio are associated with favorable prognosis in ovarian cancer. Proc Natl Acad Sci USA. 2005;102:18538‐18543. [DOI] [PMC free article] [PubMed] [Google Scholar]
- 22. Crosby EJ, Hobeika AC, Niedzwiecki D, et al. Long‐term survival of patients with stage III colon cancer treated with VRP‐CEA(6D), an alphavirus vector that increases the CD8+ effector memory T cell to Treg ratio. J Immunother Cancer. 2020;8:e001662. [DOI] [PMC free article] [PubMed] [Google Scholar]
- 23. Siewert JR, Stein HJ. Classification of adenocarcinoma of the oesophagogastric junction. Br J Surg. 1998;85:1457‐1459. [DOI] [PubMed] [Google Scholar]
- 24. Sobin LH, Compton CC. TNM seventh edition: what's new, what's changed: communication from the International Union against Cancer and the American Joint Committee on Cancer. Cancer. 2010;116:5336‐5339. [DOI] [PubMed] [Google Scholar]
- 25. Imamura Y, Toihata T, Haraguchi I, et al. Immunogenic characteristics of microsatellite instability‐low esophagogastric junction adenocarcinoma based on clinicopathological, molecular, immunological and survival analyses. Int J Cancer. 2021;148:1260‐1275. [DOI] [PubMed] [Google Scholar]
- 26. Hendry S, Salgado R, Gevaert T, et al. Assessing tumor‐infiltrating lymphocytes in solid tumors: a practical review for pathologists and proposal for a standardized method from the International Immunooncology Biomarkers Working Group: part 1: assessing the host immune response, TILs in invasive breast carcinoma and ductal carcinoma in situ, metastatic tumor deposits and areas for further research. Adv Anat Pathol. 2017;24:235‐251. [DOI] [PMC free article] [PubMed] [Google Scholar]
- 27. Hendry S, Salgado R, Gevaert T, et al. Assessing tumor‐infiltrating lymphocytes in solid tumors: a practical review for pathologists and proposal for a standardized method from the International Immuno‐Oncology Biomarkers working group: part 2: TILs in melanoma, gastrointestinal tract carcinomas, non‐small cell lung carcinoma and mesothelioma, endometrial and ovarian carcinomas, squamous cell carcinoma of the head and neck, genitourinary carcinomas, and primary brain tumors. Adv Anat Pathol. 2017;24:311‐335. [DOI] [PMC free article] [PubMed] [Google Scholar]
- 28. Mountzios G, Remon J, Novello S, et al. Position of an international panel of lung cancer experts on the decision for expansion of approval for pembrolizumab in advanced non‐small‐cell lung cancer with a PD‐L1 expression level of >/=1% by the USA Food and Drug Administration. Ann Oncol. 2019;30:1686‐1688. [DOI] [PubMed] [Google Scholar]
- 29. Ikarashi D, Kitano S, Tsuyukubo T, et al. Pretreatment tumour immune microenvironment predicts clinical response and prognosis of muscle‐invasive bladder cancer in the neoadjuvant chemotherapy setting. Br J Cancer. 2022;126:606‐614. [DOI] [PMC free article] [PubMed] [Google Scholar]
- 30. Ogino S, Kawasaki T, Brahmandam M, et al. Precision and performance characteristics of bisulfite conversion and real‐time PCR (MethyLight) for quantitative DNA methylation analysis. J Mol Diagn. 2006;8:209‐217. [DOI] [PMC free article] [PubMed] [Google Scholar]
- 31. Guilford P, Humar B, Blair V. Hereditary diffuse gastric cancer: translation of CDH1 germline mutations into clinical practice. Gastric Cancer. 2010;13:1‐10. [DOI] [PubMed] [Google Scholar]
- 32. Li QL, Ito K, Sakakura C, et al. Causal relationship between the loss of RUNX3 expression and gastric cancer. Cell. 2002;109:113‐124. [DOI] [PubMed] [Google Scholar]
- 33. Ito K, Chuang LS, Ito T, et al. Loss of Runx3 is a key event in inducing precancerous state of the stomach. Gastroenterology. 2011;140:1536‐1546.e1538. [DOI] [PubMed] [Google Scholar]
- 34. Voon DC, Wang H, Koo JK, et al. Runx3 protects gastric epithelial cells against epithelial‐mesenchymal transition‐induced cellular plasticity and tumorigenicity. Stem Cells. 2012;30:2088‐2099. [DOI] [PubMed] [Google Scholar]
- 35. Shen Z, Zhou S, Wang Y, et al. Higher intratumoral infiltrated Foxp3+ Treg numbers and Foxp3+/CD8+ ratio are associated with adverse prognosis in resectable gastric cancer. J Cancer Res Clin Oncol. 2010;136:1585‐1595. [DOI] [PMC free article] [PubMed] [Google Scholar]
- 36. Kim KJ, Lee KS, Cho HJ, et al. Prognostic implications of tumor‐infiltrating FoxP3+ regulatory T cells and CD8+ cytotoxic T cells in microsatellite‐unstable gastric cancers. Hum Pathol. 2014;45:285‐293. [DOI] [PubMed] [Google Scholar]
- 37. Ying L, Yan F, Meng Q, et al. PD‐L1 expression is a prognostic factor in subgroups of gastric cancer patients stratified according to their levels of CD8 and FOXP3 immune markers. Onco Targets Ther. 2018;7:e1433520. [DOI] [PMC free article] [PubMed] [Google Scholar]
- 38. Park J, Zhang X, Lee SK, et al. CCL28‐induced RARbeta expression inhibits oral squamous cell carcinoma bone invasion. J Clin Invest. 2019;129:5381‐5399. [DOI] [PMC free article] [PubMed] [Google Scholar]
- 39. Ji L, Qian W, Gui L, et al. Blockade of beta‐catenin‐induced CCL28 suppresses gastric cancer progression via inhibition of Treg cell infiltration. Cancer Res. 2020;80:2004‐2016. [DOI] [PubMed] [Google Scholar]
- 40. Wing K, Onishi Y, Prieto‐Martin P, et al. CTLA‐4 control over Foxp3+ regulatory T cell function. Science. 2008;322:271‐275. [DOI] [PubMed] [Google Scholar]
- 41. Takahashi T, Tagami T, Yamazaki S, et al. Immunologic self‐tolerance maintained by CD25(+)CD4(+) regulatory T cells constitutively expressing cytotoxic T lymphocyte‐associated antigen 4. J Exp Med. 2000;192:303‐310. [DOI] [PMC free article] [PubMed] [Google Scholar]
- 42. Kono K, Nakajima S, Mimura K. Current status of immune checkpoint inhibitors for gastric cancer. Gastric Cancer. 2020;23:565‐578. [DOI] [PubMed] [Google Scholar]
- 43. Janjigian YY, Bendell J, Calvo E, et al. CheckMate‐032 study: efficacy and safety of nivolumab and nivolumab plus ipilimumab in patients with metastatic esophagogastric cancer. J Clin Oncol. 2018;36:2836‐2844. [DOI] [PMC free article] [PubMed] [Google Scholar]
Associated Data
This section collects any data citations, data availability statements, or supplementary materials included in this article.
Supplementary Materials
Table S1. Clinicopathological characteristics of all cases enrolled in this study (N = 303).
Table S2. Clinicopathological characteristics of the diffuse histological subtype of esophagogastric junction adenocarcinoma according to intratumoral or invasive‐margin FOXP3+/CD8+ ratio status (pStage I–IV).
Table S3. Molecular characteristics of the diffuse histological subtype of esophagogastric junction adenocarcinoma according to intratumoral or invasive‐margin FOXP3+/CD8+ ratio status (pStage I–IV).
Figure S1. Patient flow chart of this study.
Figure S2. FOXP3+ and CD8+ T cell counts at the intratumoral region and invasive margin according to tumor histotypes.
Figure S3. Esophagogastric junction cancer‐specific survival according to intratumoral FOXP3+/CD8+ ratio status, stratified by histological subtypes and pathological stage.
Figure S4. Esophagogastric junction cancer‐specific survival according to FOXP3+/CD8+ ratio at the invasive margin.
Figure S5. Immunohistochemical staining for CCL28, cytokeratin, and FOXP3 in the selected diffuse‐histotype cases in this study.
Figure S6. Overall survival according to FOXP3 and CD8A gene expression, stratified by histological subtypes, in TCGA gastroesophageal adenocarcinoma cases which were available for those transcriptional data.