Abstract
Background
We assessed the efficacy of four plasma phospho‐tau217 (p‐tau217) biomarkers in a head‐to‐head comparison, and against two clinically available CSF biomarkers for Alzheimer’s disease (AD).
Method
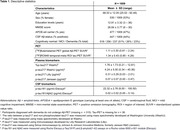
Samples were analyzed from 1009 individuals from the Swedish BioFINDER‐2 cohort (Table 1). We included the following biomarkers: %p‐tau217WashU, p‐tau217WashU (both mass‐spectrometry), p‐tau217Lilly, p‐tau217Janssen (both immunoassays), CSF p‐tau181 and p‐tau181/Aβ42 (Elecsys). Biomarker correlations were assessed using linear regression models. Their discriminative accuracy for global Aβ‐ and temporal meta‐ROI tau‐PET status was evaluated with receiver operating characteristic (ROC) curves. Area under the curve (AUC) values from two ROC curves were compared with DeLong tests. Linear regression models with continuous Aβ‐ and tau‐PET measures were performed. Participants were grouped into PET‐positive quartiles, which were compared with t‐tests. Effect sizes (Cohen’s D (CD)) were calculated between PET‐positive/negative groups, and between neighboring quantiles.
Result
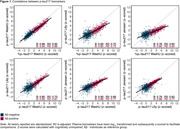
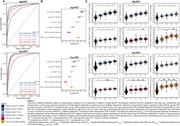
All plasma biomarkers were correlated (0.62≥Radj 2≥0.92, Figure 1). %p‐tau217WashU showed the significantly largest effect size for both Aβ‐PET status and tau‐PET status (CDAβ‐PET=1.635; CDTau‐PET=1.828) compared to the other biomarkers (all pFDR <0.05). p‐tau217Janssen had a lower plasma effect size (CDAβ‐PET=1.313; CDTau‐PET=1.590), but not significantly different from p‐tau217Lilly. Although all plasma biomarkers showed high AUCs (0.90‐0.95) for Aβ‐PET positivity, %p‐tau217WashU was the highest, performing significantly better than all other biomarkers including CSF p‐tau181/Aβ42Elecsys (all pFDR<0.01) (Figure 2A). A similar pattern was observed for tau‐PET where %p‐tau217WashU also performed significantly better than all other biomarkers except for p‐tau217WashU (all pFDR<0.01) (Figure 2A). With continuous PET measures, %p‐tau217WashU showed the highest Radj 2 compared to the other biomarkers for Aβ‐PET and tau‐PET (Figure 2B). In this context, all plasma ptau217 markers performed better that CSF ptau181Elecsys. Compared to CSF p‐tau181/Aβ42Elecsys, p‐tau217Lilly and p‐tau217WashU performed similarly whereas %p‐tau217WashU performed significantly better. Quantile grouping revealed that all biomarkers showed significant differences when distinguishing between negatives and early‐stage positives for both Aβ‐PET and tau‐PET, with %p‐tau217WashU consistently having the significantly largest effect size (Figure 2C). For tau‐PET, plasma biomarkers distinguished better between disease stages compared to CSF.
Conclusion
When predicting Aβ‐ and tau‐PET load, both mass‐spectrometry and immunoassay methods detecting plasma p‐tau217 perform similarly to an FDA‐approved CSF test, with %p‐tau217WashU performing even better.


