Abstract
We describe the design, synthesis and biophysical characterization of a novel DNA construct in which a folded quadruplex structure is joined to a standard double helix. Circular dichroism, gel electrophoresis, three-dimensional UV melting and differential scanning calorimetry were all used to characterize the structure. Rigorous molecular dynamics simulations were used to build a plausible atomic-level structural model of the DNA construct. This novel DNA construct provides a model for the duplex–quadruplex junction region at the end of chromosomal DNA and offers a system for the study of structure-selective ligand binding.
INTRODUCTION
DNA is polymorphic and adopts a variety of unique secondary and tertiary structures that may play functional roles in gene regulation (1–4). A long, single-stranded, guanine-rich overhang protruding from the genomic duplex characterizes telomere DNA at the ends of human chromosomes (5). The exact structure of this overhang and its junction with duplex DNA is not known (6). Here we describe the characterization of a simple model system (dubbed ‘tiny telomere DNA’) that spontaneously assembles to form a 12 bp duplex joined to a folded quadruplex structure comprised of the human telomere repeat sequence (5′-ATTGGG). This novel DNA construct provides a model for the duplex–quadruplex junction region at the end of chromosomal DNA, and a system for the study of structure-selective ligand binding.
Within the genome, regions of differing DNA structures may abut one another, forming junctions with unique structural and functional properties (2,3,7). Several examples follow. The junction between phased oligo-A tracts and standard B-form DNA is associated with functionally important DNA bending (8). A model B-Z junction between left- and right-handed DNA was found to exhibit unusual ligand binding properties (9). Binding of the TATA box binding protein to its binding site results in a DNA structural transition within the site to produce junctions that kink the DNA (10). Junctions between triplex and duplex regions show distinctive structures, with the transition from triplex to duplex causing partial unwinding of the DNA (11). Interestingly, intercalating ligands designed to bind at the triplex–duplex junction stabilize the triple-helical complex (12), indicating that the junction exerts long-range effects on the surrounding helical regions. We describe here a novel construct with a junction between duplex DNA and a folded quadruplex structure. This simple model system may capture elements of the DNA structure present within telomeres at the ends of chromosomes (6,13–16).
MATERIALS AND METHODS
DNA oligonucleotides
DNA oligonucleotides were purchased from Oligos Etc. (http://www.oligosetc.com) and were used without further purification. Molar extinction coefficients for the single-stranded oligonucleotides were calculated using the standard nearest neighbor method (17). BPES buffer (consisting of 6 mM Na2HPO4, 2 mM NaH2PO4, 1 mM Na2EDTA, 185 mM NaCl, pH 7.0) was used for all experiments.
Gel electrophoresis
Non-denaturing polyacrylamide gel electrophoresis experiments used standard protocols (18). Gels were stained with SyberGreen (Molecular Probes, Eugene, OR), and imaged using a Molecular Dynamics Storm 860 Imaging System (Sunnyvale, CA).
UV melting experiments
Ultraviolet DNA melting curves were determined using a Cary 3E UV/Visible Spectrophotometer (Varian Inc., Palo Alto, CA), equipped with a thermoelectric temperature controller. BPES buffer was used for melting studies. Samples were heated at a rate of 1°C min–1, while continuously monitoring the absorbance at 260 nm. Primary data were transferred to the graphics program Origin (Microcal Inc., Northampton, MA) for plotting and analysis. ‘3-D melting curves’ and their analysis by singular value decomposition (SVD) used the methods and protocols fully described by Haq et al. (19).
Differential scanning calorimetry (DSC)
DSC experiments were performed using a Calorimetric Sciences Inc. (Spanish Fork, UT) NanoDSC instrument. Sample concentrations for DSC studies were 189 µM (in strands). Scan rates of 1°C min–1 were used in all cases. Buffer versus buffer baseline scans were determined and subtracted from denaturation scans prior to normalization and analysis.
Molecular modeling studies
The starting models were based on the nuclear magnetic resonance (NMR) structure (20) of the human telomere sequence (22 nt folded quadruplex) I, with the initial placement of the B-form dT12:dA12 duplex at the 5′ end of the quartet region to form the II + dA12 construct. The orientation of the duplex region was obtained by a grid search (30° increment) of the A13α, A13β and T12ζ torsion angles of the junction phosphate region using the AMBER* force field and GB/SA implicit solvation within Macromodel (Version 7.0) (21). The lowest energy structure was converted to standard PDB file format using DNAsar (22) and used for the explicit solvation calculations. The starting model of the ‘dumbbell’, formed by dimerization of III, was generated based on the final structure of the II + dA12 construct. The model structures were hydrated by using standard AMBER 5.0 (23) rules in a 10 Å box of TIP3P waters that resulted in 3505, 6509 and 11 016 water molecules for I, II and III, respectively. Sodium cations were added using the Edit placement routine for charge neutrality of the phosphate groups. Four quadruplex stabilizing K+ ions were placed in the central ‘channel’ of the quartet stacks and four chlorine ions were added randomly for overall charge neutrality for each quadruplex region.
The explicit solvation modeling simulations were based on existing protocols (22). The initial partial equilibrium protocol involved minimizing the systems restraining the DNA [100 kcal (mol·Å)–1], molecular dynamics at 100 K (20 ps) with the DNA restrained [100 kcal (mol·Å)–1], further minimization restraining the DNA, with subsequent full minimization. The systems were then heated slowly to 300 K and equilibrated carefully during 100 ps with gradual decrease of restraints on the DNA from 100 to 1 kcal (mol·Å)–1. Molecular dynamics simulations using the parm98.fld force field were performed in the isothermal isobaric ensemble (P = 1 atmospheres, T = 300 K) with the sander module (23), using periodic boundary conditions and the particle mesh Ewald (PME) algorithm. A 2 fs time step was used with all bond distances involving hydrogen atoms frozen using SHAKE. After heating and equilibration, molecular dynamics production runs of 4 ns for the II + dA12 construct, and for the dimer of III, were used to derive average structures for the complexes taken from 25 snapshots accumulated in the last 50 ps with subsequent minimization of hydrogen atoms. The simulation of I involved a production run of 2 ns to check for reproduction of the NMR structure. Calculations were run on a 16 R12000 processor SGI Origin2000.
Fluorescence studies
Steady-state fluorescence measurements were recorded using an I.S.S. Greg 200 fluorometer (Champaign, IL). Excitation and emission spectra were recorded using 1 cm pathlength quartz cuvettes at 20°C. Hoechst 33258 was purchased from Aldrich Chemical Co. (Milwaukee, WI), and its concentration was determined by absorbance measurements at 338 nm assuming an extinction coefficient of 42 000 M–1 cm–1. N-methyl mesoporphyrin IX (NMM) was purchased from Porphyrin Products Inc. (Logan, UT), and its concentration was measured by absorbance at 379 nm assuming an extinction coefficient of 145 000 M–1 cm–1.
RESULTS
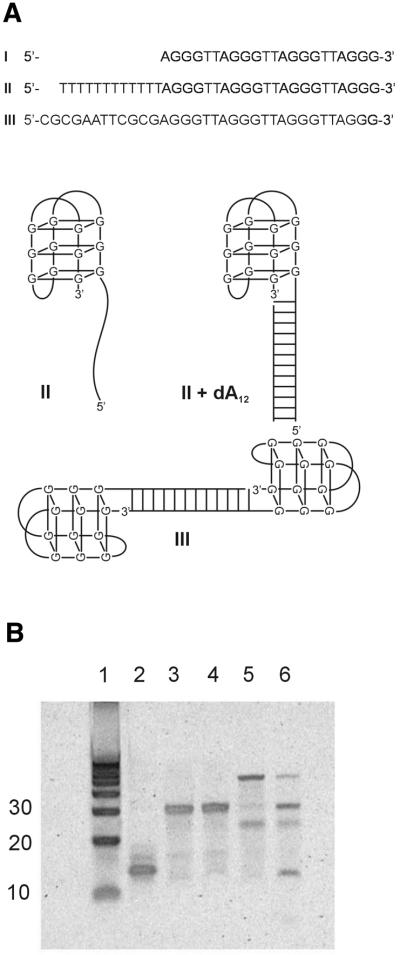
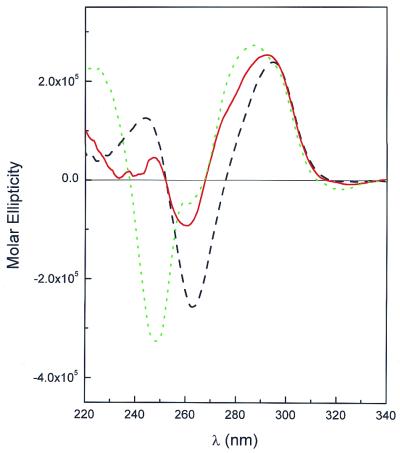
Oligonucleotide I (Fig. 1A) is a 22 nt sequence that spontaneously folds into an antiparallel quadruplex. When folded, I migrates with an electrophoretic mobility near 15 bp in a 15% non-denaturing acrylamide gel (Fig. 1B, lane 2). Figure 2 shows the circular dichroism (CD) spectrum of I. The shape of the spectrum (with a positive maximum near 295 nm, a crossover near 276 nm and a negative minimum near 263 nm) is characteristic of an antiparallel quadruplex motif (24).
Figure 1.
(A) Sequences of the deoxyoligonucleotides used in these studies, along with schematic representations of their possible structures. (B) Results from non-denaturing 15% polyacrylamide gel electrophoresis experiments. Lane 1 contains a 10 bp ladder of marker duplex DNAs. Lane 2, oligonucleotide I; lane 3, oligonucleotide II; lane 4, oligonucleotide II + dA12; lane 5, oligonucleotide III; lane 6, oligonucleotide III + excess 5′-CGCGAATTCGCG.
Figure 2.
CD spectra of oligonucleotides used in this study. The spectrum of oligonucleotide I [5′-A(GGGTTA)3GGG] is indicated by the black dashed line. The spectrum of oligonucleotide II [5′-T12A(GGGTTA)3GGG] is indicated by the red solid line. The spectrum of II + dA12 is indicated by the green dotted line. Spectra were recorded in BPES buffer in a 1 cm path length cylindrical cell in a Jacso J-500 CD spectrometer.
Oligonucleotide I was modified by the addition of two different 12 nt ‘tails’ to the 5′ end (Fig. 1A). II contains a simple dT12 tail. III contains a tail with the 12 nt Dickerson–Drew dodecamer sequence (5′-CGCGAATTCGCG). II migrates near 30 bp (Fig. 1B, lane 3). Addition of dA12 (complementary to the dT12 tail) to II results in the formation of a 12 bp duplex region abutting the folded quadruplex. II + dA12 migrates with a mobility that is but slightly slower than II alone (Fig. 1B, lane 4). CD spectra for II and II + dA12 are shown in Figure 2. The spectrum of II is altered relative to that of I because of the T12 tail. Single-stranded poly- and oligo-dT show CD spectra with a positive maximum near 275 nm and a crossover near 260 nm. These spectral features add to the spectrum of I, leading to a reduction in magnitude of the negative peak at 263 nm. Addition of dA12 to II further alters the spectrum, most notably leading to a large negative peak near 250 nm that is a defining characteristic of the dT12:dA12 duplex (25). The CD spectrum of II + dA12 is fully consistent with a hybrid structure containing a folded quadruplex linked to a dT12:dA12 duplex.
The behavior of III (Fig. 1A) is more complex (Fig. 1B, lanes 5 and 6). We hoped that this sequence would dimerize to form a duplex stem capped on either end by folded quadruplex structures, forming the ‘dumbbell’ shown schematically at the bottom of Figure 1A. Gel electrophoresis (Fig. 1B, lane 5), however, reveals multiple species with prominent bands near 25 and 60 bp, and a faint band near 30 bp. We interpret these bands as follows. The species migrating near 60 bp is most probably the expected dumbbell dimer of III. The faint band near 30 bp migrates similarly to II, and must represent the monomeric form of III. The most plausible explanation for the band that migrates near 25 bp is that it arises from a fold-back, hairpin structure within the Dickerson–Drew dodecamer tail. The Dickerson–Drew dodecamer is well known to form hairpin as well as duplex structures (26,27). In order to test these assignments, a mixture of III with excess 5′-CGCGAATTCGCG was prepared and characterized (Fig. 1B, lane 6). Addition of the single-stranded nucleotide complementary to the tail dramatically alters the distribution of species. The band attributed to the dumbbell dimer was greatly diminished, and the band corresponding to the monomeric duplex form (near 30 bp) was greatly enriched. The band near 25 bp attributed to the hairpin tail form remained (although diminished in intensity), and a new band migrating at 12 bp was found for the duplex formed from the self-complementary Dickerson–Drew oligonucleotide. The complex behavior of III led us to focus our further experimental efforts on the simpler system II + dA12.
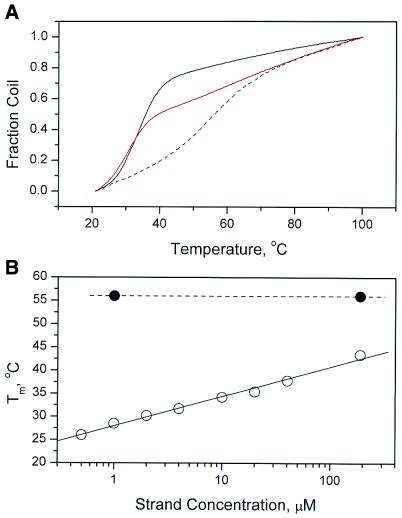
Representative UV melting curves are shown in Figure 3. Melting of II alone revealed a broad transition with Tm ≈ 56°C. For II + A12, an additional transition with Tm ≈ 32°C develops. Duplex dA12:dT12 at a similar concentration melts with Tm ≈ 32°C. The concentration dependencies of the two transitions for II + A12 are shown in Figure 3B. Melting of the folded quadruplex portion (Tm ≈ 56°C) is concentration independent, as expected for unimolecular denaturation. Melting of the duplex dA12:dT12 region, in contrast, is strongly concentration dependent, as expected. UV melting studies are fully consistent with the formation of a novel DNA construct in which a folded quadruplex abuts a duplex stem.
Figure 3.
(A) Melting curves for oligonucleotide II (dashed blue line), II + dA12 (solid red line) and dA12:dT12 duplex (solid black line). θ is the fraction of denatured form, calculated from the equation θ = (A – A0)/(Af – A0), where A is the absorbance at temperature T, A0 is the absorbance at 20°C and Af is the absorbance at 100°C. (B) Concentration dependency of the Tm for the melting of the high (∼56°C) and low (£40°C) temperature transitions for II + dA12. Tm values were estimated from derivative melting curves (not shown).
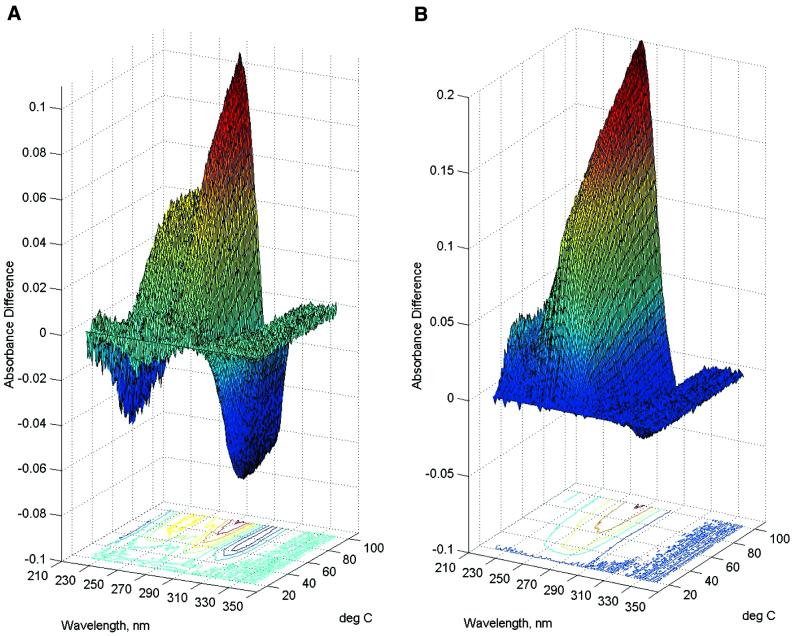
In order to further characterize the denaturation of the new DNA construct, three-dimensional melting experiments were conducted in which whole UV spectra were collected at each temperature, followed by model free analysis using SVD (19). Figure 4 shows UV difference spectra as a function of temperature. Differences relative to the lowest temperature (20°C) spectrum are shown. The shapes of the resultant surfaces reveal distinctive differences between II alone (Fig. 4A) and II + dA12 (Fig. 4B). The latter is dominated by melting of the duplex dA12:dT12 stem. SVD measures the number of significant spectral species that contribute to the families of spectra seen in Figure 4. Full details of SVD analysis were given previously (19,28,29). In brief, SVD decomposes a data matrix M into the product of three matrices, M = SUVT. S is a diagonal matrix that contains the singular values, the magnitude of which indicates the number of significant spectral species that contribute to a family of spectra. For a strictly two-state nucleic acid denaturation, there should be only two significant spectral species, one for the native and one for the denatured forms. Table 1 shows the results of SVD analysis. For II alone, three significant singular values were found, and confirmed by autocorrelation analysis (19,29). [An autocorrelation value of 0.8, corresponding to a signal-to-noise ratio of 1, was used as a cutoff value (29).] At least three species contribute significantly to the spectral changes that result upon denaturation, indicating unambiguously that melting is not a simple two-state process. For II + dA12, SVD reveals four singular values, confirmed by autocorrelation analysis. This finding is expected, since an additional transition from the duplex formed should increase the complexity of the denaturation process. SVD results show unambiguously that denaturation is not a simple two-state process for either II alone or II + dA12.
Figure 4.
Three-dimensional melting curves for the denaturation of II (A) or II + dA12 (B). UV spectra were recorded from 220–350 nm at each temperature. Plotted here are the difference spectra obtained at each temperature by subtraction of the 20°C spectrum. These families of difference spectra were used for analysis by SVD as described in the text.
Table 1. SVD analysis of DNA samples.
| DNA | Singular value | Autocorrelation analysis | |
|---|---|---|---|
| U matrix | V matrix | ||
| T12-AG3(T2AG3)3 | 64.7202 | 0.9955 | 0.9876 |
| |
1.1590 |
0.9728 |
0.9795 |
| |
0.2230 |
0.9908 |
0.9520 |
| |
0.0443 |
0.5924 |
0.6314 |
| |
0.0405 |
0.3366 |
–0.1037 |
| |
0.0361 |
0.0300 |
0.0867 |
| |
0.0345 |
0.2300 |
–0.1031 |
| |
0.0312 |
–0.3724 |
0.1004 |
| |
0.0297 |
–0.0733 |
0.0974 |
| |
0.0283 |
–0.0723 |
–0.0680 |
| (A12-T12)-AG3(T2AG3)3 |
50.1166 |
0.9944 |
0.9885 |
| |
0.8242 |
0.9834 |
0.9652 |
| |
0.1802 |
0.9700 |
0.9593 |
| |
0.1465 |
0.9783 |
0.9514 |
| |
0.0352 |
0.2052 |
–0.0587 |
| |
0.0293 |
–0.1094 |
–0.0307 |
| |
0.0269 |
0.0426 |
–0.0119 |
| |
0.0249 |
0.1961 |
–0.1475 |
| |
0.0246 |
–0.4060 |
0.2113 |
| 0.0235 | 0.1574 | 0.0046 | |
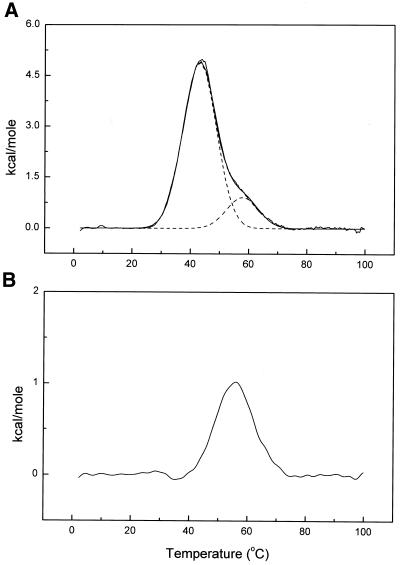
DSC was used to obtain model-free thermodynamic data for the denaturation of our DNA construct. The results are shown in Figure 5. Denaturation studies (Fig. 5B) show that I melts in a reversible manner with Tm = 55.6 (± 0.5)°C and ΔHcal = 16.2 (± 1.2) kcal mol–1 (1 kcal = 4.184 kJ). The entropy of unfolding is ΔScal = Tm/ΔHcal = 49.3 cal mol K–1. By using these calorimetrically determined values, the free energy of folding at 20°C may be calculated (neglecting any heat capacity change) to be –1.7 kcal mol–1. DSC experiments on II + dA12 (Fig. 5A) show unambiguously that the dA12:dT12 duplex is formed. Two transitions are clearly evident in Figure 5A, one with Tm ≈ 56°C for melting of the quadruplex and a second with Tm ≈ 44°C for duplex melting. The DSC experiment demonstrates conclusively that a novel DNA construct with adjacent duplex and folded quadruplex regions was made. Denaturation studies of II + dA12 (Fig. 5A) also show that the duplex and quadruplex regions of the structure melt independently of one another, so there is no cooperative ‘crosstalk’ between the two domains. Deconvolution of the biphasic denaturation curve yields enthalpy values of 67.7 (± 2.5) kcal mol–1 and 16.3 (± 1.2) kcal mol–1 for melting of the duplex and quadruplex domains, respectively. The latter value is nearly identical to that observed for melting of I, indicating that the attachment of the duplex tail evidently does not alter the stability of the folded quartet structure in any way.
Figure 5.
Results from DSC experiments. (A) Oligonucleotide II + dA12. (B) Oligonucleotide I. The dashed lines in (A) represent the deconvolution of the thermogram into two independendent melting transitions as described in the text.
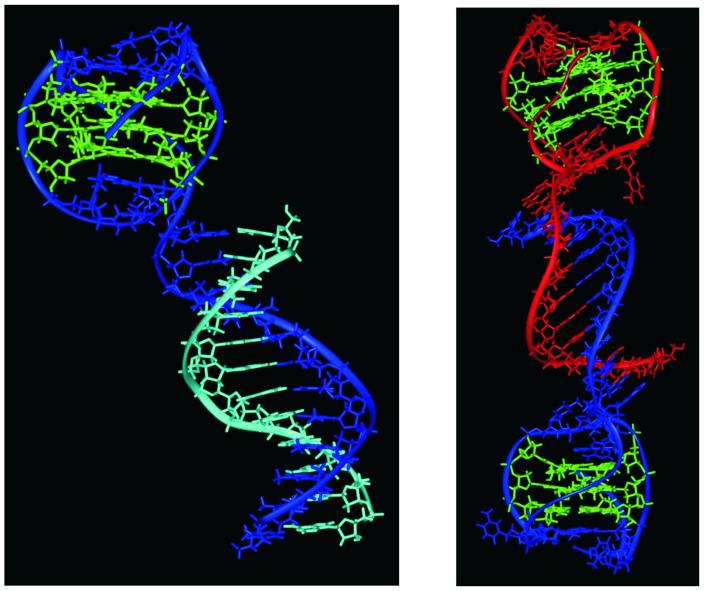
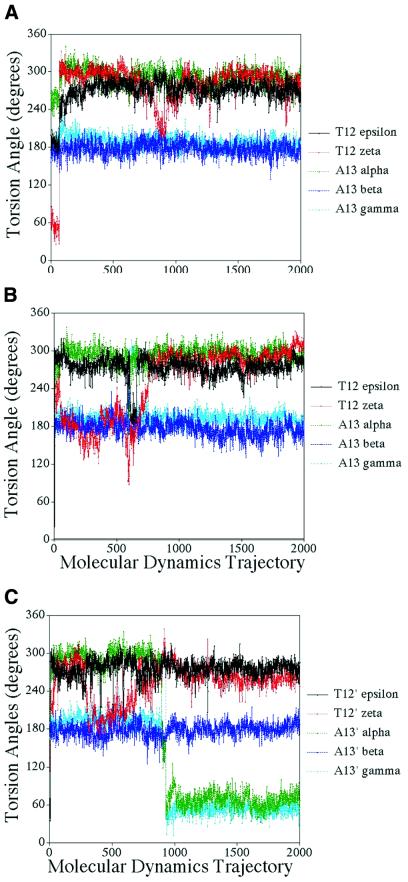
Stereochemically reasonable and stable structures for the II + dA12 construct and for the dumbbell dimer of III were produced by rigorous molecular dynamics simulations. Figure 6 shows examples of these structures. The modeling protocols closely reproduced the folded quartet structure for I obtained by NMR with a root mean square difference (RMSD) of 0.61 Å for the bases of the NMR structure (20) compared with the calculated structure (2 ns simulation). The RMSD of the model of II + dA12 construct (4 ns simulation) and the modeled NMR quartet structure was 0.73 Å, indicating essentially no perturbation of the quadruplex region of the structure. The thymine in the loop region of the quadruplex is more ordered in the II + dA12 construct with favorable π-stacking interactions with the top G-quartet. The duplex region remains in the right-handed form characteristic of A-tract DNA (30). The junction is flexible and consists of just one phosphate backbone linker with no disruption of hydrogen bonding in either the duplex or quadruplex regions. The dihedral angles of this phosphate are within normal limits for typical DNA structures essentially maintaining the same conformation after reaching equilibrium (Fig. 7). We note that the 3′ end of the quadruplex region is situated such that extension of the DNA is possible to add repeating sequence units that might fold into a ‘beads on a string’ motif.
Figure 6.
Molecular models of II + dA12 and the dimer of III. Left, II + dA12 with oligonucleotide strand II shown in blue while dA12 is shown in cyan. Right, III with one strand in blue and one in red. The quadruplex stacks in both cases are indicated in green.
Figure 7.
Analysis of the phosphate linker torsion angles for II + dA12 construct and III. The abscissa is the time course of the molecular dynamics trajectories as taken by 2000 sequential snapshots at 2 ps time points along the 4 ns production trajectories. (A) II + dA12 construct. (B) Quadruplex 1-duplex linker of III. (C) Quadruplex 2-duplex linker of III.
The simulation of the dimer structure of III shows essentially the same characteristics as the II + dA12 construct, with the exception that the linker phosphate torsion angles show more flexibility and can occupy different areas of conformational space. The Dickerson–Drew dodecamer duplex region is similar to that of the published X-ray structure (31) and the duplex region does not perturb the quadruplex motifs.
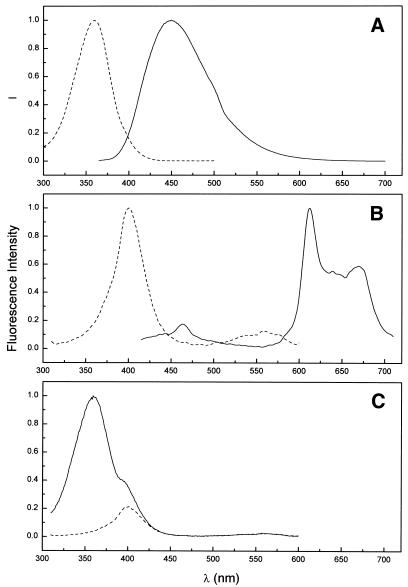
Our DNA construct is a unique receptor for the binding of small molecules, with several different potential binding sites. The folded quadruplex region offers G-quartet stacks and loop regions. The duplex stem offers conventional intercalation along with major and minor groove binding sites. The binding of two different ligands, Hoechst 33258 and the porphyrin NMM, was studied by fluorescence spectroscopy (Fig. 8). Hoechst 33258 is a known minor groove-binding agent, with selectivity for AT sequences (32,33). Figure 8A shows that when bound to DNA, Hoechst 33258 exhibits strong fluorescence emission centered near 450 nm (with excitation at 355 nm). NMM shows pronounced structural selectivity for G-quartets (34,35). Upon binding, it shows a complex fluorescence emission spectrum with multiple peaks over the range 575–700 nm. Its excitation spectrum is centered at 400 nm. Upon binding a mixture of Hoechst 33258 and NMM (1 mol each per mol DNA oligonucleotide), we observe pronounced fluorescence resonance energy transfer (FRET). By measuring emission at 614 nm (far away from any emission by Hoechst 33258), excitation spectra were recorded for NMM bound alone, or in the presence of one equivalent of Hoechst 33258 (Fig. 8C). Alone, NMM show an excitation spectrum centered at 400 nm (Fig. 8C, dashed line). In the presence of Hoechst 33258, a new excitation band for NMM fluorescence emission is evident, centered at 355 nm. That band corresponds to Hoechst 33258 absorbance. The new excitation band for NMM provides unambiguous qualitative evidence for FRET between the two bound ligands (36). More quantitative analysis of the FRET to provide distance information is beyond the scope of this communication, and will be the subject of future work.
Figure 8.
Fluorescence spectra for the interaction of Hoechst 33258 and NMM of II + dA12. (A) Excitation spectrum (dashed line; λem = 510 nm) and emission spectrum (solid line; λex = 355 nm) of Hoechst 33258 bound to II + dA12. (B) Excitation spectrum (dashed line; λem = 614 nm) and emission spectrum (solid line; λex = 400 nm) of NMM bound to II + dA12. (C) Excitation spectra for NMM in the absence (dashed line) or presence (solid line) of Hoechst 33258. Emission at 614 nm was monitored.
DISCUSSION
We describe the design, synthesis and biophysical characterization of a novel DNA construct in which a folded quadruplex structure is joined to a standard double helix. The structure forms spontaneously and is thermodynamically stable. The construct provides a useful and simple model system for a number of purposes. First, the structure contains a variety of potential ligand binding sites, and will be useful for studies of structural-selective binding. Secondly, the construct contains the human telomere repeat sequence 5′-TTAGGG and represents a simple model for the junction region of the telomere. Little is known about the properties of that structure since there has not, until now, been a suitable system available for high-resolution structural studies.
Junction regions possess interesting biophysical and biological properties. The energetic cost of junction formation can lead to long-range allosteric effects on DNA conformation (37,38). One manifestation of such an effect is ‘telestability’, in which adjoining DNA sequences can alter the physical properties of one another (39–41). Junctions play a key role in sequence-directed bending in phased oligo-A tracts (8). B-Z junctions between left- and right-handed DNA exhibit unusual ligand-binding properties (9,42). The energetic cost of B-Z junction formation is strongly dependent upon the surrounding sequence (42). Junctions between triplex and duplex regions provide a unique intercalation site (12). A unique feature of the junction within the construct described here is that there appears to be little or no ‘crosstalk’ between the folded quadruplex and the duplex regions. This is shown quantitatively by comparison of the melting enthalpy values for oligonucleotide I [ΔHcal = 16.2 (± 1.2) kcal mol–1] and for the value for the quadruplex region obtained by deconvolution of the thermogram obtained for II + dA12 [ΔHcal = 16.3 (± 1.2) kcal mol–1]. The near equivalence of these enthalpy values shows that the adjacent duplex has no effect on the denaturation of the quadruplex, and that the two regions melt as independent domains. This finding stands in contrast to the results obtained for the other types of junctions cited above. We note that the junction of tiny telomere DNA is a single unpaired adenine nucleotide, which may be analogous to a ‘nick’. A construct in which the quadruplex and duplex domains were fully connected might well display different thermodynamic and dynamic properties.
Molecular dynamics simulations are fully consistent with the independence of the duplex and quadruplex regions for both the II + dA12 construct and the dimer of III. The duplex region remains in the right-handed form characteristic of A-tract DNA (30) for the II + dA12 construct and remains in the Dickerson dodecamer for the dimer of III. The junction is flexible and consists of just one phosphate backbone linker with no disruption of hydrogen bonding in either the duplex or quadruplex regions. Although the phosphate junction is flexible in the II + dA12 construct, it appears that after equilibrium the conformation is relatively stable throughout the molecular dynamic trajectory on the 1–4 ns timescale. The two phosphate junctions for the dimer of III show flexibility in that they can adopt different conformations and make transitions from one to another as shown in Figure 7. This also illustrates that long trajectories may be required to see some conformational transitions as the major transition for the junction phosphate torsion angles occurred after 1.8 ns. Interestingly, these transitions affect the orientation of the quadruplex region with respect to the duplex region, but do not significantly affect the overall energy of the system, thus indicating the flexible nature of the phosphate junction which is able to occupy different areas of conformational space. Thus the quadruplex can occupy different positions with respect to the duplex, as seen by the torsion angles in Figure 7. One quadruplex in the dimer of III is rotated by ∼45° and tilted 30° with respect to the second quadruplex when compared with the duplex position. This flexibility of orientation could be exploited to build higher order structures combining different DNA motifs.
Optical melting studies on the denaturation of the intramolecular quadruplex formed by the oligonucleotide d(G3T2A)3G3 reported thermodynamic values of Tm = 55°C and ΔHcal = 35 kcal mol–1 in a buffer containing 70 mM NaCl (43). These values differ considerably from those determined here for the denaturation of the same sequence by direct calorimetry. The values derived from optical melting studies were based on the assumption that melting was two state. Our SVD analysis shows conclusively that melting is not two state, and that more complicated models would be needed to analyze optical melting data. Our DSC studies are model free and require no assumptions about the underlying reaction mechanism.
After our studies were completed and this manuscript was in preparation, Tunitiwechapikul and Salazar (44) described the construction of another unusual quadruplex structure. Their construct consists of an intramolecular G-quadruplex flanked by random sequence duplex regions on both ends. The quadruplex region is bridged in the opposite, complementary strand by six T residues. The G-quadruplex region was formed by either the human telomere repeat sequence (identical to that used here) or by the Tetrahymena telomeric repeat sequence (T2G4)4. Their structure was confirmed by chemical modification studies using dimethyl sulfate, but there was no biophysical characterization of the unusual structure, nor was there any attempt to provide a structural model for the construct. The results from the Salazar laboratory and those described here are mutually complementary, and both show that folded quadruplex structures can readily form adjacent to duplex regions.
The DNA structural world has increased in complexity from two to three to four strands, and recent reports suggest that even higher order structures may exist (45–47). The next logical progression is the combination of separate motifs such as those reported here that may be biologically or industrially relevant.
Acknowledgments
ACKNOWLEDGEMENTS
Supported by grant CA35635 from the National Cancer Institute (to J.B.C.) and by the Commonwealth of Kentucky Research Challenge Trust (to J.O.T.).
REFERENCES
- 1.Neidle S. (1999) Oxford Handbook of Nucleic Acid Structure. Oxford University Press, New York, NY.
- 2.Sinden R.R. (1994) DNA Structure and Function. Academic Press, San Diego, CA, pp. 134–286.
- 3.Palecek E. (1991) Local supercoil-stabilized DNA structures. Crit. Rev. Biochem. Mol. Biol., 26, 151–226. [DOI] [PubMed] [Google Scholar]
- 4.Lilley D.M.J. (1996) The formation of alternative structures in DNA. In Hecht,S.M. (ed.), Bioorganic Chemistry: Nucleic Acids. Oxford University Press, Oxford, UK, pp. 186–215.
- 5.Moyzis R.K., Buckingham,J.M., Cram,L.S., Dani,M., Deaven,L.L., Jones,M.D., Meyne,J., Ratliff,R.L. and Wu,J.R. (1988) A highly conserved repetitive DNA sequence, (TTAGGG)n, present at the telomeres of human chromosomes. Proc. Natl Acad. Sci. USA, 85, 6622–6626. [DOI] [PMC free article] [PubMed] [Google Scholar]
- 6.Arthanari H. and Bolton,P.H. (2001) Functional and dysfunctional roles of quadruplex DNA in cells. Chem. Biol., 8, 221–230. [DOI] [PubMed] [Google Scholar]
- 7.Yagil G. (1991) Paranemic structures of DNA and their role in DNA unwinding. Crit. Rev. Biochem. Mol. Biol., 26, 475–559. [DOI] [PubMed] [Google Scholar]
- 8.Crothers D.M., Haran,T.E. and Nadeau,J.G. (1990) Intrinsically bent DNA. J. Biol. Chem., 265, 7093–7096. [PubMed] [Google Scholar]
- 9.Suh D., Sheardy,R.D. and Chaires,J.B. (1991) Unusual binding of ethidium to a deoxyoligonucleotide containing a B-Z junction. Biochemistry, 30, 8722–8726. [DOI] [PubMed] [Google Scholar]
- 10.Kim J.L., Nikolov,D.B. and Burley,S.K. (1993) Co-crystal structure of TBP recognizing the minor groove of a TATA element. Nature, 365, 520–527. [DOI] [PubMed] [Google Scholar]
- 11.Rhee S., Han,Z., Liu,K., Miles,H.T. and Davies,D.R. (1999) Structure of a triple helical DNA with a triplex-duplex junction. Biochemistry, 38, 16810–16815. [DOI] [PubMed] [Google Scholar]
- 12.Helene C. (1993) Sequence-selective recognition and cleavage of double-helical DNA. Curr. Opin. Biotechnol., 4, 29–36. [DOI] [PubMed] [Google Scholar]
- 13.Shay J.W. (1999) At the end of the millennium, a view of the end. Nature Genet., 23, 382–383. [DOI] [PubMed] [Google Scholar]
- 14.Shay J.W., Zou,Y., Hiyama,E. and Wright,W.E. (2001) Telomerase and cancer. Hum. Mol. Genet., 10, 677–685. [DOI] [PubMed] [Google Scholar]
- 15.Blackburn E.H. (1991) Structure and function of telomeres. Nature, 350, 569–573. [DOI] [PubMed] [Google Scholar]
- 16.Blackburn E., Bhattacharyya,A., Gilley,D., Kirk,K., Krauskopf,A., McEachern,M., Prescott,J. and Ware,T. (1997) The telomere and telomerase: how do they interact? Ciba Found. Symp., 211, 2–13. [DOI] [PubMed] [Google Scholar]
- 17.Borer P.N. (1975) Optical properties of nucleic acids. In Fasman,G.D. (ed.), Handbook of Biochemistry and Molecular Biology, Nucleic Acids, 3rd Edn. CRC Press, Boca Raton, FL, Vol. 152, p. 589–..
- 18.Sambrook J., Fritsch,E.F. and Maniatis,T. (1989) Molecular Cloning: A Laboratory Manual, 2nd Edn. Cold Spring Harbor Laboratory Press, Cold Spring Harbor, NY.
- 19.Haq I., Chowdhry,B.Z. and Chaires,J.B. (1997) Singular value decomposition of 3-D DNA melting curves reveals complexity in the melting process. Eur. Biophys. J., 26, 419–426. [DOI] [PubMed] [Google Scholar]
- 20.Wang Y. and Patel,D.J. (1993) Solution structure of the human telomeric repeat d[AG3(T2AG3)3] G-tetraplex. Structure, 1, 263–282. [DOI] [PubMed] [Google Scholar]
- 21.Mohamadi F., Richards,N.G.J., Guida,W.C., Liskamp,R., Lipton,M., Caufield,C., Chang,G., Hendrickson,T. and Still,W.C. (1990) MacroModel—an integrated software system for modeling organic and bioorganic molecules using molecular mechanics. J. Comput. Chem., 11, 440–467. [Google Scholar]
- 22.Trent J.O. (2001) Advances in DNA molecular modeling. An update. Methods Enzymol., 340, 290–326. [DOI] [PubMed] [Google Scholar]
- 23.Cornell W.D., Cieplak,P., Bayly,C.I., Gould,I.R., Merz,K.M., Ferguson,D.M., Spellmeyer,D.C., Fox,T., Caldwell,J.W. and Kollman,P.A. (1995) A second generation force field for the simulation of proteins, nucleic acids, and organic molecules. J. Am. Chem. Soc., 117, 5179–5197. [Google Scholar]
- 24.Sun X.G., Cao,E.H., He,Y.J. and Qin,J.F. (1999) Spectroscopic comparison of different DNA structures formed by oligonucleotides. J. Biomol. Struct. Dyn., 16, 863–872. [DOI] [PubMed] [Google Scholar]
- 25.Johnson W.C. Jr (1996) Nucleic acid conformation by electronic CD. In Fasman,G.D. (ed.), Circular Dichroism and the Conformational Analysis of Biomolecules. Plenum Press, New York, NY, pp. 433–468.
- 26.Patel D.J., Kozlowski,S.A., Marky,L.A., Broka,C., Rice,J.A., Itakura,K. and Breslauer,K.J. (1982) Premelting and melting transitions in the d(CGCGAATTCGCG) self-complementary duplex in solution. Biochemistry, 21, 428–436. [DOI] [PubMed] [Google Scholar]
- 27.Marky L.A., Blumenfeld,K.S., Kozlowski,S. and Breslauer,K.J. (1983) Salt-dependent conformational transitions in the self-complementary deoxydodecanucleotide d(CGCAATTCGCG): evidence for hairpin formation. Biopolymers, 22, 1247–1257. [DOI] [PubMed] [Google Scholar]
- 28.Hendler R.W. and Shrager,R.I. (1994) Deconvolutions based on singular value decomposition and the pseudoinverse: a guide for beginners. J. Biochem. Biophys. Methods, 28, 1–33. [DOI] [PubMed] [Google Scholar]
- 29.Henry R.W. and Hofrichter,J. (1992) Singular value decomposition: application to analysis of experimental data. In Brand,L. and Johnson,M.L. (eds), Methods in Enzymology. Academic Press, New York, NY, Vol. 210, pp. 129–191.
- 30.MacDonald D., Herbert,K., Zhang,X., Polgruto,T. and Lu,P. (2001) Solution structure of an A-tract DNA bend. J. Mol. Biol., 306, 1081–1098. [DOI] [PubMed] [Google Scholar]
- 31.Drew H.R., Wing,R.M., Takano,T., Broka,C., Tanaka,S., Itakura,K. and Dickerson,R.E. (1981) Structure of a B-DNA dodecamer: conformation and dynamics. Proc. Natl Acad. Sci. USA, 78, 2179–2183. [DOI] [PMC free article] [PubMed] [Google Scholar]
- 32.Loontiens F.G., Regenfuss,P., Zechel,A., Dumortier,L. and Clegg,R.M. (1990) Binding characteristics of Hoechst 33258 with calf thymus DNA, poly[d(A-T)], and d(CCGGAATTCCGG): multiple stoichiometries and determination of tight binding with a wide spectrum of site affinities. Biochemistry, 29, 9029–9039. [DOI] [PubMed] [Google Scholar]
- 33.Loontiens F.G., McLaughlin,L.W., Diekmann,S. and Clegg,R.M. (1991) Binding of Hoechst 33258 and 4′,6′-diamidino-2-phenylindole to self-complementary decadeoxynucleotides with modified exocyclic base substituents. Biochemistry, 30, 182–189. [DOI] [PubMed] [Google Scholar]
- 34.Arthanari H., Basu,S., Kawano,T.L. and Bolton,P.H. (1998) Fluorescent dyes specific for quadruplex DNA. Nucleic Acids Res., 26, 3724–3728. [DOI] [PMC free article] [PubMed] [Google Scholar]
- 35.Ren J. and Chaires,J.B. (1999) Sequence and structural selectivity of nucleic acid binding ligands. Biochemistry, 38, 16067–16075. [DOI] [PubMed] [Google Scholar]
- 36.Clegg R.M. (1995) Fluorescence resonance energy transfer. Curr. Opin. Biotechnol., 6, 103–110. [DOI] [PubMed] [Google Scholar]
- 37.Crothers D.M. and Fried,M. (1983) Transmission of long-range effects in DNA. Cold Spring Harb. Symp. Quant. Biol., 47, 263–269. [DOI] [PubMed] [Google Scholar]
- 38.Chaires J.B. (1986) Allosteric conversion of Z DNA to an intercalated right-handed conformation by daunomycin. J. Biol. Chem., 261, 8899–8907. [PubMed] [Google Scholar]
- 39.Early T.A., Kearns,D.R., Burd,J.F., Larson,J.E. and Wells,R.D. (1977) High resolution proton nuclear magnetic resonance investigation of the structural and dynamic properties of d(C15A15)-d(T15G15). Biochemistry, 16, 541–551. [DOI] [PubMed] [Google Scholar]
- 40.Burd J.F., Larson,J.E. and Wells,R.D. (1975) Further studies on telestability in DNA. The synthesis and characterization of the duplex block polymers d(C20A10) – d(T10G20) and d(C20A15) – d(T15G20). J. Biol. Chem., 250, 6002–6007. [PubMed] [Google Scholar]
- 41.Burd J.F., Wartell,R.M., Dodgson,J.B. and Wells,R.D. (1975) Transmission of stability (telestability) in deoxyribonucleic acid. Physical and enzymatic studies on the duplex block polymer d(C15A15) – d(T15G15). J. Biol. Chem., 250, 5109–5113. [PubMed] [Google Scholar]
- 42.Sheardy R.D., Suh,D., Kurzinsky,R., Doktycz,M.J., Benight,A.S. and Chaires,J.B. (1993) Sequence dependence of the free energy of B-Z junction formation in deoxyoligonucleotides. J. Mol. Biol., 231, 475–488. [DOI] [PubMed] [Google Scholar]
- 43.Balagurumoorthy P. and Brahmachari,S.K. (1994) Structure and stability of human telomeric sequence. J. Biol. Chem., 269, 21858–21869. [PubMed] [Google Scholar]
- 44.Tunitiwechapikul W. and Salazar,M. (2001) Cleavage of telomeric G-quadruplex DNA with perylene-EDTA-Fe(II). Biochemistry, 40, 13652–13658. [DOI] [PubMed] [Google Scholar]
- 45.Matsugami A., Ouhashi,K., Kanagawa,M., Liu,H., Kanagawa,S., Uesugi,S. and Katahira,M. (2001) An intramolecular quadruplex of (GGA)(4) triplet repeat DNA with a G:G:G:G tetrad and a G(:A):G(:A):G(:A):G heptad, and its dimeric interaction. J. Mol. Biol., 313, 255–269. [DOI] [PubMed] [Google Scholar]
- 46.Chaput J.C. and Switzer,C. (1999) A DNA pentaplex incorporating nucleobase quintets. Proc. Natl Acad. Sci. USA, 96, 10614–10619. [DOI] [PMC free article] [PubMed] [Google Scholar]
- 47.Zhang N., Gorin,A., Majumdar,A., Kettani,A., Chernichenko,N., Skripkin,E. and Patel,D.J. (2001) V-shaped scaffold: a new architectural motif identified in an A x (G x G x G x G) pentad-containing dimeric DNA quadruplex involving stacked G(anti) x G(anti) x G(anti) x G(syn) tetrads. J. Mol. Biol., 311, 1063–1079. [DOI] [PubMed] [Google Scholar]


