

Summary
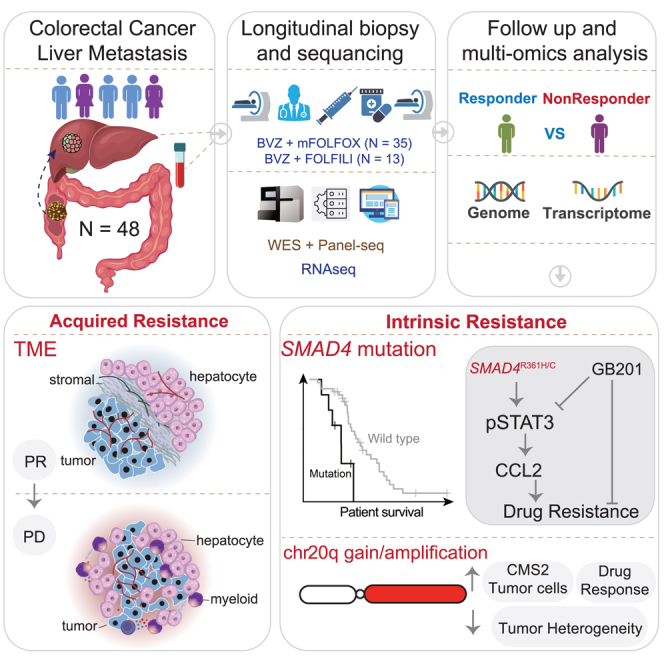
Drug resistance limits the efficacy of chemotherapy for colorectal cancer liver metastasis (CRLM). However, the evolution of CRLM during drug treatment remains poorly elucidated. Multi-omics and treatment response data from 115 samples of 49 patients with CRLM undergoing bevacizumab (BVZ)-based chemotherapy show little difference in genomic alterations in 92% of cases, while remarkable differences are observed at the transcriptomic level. By decoupling intrinsic and acquired resistance, we find that hepatocyte and myeloid cell infiltration contribute to 38.5% and 23.1% of acquired resistance, respectively. Importantly, SMAD4 mutations and chr20q copy-number gain are associated with intrinsic chemoresistance. Gene interference experiments suggest that SMAD4R361H/C mutations confer BVZ and 5-fluorouracil (5-FU) resistance through STAT3 signaling. Notably, supplementing BVZ and 5-FU with the STAT3 inhibitor GB201 restores therapeutic efficacy in SMAD4R361H/C cancer cells. Our study uncovers the evolutionary dynamics of CRLM and its microenvironment during treatment and offers strategies to overcome drug resistance.
Keywords: colorectal liver metastases, cancer genomics, tumor microenvironment, chemoresistance, Bevacizumab, SMAD4 mutation, chr20q copy-number gain
Graphical abstract
Highlights
-
•
Longitudinal sequencing reveals TME reorganization after BVZ-C therapy
-
•
Acquired resistance associates with the spatial distance of tumors and hepatocytes
-
•
SMAD4 mutation and chr20q copy-number gain associate with intrinsic resistance
-
•
STAT3 inhibition overcomes resistance in SMAD4-mutant cells and holds therapeutic potential
Shi et al. identified spatial and genetic factors contributing to intrinsic and acquired resistance in patients with colorectal cancer liver metastases. By demonstrating the restoration of therapeutic response with a STAT3 inhibitor, this study paves the way for targeted therapeutic strategies to overcome drug resistance.
Introduction
Colorectal cancer liver metastases (CRLMs) constitute approximately 70% of colorectal cancer (CRC)-related deaths.1 In 2004, the Food and Drug Administration (FDA) approved bevacizumab (BVZ), an antiangiogenic agent, in combination with chemotherapeutic agents for treating metastatic CRC (mCRC).2 Since then, its application has been extended to various treatment regimens, including first- and cross-line therapies,3,4 adjuvant therapy,5 and maintenance therapy.6 BVZ-based chemotherapies (BVZ-C therapies) are currently administered as the primary first-line treatment for CRC and CRLMs. Notwithstanding such progress, nearly 50% of patients with CRLM fail to respond,7 and many patients who initially benefit would relapse rapidly.8 Identifying predictive biomarkers of BVZ-C therapy responders in patients with CRLM is urgently needed to optimize therapeutic decisions.
Exome and transcriptome sequencing technologies have revolutionized our knowledge of CRC and its metastases. The Cancer Genome Atlas (TCGA) group9 and Yaeger et al.10 established a comprehensive genomic landscape of CRC and metastatic CRCs. Subsequent expression-based analyses classified CRC into four consensus molecular subtypes (CMSs) with distinguishing features.11 More recently, Zhao et al. expanded our knowledge of Chinese patients, linking tumor genomic heterogeneity to different clinical characteristics.12 Nevertheless, the clinical and molecular features associated with treatment response remain poorly understood owing to the unavailability of treatment data in these studies.
Remarkable efforts have been devoted to identifying biomarkers of BVZ-C therapy response in patients with CRC. Smeets et al. performed low-coverage whole-genome sequencing on patients with CRC treated with BVZ-C and discovered the role of chromosomal instability in treatment outcomes.13 However, it is unclear how tumor cells evolve to become chemoresistant in response to therapy. Additionally, drug resistance cannot be completely explained by genomic factors.14,15 Several studies have focused on non-genetic resistance mechanisms, such as epithelial-mesenchymal transition, metabolic reprogramming, and tumor-stromal cell interactions,16 particularly in microenvironment-targeted strategies, such as BVZ. It has been reported that the redundancy of angiogenic signaling molecules, vascular symbiosis, and increased infiltration of fibroblasts and myeloid cells are closely related to BVZ resistance.17,18 Studies have suggested that the molecular mechanisms of genetic and non-genetic drug resistance are heterogeneous but partly overlapping.16 Hence, characterizing the evolution of the tumor and tumor microenvironment (TME) induced by BVZ-C treatment is crucial for understanding the mechanisms of drug resistance.
In this study, we provided a longitudinal cohort of matched pre- and post-treatment samples from 49 patients with CRLM who received BVZ-C therapy as the first-line standard treatment. Leveraging whole-exome and RNA sequencing of multi-time point tumor samples during the course of clinical treatment of patients with CRLM, we aimed to dissect the underlying molecular and TME determinants that may regulate patient prognosis and tumor response to treatment.
Results
Longitudinal sequencing characterized CRLM under treatment
To investigate the treatment efficacy of CRLM, we enrolled 49 patients diagnosed as CRLM at Nanfang Hospital of Southern Medical University. They were treated with BVZ plus either mFOLFOX6 (oxaliplatin + 5-fluorouracil [5-FU]) or FOLFIRI (irinotecan + 5-FU), with follow-up durations ranging from 1.5 months to over 50 months (Figure 1A; Table S1). Of the full cohort, 77% migrated from left-sided CRCs, 83% were staged IVA or IVB, and 42% simultaneously developed lung metastases. The median age at diagnosis was 55.5 years, range: 29–79 years (Figure S1A). The median progression-free survival (PFS) and overall survival (OS) for the cohort were 9.97 and 25.37 months, respectively (Figure S1B). To assess the treatment response of each tumor sample, we used Response Evaluation Criteria in Solid Tumors (RECIST) 1.119 to classify all samples into partial response (PR), stable disease (SD), or progressive disease (PD) (Figure 1B). We then defined responders as those with PR or non-continuous stable disease (tumor volumes shrink continually to PR within two cycles) and non-responders as those with PD or continuous stable disease (tumor size was stable or increasing to PD over at least four months; Figures 1C and S1C). As a result, 48 patients were stratified into 21 responders and 27 non-responders, and one patient (B29) was not stratified owing to inadequate follow-up. Responders (median PFS: 11.67 months) portended a longer PFS than non-responders (median PFS: 8.33 months, p = 4.0e−2; Figure S1D). Cohort-level analysis of the response rate showed no significant difference between the two first-line regimens (mFOLFOX6-BVZ: 60% [95% exact confidence interval (CI): 42.11%–76.13%, 21 of 35 patients] versus FOLFIRI-BVZ: 46.2% [95% exact CI: 19.22%–74.87%, 6 of 13 patients]) (Figure 1D). Similarly, they had comparable PFS and OS rates (Figure S1E), which are consistent with a previous study.20 Further examination of clinical parameters showed that neither age, gender, primary site, nor the number of metastases was associated with the response to BVZ-based therapies, while lung metastases were slightly higher in responders (56%, p = 0.04, Figure S1A).
Figure 1.

Longitudinal follow-up and multi-omics characterization of CRLM under chemotherapy
(A) Schematic diagram of patient enrollment and sample collection.
(B) Swimmer plot depicting time on treatment, duration of treatment, response, and survival characteristics. Each lane represents a single patient’s data. The x axis represents the duration of therapy for each patient. The key within the plot describes all symbols and color coding. Samples sequenced are encircled with black border.
(C) Guideline of response classification based on RECIST 1.1. Samples with inconsistent assessment are labeled with criteria b. cSD, continuous stable disease (SD for 4 months or SD for 2 months and then PD for 2 months); ncSD, non-continuous stable disease (SD for 2 months and then PR for 2 months). R: responder; NR: non-responder.
(D) Bar plot comparing differences in objective response rate between treatment arms.
(E) Bar plot depicting response rate over time in our cohort. The x axis indicates the number of months after the start of treatment and y axis denotes the fraction of different response groups.
(F) Summary of DNA and RNA sequencing data collected in this study. See also Figure S1.
It is worth mentioning that in the context of BVZ-C therapies for CRLMs, a usual pattern is observed in which patients initially respond well to treatment; however, as treatment continues, drug resistance almost inevitably emerges.21,22 To monitor CRLM evolution in response to therapeutic pressures, longitudinal tumor specimens (n = 115) were collected (through either biopsy or surgery) from the patients, among whom two cases had four tumor samples, i.e., pre-treatment (Pre), Post1, Post2, and Post3; 13 cases had three tumor samples (Pre, Post1, and Post2), and the remaining cases had two samples. We observed that approximately half of the patients were non-responders at the beginning, and the proportion of non-responders steadily increased over time, reaching 100% in the 10th month after the first BVZ-C therapy (Figure 1E). To investigate the molecular mechanisms of both intrinsic resistance (IR) and acquired resistance (AR) in BVZ-C-treated CRLMs, we carried out DNA and/or RNA sequencing on the enrolled tumor samples, coupled with matched blood controls, leading to whole-exome sequencing (WES) or panel-seq data of 115 samples and RNA sequencing (RNA-seq) data of 100 samples (Figure 1F).
Genomic aberrations were preserved after treatment
To delineate the evolving landscape of tumor genomic mutations, we analyzed the WES and panel-seq data. WES achieved a median of 318× (125×–657×) coverage in tumors and 313× (137×–535×) in normal blood. In the panel-seq data, the average depth of the targeted regions was 500×. The median somatic mutation load per sample was 83 (range, 0–235; Table S2). We detected somatic mutations in the driver genes of CRC (Figure S2), including TP53 (73.5%), APC (63.3%), KRAS (57.1%), PIK3CA (18.4%), BRAF (12.2%), and SMAD4 (16.3%). The altered signaling pathways were P53 (77.6%), WNT (75.5%), RTK/RAS (69.4%), TGF (26.5%), and PI3K (26.5%). Compared to the TCGA CRC dataset,9 CRLMs in this cohort displayed a higher incidence of TP53 mutations (73.5% versus 53.8%, p = 1.2e−2), with comparable mutation rates for other reported genes (Figure S2). In addition, this cohort demonstrated a greater prevalence of microsatellite stability (MSS: 100% versus 70.2% in TCGA, p = 9.7e−6; Figure S2), consistent with a recent study that reported a high proportion of MSS among Chinese patients with mCRC.23
We then used the CELLO pipeline24 to characterize the evolutionary landscape of CRLM under therapy. All driver genes had consistent mutation frequencies in tumors before and after treatment (Figure 2A), and no statistical differences were observed in the overall burden of somatic mutations (pre [median: 90, 0–202]; post [median: 86, range: 0–235]; Figure 2B), nor in chromosomal copy-number heterogeneity25 (CNH, a global measure of chromosomal complexity; Figure S3A) between the baseline and treated tumors. In sharp contrast, a significant reduction in tumor purity was observed after therapy (Figure 2C), particularly in the responder group, with no change in the non-responder group (Figure S3B). We constructed phylogenetic trees to explore the temporal evolution of tumors under treatment-induced pressures and then mapped them to a Moduli space (Figure S3C). Our analysis indicated that most patients were clustered in the common corner (Figure S3D), but a few cases were scattered near the pre- or post-treatment private corner, potentially biased by the low tumor content (Figure S3C). We then applied an in-house mathematical method, the Evolutionary Tree Inference Program (ETRIP) (Figure S3E), to recover the number of underestimated mutations due to limited sequencing coverage and/or low tumor purity from the DNA sequencing data (Methods). Using ETRIP, we reconstructed phylogenetic trees and observed that 92% of CRLM tumors showed no substantial divergence in genomic profiles in response to current treatment regimens (linear evolution, Figure 2D). Nevertheless, post-treatment tumors from four cases (B21, B24, B05, and B55; Figures 2E and 2F) acquired 37 to 167 coding mutations compared to baseline tumors (branched evolution). Together, our data showed a marked convergence in the tumor genome during therapy.
Figure 2.

Genomic and transcriptomic profiles of pre- and post-treatment CLRMs
(A) Three-dimensional bubble plot showing the frequency of pre-treatment-private (blue; left axis), post-treatment-private (red; right axis), and common somatic mutations (yellow; upper axis).
(B) Somatic mutation number of pre-treatment tumors versus post-treatment tumors. p value: two-sided paired t test.
(C) Tumor purity (inferred by ESTIMATE) of pre-treatment versus post-treatment tumors. p value: two-sided Mann-Whitney U test.
(D) Ternary plot of moduli space of evolutionary trees inferred by ETRIP. Each ball represents a patient, with colors indicating three clusters within moduli space. Patients with a higher fraction of shared somatic mutations between pre- and post-treatment stages are clustered near the “Common” corner, while those with a significant reduction in mutations after treatment are located near the “Pre” corner. Purple shading highlights patients with branched tumor evolution.
(E) The phylogenetic tree and response history for the four patients highlighted in (D).
(F) The proportion of patients with linear evolution (yellow) and branched evolution (purple).
(G) Volcano plot showing DEGs in post-treatment versus pre-treatment tumor samples.
(H) The enriched hallmark gene sets in baseline compared with post-treatment samples.
(I) Consensus molecular subtype (CMS) transitions under treatment (left). Right: proportion change in each subtype. p value: chi-squared test.
(J) Percentage changes of various cell types between post-treatment and pre-treatment samples. Relative percentage of each cell type within the bulk RNA-seq samples is inferred by the deconvolution method BayesPrism. Percentage changes (delta %) are calculated by subtracting the average cell type proportions in treated samples from those in baseline samples. The bubble size is proportional to −log10(p value). p value: two-sided Mann-Whitney U test. See also Figures S2–S5.
Treatment reshaped TME
Next, we sought to investigate the transcriptomic changes in CRLM during therapy. RNA sequencing data from 100 pre- or post-treatment tumor samples of 43 patients were collected and processed following the standard pipeline (Methods). To evaluate temporal changes in gene expression, we conducted differentially expressed gene (DEG) analysis between pre- and post-treatment samples and identified 4,573 DEGs after controlling for the false discovery rate (q < 0.05, Figure 2G), suggesting that treatment remarkably perturbs either tumor cell transcriptomic profiles, TME, or both. Subsequent gene set enrichment analysis (GSEA) revealed prevailing downregulation of cell proliferation hallmarks such as MYC targets, E2F targets, G2M checkpoints, and DNA repair, and strong upregulation of genes involved in epithelial-mesenchymal transition (EMT), immunity-related (e.g., coagulation, complement, and inflammatory response), and metabolism-related hallmarks (e.g., xenobiotic metabolism, bile acid metabolism, and heme metabolism) after treatment (Figure 2H). Using the CMS classification system,11 we assessed the transcriptional subtype for each CRLM sample and examined phenotype transitions in matched pre- and post-treatment pairs. Importantly, the baseline CMS2-canonical/epithelial (58.8%, 10/17) and mixed subtypes (58.8%, 10/17) switched to CMS4-mesenchymal/stromal subtypes after treatment (Figure 2I). These observations signified that BVZ-C therapy triggers significant transcriptional reconfiguration and phenotypic variation.
To further discern how BVZ-C therapy may impact the TME, we deconvolved the RNA expression data using BayesPrism,26 a Bayesian method that jointly reconstructs cell type abundance and cell-type-specific gene expression profiles from bulk transcriptomes (Methods). To test the performance of BayesPrism in the CRLM dataset, we generated pseudobulk samples from public CRLM single-cell profiles covering eight major cell types.27 The cell type proportions inferred by BayesPrism were highly concordant with the ground truth (Figure S4A). As expected, using deconvolution in our cohort, we found strong correlations between the proportion of epithelial (tumor cells) proportions and the estimated tumor purity based on independent methods (Figure S4B). Surprisingly, DEG analysis of epithelial cells revealed that the transcriptional profile of tumor cells showed little change after therapy (Figure S4C). This observation resembled our aforementioned findings concerning rare treatment-associated genomic changes. Therefore, we turned our attention to TME dynamics and observed a notable reduction in epithelial cells along with increased infiltration of hepatocytes and myeloid cells after treatment (Figures 2J and S4D), implying an evolving shift in the composition of TME cells as a key feature of BVZ-C treatment.
We next compared the transcriptional features of samples before and after treatment by the response group. Compared to the non-responders, a notably higher number of DEGs were detected between pre- and post-treatment samples in the responders (Figure S5A). Enrichment analysis revealed that cell cycle/proliferation pathways were prevalent in pre-treatment samples from both groups, while metabolism and immune response pathways were enriched in post-treatment samples of responders (Figure S5B). Responders also displayed a greater CMS2-to-CMS4 shift following treatment (Figures S5C and S5D). Moreover, treatment significantly altered the TME in responders, reducing epithelial cells and increasing hepatocytes and myeloid cells, with no notable changes in non-responders (Figures S5E and S5F). Collectively, responders to the treatment demonstrated more substantial transcriptional changes, encompassing more DEGs, a larger CMS2-to-CMS4 shift, and greater TME dynamics than non-responders.
Spatial proximity of hepatocytes and tumors contributed to acquired resistance
To uncover the molecular mechanisms of how IR and AR limit treatment benefit (Figure 1E), we developed a biomarker detection method, termed SRFS (sample-based response feature selection) (Figure S6A; Table S3) to dissect the contributors of AR and IR. For each feature, SRFS evaluated its discriminative power between sensitive (PR, n = 27) and resistant groups (SD or PD, n = 64) using a univariate logistic regression model (continuous features) or a Fisher’s exact test (categorical features) and derived its relative contribution to AR and IR (Methods). Employing SRFS on a comprehensive list of DNA and RNA features, we identified 107 significant AR-related features (24 sensitive-relevant and 83 resistant-relevant; Figure S6B; Tables S4 and S5). We observed that none of the genomic features were significantly associated with AR, spanning mutations, copy-number alterations (CNAs), ploidy, mutation burden, and CNH (Figures S6B and 3A). Instead, we found that AR was largely dependent on transcriptomic features. Specifically, the sensitive-relevant features encompassed tumor purity, CMS2 subtype, relative abundance of epithelial and natural killer (NK) cells, and expression levels of 20 genes, whereas the resistant-relevant features nominated the CMS4 subtype, relative abundance of hepatocytes and myeloid cells, and expression levels of 80 genes (Figure 3A and S6B–D). Enrichment of the sensitive-relevant genes designated Wnt/β-catenin signaling. In contrast, the resistant-relevant genes were mainly enriched in cancer hallmarks, including KRAS signaling upregulation, metabolism, EMT, hypoxia, and IL-6/JAK/STAT3 signaling (Figure 3B). Given the strong association between the expression levels of these genes and AR in our cohort (Figure S6E), we tested this association in two previously published patients with CRLM treated with oxaliplatin + BVZ.28 Consistently, upregulation of resistant-relevant genes was observed in the patient with disease progression, while the responsive patient displayed the opposite trend (Figure 3C), indicating that these resistant-relevant genes were important for tumor progression.
Figure 3.

Genomic and transcriptomic factors associated with AR
(A) Different types of features prioritized by SRFS. Each dot represents an individual feature and significant AR or IR-associated features are highlighted in green (pro-sensitive) or purple (pro-resistant). The digital number at the bottom summarizes total feature numbers for the corresponding feature type. Shapes indicate the therapeutic resistance types (triangle: AR-only, square: IR-only, diamond: AR and IR).
(B) The enriched hallmark gene sets from the AR-related genes identified from (A).
(C) Validation of AR-related genes in samples from an independent cohort. Re-analysis of previously reported patients demonstrated that pro-resistant genes are remarkably upregulated in P029 (left side) but downregulated in P135 (right side). Both patients were partial response (PR) when treated by oxaliplatin plus BVZ, and P029 became IRES (lesions continue to grow under therapy) when the post-treatment sample was collected, while P135 remained PR.
(D) Lollipop plot showing −log10 p values of the AR relevance for different cell type proportions calculated by SRFS. Relative proportion for each cell type is inferred by BayesPrism. Pie charts (bottom) show the fraction of patients whose AR was potentially contributed by certain cellular type.
(E) Comparison of three histopathological growth patterns (HGPs) of CRLMs before and after treatment. Left: proportion of HGPs by HE staining in SD/PD (n = 36) or PR (n = 20) and corresponding pre-treatment nodes. p value: unpaired t test. Right: representative immunofluorescence images of HGPs from tissues of hepatic metastases in the PD and pre-treatment stages. Scale bars, 100 and 200 μm, respectively. The white and red dashed lines indicate the tumor interface and liver-stromal interface, respectively. DHGP, desmoplastic HGP; PHGP, pushing HGP; RHGP, replacement HGP; CK20, cytokeratin 20 (cancer cell marker); HEP, hepatocyte (hepatocyte marker).
(F) A histogram (left) and representative images (right) demonstrate the proportion of RHGP based on CT images in response (n = 6) and acquired resistance (n = 7) CRLM cohorts. Red arrows indicate liver metastases.
(G) Representative IF images (left) and quantification (right) of monocytes (CD14+) and macrophages (CD163+) in CRLM samples from SD/PD (n = 5) and pre-treatment (n = 10). p value: two-sided Mann-Whitney U test. Scale bars, 100 μm. See also Figure S6.
Following our earlier observations of AR-related cell types (Figure 3A), we found that increased infiltration of hepatocytes and myeloid cells contributed to 38.5% and 23.1% of AR, respectively (Figure 3D), pinpointing the potential resistance-promoting roles of the hepatic and myeloid milieu. The spatial transcriptome dataset of patients with CRLM29 also revealed the increased hepatocyte infiltration and decreased spatial distance between hepatocytes and tumor cells after XELOX treatment (Figure S6F). Interestingly, previous studies have corroborated that replacement histopathological growth patterns (RHGPs), characterized by tumor cell invasion into hepatic plates and co-option of existing sinusoidal vessels within the liver parenchyma, were closely correlated with an adverse response to BVZ-C.17,18,30 To elucidate the relationship between AR and the spatial organization of tumors and hepatocytes in our cohort, we classified CRLMs into three different histopathological growth patterns (HGPs)31: desmoplastic HGP (DHGP), pushing HGP (PHGP), and RHGP, which corresponds to a gradual decrease in the spatial distance between the two. Our quantification of the three HGPs in CRLM samples using hematoxylin-eosin (HE) staining demonstrated a significant increase in RHGP patterns in treated SD/PD samples compared to baseline, with no significant changes observed in the DHGP and PHGP patterns (Figure 3E). Conversely, the post-treatment PR group exhibited no changes in RHGP patterns compared with the baseline controls. Some examples were examined in Figure 3E by multiplex immunofluorescence (mIF) staining, and samples that developed AR showed a markedly reduced distance between tumor cells and hepatocytes. Assessment of contrast-enhanced computed tomography (CT) images also revealed a higher proportion of RHGP in disease-progressive tumors than in disease-responsive tumors (Figure 3F). Furthermore, mIF staining confirmed a notably larger proportion of CD14+ (monocyte marker) and CD163+ (macrophage marker) cells surrounding disease-progressive tumors compared to the responsive baseline levels (Figure 3G). In sum, our data suggested the tumor and hepatic cell proximity, as well as elevated myeloid cell abundance as potential mechanisms underlying AR to BVZ-C therapy.
SMAD4 mutations and chr20q-gain contributed to IR
By leveraging the SRFS method, we identified 100 features that were significantly related to IR (Figure S7A; Tables S4 and S5). Whereas the somatic mutation load CNH and ploidy were not correlated with IR (Figure 3A), somatic SMAD4 mutations, TGF-β pathway mutations, relative abundance of hepatocytes, and the upregulation of 50 genes were the key IR factors promoting resistance, and amplification/gain of chromosome 20q13.12–32, 20q, 13q, and 20q11.21–23, high tumor purity, CMS2 subtype, relative abundance of epithelial and NK cells, and the upregulation of 50 genes were the significant favorable factors for a positive response (Figure 3A). Interestingly, the top pro-sensitive genes were enriched in chromosome 20q, which included SALL4, MYH7B, TAF4, FITM2, and TTI1, echoing the aforementioned DNA-level results of chromosome 20q-gain (Figures 4A and S7B). Furthermore, our analysis characterized immune-related factors such as IL13RA1 (the receptor for interleukin 13), MRC1, and CD14 (marker genes for myeloid cells), metabolism-related transcripts (SLC1A1, CES1, and GUCD1), and the stroma-related gene FGFR2 as the top genes whose expression promote resistance. Functional enrichment analysis revealed that pro-sensitive IR-relevant genes were enriched in PI3K/AKT/mTOR signaling and UV response, while pro-resistant IR-relevant genes were enriched in KRAS signaling, fatty acid metabolism, and IL-6/JAK/STAT3 signaling (Figure 4B). Cellular-level analyses demonstrated that the post-treatment increase in hepatocytes was the most pronounced compared to other TME cell types, explaining 26.3% of IR (Figures 4C and S4D). We then proposed that the spatial distance between tumors and hepatocytes might be a determinant of IR. To provide further evidence to this hypothesis, mIF staining images were carefully examined and we found higher levels of RHGP in the IR group than in responsive patients, supporting that early hepatic infiltrates of tumors conferred IR to BVZ-C therapy (Figure 4D). Besides, myeloid cells were also highly enriched in the IR group (Figure S7C). Limited to the malignant RHGP tumors (n = 9), factors such as high tumor purity, CMS2 subtype, and relative abundance of epithelial and NK cells were still associated with a positive response. Additionally, mutations in TGF-β pathway, along with relative abundance of hepatocytes and myeloid cells were still identified as IR factors in RHGP tumors (Figure S7D). Regarding gene expression, no genes showed significant correlations with drug resistance, but due to the small RHGP sample size, validation of these findings in additional cohorts is warranted.
Figure 4.

Genomic and transcriptomic factors associated to IR
(A) Lollipop plot showing the top 10 genes related to IR. The y axis represents the proportion of patients whose IR might be driven by the corresponding gene expression.
(B) The enriched hallmark gene sets from the significant IR-related genes in Figure 3A.
(C) Lollipop plot showing −log10 p values of the relevance of various cell types to IR, prioritized by SRFS. Pie charts (bottom) show the proportion of patients whose IR might be driven by the corresponding cell type.
(D) Comparison of the proportion of RHGP in responders (n = 21) and patients with IR (n = 7). A bar chart (left) and representative IF images (right) illustrate the proportion of RHGP. p value: Mann-Whitney U test. Scale bars, 100 μm.
(E) Chromosomal ideogram and heatmap, annotated with response status of first-line therapy, showing that chr20q-gain was frequently observed in responders.
(F) Boxplot showing the association between RECIST changes and chr20q-gain. p value: two-sided Mann-Whitney U test.
(G) Kaplan-Meier estimates of PFS for patients segregated by chr20q-gain. p value: log rank test. HR: hazard ratio.
(H) Schematics of the protein structures showing the locations of SMAD4 mutations. MH: Mad homology.
(I) The association between RECIST changes and SMAD4 mutation. p value: two-sided Mann-Whitney U test.
(J and K) Kaplan-Meier estimates of PFS (J) and OS (K) for patients segregated by SMAD4mutated. p value: log rank test. See also Figures S7–S9.
As the most significant pro-sensitive IR-relevant factor at the DNA level, gain/amplification of chromosomal region 20q (hereafter referred to as 20q-gain) was detected in 26 cases (60.5%). We confirmed a higher incidence of 20q-gain in responders (80%, 20/25) relative to non-responders (33.3%, 6/18) before therapy (Figure 4E), suggesting the 20q-gain as a positive predictor of treatment response. To investigate the prognostic value of 20q-gain, we examined the association between 20q copy-number status and clinical outcome. Patients whose tumors had 20q-gain exhibited a profound reduction in tumor size following treatment (Figure 4F) and significantly improved PFS (p = 2.7e−2, Figure 4G), with no stark difference observed in the OS (Figure S7E). To verify this observation, we extracted publicly available CNA data from 67 patients with CRLM treated with oxaliplatin and/or irinotecan plus BVZ.28 As expected, 20q-gain was more frequent in the CR/PR group than in the SD/PD group (Figure S7F). Since CNAs may influence the genomic landscape of tumor cells and drive their evolution, we also explore whether 20q-gain is correlated to tumor cell plasticity. We conducted an analysis using the public CRC single-cell RNA-seq dataset (GSE13246532). Tumor cells were categorized into different CMS cell states, and the Shannon entropy index was used to measure the likelihood of tumor cell state transitions (Figure S7G). We revealed a significant increase in CMS2 tumor cells and lower cellular diversity in patients with 20q-gain, while those without 20q-gain showed greater intratumor heterogeneity and predominance of non-CMS2 subtypes. Hence, 20q-gain might be linked to BVZ-C responsiveness due to the enrichment of CMS2 tumor cells and reduced tumor cell plasticity, congruent with CMS subtype results (Figure 3A).
The SMAD4 mutations stood out as the strongest genomic predictor of IR (Figure 3A). The mutation rate of SMAD4 in this cohort was 16.3% (8/49). Four of the eight SMAD4-mutant cases (Figure 4H; Table S2) had recurrent hotspot mutations (R361H/C) in the MH2 domain involved in heterodimeric complex formation and transcriptional activation,33 and the other four patients carried missense mutations in nearby regions. All were intrinsically unresponsive (Figure S2). It was recently reported that SMAD4 loss in colon cancer cells is resistant to 5-FU and irinotecan.34 However, loss of SMAD4 did not distinguish responders from non-responders in our cohort (Figure S8A). In addition, the patient’s IR response was not affected by the expression level of SMAD4 (Figure S8A). Next, we examined the clinical relevance of SMAD4 mutations. Remarkably, SMAD4mutated patients experienced a more significant increase in tumor size following treatment (p = 3.5e−2) and had materially worse survival outcomes (p = 5.4e−3 for PFS and 8.8e−2 for OS by log rank test) than SMAD4wild-type patients (Figures 4I–4K). Intrigued by these findings, we replicated this observation in an independent cohort of patients diagnosed with stage IV CRC from three Chinese centers and treated with BVZ-C therapy. Droplet digital PCR was performed to analyze the SMAD4R361H and SMAD4R361C mutations in primary or metastatic CRC tumor samples from these cases. Importantly, patients harboring SMAD4R361H/C mutation had significantly worse PFS (p = 0.02 by log rank test, Figure S8B) compared to those with SMAD4wild-type, strengthening the prognostic value of SMAD4 mutations in predicting resistance to BVZ-C therapy. We also verified this association in the published Chinese ChangKang12 and MSK10 CRC cohorts. Consistently, the R361H/C group had significantly worse OS (Chinese ChangKang: p = 9.8e−3, MSK: p = 8.6e−4) compared to the SMAD4 wild-type group (Figures S8C and S8D). A similar tendency for PFS was also observed in the Chinese ChangKang cohort, although the result was insignificant (Figure S8C).
Furthermore, the SMAD4 mutations were mutually exclusive with 20q-gain in pre-treatment samples (Figure S8E). We next examined the relationship between the IR-related genetic (SMAD4 mutation and 20q-gain) and transcriptomic features (CMS subtype, cell type proportion, and gene expression). The CMS2 subtype showed a significant depletion in the SMAD4-mutant group but was markedly enriched in the 20q-gain group (Figures S8F and S8G). Additionally, the SMAD4-mutant group had a higher prevalence of the mixed subtype compared to wild type, indicating that SMAD4-mutant tumors may have greater intratumoral heterogeneity. No significant association was identified between the two genomic features and TME pro-sensitive (epithelial and NK cells) or pro-resistant (hepatocytes) cell types, but the SMAD4-mutant samples were distinguished by a higher proportion of endothelial and myeloid cells compared to wild type. Moreover, most pro-sensitive genes were upregulated in the 20q-gain group but downregulated in the SMAD4-mutant group, while pro-resistant genes showed the opposite trend, suggesting a strong concordance between genomic and transcriptomic response-related features. Compared with non-mutants, tumors with mutations in SMAD4 exhibited higher expression of metabolism (glucose transporter SLC1A1) and angiogenesis (vascular endothelial growth factor [VEGF] and semaphorin co-receptor NRP1)-associated genes. Concurrently, the elevated expression of myeloid markers (MRC1 and CD14) was observed, implying an increased myeloid cell infiltration in SMAD4-mutant tumors. In contrast, tumors harboring 20q-gain displayed strong upregulation of pro-sensitive genes on chromosome 20q. Taken together, SMAD4 mutations and 20q-gain might contribute to intrinsic drug resistance and sensitivity, respectively; and 20q-gain associated with the CMS2 subtype, whereas SMAD4 mutations associated with increased myeloid cell infiltration and the mixed CMS subtype.
To extend our findings into practical clinical applications, we utilized the identified resistance-related features to train a machine learning model (Figure S9A), which could assist in the early prediction of drug resistance in patients with CRLM. The model achieved an area under the receiver operating characteristic curve of 0.82 and effectively distinguished responders versus non-responders (Figures S9B and S9C). Notably, the key sensitive determinants in the model included TAF4 and TRPM6 expression and chr20q-gain (Figure S9D). TAF4, involved in transcription initiation, was previously linked to the maintenance of stem cell function.35 The top resistant informative features included the expression levels of SLC1A1, FGFR2, and ANO1 (Figure S9D). SLC1A1 was reported to be overexpressed in oxaliplatin-resistant CRCs.36 FGFR2 was a fibroblast growth factor receptor (FGFR), and prior studies have associated fibroblast growth factors and FGFRs with resistance to multiple cytotoxic agents, like cisplatin, tamoxifen, 5-FU, and BVZ.37 ANO1 was found to be associated with CRC progression.38 These evidence together supported that our model could be a useful tool for forecasting drug response to optimize the treatment and benefit patients in the clinic.
SMAD4R361 H/C induces resistance to BVZ and 5-FU in vitro and in vivo
To experimentally gauge the biological effect of SMAD4 mutations, we used the human CRC cell lines SW480 (SMAD4 negative) and HCT116 (SMAD4 positive and wild type), which were transduced with retroviral constructs expressing either SMAD4 wild-type or point mutations at the arginine 361 residue (R361) and containing an N-terminal FLAG tag (Figure S10A). We first explored the influence of SMAD4R361H/C mutations on BVZ treatment efficacy in vitro. The human umbilical vein endothelial cells (HUVECs) were incubated with tumor conditioned medium (TCM), which was derived from SMAD4-transduced tumor cells. After 48 h of culturing, we measured the changes in cell proliferation and tubular formation of HUVECs. Notably, immunofluorescence (IF) staining in HUVECs revealed unchanged or even higher expression levels of Ki-67 in SMAD4R361H/C groups after BVZ treatment, in contrast to the decreased expression in the control and wild-type groups (Figure 5A). Moreover, tube formation experiments showed that BVZ treatment significantly reduced the number of nodes in the control and wild-type groups; however, no changes were observed in the SMAD4R361H/C group (Figure 5B). In brief, these results suggested that SMAD4R361H/C tumors induced resistance to BVZ. Next, we focused on the common chemotherapeutic agents, mFOLFOX6 and FOLFIRI. Transfected SW480 and HCT116 cells were treated with increasing concentrations of 5-FU, irinotecan, or oxaliplatin (Figures 5C and S10B). Judging by the IC50 (half-maximal inhibitory concentration) values, the control cells were less sensitive to 5-FU and irinotecan relative to SMAD4WT cells, while there was no difference in response to oxaliplatin, in agreement with a previous report on drug resistance of SMAD4 loss.34 Importantly, compared to SMAD4WT cells, SMAD4R361H/C tumor cells were markedly resistant to 5-FU, but not to irinotecan or oxaliplatin (Figures 5C and S10B), which was further confirmed by colony formation and apoptosis assays (Figures S10C and S10D). Taken together, these results demonstrated that SMAD4R361H/C conferred in vitro resistance to BVZ and 5-FU.
Figure 5.

SMAD4R361H/C mutations promote 5-FU and BVZ resistance in CRC
(A) IF staining for Ki-67 (red) and DAPI (blue) in HUVECs incubated with tumor conditioned medium (TCM) collected from the indicated cells and BVZ (0.25 mg/mL). Representative IF images (left) and the quantification (right) of mean fluorescence intensity (MFI) are shown (n = 4–5). Scale bar, 100 μm.
(B) Representative images (left) and quantification (right) of the formation of HUVECs tubules following incubation with TCM and treatment with BVZ (n = 4–5). Scale bar, 100 μm.
(C) Cell viability assay of SW480 and HCT116 cells following treatment with 5-FU for 48 h, IC50 value of 5-FU (bottom) and representative curve-fitting graphs (top) are shown (n = 5, 7).
(D) Stably transfected CT26 cells were subcutaneously injected in BALB/c mice. Mice were treated with PBS, 5-FU (25 mg/kg), or 5-FU (25 mg/kg, twice a week) combined with monoclonal BVZ (B20.4-1.1, 5 mg/kg, twice a week). Representative images (left) and tumor growth curve (right) are shown (n = 3).
(E and F) Transplanted subcutaneous tumors with treatment are collected for immunohistochemical staining of Ki-67 (E) and immunofluorescence of vascular marker CD31 (F); blue: DAPI, red: CD31. Scale bar, 100 μm. Data are graphed as the mean ± SD; ∗, p < 0.05; ∗∗, p < 0.01; ∗∗∗, p < 0.001; ns, non-significant, p > 0.05. See also Figure S10.
To extend these findings in vivo, we transduced murine CT26 cells with Smad4WT or Smad4R361H/C constructs and subcutaneously injected them into BALB/c mice, followed by treatment with 5-FU and monoclonal BVZ (B20.4–1.1, anti-VEGF antibody). In the control and Smad4WT groups, 5-FU or 5-FU plus BVZ treatment significantly improved tumor growth inhibition compared to PBS treatment, whereas tumor volume showed no change in the Smad4R361H/C groups receiving the same therapies (Figure 5D). Similar results were obtained using immunohistochemical staining for Ki-67 (Figures 5E and S10E). Additionally, CD31-marked tumor vessels showed a remarkably decreased density in the control and Smad4WT groups after treatment, especially with 5-FU plus BVZ, but no significant trend was found in the Smad4R361H/C groups (Figures 5F and S10E). Collectively, these findings provided compelling evidence of in vivo resistance to BVZ and 5-FU in SMAD4R361H/C-harboring CRC tumors.
GB201 combination treatment ameliorates resistance in SMAD4R361 H/C CRCs
Next, we sought to identify the potential mechanisms underlying BVZ and 5-FU resistance induced by SMAD4 mutations. To this end, we conducted GSEA comparing pre-treatment RNA samples with and without SMAD4 mutations. GSEA revealed that the inflammatory response and TNFA signaling via NF-κB, IL-2-STAT5, and IL-6-STAT3 were enriched in SMAD4-mutant samples (Figure S11A). Based on this, three inhibitors, JSH-23 (NF-κB inhibitor), AC-4-130 (STAT5 inhibitor), and STATTIC (STAT3 inhibitor), were tested in CRC cell lines; the IC50 values showed that mutant cells were more sensitive to the STAT3 inhibitor, highlighting the importance of STAT3 signaling in SMAD4R361H/C tumor resistance (Figure S11B). Western blotting (WB, Figure 6A) and IF staining (Figure 6B) of pSTAT3 together confirmed the elevated phosphorylated STAT3 in SMAD4R361H/C cells. Co-immunoprecipitation (Co-IP) experiments were conducted to examine functional connections. Intriguingly, SMAD4R361H/C mutations bound to the pSTAT3 protein and impeded its interaction with tyrosine phosphatase SHP2, protecting pSTAT3 from dephosphorylation (Figures 6C and S11C). This mechanism resembles that observed in p53 mutations.39 Thus, our data showed that SMAD4R361H/C mutation could hyperactivate STAT3 through competitive displacement of SHP2 (Figure 6D).
Figure 6.

GB201 can target SMAD4R361H/C mutation-mediated activation of the pSTAT3 pathway to reverse resistance in CRC
(A) Western blot analysis of pSTAT3 protein in SW480 and HCT116 cells.
(B) IF staining for FLAG-labeled SMAD4 protein (green), pSTAT3 protein (red), and DAPI (blue) in SW480. Scale bar, 100 μm.
(C) Co-IP assay shows a complex containing pSTAT3 and FLAG-SMAD4R361H, SMAD4R361C, or SHP2 in SW480 cells. Top, FLAG antibody co-precipitating pSTAT3. Bottom, pSTAT3 antibody co-precipitating FLAG-SMAD4R361H, SMAD4R361C, or SHP2 protein. Input, protein expression in cell lysates detected by western blot. IgG, negative control. IP, expression of compound co-precipitated by pSTAT3 or FLAG antibody.
(D) Schematic diagram of SMAD4R361H/C protein activating pSTAT3 through competitive binding with SHP2.
(E) Cell viability of SW480 and HCT116 cells with SMAD4R361H/C exposed to 5-FU at the gradient concentrations, with or without combination with GB201.
(F) IC50 value of SW480 and HCT116 cells with SMAD4R361H/C exposed to GB201 is shown (n = 3, 4).
(G) Stably transfected CT26 cells with Smad4R361H/C were subcutaneously injected in BALB/c mice. Mice were treated with PBS, 5-FU (25 mg/kg, twice a week) combined with monoclonal BVZ (5 mg/kg, twice a week), GB201 (10 mg/kg, q2d), and three-drug combination for 2 weeks. Representative images (left) and tumor growth curve (right) of transplanted subcutaneous tumors of CT26 cells with Smad4R361H/C are shown (n = 5).
(H) Transplanted subcutaneous tumors with treatment and Smad4R361H/C are collected for IF staining of CD31, representative IF images and the quantification are shown; blue: DAPI, red: CD31. Scale bar, 100 μm.
(I) Representative immunohistochemical staining for Ki-67 and pSTAT3 and their quantification of xenograft tumor with Smad4R361H/C mutations. Scale bar, 100 μm. See also Figure S11.
To further understand the mechanism of BVZ resistance, we re-examined the DEGs in SMAD4-mutant versus SMAD4-WT CRLM samples. The results revealed a significant upregulation of several chemokines in the inflammatory response pathway, such as CCL2, CCL7, and CCL22, in SMAD4-mutant samples, with qPCR assays further confirming the upregulation of CCL2 in SMAD4R361H/C CRC cell lines (Figures S11D and S11E). This led us to speculate that CCL2 may be involved in BVZ resistance. Next, we knocked down STAT3 in SMAD4R361H/C tumor cells using small interfering RNA and collected their tumor culture supernatant after 48 h to stimulate HUVECs (Figures S11F–S11I). STAT3 knockdown in tumor cells inhibited endothelial cell proliferation and tube formation, effectively attenuating SMAD4R361H/C-induced BVZ resistance. Conversely, exogenous addition of CCL2 enhanced cell proliferation and tube formation to restore BVZ resistance. These data substantiated that SMAD4R361 H/C might induce resistance to BVZ in CRC via the pSTAT3-CCL2 axis.
Given the crucial role of STAT3 signaling in SMAD4R361H/C CRC, we used STATTIC and GB201 (both STAT3 inhibitors) in combination with 5-FU to explore combinatorial treatment efficacy through drug-sensitive experiments. In contrast to STATTIC, GB201 significantly reduced 5-FU resistance (Figures 6E, 6F, and S11J). WB experiments further confirmed the notable inhibitory effect of GB201 on the pSTAT3-CCL2 axis (Figure S11K). Therefore, we established Smad4-mutant CRC animal models and administered them with single-agent GB201, doublet therapy (BVZ and 5-FU), and triplet therapy (BVZ, 5-FU, and GB201). The results showed that GB201 effectively restored sensitivity to BVZ and 5-FU in Smad4R361H/C groups (Figure 6G), with a three-drug combination significantly abating tumor vessels and proliferation (Figures 6H and 6I). Based on the upregulation of STAT3 signaling in SMAD4R361H/C tumors, we proposed the addition of GB201 to BVZ-C therapies as a novel drug repurposing strategy to overcome therapeutic resistance in SMAD4R361H/C CRC.
Discussion
Here, we gathered a large cohort of multi-time point samples to study in-depth tumor and microenvironment evolution in patients with CRLM before and after BVZ-C therapy. Previous studies have shown that secondary drug resistance is often heterogeneous, possibly due to polyclonal and multiple selection patterns.40 In contrast, we found that 92% of patients exhibited linear tumor evolution under treatment, with only four cases acquiring notable mutations post treatment. Moreover, high similarities were observed in the tumor expression profiles after treatment. Thus, tumor clonal selection is not the major mechanism behind AR to BVZ-C, rendering the targeting of clonal subpopulations an unviable approach to counteract AR. Phenotypic plasticity, or non-genetic reprogramming, has been listed as one of the 14 hallmarks of malignancy41 and is another critical determinant in mediating tumor drug resistance.42 Transcriptional analyses revealed a dramatic increase in hepatocyte and myeloid cell composition after therapy, indicating that reprogramming of microenvironmental cells, rather than tumor cells, may be the primary driving force behind secondary resistance.
Next, we screened AR- and IR-related features using the SRFS method. Interestingly, increased hepatic infiltration of tumor cells not only predicts primary non-response to BVZ-C but also correlates with disease progression, suggesting the potential enhancement of hepatocyte-tumor cell interactions under treatment. Combining the histopathological, immunofluorescence, and CT data of clinical patients, we found that the RHGP largely contributed to IR and AR to BVZ-C therapy, consistent with previous findings.17,18 The liver is highly vascularized, and drug resistance in RHGP-type CRLMs is often associated with vascular co-option, in which cancer cells can infiltrate the hepatic plate of the liver parenchyma and absorb pre-existing hepatic sinusoidal vessels.30 Therefore, co-targeting angiogenesis and vascular co-option is expected to be the key to reversing drug resistance in patients with CRLM; however, the underlying molecular mechanisms require further investigation.
The SRFS method revealed two predictive markers for IR: (1) 20q-gain with favorable response and (2) SMAD4 mutation with unfavorable response. The 20q-gain showed the CMS2 tumor cell predominance and was related to reduced intratumor heterogeneity. According to previous reports, chr20q amplification is related to the immune-cold microenvironment in CRC43 and lymph node metastasis in breast cancer.44 Therefore, CRC with or without 20q-gain may be suitable for different treatment options. 20q-gain tumors could potentially benefit from targeted combination chemotherapy, whereas immunotherapy or drugs such as tipifarnib, mitomycin-C, and AUY92243 may hold promise for 20q-neutral tumors. SMAD4 is a key component of the TGF-β pathway, and its mutations often lead to selective elimination of the anti-tumor effect of TGF-β, thereby promoting tumor growth and progression.45 SMAD4 mutations have been reported to occur in approximately 8.6% of CRC cases,46 are more common in patients with stage IV and CMS3 subtypes,47 and are associated with worse OS and disease-free survival.48 A few studies have revealed correlations between SMAD4 loss and 5-FU49 or cetuximab resistance.50,51 In this study, we found that SMAD4R361H/C mutation mediated BVZ and 5-FU cross-resistance in CRC cells through in vivo and in vitro experiments but had no impact on sensitivity to oxaliplatin and irinotecan. In addition, SMAD4R361C exhibited greater 5-FU resistance than SMAD4R361H in vitro, but this difference was not observed in mouse models. Previously, the biological function of SMAD4-mutant protein was rarely reported, and its understanding was limited to cell cycle disorder and apoptosis caused by SMAD4 protein inactivation.52 We proved that SMAD4R361H/C can activate the pSTAT3 pathway to mediate BVZ and 5-FU cross-resistance through the competitive combination of pSTAT3 and SHP2, as well as activate pSTAT3-CCL2 axis (pro-vascular redundancy signal) to mediate BVZ resistance.
The STAT3 pathway has been widely reported to play a role in regulating the expression of various chemokines and cytokines.53 Prior research also suggested that STAT3 can directly bind the promoter of CCL2, thereby activating its transcription and expression in CRC.54 Our investigation further elucidated that the SMAD4R361H/C led to the activation of STAT3, which induced the secretion of CCL2. Additionally, CCL2 can enhance inflammatory responses by recruiting myeloid cells into TME, and it can also promote STAT3 phosphorylation.55,56 Together, the SMAD4R361H/C augmented the expression of inflammatory chemokines such as CCL2 by activating STAT3, and STAT3-CCL2 regulatory relationship could further stimulate inflammation in TME. GB201 (also known as napabucasin or BB608) is the only STAT3 inhibitor that has entered phase 3 clinical trials. In 2016, the FDA approved GB201 for the treatment of gastric cancer57 and pancreatic cancer58; subsequent phase 3 trials failed. The results of a phase 3 clinical trial (NCT01830621) of patients with CRC also showed no difference in OS between the GB201 and placebo groups.59 However, subgroup analysis showed that GB201 significantly benefited the high pSTAT3 expression subgroup.59 Our experiments showed that pSTAT3 was significantly activated in SMAD4R361H/C CRC, and GB201 combined with 5-FU and BVZ significantly inhibited the growth of SMAD4R361H/C CRC, indicating the importance of patient screening as a crucial breakthrough for effective GB201 treatment.
Here, our study identified hepatocyte-tumor spatial proximity and increased myeloid cell infiltration, rather than clonal selection and transcriptional reprogramming of tumor cells, as the primary causes of resistance to BVZ-C therapy in CRLMs. Importantly, we demonstrated that SMAD4R361H/C serves as a genomic marker, which provides a stratification basis and therapeutic target for the first-line therapy of CRC, and GB201 combination therapy is expected to reverse BVZ-C therapeutic resistance. Finally, we summarized the BVZ-C response-associated features as well as the well-known factors13,30,39,54,55,56,60,61,62,63,64,65 as a diagram to connect the different feature categories (Figure S12).
Limitations of the study
There are some limitations to our study. Although our large cohort of multi-time point samples enabled the study of IR and AR to BVZ-C therapy, independent multi-source studies are needed to validate the predictive role of the identified response-related factors. In addition, the association between AR and spatial proximity of hepatocytes or myeloid cells to tumors cannot be investigated via the bulk transcriptomic data, and the longitudinal spatial transcriptomics should be included to further evaluate the spatial and architectural features.
Resource availability
Lead contact
Further information and requests for resources and data should be directed to and will be fulfilled by the lead contact, Wangjun Liao (liaowj@smu.edu.cn).
Materials availability
All materials used in this paper are available from the lead contact upon request.
Data and code availability
-
•
The raw sequence data were deposited in the Genome Sequence Archive at the National Genomics Data Center, under the accession code GSA: HRA005455.
-
•
All code has been deposited in Zenodo and can be accessed at https://doi.org/10.5281/zenodo.13997442.
-
•
Any additional information required to reanalyze the data reported in this paper is available from the lead contact upon request.
Acknowledgments
This study was supported by grants from Guangdong Province Science and Technology Plan Project (no. 2020A0505090007) and the Guangdong Basic and Applied Basic Research Foundation (no. 2022A1515011693), the Seed fund of the Big Data for Bio-Intelligence Laboratory (Z0428) from HKUST, Hong Kong Research Grant Council (16101021, R4017-18, and C4008-23W), and Hong Kong Innovation and Technology Commission (ITCPD/17-9). Jiguang Wang was also supported by the Padma Harilela Professorship.
Author contributions
Conceptualization, W.L. and Jiguang Wang; computational analyses, Y.Y., with help from D.Z., Z.M., X.Z., R.L., Q.M., H.S., and J.T.; experiments, M.S., Jiao Wang, Z. Wang, J.C., and G.H.; surgery, W.L., M.S., N.H., C.W., X.R., and Z. Wu; data curation, G.H., Y.G., D.Z., and J.G.; writing – original draft, Y.Y., N.H., and Q.H.; writing – review and editing, Y.Y., Q.H., D.Z., Z.M., and Jiguang Wang.
Declaration of interests
The authors declare no competing interests.
STAR★Methods
Key resources table
| REAGENT or RESOURCE | SOURCE | IDENTIFIER |
|---|---|---|
| Antibodies | ||
| Rabbit anti-SMAD4 | CST | Cat# 46535; RRID: AB_2736998 |
| Rabbit anti-DYKDDDDK | CST | Cat# 14793; RRID: AB_2572291 |
| Rabbit anti-STAT3 | CST | Cat# 12640; RRID: AB_2629499 |
| Rabbit anti-phospho-STAT3 (Tyr705) | CST | Cat# 9145; RRID: AB_2491009 |
| Rabbit anti-SHP2 | CST | Cat# 3397; RRID: AB_2174959 |
| Mouse monoclonal anti-SMAD4R361H | NewEast Biotechnologies | Cat# 26422; RRID: AB_2629384 |
| Mouse monoclonal anti-β-Actin | Proteintech | Cat# 60008-1-Ig; RRID: AB_2289225 |
| Mouse monoclonal anti-GAPDH | Proteintech | Cat# 60004–1-Ig; RRID: AB_2107436 |
| Mouse monoclonal anti-CCL2 | Proteintech | Cat# 66272-1-Ig; RRID: AB_2861337 |
| Rabbit anti-Ki-67 | Proteintech | Cat# 27309-1-AP; RRID: AB_2756525 |
| Rabbit anti-CD31 | Proteintech | Cat# 11265-1-AP; RRID: AB_2299349 |
| Alexa Fluor 647-labeled Goat Anti-Rabbit IgG | Beyotime | Cat# A0468; RRID: AB_2936379 |
| Chemicals, peptides, and recombinant proteins | ||
| STATTIC | MCE (MedChemExpress) | Cat# HY-13818 |
| JSH-23 | MCE (MedChemExpress) | Cat# HY-13982 |
| AC-4-130 | MCE (MedChemExpress) | Cat# HY-124500 |
| GB201 | MCE (MedChemExpress) | Cat# HY-13919 |
| Recombinant CCL2 protein | MCE (MedChemExpress) | Cat# HY-P7237 |
| 5-FU | Hainan Zhuotai Pharmaceutical Co., Ltd | N/A |
| Oxaliplatin | Jiangsu Hengrui Pharmaceuticals Co., Ltd | N/A |
| Irinotecan | Selleck | Cat# S5026 |
| Bevacizumab | Roche Pharma (Schweiz) Ltd | N/A |
| B20.4–1.1 | Genentech | N/A |
| Deposited data | ||
| Raw DNA sequencing data | Bao et al.44 | PRJNA635121 |
| MSK mutation data | Yaeger et al.10 | PRJEB2384 |
| ChangKang mutation data | Zhao et al.12 | HRA000873 |
| TCGA mutation data | Cerami et al.66 | https://www.cbioportal.org/study/summary?id=coadread_tcga |
| CRLM single cell data | Sathe et al.27 | https://dna-discovery.stanford.edu/research/datasets |
| CRLM spatial transcriptomic data | Wu et al.29 | OEP001756 |
| CRLM RNAseq raw data | This paper | HRA005455 |
| CRLM WES raw data | This paper | HRA005455 |
| Software and algorithms | ||
| bwa | Li et al.67 | http://maq.sourceforge.net/ |
| fastp | Chen et al.68 | https://github.com/OpenGene/fastp |
| SAVI2 | Hu et al.69 | https://github.com/WangLabHKUST/SAVI |
| samtools | Li et al.70 | http://samtools.sourceforge.net/ |
| Facets | Shen et al.71 | https://github.com/mskcc/facets |
| MANTIS | Kautto et al.72 | https://github.com/OSU-SRLab/MANTIS |
| ape | Paradis et al.73 | https://cran.r-project.org/web/packages/ape/index.html |
| Cello2-R | Jiang et al.24 | https://github.com/WangLabHKUST/CELLO |
| STAR | Dobin et al.74 | https://github.com/alexdobin/STAR |
| featureCounts | Liao et al.75 | http://subread.sourceforge.net/ |
| Comb-seq | Zhang et al.76 | https://github.com/zhangyuqing/ComBat-seq |
| ESTIMATE | Yoshihara et al.77 | http://www.bioconductor.org/ |
| DESeq2 | Love et al.78 | http://www.bioconductor.org/ |
| limma | Ritchie et al.79 | http://www.bioconductor.org/ |
| GSEA | Subramanian et al.80 | https://www.gsea-msigdb.org/gsea/index.jsp |
| Enrichr | Chen et al.81 | https://maayanlab.cloud/Enrichr/ |
| CMSclassifier | Guinney et al.11 | https://github.com/Sage-Bionetworks/CMSclassifier |
| BayesPrism | Chu et al.26 | https://github.com/Danko-Lab/BayesPrism |
| spacexr | Cable et al.82 | https://github.com/dmcable/spacexr |
| Python (3.8.5) | Anaconda | https://www.anaconda.com/ |
| R (4.2.2) | CRAN | https://cran.r-project.org/ |
| Python code | This paper |
https://github.com/WangLabHKUST/CRLM https://doi.org/10.5281/zenodo.13997442 |
Experimental model and study participant details
Clinical sample acquisition and treatment response evaluation
Patients’ samples were collected and analyzed after informed consent was obtained and approved by the ethics committee (NFEC-2017-206) of Nanfang Hospital, Southern Medical University (Guangzhou, China). The enrolled patients with clinically and histologically confirmed colorectal cancer liver metastases (CRLM) were defined by the American Joint Committee on Cancer guidelines. Forty-nine patients with unresectable CRLM were recruited. Thirty-six patients were treated with mFOLFOX6 (modified fluorouracil, leucovorin, and oxaliplatin) plus bevacizumab, and the other thirteen were treated with FOLFIRI (fluorouracil, leucovorin, and irinotecan) plus bevacizumab (Table S1). A liver biopsy was performed in all patients before initial treatment, and the same site was biopsied within one week after response evaluation and blood samples as ref.14. Two patients received a fourth biopsy, and 13 patients received a third biopsy as the tumor progressed. Therapeutic responses were defined by Response Evaluation Criteria in Solid Tumors (RECIST 1.1) and assessed radiographically about every four treatment cycles. The RECIST of the biopsy and RECIST of all evaluated lesions were used to determine of responders and non-responders (Figure S1C). Progression-free survival (PFS),83 the period from the start of treatment until the first of disease progressed, and overall survival (OS),83 the period of patient survival after the start of treatment. The biopsy specimens were paraffin-embedded and stored in RNAlater (Qiagen, Düsseldorf, Germany), respectively. Suppose tumor content was estimated to be over 40% after a thorough pathological review; tumor RNA and DNA were extracted from freshly obtained tissues. Next, the whole-exome sequencing (WES, n = 44), panel sequencing data (n = 5), and RNA sequencing of the tumor biopsy specimens were parallelly performed. As for blood samples, plasma, and blood cells were sub-packaged into 500 pL per vial and stored at 80°C until use.
Cell lines
Human colorectal cancer cell lines SW480 and HCT116 were obtained from were purchased from Guangzhou Jennio Biological Science and Technology Ltd (Guangzhou, China), and murine colon cancer cell line CT26 was obtained from the Center for Typical Culture Collection, Chinese Academy of Sciences (Shanghai, China). All cells were cultured with RPMI 1640 medium (Solarbio, 31800) with 10% fetal bovine serum (Hyclone, USA) in a 5% CO2 incubator at 37°C. For site mutation of SMAD4, cells were stably transfected with pHBLV-CMV-MCS-3FLAG-EF1-Luc-T2A-Puro constructs (Hanbio, China) and subsequently selected with puromycin medium (Invitrogen) according to the manufacturer’s instructions, with western blotting used to verify the efficiency of the sequence.
Animals
All animal experiments were conducted by the Public Health Service Policy in Humane Care and Use of Laboratory Animals and were approved by the Ethical Committee of Southern Medical University. BALB/c male mice aged 4–5 weeks were purchased from the Experimental Animal Center, Southern Medical University (Guangzhou, China). To assess the effectiveness of 5-FU and bevacizumab on colon cancer with different states of the SMAD4 gene, 1×10⁷ transfected CT26 cells were subcutaneously injected into the left flank of mice. One week after cell inoculation, mice were treated with PBS, 5-FU (25 mg/kg, i.p., twice a week), or 5-FU combined with monoclonal BVZ (B20.4–1.1, 5 mg/kg, i.p., twice a week) for two weeks. Tumor volumes and mice weight were measured every two days. Tumor volume was calculated using the formula V = 0.5×L×W,2 where V is the volume, L is the length, and W is the width. After two weeks, the mice were euthanized to compare tumor weight and volume, and tumors were collected for immunohistochemistry and immunofluorescence staining. In addition, to verify the effect of GB201 on reversing 5-FU and bevacizumab resistance, 1×10⁷ transfected CT26 cells with SMAD4R361H or SMAD4R361C mutation were respectively injected into mice subcutaneously. Mice were randomly divided into four groups. Each group was administered one of the following: PBS, 5-FU (25 mg/kg, i.p., twice a week) combined with monoclonal BVZ (5 mg/kg, i.p., twice a week), GB201 (10 mg/kg, i.p., q2d), and three-drug combination. Tumor volumes and mice weights were measured and recorded, and the mice were euthanized after two weeks.
Method details
DNA extraction and library construction
Genomic DNA was extracted from blood and tissue samples using the TIANamp Blood DNA Kits and TIANamp Genomic DNA Kits (Tiangen Biotech, Beijing, China), respectively, following the manufacturer’s protocols. The extracted DNA was then fragmented using the ultra-sonicator UCD-200 (Diagenode, Seraing, Belgium). Subsequently, the fragmented DNA was purified and size-selected using magnetic beads (Beckman, MA, USA). The quality of the DNA was assessed using the Qubit 2.0 Fluorometer with the Quanti-IT dsDNA HS Assay Kit (Thermo Fisher Scientific, MA, USA). For library construction, the fragmented DNA was hybridized to the SeqCap EZ Exome 64M (Roche NimbleGen, Madison, WI, USA), following the manufacturer’s instructions. The sequencing process was performed using the Gene+ Seq-2000 platform with 2 × 100-bp paired-end reads. To ensure data integrity, an in-house script was utilized to remove terminal adaptor sequences and low-quality reads from the raw data.
Somatic mutation detection
Raw fastq files were aligned to hg19 reference using bwa mem with default parameters after fastp quality checking.67,68 Picard MarkDuplicates was applied to mark PCR duplicates. Aligned bam files of longitudinal (pre- and post-samples) tumors and matched normal blood were subjected to SAVI2 for somatic SNV/Indel calling which takes advantage of samtools for variant identification as before.69 We set the parameter as ‘--conf 1e−5 --precision 5’ to acquire more accurate mutational allele frequency (MAF). To remove false positives, we added three features to SAVI2 PD-filter report, including PON (all SNPs from blood samples were used to build a Panel of Normal variant set), AltNormal (altered reads in corresponding blood control bam files), and MQ0 (average number of reads with mapping quality of zero measured by sambamba84). The somatic mutation candidates were acquired based on the jointly filtering criteria: (1) MAF in blood ≤1%, altered depth in blood ≤2, altered depth in tumors >2; (2) not present in Meganormal database; (3) PON ≤2, MQ0 ≤ 5; AltNormal ≤2 for WES, AltNormal ≤15 for Panel; (4) not reported as common SNPs; (5) non-synonymous mutations. We then sought to identify mutated genes that (1) were reported in the Cancer Genome Atlas Network (TCGA, 2012)85 analysis of CRC. The background mutation rate of each gene was calculated from 223 TCGA tumors (downloaded from cBioPortal).66 Droplet Digital PCR (ddPCR) was used to detect the SMAD4R361 H/C mutations in CRC tumor samples from the independent cohort. The cases supported by > 5 positive droplets and >0.5% fractional abundance were categorized as mutant; otherwise, they were classified as wild-type.
Somatic copy number alteration
Facets was applied to estimate somatic copy number alterations and tumor purity using WES/Panel sequencing data of tumor and matched blood.71 The detailed parameter for embedded samtools mpileup was ‘-q15 -Q20’ when other parameters were set as default. By taking the tumor purity (p) into account, the arm-level and cytoband-level copy number status was determined: a) copy number gain: the segment log2 ratio ≥ log2((2 + p)/2); b) copy number loss: the segment log2 ratio ≤ log2((2-p)/2). Copy number heterogeneity (CNH), defined as the average proportion of malignant cells that differ by one copy from the mode copy number value at each position of the genome was predicted using CNH MATLAB code25 for each sample.
Microsatellite instability prediction
To estimate microsatellite instability status for each tumor sample, we applied MANTIS v1.0.472 with tumor-normal BAM files as input. RepeatFinder function with default parameters was firstly used to capture microsatellite loci within hg19 reference genome. Next, we run python program “mantis.py” with the following parameters: -mrq = 20.0, -mlq = 25.0, -mlc = 20, -mrr = 1. Samples with StepWise Difference (DIF) score between the tumor and normal distributions ≥0.4 were assigned “MSI-H” as recommended by the algorithm, and hence all samples were predicted as MSS.
Evolutionary tree
Somatic SNV/Indel of Pre, Post1, Post2 and Post3 samples from WES data were transformed as a binary matrix as representation of somatic mutation status, with 0 for wildtype and 1 for mutant. Then the matrix of each patient was subjected to calculate sample distance using adist function in R. Further, neighbor-joining tree estimation was completed using nj function from ape package.73,86 Finally, the evolutionary tree of longitudinal timepoints was visualized in an unrooted manner. For each tree, the length of tree is proportional to the somatic mutation number. Cello2-R was used to obtain three-dimensional frequency of key driver altered genes and moduli space analysis were performed to represent the evolutionary patterns following therapy using Cello2-MATLAB.24 In the ternary plot, three variables, which sum up to a constant, are depicted on a two-dimensional graph using a barycentric plot. Specifically, the plot illustrates the fractions of mutations that are shared between pre-treatment and post-treatment, mutations that are private to the pre-treatment stage, and mutations that are private to the post-treatment stage, all of which have been adjusted using the ETRIP program and were represented in a matrix of three columns. The fractions matrix was subjected to K-means clustering with clusters parameter set to three and visualized using Cello2 in MATLAB, which could also be done using ggtern function in ggtern R package.
ETRIP (Evolutionary Tree Inference Program) is used to enhance the accuracy of phylogenetic tree inference by effectively estimating the underestimated mutations in tumor samples caused by factors such as low-purity or low-sequencing depth in DNA sequencing data. The real mutation allele spectrum (real MAS) is defined as the distribution of mutational allele frequency (MAF). The measured mutation allele spectrum (measured MAS) is defined as the distribution of calculated MAF, which is obtained by dividing the number of positive reads by the total reads. ETRIP first partitioned MAS into intervals, namely , where means the number of alleles with MAF in . In real MAS, denoted as , with ranging from 1 to , while in measured MAS, denoted as , with ranging from 0 to where means the number of undetected alleles, i.e., false negatives. The purity of real MAS is 1, while the measured MAS has a purity of , determined by the sample purity. ETRIP mimicked the process by a function that mapped the real MAS to the expected measured MAS () based on predetermined purity and read depth parameters. Subsequently, it generated an inferred real MAS whose measured MAS fits the observed measured MAS. To evaluate the accuracy of fitness, a chi-square score is computed. Ultimately, ETRIP calculates the false-negative rates for both pretreatment and post-treatment samples and regenerates the evolutionary trees.
The generation of the function is based on two assumptions.
-
1.
For an allele, the number of reads (including positive reads and negatives) follows Poisson distribution , where is read depth and is a positive integer.
-
2.
For an allele with reads, the number of positive reads follows binomial distribution , where MAF is the allele frequency when purity is 1, is an integer between 0 and . Particularly, for an allele in the -th interval in MAS, its MAF can be approximated to when is large. Then .
Therefore, the contribution from the alleles in the -th interval in real MAS to the -th interval in measured MAS is
Hence, the expected value of is derived as
And the function is generated.
Chi-square scoring system is used to evaluate the fitness between expected measured MAS and observed measured MAS which is obtained from DNA-seq data. It calculates with the degree of freedom . The higher score indicates less confidence or less fitness. ETRIP infers the real MAS with purity = 1 from the observed MAS with purity = by performing the following steps.
-
1.
generate a rough candidate real MAS n.
-
2.
calculate , which is the expected measured MAS.
-
3.
calculate Chi-square score between and s.
-
4.
iterate each element in , modify its value, perform step 2 and 3 again, compare the scores before and after modification, keep the version of with lower score.
-
5.
repeat step 4 until no modification is applied.
-
6.
output as inferred real MAS.
With the inferred real MAS, ETRIP calculates and hence false negative rate of Pre () and Post () respectively. Then ETRIP infers the evolutionary tree by solving the following maximum likelihood equations.
The process of inferring the evolutionary tree is completed after resolving three false negative rates.
RNA extraction and library construction
For RNA extraction from tissue samples, the Trizol reagent was employed. Subsequently, strict quality control measures were implemented for the RNA samples, which encompassed three main aspects. Firstly, concentration and total quantity were assessed using Qubit 4.0. Secondly, the integrity of the RNA samples was evaluated using the Agilent 2100 Bioanalyzer (Agilent Technologies, CA, USA). Lastly, sample purity was evaluated using the NanoDrop spectrophotometer. Following quality assessment, RNA sequencing libraries were constructed using the TruSeq RNA Sample Prep Kits, v2 (Illumina, CA, USA). Once the library construction was completed, an initial quantification was carried out, and the library was subsequently diluted. The distribution of library fragments was determined using the Agilent 2100 DNA 1000 Kit. Finally, the library was sequenced using a Gene+ Seq-2000 sequencer. Similar to the earlier DNA sequencing process, an in-house script was utilized to remove terminal adaptor sequences and low-quality reads from the raw data.
Bulk RNA-seq preprocessing
Data quality control was performed with fastp.68 Reads were aligned to the human reference genome (GRCh38) using STAR v2.7.0days.74 Gene count tables were generated by featureCounts75 and normalized as Fragments Per Kilobase Million (FPKM). Comb-seq76 was used for batch correction. The ESTIMATE algorithm77 was used to infer tumor purity from bulk tissue samples.
Differential gene expression analysis, pathway analysis and gene set enrichment
For the analysis of differentially expressed genes, we restricted our analysis on protein-coding transcripts. DESeq2 v.1.32.078 (two-sided Wald-test and Benjamini-Hochberg FDR correction) or limma v3.48.3 was used to identify genes differentially expressed between two groups. Comparison of pathway activity between pre-treatment and posttreatment samples was performed by Gene Set Enrichment Analysis (GSEA)80 of 50 MSigDB hallmark gene sets.87 The enriched gene sets with normalized enrichment score >1.2 or < −1.2 were selected in Figure 2H. The AR and IR gene list was analyzed using Enrichr81 to identify significantly enriched pathways (p < 0.05), and the pathway rankings were determined based on the p values (Figures 3B and 4B). The AR gene signature score (Figure S6E) was computed by taking the weighted average expression (log2FPKM) of 80 resistant genes and subtracting the weighted average expression of 20 sensitive genes for each sample. The weights assigned to each gene were based on their AR contribution.
Sample-based response feature selection
To identify molecular determinants related to BVZ-based chemotherapy response, we developed Sample-based Response Feature Selection (SRFS). In the initial phase, SRFS pooled all available samples together to increase our statistical power for detecting changes and then we excluded the post-therapy samples with PR to eliminate ambiguous response annotations. Following this, the remaining samples were re-annotated based on their subsequent timepoint responses to roughly reflect how tumors would react to the upcoming treatment. In the second phase, SRFS categorized the samples into two groups - sensitive (PR, n = 27) or resistant group (SD or PD, n = 64) - based on their updated response. For genomic features, SRFS gauged their discriminative potential between the two groups using a two-sided Fisher’s exact test, while transcriptomic features were assessed in a univariate logistic regression model. Significant features were categorized as either resistance-related or sensitivity-related. In the third phase, for resistance-related features, SRFS assessed their contribution to IR by calculating the proportion of patients consistently displaying genomic alterations or higher gene expression (using average expression as a threshold) throughout the treatment period, among all IR patients. Conversely, for sensitivity-related features, IR contribution counted the patients consistently lacking genomic alterations or showing lower gene expression throughout treatment. In the context of AR contribution, resistance-related genomic features measured the proportion of patients developing genomic alterations post-treatment among all AR patients, while sensitivity-related features focused on lost alterations. For transcriptomic features, resistance-related ones considered patients with an increased gene expression trend (from low to high) post-treatment, while sensitivity-related features assessed the declining trend. To decouple AR-from IR-related features, we defined the AR features as AR contributions exceeding the average (43.6%) of all significant genes, while IR features were defined as contributions surpassing the average (47.3%) of IR contributions. Features such as somatic mutations, copy number alterations, tumor purity and ploidy, CNH, mutation burden, and CMS subtypes were classified as AR and IR features if their contributions exceeded 30%. Cell type proportions were categorized using a cutoff of 20%.
Bulk transcriptional subtype classification
Consensus Molecular Subtypes (CMS)11 were applied using classifyCMS.SSP function within CMSclassifier v1.0.0. All CMS subtypes with minCor>=0.15 and minDelta>=0.06 were assigned to the sample in SSP.predictedCMS output while the “mixed” CMS subtypes were defined by ‘NA’ (unclassified) results with minCor<0.15 or minDelta<0.06.
Deconvolution analysis
The BayesPrism v1.426 was used to infer the relative cellular proportions and cell type-specific gene expression matrices. Reference scRNA-seq count matrix was extracted from a previous paper,27 which identified eight cell types including tumor epithelial cells, normal hepatocytes, endothelial cells, fibroblasts, myeloid cells, T cells, NK cells and B cells. To verify the validity of deconvolution results in our CRLM RNA data, we applied the method to the synthetic mixtures created according to the previously described procedure.88 Correlation analysis was conducted to compare the inferred proportions from BayesPrism with the true proportions.
Spatial transcriptomic data analysis
The spatial transcriptomic data (ST-P1 and ST-P3) from CRLM samples pre- and post-XELOX treatment was downloaded from a prior paper.29 RCTD (spacexr v2.0.3)82 was implemented to estimate relative cell type abundance for each spot. The scRNA-seq dataset27 was used for reference input. Cell types were considered to exist in spots only if their cell proportions exceeded a certain threshold. We used the cell type labels from the prior paper as the ground truth. For cell types reported in prior paper (Epithelial, Hepatocyte, Fibroblast, and Endothelial), we selected thresholds that yielded the maximum F-scores between the predicted labels and real labels. For other cell types (Myeloid, T, B, NK), we set the threshold as 0.1. Next, we examined if certain cell types had spatial interactions or exclusions within a single spot. This involved calculating the ratio for the presence of each cell type amongst all spots. The statistical significance of spatial interactions or exclusions for specific cell type combinations was determined by one proportion z-test with their presence probabilities as the null hypothesis.
Machine learning model
A machine-learning model was built to classify BVZ-C treatment response in patients based on genomic and transcriptomic markers. Using 22 key features—including SMAD4 mutation status, 20q-gain, and expression of the top 10 resistance- and sensitivity-associated genes—a Random Forest classifier was trained on data from the main cohort (n = 48). Missing data was handled with BayesianRidge iterative imputation, and the model involved 10 decision trees with a depth limit of 5, optimized through 5-fold cross-validation for best performance.
Antibodies
Rabbit anti-SMAD4 (Cat# 46535, RRID: AB_2736998), rabbit anti-DYKDDDDK (Cat# 14793, RRID: AB_2572291), rabbit anti-STAT3 (Cat# 12640, RRID: AB_2629499), rabbit anti-phospho-STAT3 (Tyr705) (Cat# 9145, RRID: AB_2491009), rabbit anti-SHP2 (Cat# 3397, RRID: AB_2174959) were obtained from Cell Signaling Technology (CST). Mouse monoclonal anti-SMAD4R361H (Cat# 26422, RRID: AB_2629384) were obtained from NewEast Biotechnologies. Mouse monoclonal anti-β-Actin (Cat# 60008-1-Ig, RRID: AB_2289225), mouse monoclonal anti-GAPDH (Cat# 60004–1-Ig, RRID: AB_2107436), mouse monoclonal anti-CCL2 (Cat# 66272-1-Ig, RRID:AB_2861337), rabbit anti-Ki-67 (Cat# 27309-1-AP, RRID: AB_2756525) and rabbit anti-CD31 (Cat# 11265-1-AP, RRID: AB_2299349) were obtained from Proteintech. Alexa Fluor 647-labeled Goat Anti-Rabbit IgG (Cat# A0468, RRID: AB_2936379) and 2-(4-Amidinophenyl)-6-indolecarbamidine dihydrochloride (DAPI) (Cat# C1002) were obtained from Beyotime.
Chemicals
5-FU and oxaliplatin were respectively obtained from Hainan Zhuotai Pharmaceutical Co., Ltd and Jiangsu Hengrui Pharmaceuticals Co., Ltd. Irinotecan (Cat# S5026) was obtained from Selleck. Human bevacizumab and murine monoclonal bevacizumab (B20.4–1.1) were respectively obtained from Roche Pharma (Schweiz) Ltd and Genentech. The STATTIC (Cat# HY-13818), JSH-23 (Cat# HY-13982), AC-4-130 (Cat# HY-124500), GB201(Cat# HY-13919), and recombinant CCL2 protein (Cat# HY-P7237) were obtained from MCE (MedChemExpress).
Scoring of morphological response to therapy
The contrast-enhanced CT scans of CRLM patients at the efficacy evaluation time node (Reponse, n = 6; Primary Resistance, n = 9; Acquired Resistance, n = 7) were available for the analysis of morphological response to therapy using a method based on previously published morphological response criteria.31 Morphological response to replacement histopathological growth pattern (RHGP) was calculated based on whether the lesion changed from a homogeneous, low-attenuation lesion with a thin, sharply defined tumor-liver interface or a moderate degree of heterogeneous attenuation and a moderately defined tumor-liver interface to a heterogeneous attenuation and a thick, poorly defined tumor-liver interface after treatment. Morphological response was scored independently by 3 observers using the same criteria.
Tumor conditioned medium
For preparation of tumor conditioned medium (TCM), stable transfected SW480 and HCT116 cells were inoculated into growth medium at a density of 1×10⁶ cells overnight. After adherence and removing the growth medium, fresh medium (5mL) was added to further culture the cells for 48 h, and the supernatant was collected as tumor conditioned medium with cell debris and excess substances in the supernatant removed by centrifugation. Human vascular endothelial cells (HUVECs) were stimulated with the collected TCM and standard medium in a 1:1 ratio for the subsequent experiments.
Cell tubule formation
Tubule formation assay for HUVECs was performed as previously described.89 HUVECs were cultured with standard medium and TCM with or without bevacizumab (0.25 mg/ml) for 48h, and subsequently suspended in corresponding medium and incubated in matrigel (ABW, Cat# 082704) in μ-slide angiogenesis 12-well plate for 4h at 37°C before imaging. The capillary tubes were photographed and quantified by measuring the number of nudes. Three independent experiments were required for each treatment.
Cell viability assay
Cells were plated in 96-well plates and exposed to different concentrations of chemotherapeutic agents such as 5-FU and inhibitors of signaling pathways such as STATTIC for 48 h. Cell counting kit-8 (CCK-8) diluted with RPMI 1640 medium was added to the cells that were incubated for 2–3 h. Absorbance was measured at 450 nm using the SpectraMax M5 microplate reader.
Western blotting
Western blotting was performed as previously described.90 The cells were washed with cold PBS buffer and prepared using lysis buffer (1mM PMSF, phosphatase inhibitor cocktail, and protease inhibitor cocktail). Protein concentrations of lysates were estimated using a BCA kit (Fdbio science). Separated proteins were resolved in SDS gels and transferred onto polyvinylidene difluoride membranes. Membranes were blocked in 5% BSA for 1 h. Primary antibodies used were anti-SMAD4 (1:1000; CST), anti-SMAD4R361H (1:1000; NewEast Biotechnologies), anti-FLAG (1:1000; CST), anti-STAT3 (1:1000; CST), anti-phospho-STAT3 (Tyr705) (1:1000; CST), anti-CCL2 (1:1000; Proteintech) and anti-β-Actin (1:5000; Proteintech). After incubation with goat anti-mouse or anti-rabbit IgG (Proteintech), the specific immunoreactive bands were detected with enhanced chemiluminescence (ECL kit, Fdbio science) using fluorescence luminescence and quantified by image software.
RNA isolation and quantitative PCR analysis
Total RNA was extracted from the cells using the TRIzol kit (R401-01, Vazyme) according to the manufacturer’s instructions. Reverse transcription was performed using the First Strand cDNA Synthesis kit (R312-01, Vazyme). Quantitative PCR (qPCR) was performed using the LightCycler 480 system (Roche), as described in a previous study.90 The expression levels of the target genes were normalized by subtracting the corresponding GAPDH threshold cycle (Ct) value. Primers used were: human CCL2: AGGTGACTGGGGCATTGAT and GCCTCCAGCATGAAAGTCTC.
Colony formation
Transfected tumor cells were seeded into 12-well plates (200 cells per well) and cultured for about two weeks. The medium with 5-FU treatment was replaced every three days. The colonies were washed using PBS, fixed with 4% paraformaldehyde for 30 min, stained with 0.1% crystal violet for 30 min, and finally photographed for quantitative analysis by ImageJ.
Cell apoptosis
Transfected tumor cells were seeded into 12-well plates and cultured with 5-FU for 48h. Cells were digested with Trypsin (without EDTA) and finally resuspended in the binding buffer with PI (10μL) and Annexin V-APC (5μL) for 5∼10min according to the operation manual. The cells were analyzed with a flow cytometer-BD FACS Melody (BD Bioscience, Franklin Lake, NJ, USA).
Immunofluorescence staining
Immunofluorescence staining of Figures 3 and 4 was performed using the Quadruple-Fluorescence Kit (Immunoway). First, dewax the paraffin sections and perform antigen retrieval. Next, inactivate endogenous peroxidase activity and block the tissue samples. Incubate the samples with the appropriate primary antibodies at 4°C for 8 h. After washing with PBST, add the corresponding secondary antibodies and incubate at room temperature for 30 min. Following PBST washing, add the appropriate fluorescent dyes and incubate at room temperature for 10 min. Once the staining is complete, place the samples in a recovery box, add the antibody stripping solution, and maintain the temperature above 95°C for 15 min. After the samples have cooled to room temperature, repeat the incubation with the primary antibodies following the antibody stripping step, sequentially labeling all markers with specific fluorescence. The primary antibodies added include: D-594 fluorescently labeled CK20 (Anti-Cytokeratin 20, abcam), D-488 fluorescently labeled HEP (Anti-Hepatocyte Specific, abcam), D-525 fluorescently labeled CD14 (Immunoway), and D-647 fluorescently labeled CD163 (Immunoway). Finally, label the cell nuclei with DAPI. Image analyses were comducted using an Olympus BX53 inverted epifluorescence microscope or a Zeiss LSM 980 confocal microscope. Five areas from each section were randomly selected to count the percentage of positively stained cells using Image-Pro Plus 6.0 software.
Immunofluorescence staining of Figures 5 and 6 was performed as previously described.90 Tumor cells or tissues were directly fixed with 4% paraformaldehyde, permeabilized with 0.3% Triton X-100, and incubated with the primary antibodies such as anti-Ki-67 (1:200; Proteintech) for HUVECs staining and anti-phospho-STAT3 (Tyr705) (1:200; CST) for tumor cell stainings or anti-CD31 (1:200; Proteintech) for tissue stainings overnight at 4°C. Next, the cells or tissues were incubated with the secondary antibodies Alexa Fluor 647-labeled Goat Anti-Rabbit IgG (1:500; Beyotime) for 1 h at room temperature. Finally, the cells or tissues were incubated for 10 min with DAPI diluted with methanol to stain the nucleus. Images were obtained with fluorescence and laser confocal microscopes (A1-DUVB-2, Nikon) for quantitative analysis by ImageJ.
Immunohistochemistry staining
Formalin-fixed tissue samples of mouse or human CRC liver metastasis tissues were embedded into paraffin and processed into 2∼4μm sections. Hematoxylin-eosin (HE) staining was performed according to standard procedures. CRLM mainly contains 3 different histopathological growth patterns (HGPs): desmoplastic HGP (DHGP), pushing HGP (PHGP), and replacement HGP (RHGP).31 The types of histopathological growth patterns were evaluated using ImageJ software (NIH), and the full-length pixels of RHGP (a), DHGP (b), and PHGP (c) in the liver-tumor interface of each image were calculated and converted into micrometers. The percentage RHGP was then quantified according to the following formula: a/(a + b + c)×100. The same calculation method was used for the quantification of DHGP and PHGP. Furthermore, from each HE-stained slide, 1–5 observation fields containing the tumor boundary were randomly selected for statistics. For antigen retrieval, mounted sections were put into a pressure cooker after being treated with sodium citrate. Slides were placed in 3% H2O2 for 10 min at room temperature, blocked in 5% BSA for 1 h and incubated with primary antibodies against anti-Ki-67 (1:2000; Proteintech) and anti-CD31 (1:2000; Proteintech) overnight at 4°C. Secondary antibody goat anti-rabbit HRP IgG (ZSGB-BIO, PV6001) and DAB were used to perform the immunostain. Counterstaining was developed using hematoxylin. Finally, images were obtained using a microscope (BX51, Olympus).
Co-IP analysis
As described previously in our study,90 cell lysates of stably transfected cells were collected and incubated with a specific primary antibody, anti-FLAG (1:200; Cat# 14793, CST), anti-phospho-STAT3 (Tyr705) (1:200; Cat# 9145, CST), or anti-SHP2 (1:200; Cat# 3397, CST), and mixed with protein A/G-Sepharose beads (7 Sea Biotech) overnight at 4°C. After extensive washing, the beads were boiled in 4×SDS-PAGE loading buffer for 5 min and analyzed by immunoblotting with specific antibodies to detect the protein complex.
siRNA transfection
Ablation of STAT3 in tumor cells was performed by transfection with siRNA duplex oligos, which were synthesized by Ribobio Company. Cell transfection was performed with Lipofectamine 2000 (Invitrogen) and replaced with a fresh medium after transfection for 12∼24h to further culture the cells for 48 h. The sequences used in this study are #1 GGCGTCCAGTTCACTACTA and #2 CATCGAGCAGCTGACTACA. Western blotting and qPCR were used to verify the efficiency of the sequence.
Quantification and statistical analysis
For binary outcomes, 95% two-sided CIs were constructed using the Clopper–Pearson method. Fisher’s exact test for independence was utilized to examine the relationship between two categorical variables and Mann-Whitney U test was conducted to assess the independence between a continuous variable and a binary categorical variable. Each experiment was repeated at least three times in this study. Differences between experimental groups were assessed using Student t tests, one-way or two-way ANOVA. All data were analyzed using GraphPad Prism 7.0 software (RRID: SCR_002798). All values are presented as mean ± SD, and statistical significance was noted as a p value of <0.05.
Published: December 3, 2024
Footnotes
Supplemental information can be found online at https://doi.org/10.1016/j.xcrm.2024.101838.
Contributor Information
Jiguang Wang, Email: jgwang@ust.hk.
Wangjun Liao, Email: liaowj@smu.edu.cn.
Supplemental information
References
- 1.Wang R., Li J., Zhou X., Mao Y., Wang W., Gao S., Wang W., Gao Y., Chen K., Yu S., et al. Single-cell genomic and transcriptomic landscapes of primary and metastatic colorectal cancer tumors. Genome Med. 2022;14:93. doi: 10.1186/s13073-022-01093-z. [DOI] [PMC free article] [PubMed] [Google Scholar]
- 2.Hurwitz H., Fehrenbacher L., Novotny W., Cartwright T., Hainsworth J., Heim W., Berlin J., Baron A., Griffing S., Holmgren E., et al. Bevacizumab plus irinotecan, fluorouracil, and leucovorin for metastatic colorectal cancer. N. Engl. J. Med. 2004;350:2335–2342. doi: 10.1056/NEJMoa032691. [DOI] [PubMed] [Google Scholar]
- 3.Cremolini C., Loupakis F., Antoniotti C., Lupi C., Sensi E., Lonardi S., Mezi S., Tomasello G., Ronzoni M., Zaniboni A., et al. FOLFOXIRI plus bevacizumab versus FOLFIRI plus bevacizumab as first-line treatment of patients with metastatic colorectal cancer: updated overall survival and molecular subgroup analyses of the open-label, phase 3 TRIBE study. Lancet Oncol. 2015;16:1306–1315. doi: 10.1016/S1470-2045(15)00122-9. [DOI] [PubMed] [Google Scholar]
- 4.Bennouna J., Sastre J., Arnold D., Österlund P., Greil R., Van Cutsem E., von Moos R., Viéitez J.M., Bouché O., Borg C., et al. Continuation of bevacizumab after first progression in metastatic colorectal cancer (ML18147): a randomised phase 3 trial. Lancet Oncol. 2013;14:29–37. doi: 10.1016/S1470-2045(12)70477-1. [DOI] [PubMed] [Google Scholar]
- 5.Masi G., Vivaldi C., Fornaro L., Lonardi S., Buccianti P., Sainato A., Marcucci L., Martignetti A., Luca Urso E.D., Castagna M., et al. Total neoadjuvant approach with FOLFOXIRI plus bevacizumab followed by chemoradiotherapy plus bevacizumab in locally advanced rectal cancer: the TRUST trial. Eur. J. Cancer. 2019;110:32–41. doi: 10.1016/j.ejca.2019.01.006. [DOI] [PubMed] [Google Scholar]
- 6.Simkens L.H.J., van Tinteren H., May A., ten Tije A.J., Creemers G.J.M., Loosveld O.J.L., de Jongh F.E., Erdkamp F.L.G., Erjavec Z., van der Torren A.M.E., et al. Maintenance treatment with capecitabine and bevacizumab in metastatic colorectal cancer (CAIRO3): a phase 3 randomised controlled trial of the Dutch Colorectal Cancer Group. Lancet. 2015;385:1843–1852. doi: 10.1016/S0140-6736(14)62004-3. [DOI] [PubMed] [Google Scholar]
- 7.Heinemann V., von Weikersthal L.F., Decker T., Kiani A., Kaiser F., Al-Batran S.E., Heintges T., Lerchenmüller C., Kahl C., Seipelt G., et al. FOLFIRI plus cetuximab or bevacizumab for advanced colorectal cancer: final survival and per-protocol analysis of FIRE-3, a randomised clinical trial. Br. J. Cancer. 2021;124:587–594. doi: 10.1038/s41416-020-01140-9. [DOI] [PMC free article] [PubMed] [Google Scholar]
- 8.Shen Y., Wang X., Lu J., Salfenmoser M., Wirsik N.M., Schleussner N., Imle A., Freire Valls A., Radhakrishnan P., Liang J., et al. Reduction of Liver Metastasis Stiffness Improves Response to Bevacizumab in Metastatic Colorectal Cancer. Cancer Cell. 2020;37:800–817.e7. doi: 10.1016/j.ccell.2020.05.005. [DOI] [PubMed] [Google Scholar]
- 9.Cancer Genome Atlas Network Comprehensive molecular characterization of human colon and rectal cancer. Nature (London) 2012;487:330–337. doi: 10.1038/nature11252. [DOI] [PMC free article] [PubMed] [Google Scholar]
- 10.Yaeger R., Chatila W.K., Lipsyc M.D., Hechtman J.F., Cercek A., Sanchez-Vega F., Jayakumaran G., Middha S., Zehir A., Donoghue M.T.A., et al. Clinical Sequencing Defines the Genomic Landscape of Metastatic Colorectal Cancer. Cancer Cell. 2018;33:125–136.e3. doi: 10.1016/j.ccell.2017.12.004. [DOI] [PMC free article] [PubMed] [Google Scholar]
- 11.Guinney J., Dienstmann R., Wang X., de Reyniès A., Schlicker A., Soneson C., Marisa L., Roepman P., Nyamundanda G., Angelino P., et al. The consensus molecular subtypes of colorectal cancer. Nat. Med. 2015;21:1350–1356. doi: 10.1038/nm.3967. [DOI] [PMC free article] [PubMed] [Google Scholar]
- 12.Zhao Q., Wang F., Chen Y.X., Chen S., Yao Y.C., Zeng Z.L., Jiang T.J., Wang Y.N., Wu C.Y., Jing Y., et al. Comprehensive profiling of 1015 patients' exomes reveals genomic-clinical associations in colorectal cancer. Nat. Commun. 2022;13:2342. doi: 10.1038/s41467-022-30062-8. [DOI] [PMC free article] [PubMed] [Google Scholar]
- 13.Smeets D., Miller I.S., O'Connor D.P., Das S., Moran B., Boeckx B., Gaiser T., Betge J., Barat A., Klinger R., et al. Copy number load predicts outcome of metastatic colorectal cancer patients receiving bevacizumab combination therapy. Nat. Commun. 2018;9:4112. doi: 10.1038/s41467-018-06567-6. [DOI] [PMC free article] [PubMed] [Google Scholar]
- 14.Woolston A., Khan K., Spain G., Barber L.J., Griffiths B., Gonzalez-Exposito R., Hornsteiner L., Punta M., Patil Y., Newey A., et al. Genomic and Transcriptomic Determinants of Therapy Resistance and Immune Landscape Evolution during Anti-EGFR Treatment in Colorectal Cancer. Cancer Cell. 2019;36:35–50.e9. doi: 10.1016/j.ccell.2019.05.013. [DOI] [PMC free article] [PubMed] [Google Scholar]
- 15.Kim C., Gao R., Sei E., Brandt R., Hartman J., Hatschek T., Crosetto N., Foukakis T., Navin N.E. Chemoresistance Evolution in Triple-Negative Breast Cancer Delineated by Single-Cell Sequencing. Cell. 2018;173:879–893.e13. doi: 10.1016/j.cell.2018.03.041. [DOI] [PMC free article] [PubMed] [Google Scholar]
- 16.Marine J.C., Dawson S.J., Dawson M.A. Non-genetic mechanisms of therapeutic resistance in cancer. Nat. Rev. Cancer. 2020;20:743–756. doi: 10.1038/s41568-020-00302-4. [DOI] [PubMed] [Google Scholar]
- 17.Huang M., Lin Y., Wang C., Deng L., Chen M., Assaraf Y.G., Chen Z.S., Ye W., Zhang D. New insights into antiangiogenic therapy resistance in cancer: Mechanisms and therapeutic aspects. Drug Resist. Updates. 2022;64 doi: 10.1016/j.drup.2022.100849. [DOI] [PubMed] [Google Scholar]
- 18.Qi M., Fan S., Huang M., Pan J., Li Y., Miao Q., Lyu W., Li X., Deng L., Qiu S., et al. Targeting FAP$\alpha$-expressing hepatic stellate cells overcomes resistance to antiangiogenics in colorectal cancer liver metastasis models. J. Clin. Invest. 2022;132 doi: 10.1172/JCI157399. [DOI] [PMC free article] [PubMed] [Google Scholar]
- 19.Eisenhauer E.A., Therasse P., Bogaerts J., Schwartz L.H., Sargent D., Ford R., Dancey J., Arbuck S., Gwyther S., Mooney M., et al. New response evaluation criteria in solid tumours: Revised RECIST guideline (version 1.1) Eur. J. Cancer. 2009;45:228–247. doi: 10.1016/j.ejca.2008.10.026. [DOI] [PubMed] [Google Scholar]
- 20.Parikh A.R., Lee F.-C., Yau L., Koh H., Knost J., Mitchell E.P., Bosanac I., Choong N., Scappaticci F., Mancao C., Lenz H.-J. MAVERICC, a Randomized, Biomarker-stratified, Phase II Study of mFOLFOX6-Bevacizumab versus FOLFIRI-Bevacizumab as First-line Chemotherapy in Metastatic Colorectal Cancer. Clin. Cancer Res. 2019;25:2988–2995. doi: 10.1158/1078-0432.CCR-18-1221. [DOI] [PMC free article] [PubMed] [Google Scholar]
- 21.Turner N.C., Reis-Filho J.S. Genetic heterogeneity and cancer drug resistance. Lancet Oncol. 2012;13:e178–e185. doi: 10.1016/S1470-2045(11)70335-7. [DOI] [PubMed] [Google Scholar]
- 22.Lippert T.H., Ruoff H.J., Volm M. Intrinsic and acquired drug resistance in malignant tumors. The main reason for therapeutic failure. Arzneimittelforschung. 2008;58:261–264. doi: 10.1055/s-0031-1296504. [DOI] [PubMed] [Google Scholar]
- 23.Li C., Sun Y.D., Yu G.Y., Cui J.R., Lou Z., Zhang H., Huang Y., Bai C.G., Deng L.L., Liu P., et al. Integrated Omics of Metastatic Colorectal Cancer. Cancer Cell. 2020;38:734–747.e9. doi: 10.1016/j.ccell.2020.08.002. [DOI] [PubMed] [Google Scholar]
- 24.Jiang B., Song D., Mu Q., Wang J.J.Q.B. CELLO: a longitudinal data analysis toolbox untangling cancer evolution. Quantitative Biology. 2020;8:256–266. [Google Scholar]
- 25.van Dijk E., van den Bosch T., Lenos K.J., El Makrini K., Nijman L.E., van Essen H.F.B., Lansu N., Boekhout M., Hageman J.H., Fitzgerald R.C., et al. Chromosomal copy number heterogeneity predicts survival rates across cancers. Nat. Commun. 2021;12:3188. doi: 10.1038/s41467-021-23384-6. [DOI] [PMC free article] [PubMed] [Google Scholar]
- 26.Chu T., Wang Z., Pe'er D., Danko C.G. Cell type and gene expression deconvolution with BayesPrism enables Bayesian integrative analysis across bulk and single-cell RNA sequencing in oncology. Nat. Can. (Ott.) 2022;3:505–517. doi: 10.1038/s43018-022-00356-3. [DOI] [PMC free article] [PubMed] [Google Scholar]
- 27.Sathe A., Mason K., Grimes S.M., Zhou Z., Lau B.T., Bai X., Su A., Tan X., Lee H., Suarez C.J., et al. Colorectal Cancer Metastases in the Liver Establish Immunosuppressive Spatial Networking between Tumor-Associated SPP1+ Macrophages and Fibroblasts. Clin. Cancer Res. 2023;29:244–260. doi: 10.1158/1078-0432.Ccr-22-2041. [DOI] [PMC free article] [PubMed] [Google Scholar]
- 28.Gambaro K., Marques M., McNamara S., Couetoux du Tertre M., Diaz Z., Hoffert C., Srivastava A., Hébert S., Samson B., Lespérance B., et al. Copy number and transcriptome alterations associated with metastatic lesion response to treatment in colorectal cancer. Clin. Transl. Med. 2021;11 doi: 10.1002/ctm2.401. [DOI] [PMC free article] [PubMed] [Google Scholar]
- 29.Wu Y., Yang S., Ma J., Chen Z., Song G., Rao D., Cheng Y., Huang S., Liu Y., Jiang S., et al. Spatiotemporal Immune Landscape of Colorectal Cancer Liver Metastasis at Single-Cell Level. Cancer Discov. 2022;12:134–153. doi: 10.1158/2159-8290.Cd-21-0316. [DOI] [PubMed] [Google Scholar]
- 30.Frentzas S., Simoneau E., Bridgeman V.L., Vermeulen P.B., Foo S., Kostaras E., Nathan M., Wotherspoon A., Gao Z.H., Shi Y., et al. Vessel co-option mediates resistance to anti-angiogenic therapy in liver metastases. Nat. Med. 2016;22:1294–1302. doi: 10.1038/nm.4197. [DOI] [PMC free article] [PubMed] [Google Scholar]
- 31.Chun Y.S., Vauthey J.N., Boonsirikamchai P., Maru D.M., Kopetz S., Palavecino M., Curley S.A., Abdalla E.K., Kaur H., Charnsangavej C., Loyer E.M. Association of computed tomography morphologic criteria with pathologic response and survival in patients treated with bevacizumab for colorectal liver metastases. JAMA. 2009;302:2338–2344. doi: 10.1001/jama.2009.1755. [DOI] [PMC free article] [PubMed] [Google Scholar]
- 32.Lee H.O., Hong Y., Etlioglu H.E., Cho Y.B., Pomella V., Van den Bosch B., Vanhecke J., Verbandt S., Hong H., Min J.W., et al. Lineage-dependent gene expression programs influence the immune landscape of colorectal cancer. Nat. Genet. 2020;52:594–603. doi: 10.1038/s41588-020-0636-z. [DOI] [PubMed] [Google Scholar]
- 33.Lanauze C.B., Sehgal P., Hayer K., Torres-Diz M., Pippin J.A., Grant S.F.A., Thomas-Tikhonenko A. Colorectal Cancer-Associated Smad4 R361 Hotspot Mutations Boost Wnt/$\beta$-Catenin Signaling through Enhanced Smad4--LEF1 Binding. Mol. Cancer Res. 2021;19:823–833. doi: 10.1158/1541-7786.MCR-20-0721. [DOI] [PMC free article] [PubMed] [Google Scholar]
- 34.Wong C.K., Lambert A.W., Ozturk S., Papageorgis P., Lopez D., Shen N., Sen Z., Abdolmaleky H.M., Győrffy B., Feng H., Thiagalingam S. Targeting RICTOR Sensitizes SMAD4-Negative Colon Cancer to Irinotecan. Mol. Cancer Res. 2020;18:414–423. doi: 10.1158/1541-7786.MCR-19-0525. [DOI] [PMC free article] [PubMed] [Google Scholar]
- 35.Säisä-Borreill S., Davidson G., Kleiber T., Thevenot A., Martin E., Mondot S., Blottiere H., Helleux A., Mengus G., Plateroti M., et al. General transcription factor TAF4 antagonizes epigenetic silencing by Polycomb to maintain intestine stem cell functions. Cell Death Differ. 2023;30:839–853. doi: 10.1038/s41418-022-01109-6. [DOI] [PMC free article] [PubMed] [Google Scholar]
- 36.Pedraz-Cuesta E., Christensen S., Jensen A.A., Jensen N.F., Bunch L., Romer M.U., Brünner N., Stenvang J., Pedersen S.F. The glutamate transport inhibitor DL-Threo-beta-Benzyloxyaspartic acid (DL-TBOA) differentially affects SN38- and oxaliplatin-induced death of drug-resistant colorectal cancer cells. BMC Cancer. 2015;15:411. doi: 10.1186/s12885-015-1405-8. [DOI] [PMC free article] [PubMed] [Google Scholar]
- 37.Szymczyk J., Sluzalska K.D., Materla I., Opalinski L., Otlewski J., Zakrzewska M. FGF/FGFR-Dependent Molecular Mechanisms Underlying Anti-Cancer Drug Resistance. Cancers. 2021;13 doi: 10.3390/cancers13225796. [DOI] [PMC free article] [PubMed] [Google Scholar]
- 38.Chen J., Wang H., Peng F., Qiao H., Liu L., Wang L., Shang B. Ano1 is a Prognostic Biomarker That is Correlated with Immune Infiltration in Colorectal Cancer. Int. J. Gen. Med. 2022;15:1547–1564. doi: 10.2147/IJGM.S348296. [DOI] [PMC free article] [PubMed] [Google Scholar]
- 39.Schulz-Heddergott R., Stark N., Edmunds S.J., Li J., Conradi L.C., Bohnenberger H., Ceteci F., Greten F.R., Dobbelstein M., Moll U.M. Therapeutic Ablation of Gain-of-Function Mutant p53 in Colorectal Cancer Inhibits Stat3-Mediated Tumor Growth and Invasion. Cancer Cell. 2018;34:298–314.e7. doi: 10.1016/j.ccell.2018.07.004. [DOI] [PMC free article] [PubMed] [Google Scholar]
- 40.Pich O., Bailey C., Watkins T.B.K., Zaccaria S., Jamal-Hanjani M., Swanton C. The translational challenges of precision oncology. Cancer Cell. 2022;40:458–478. doi: 10.1016/j.ccell.2022.04.002. [DOI] [PubMed] [Google Scholar]
- 41.Hanahan D. Hallmarks of Cancer: New Dimensions. Cancer Discov. 2022;12:31–46. doi: 10.1158/2159-8290.CD-21-1059. [DOI] [PubMed] [Google Scholar]
- 42.Shi Z.-D., Pang K., Wu Z.-X., Dong Y., Hao L., Qin J.-X., Wang W., Chen Z.-S., Han C.-H. Tumor cell plasticity in targeted therapy-induced resistance: mechanisms and new strategies. Signal Transduct. Targeted Ther. 2023;8:113. doi: 10.1038/s41392-023-01383-x. [DOI] [PMC free article] [PubMed] [Google Scholar]
- 43.Zhang B., Yao K., Zhou E., Zhang L., Cheng C. Chr20q Amplification Defines a Distinct Molecular Subtype of Microsatellite Stable Colorectal Cancer. Cancer Res. 2021;81:1977–1987. doi: 10.1158/0008-5472.CAN-20-4009. [DOI] [PMC free article] [PubMed] [Google Scholar]
- 44.Bao L., Qian Z., Lyng M.B., Wang L., Yu Y., Wang T., Zhang X., Yang H., Brünner N., Wang J., Ditzel H.J. Coexisting genomic aberrations associated with lymph node metastasis in breast cancer. J. Clin. Invest. 2018;128:2310–2324. doi: 10.1172/JCI97449. [DOI] [PMC free article] [PubMed] [Google Scholar]
- 45.Frey P., Devisme A., Rose K., Schrempp M., Freihen V., Andrieux G., Boerries M., Hecht A. SMAD4 mutations do not preclude epithelial-mesenchymal transition in colorectal cancer. Oncogene. 2022;41:824–837. doi: 10.1038/s41388-021-02128-2. [DOI] [PMC free article] [PubMed] [Google Scholar]
- 46.Fleming N.I., Jorissen R.N., Mouradov D., Christie M., Sakthianandeswaren A., Palmieri M., Day F., Li S., Tsui C., Lipton L., et al. SMAD2, SMAD3 and SMAD4 mutations in colorectal cancer. Cancer Res. 2013;73:725–735. doi: 10.1158/0008-5472.CAN-12-2706. [DOI] [PubMed] [Google Scholar]
- 47.Mehrvarz Sarshekeh A., Advani S., Overman M.J., Manyam G., Kee B.K., Fogelman D.R., Dasari A., Raghav K., Vilar E., Manuel S., et al. Association of SMAD4 mutation with patient demographics, tumor characteristics, and clinical outcomes in colorectal cancer. PLoS One. 2017;12 doi: 10.1371/journal.pone.0173345. [DOI] [PMC free article] [PubMed] [Google Scholar]
- 48.Szeglin B.C., Wu C., Marco M.R., Park H.S., Zhang Z., Zhang B., Garcia-Aguilar J., Beauchamp R.D., Chen X.S., Smith J.J. A SMAD4-modulated gene profile predicts disease-free survival in stage II and III colorectal cancer. Cancer Rep. 2022;5:e1423. doi: 10.1002/cnr2.1423. [DOI] [PMC free article] [PubMed] [Google Scholar]
- 49.Zhang B., Zhang B., Chen X., Bae S., Singh K., Washington M.K., Datta P.K. Loss of Smad4 in colorectal cancer induces resistance to 5-fluorouracil through activating Akt pathway. Br. J. Cancer. 2014;110:946–957. doi: 10.1038/bjc.2013.789. [DOI] [PMC free article] [PubMed] [Google Scholar]
- 50.Lin Z., Zhang L., Zhou J., Zheng J. Silencing Smad4 attenuates sensitivity of colorectal cancer cells to cetuximab by promoting epithelial-mesenchymal transition. Mol. Med. Rep. 2019;20:3735–3745. doi: 10.3892/mmr.2019.10597. [DOI] [PMC free article] [PubMed] [Google Scholar]
- 51.Ozawa H., Ranaweera R.S., Izumchenko E., Makarev E., Zhavoronkov A., Fertig E.J., Howard J.D., Markovic A., Bedi A., Ravi R., et al. SMAD4 Loss Is Associated with Cetuximab Resistance and Induction of MAPK/JNK Activation in Head and Neck Cancer Cells. Clin. Cancer Res. 2017;23:5162–5175. doi: 10.1158/1078-0432.CCR-16-1686. [DOI] [PMC free article] [PubMed] [Google Scholar]
- 52.Zhang B., Leng C., Wu C., Zhang Z., Dou L., Luo X., Zhang B., Chen X. Smad4 sensitizes colorectal cancer to 5-fluorouracil through cell cycle arrest by inhibiting the PI3K/Akt/CDC2/survivin cascade. Oncol. Rep. 2016;35:1807–1815. doi: 10.3892/or.2015.4479. [DOI] [PubMed] [Google Scholar]
- 53.Yu H., Pardoll D., Jove R. STATs in cancer inflammation and immunity: a leading role for STAT3. Nat. Rev. Cancer. 2009;9:798–809. doi: 10.1038/nrc2734. [DOI] [PMC free article] [PubMed] [Google Scholar]
- 54.Feng H., Liu K., Shen X., Liang J., Wang C., Qiu W., Cheng X., Zhao R. Targeting tumor cell-derived CCL2 as a strategy to overcome Bevacizumab resistance in ETV5+ colorectal cancer. Cell Death Dis. 2020;11:916. doi: 10.1038/s41419-020-03111-7. [DOI] [PMC free article] [PubMed] [Google Scholar]
- 55.Yu D., Xu H., Zhou J., Fang K., Zhao Z., Xu K. PDPN/CCL2/STAT3 feedback loop alter CAF heterogeneity to promote angiogenesis in colorectal cancer. Angiogenesis. 2024;27:809–825. doi: 10.1007/s10456-024-09941-9. [DOI] [PubMed] [Google Scholar]
- 56.Chun E., Lavoie S., Michaud M., Gallini C.A., Kim J., Soucy G., Odze R., Glickman J.N., Garrett W.S. CCL2 Promotes Colorectal Carcinogenesis by Enhancing Polymorphonuclear Myeloid-Derived Suppressor Cell Population and Function. Cell Rep. 2015;12:244–257. doi: 10.1016/j.celrep.2015.06.024. [DOI] [PMC free article] [PubMed] [Google Scholar]
- 57.Shah M.A., Shitara K., Lordick F., Bang Y.J., Tebbutt N.C., Metges J.P., Muro K., Lee K.W., Shen L., Tjulandin S., et al. Randomized, double-blind, placebo-controlled phase III study of paclitaxel$\pm$Napabucasin in pretreated advanced gastric or gastroesophageal junction adenocarcinoma. Clin. Cancer Res. 2022;28:OF1–OF9. doi: 10.1158/1078-0432.CCR-21-4021. [DOI] [PMC free article] [PubMed] [Google Scholar]
- 58.Sonbol M.B., Ahn D.H., Goldstein D., Okusaka T., Tabernero J., Macarulla T., Reni M., Li C.P., O'Neil B., Van Cutsem E., Bekaii-Saab T. CanStem111P trial: a Phase III study of napabucasin plus nab-paclitaxel with gemcitabine. Future Oncol. 2019;15:1295–1302. doi: 10.2217/fon-2018-0903. [DOI] [PubMed] [Google Scholar]
- 59.Jonker D.J., Nott L., Yoshino T., Gill S., Shapiro J., Ohtsu A., Zalcberg J., Vickers M.M., Wei A.C., Gao Y., et al. Napabucasin versus placebo in refractory advanced colorectal cancer: a randomised phase 3 trial. Lancet. Gastroenterol. Hepatol. 2018;3:263–270. doi: 10.1016/S2468-1253(18)30009-8. [DOI] [PubMed] [Google Scholar]
- 60.Fan Z., Cui Y., Chen L., Liu P., Duan W. 23-Hydroxybetulinic acid attenuates 5-fluorouracil resistance of colorectal cancer by modulating M2 macrophage polarization via STAT6 signaling. Cancer Immunol. Immunother. 2024;73:83. doi: 10.1007/s00262-024-03662-0. [DOI] [PMC free article] [PubMed] [Google Scholar]
- 61.Laoukili J., Constantinides A., Wassenaar E.C.E., Elias S.G., Raats D.A.E., van Schelven S.J., van Wettum J., Volckmann R., Koster J., Huitema A.D.R., et al. Peritoneal metastases from colorectal cancer belong to Consensus Molecular Subtype 4 and are sensitised to oxaliplatin by inhibiting reducing capacity. Br. J. Cancer. 2022;126:1824–1833. doi: 10.1038/s41416-022-01742-5. [DOI] [PMC free article] [PubMed] [Google Scholar]
- 62.Mitsuhashi A., Goto H., Saijo A., Trung V.T., Aono Y., Ogino H., Kuramoto T., Tabata S., Uehara H., Izumi K., et al. Fibrocyte-like cells mediate acquired resistance to anti-angiogenic therapy with bevacizumab. Nat. Commun. 2015;6:8792. doi: 10.1038/ncomms9792. [DOI] [PMC free article] [PubMed] [Google Scholar]
- 63.Mooi J.K., Wirapati P., Asher R., Lee C.K., Savas P., Price T.J., Townsend A., Hardingham J., Buchanan D., Williams D., et al. The prognostic impact of consensus molecular subtypes (CMS) and its predictive effects for bevacizumab benefit in metastatic colorectal cancer: molecular analysis of the AGITG MAX clinical trial. Ann. Oncol. 2018;29:2240–2246. doi: 10.1093/annonc/mdy410. [DOI] [PubMed] [Google Scholar]
- 64.Yang X., Lin Y., Shi Y., Li B., Liu W., Yin W., Dang Y., Chu Y., Fan J., He R. FAP Promotes Immunosuppression by Cancer-Associated Fibroblasts in the Tumor Microenvironment via STAT3-CCL2 Signaling. Cancer Res. 2016;76:4124–4135. doi: 10.1158/0008-5472.CAN-15-2973. [DOI] [PubMed] [Google Scholar]
- 65.Yu H., Kortylewski M., Pardoll D. Crosstalk between cancer and immune cells: role of STAT3 in the tumour microenvironment. Nat. Rev. Immunol. 2007;7:41–51. doi: 10.1038/nri1995. [DOI] [PubMed] [Google Scholar]
- 66.Cerami E., Gao J., Dogrusoz U., Gross B.E., Sumer S.O., Aksoy B.A., Jacobsen A., Byrne C.J., Heuer M.L., Larsson E., et al. The cBio cancer genomics portal: an open platform for exploring multidimensional cancer genomics data. Cancer Discov. 2012;2:401–404. doi: 10.1158/2159-8290.Cd-12-0095. [DOI] [PMC free article] [PubMed] [Google Scholar]
- 67.Li H., Durbin R. Fast and accurate short read alignment with Burrows-Wheeler transform. Bioinformatics. 2009;25:1754–1760. doi: 10.1093/bioinformatics/btp324. [DOI] [PMC free article] [PubMed] [Google Scholar]
- 68.Chen S., Zhou Y., Chen Y., Gu J. fastp: an ultra-fast all-in-one FASTQ preprocessor. Bioinformatics. 2018;34:i884–i890. doi: 10.1093/bioinformatics/bty560. [DOI] [PMC free article] [PubMed] [Google Scholar]
- 69.Hu H., Mu Q., Bao Z., Chen Y., Liu Y., Chen J., Wang K., Wang Z., Nam Y., Jiang B., et al. Mutational Landscape of Secondary Glioblastoma Guides MET-Targeted Trial in Brain Tumor. Cell. 2018;175:1665–1678.e18. doi: 10.1016/j.cell.2018.09.038. [DOI] [PubMed] [Google Scholar]
- 70.Li H., Handsaker B., Wysoker A., Fennell T., Ruan J., Homer N., Marth G., Abecasis G., Durbin R., 1000 Genome Project Data Processing Subgroup The Sequence Alignment/Map format and SAMtools. Bioinformatics. 2009;25:2078–2079. doi: 10.1093/bioinformatics/btp352. [DOI] [PMC free article] [PubMed] [Google Scholar]
- 71.Shen R., Seshan V.E. FACETS: allele-specific copy number and clonal heterogeneity analysis tool for high-throughput DNA sequencing. Nucleic Acids Res. 2016;44 doi: 10.1093/nar/gkw520. [DOI] [PMC free article] [PubMed] [Google Scholar]
- 72.Kautto E.A., Bonneville R., Miya J., Yu L., Krook M.A., Reeser J.W., Roychowdhury S. Performance evaluation for rapid detection of pan-cancer microsatellite instability with MANTIS. Oncotarget. 2017;8:7452–7463. doi: 10.18632/oncotarget.13918. [DOI] [PMC free article] [PubMed] [Google Scholar]
- 73.Paradis E., Claude J., Strimmer K. APE: Analyses of Phylogenetics and Evolution in R language. Bioinformatics. 2004;20:289–290. doi: 10.1093/bioinformatics/btg412. [DOI] [PubMed] [Google Scholar]
- 74.Dobin A., Davis C.A., Schlesinger F., Drenkow J., Zaleski C., Jha S., Batut P., Chaisson M., Gingeras T.R. STAR: ultrafast universal RNA-seq aligner. Bioinformatics. 2013;29:15–21. doi: 10.1093/bioinformatics/bts635. [DOI] [PMC free article] [PubMed] [Google Scholar]
- 75.Liao Y., Smyth G.K., Shi W. featureCounts: an efficient general purpose program for assigning sequence reads to genomic features. Bioinformatics. 2014;30:923–930. doi: 10.1093/bioinformatics/btt656. [DOI] [PubMed] [Google Scholar]
- 76.Zhang Y., Parmigiani G., Johnson W.E. ComBat-seq: batch effect adjustment for RNA-seq count data. NAR Genom. Bioinform. 2020;2 doi: 10.1093/nargab/lqaa078. [DOI] [PMC free article] [PubMed] [Google Scholar]
- 77.Yoshihara K., Shahmoradgoli M., Martínez E., Vegesna R., Kim H., Torres-Garcia W., Treviño V., Shen H., Laird P.W., Levine D.A., et al. Inferring tumour purity and stromal and immune cell admixture from expression data. Nat. Commun. 2013;4:2612. doi: 10.1038/ncomms3612. [DOI] [PMC free article] [PubMed] [Google Scholar]
- 78.Love M.I., Huber W., Anders S. Moderated estimation of fold change and dispersion for RNA-seq data with DESeq2. Genome Biol. 2014;15:550. doi: 10.1186/s13059-014-0550-8. [DOI] [PMC free article] [PubMed] [Google Scholar]
- 79.Ritchie M.E., Phipson B., Wu D., Hu Y., Law C.W., Shi W., Smyth G.K. limma powers differential expression analyses for RNA-sequencing and microarray studies. Nucleic Acids Res. 2015;43 doi: 10.1093/nar/gkv007. [DOI] [PMC free article] [PubMed] [Google Scholar]
- 80.Subramanian A., Tamayo P., Mootha V.K., Mukherjee S., Ebert B.L., Gillette M.A., Paulovich A., Pomeroy S.L., Golub T.R., Lander E.S., Mesirov J.P. Gene set enrichment analysis: a knowledge-based approach for interpreting genome-wide expression profiles. Proc. Natl. Acad. Sci. USA. 2005;102:15545–15550. doi: 10.1073/pnas.0506580102. [DOI] [PMC free article] [PubMed] [Google Scholar]
- 81.Chen E.Y., Tan C.M., Kou Y., Duan Q., Wang Z., Meirelles G.V., Clark N.R., Ma'ayan A. Enrichr: interactive and collaborative HTML5 gene list enrichment analysis tool. BMC Bioinf. 2013;14:128. doi: 10.1186/1471-2105-14-128. [DOI] [PMC free article] [PubMed] [Google Scholar]
- 82.Cable D.M., Murray E., Zou L.S., Goeva A., Macosko E.Z., Chen F., Irizarry R.A. Robust decomposition of cell type mixtures in spatial transcriptomics. Nat. Biotechnol. 2022;40:517–526. doi: 10.1038/s41587-021-00830-w. [DOI] [PMC free article] [PubMed] [Google Scholar]
- 83.Hess L.M., Brnabic A., Mason O., Lee P., Barker S. Relationship between Progression-free Survival and Overall Survival in Randomized Clinical Trials of Targeted and Biologic Agents in Oncology. J. Cancer. 2019;10:3717–3727. doi: 10.7150/jca.32205. [DOI] [PMC free article] [PubMed] [Google Scholar]
- 84.Tarasov A., Vilella A.J., Cuppen E., Nijman I.J., Prins P. Sambamba: fast processing of NGS alignment formats. Bioinformatics. 2015;31:2032–2034. doi: 10.1093/bioinformatics/btv098. [DOI] [PMC free article] [PubMed] [Google Scholar]
- 85.Cancer Genome Atlas Network Comprehensive molecular characterization of human colon and rectal cancer. Nature. 2012;487:330–337. doi: 10.1038/nature11252. [DOI] [PMC free article] [PubMed] [Google Scholar]
- 86.Saitou N., Nei M. The neighbor-joining method: a new method for reconstructing phylogenetic trees. Mol. Biol. Evol. 1987;4:406–425. doi: 10.1093/oxfordjournals.molbev.a040454. [DOI] [PubMed] [Google Scholar]
- 87.Liberzon A., Birger C., Thorvaldsdóttir H., Ghandi M., Mesirov J.P., Tamayo P. The Molecular Signatures Database (MSigDB) hallmark gene set collection. Cell Syst. 2015;1:417–425. doi: 10.1016/j.cels.2015.12.004. [DOI] [PMC free article] [PubMed] [Google Scholar]
- 88.Varn F.S., Johnson K.C., Martinek J., Huse J.T., Nasrallah M.P., Wesseling P., Cooper L.A.D., Malta T.M., Wade T.E., Sabedot T.S., et al. Glioma progression is shaped by genetic evolution and microenvironment interactions. Cell. 2022;185:2184–2199.e16. doi: 10.1016/j.cell.2022.04.038. [DOI] [PMC free article] [PubMed] [Google Scholar]
- 89.Huang N., Liu Y., Fang Y., Zheng S., Wu J., Wang M., Zhong W., Shi M., Xing M., Liao W. Gold Nanoparticles Induce Tumor Vessel Normalization and Impair Metastasis by Inhibiting Endothelial Smad2/3 Signaling. ACS Nano. 2020;14:7940–7958. doi: 10.1021/acsnano.9b08460. [DOI] [PubMed] [Google Scholar]
- 90.Wang J., Huang Q., Hu X., Zhang S., Jiang Y., Yao G., Hu K., Xu X., Liang B., Wu Q., et al. Disrupting Circadian Rhythm via the PER1-HK2 Axis Reverses Trastuzumab Resistance in Gastric Cancer. Cancer Res. 2022;82:1503–1517. doi: 10.1158/0008-5472.Can-21-1820. [DOI] [PMC free article] [PubMed] [Google Scholar]
Associated Data
This section collects any data citations, data availability statements, or supplementary materials included in this article.
Supplementary Materials
Data Availability Statement
-
•
The raw sequence data were deposited in the Genome Sequence Archive at the National Genomics Data Center, under the accession code GSA: HRA005455.
-
•
All code has been deposited in Zenodo and can be accessed at https://doi.org/10.5281/zenodo.13997442.
-
•
Any additional information required to reanalyze the data reported in this paper is available from the lead contact upon request.