Abstract
This paper compares the spectral response curves of cells in the lateral geniculate nucleus (LGN) with the reflectance spectra of a large sample of Munsell color chips. By examining the color chips with methods used by neural response researchers and the LGN cells with methods used by psychophysical color researchers, we obtain insights that may be useful for advancing knowledge in both fields. For LGN cells, the prevailing view is that they tend to be clustered into distinct types or along discernible lines or planes when data obtained from selected light stimuli are represented in a three-dimensional space derived from cone contributions. In contrast, the Munsell color chips are viewed as rather evenly distributed in a three-dimensional perceptual space based on the psychophysical judgment of surface colors. We demonstrate that, when the Munsell chips are viewed in the space typically applied to LGN cells, the distribution appears similar to that of the cells and vice versa. We show why this result occurs and suggest that it has implications for studies in both fields.
Keywords: vision, color perception
One of the important tasks of the visual system is to interpret the visual environment in terms of the color and texture of the objects in it. The raw visual data are reflected lights from surfaces. Although color vision is often studied with pure wavelengths generated by a spectrometer, we propose to use Munsell color chips as examples of such surfaces to provide clues about signals reaching the photoreceptors. In this paper, we compare the distribution of lateral geniculate nucleus (LGN) cell responses to light stimuli of various wavelengths with the distribution of surface reflectance spectra of a large sample of Munsell color chips.
The cells in the LGN on each side of the brain represent signals from the left and right eyes in alternate layers. The neural signals come through the optic nerve, which consists of the axons of ganglion cells in the retina. Each axon carries signals aggregated from a number of photoreceptors. The LGN cells connect to neurons whose axons terminate in the visual cortex. These neural signals ultimately give rise our visual percepts of space, color, and motion.
We compared the responses of the LGN cells with the spectra of the color chips by analyzing the two data sets from two distinct perspectives, the one used for neural response data and the one used for color systems, which involves perceptual similarity. The comparison requires comparable data of two kinds, namely, measures of cell responses at each of a number of wavelengths across the spectrum for the LGN and reflectance spectra at the same wavelengths for a large sample of color chips.
Methods
The LGN cell data come from a 1966 paper by De Valois et al. (1) (see Table 1, which is published as supporting information on the PNAS web site) that reports measures on 147 LGN cell spectral response curves at each of three intensity levels at 12 intervals from 420 to 670 nm in live macaque monkeys. Single cells were electrically isolated with micropipettes, with extracellular recordings measured in spikes per second. After isolating a cell, the stimuli, each presented as a stimulus flash for 1 s, were presented in random order across the spectrum with a Maxwellian view of ≈15°. All cells in De Valois et al. (1) were reported by Young (2) to be from the parvocellular layer, and, because the field of view of the stimuli was much larger than the receptive field of a cell, the reactions of center and surround were not distinguished. Measures were taken at three different levels of radiance intensity, and an adjustment was made for a 50-ms delay in response onset. To obtain true spectral response curves, De Valois et al. (1) carefully matched stimuli for equal energy.
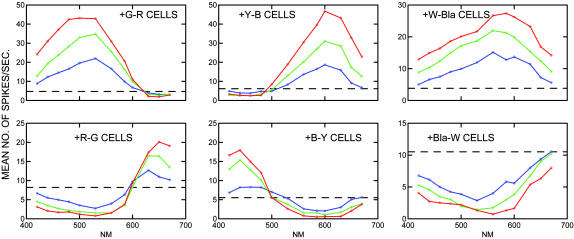
The cells were classified into six types on the basis of a visual examination of the spectral response curves. Four of the types were defined as spectrally opponent; in these types, the spectra showed an increased firing rate (compared with a base rate) for some wavelengths (above or below 560 nm) and a reduced firing rate for others. Letting + indicate increase in firing and - indicate a decrease in firing, these four types can be designated as +R-G (n = 29), +Y-B (n = 25), +G-R (n = 31), and +B-Y (n = 18), where R stands for red, G stands for green, Y stands for yellow, and B stands for blue. The other two types were defined as spectrally nonopponent; in these types, the firing rate either increased (n = 22) or decreased (n = 22) at all wavelengths as compared with the base rate. The mean spectral response of each of these cell types measured at three radiance intensity levels is shown in Fig. 1, which corresponds to figures 9–12, 15, and 16 in De Valois et al. (1).
Fig. 1.
Mean values of each cell type from De Valois et al. (1) measured at three intensity levels (blue, low; green, medium; and red, high) in spikes per second. The dashed horizontal line in each panel indicates the base firing rate. Bla, black; W, white; B, blue; R, red; G, green; Y, yellow.
In 1986, Young (2) published an informative principal component analysis of the data of De Valois et al. (1) in which he reported the loadings on the first three eigenvectors (see Table 2, which is published as supporting information on the PNAS web site). After computations including all intensity levels, he plotted the distribution of the medium intensity results in terms of principal component scores (after normalizing each component score as a proportion of the sum of absolute values of all scores) on the first and second eigenvector axes. He drew 95% confidence ellipses around the means of the different cell types and demonstrated that the principal component loadings could be rotated in various ways to correspond rather closely to psychophysical results obtained by others, such as the A and T vectors of Guth et al. (3). Most important for the purpose of the present study, Young (2) went on to analyze the data in terms of the tricone space of Derrington et al. (4). This space represents stimuli
in a three-dimensional space defined by (a) an axis along which only luminance varies, without change in chromaticity, (b) a “constant B” axis along which chromaticity varies without changing the excitation of blue-sensitive (B) cones, (c) a “constant R & G” axis along which chromaticity varies without change in the excitation of red-sensitive or green-sensitive (G) cones....
This space has become the de facto standard for reporting the results of experiments on color-sensitive cell responses from the retina, LGN, and cortex. The coordinates are obtained by first calculating coefficient weights with a linear regression equation predicting the cell response spectra from the long wavelength (L), medium wavelength (M), and short wavelength (S) cones (the regression equation includes a constant term) and then normalizing each cone contribution as a proportion of the sum of the absolute values of the three cone contributions (the constant term was not used in the normalizing calculation). (Mathematical notation and formulas for all data and calculations are included in Supporting Appendix, which is published as supporting information on the PNAS web site).
Results
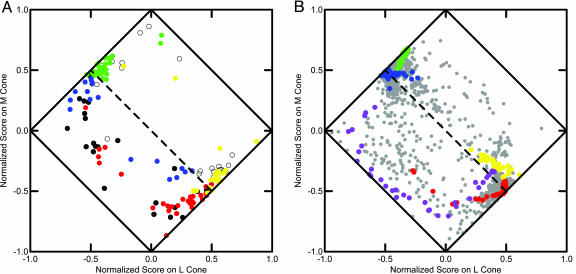
We replicated Young's (2) analysis with two modifications. First, we averaged the three intensity-level measures for each cell to minimize variability; second, we used Stockman and Sharpe (5) rather than Smith and Pokorney as reported in Ingling and Tsou (6) for the L, M, and S cone sensitivity spectra. By following Young (2), we computed the regression coefficients with the cube roots of the cone wavelength sensitivity curves. The results are shown in Fig. 2A, which corresponds closely to figure 5 of ref. 2 and, as pointed out by Young (2), with the results reported by Derrington et al. (4). Many papers have since reported comparable results in this space (see, e.g., refs. 7 and 8).
Fig. 2.
Plots of scaled locations of LGN spectra and Munsell spectra. (A) Mean spectra of 147 LGN cells represented in normalized cone coefficient space distinguished by type (red, +R-G; yellow, +Y-B; green, +G-R; blue, +B-Y; black +Bl-W; unfilled circle, +W-Bl). (B) Mean spectra of 1,269 Munsell color chips represented in normalized cone coefficient space distinguished by hue (blue, 5 Blue-Green; red, 5 Red; yellow, 10 Yellow; purple, 10 Purple-Blue; gray, remaining chips). Dashed line indicates where L + M = 0.
Young (2) noted that most cells fall along the two 45° diagonal end lines [running from (-1, 0) to (0, 1) and from (0, -1) to (1, 0)] and that there is a clear distinction among cell types with regard to the diagonal that represents the M + L = 0 separation. The +Bl-W (black), +B-Y (blue), and +R-G (red) cells are below the line, whereas the +W-Bl (white), +Y-G (yellow), and +G-Y (green) cells are above the line. Color coding is for identification purposes only. Our Fig. 2 has a few exceptions, whereas Young's figure 5 had none, probably because he used medium intensity measures and we used averages. This pattern is very similar qualitatively to results reported in refs. 4, 5, and 8.
The reflectance spectra for the 1,269 color chips come from the 1976 matte edition of the Munsell color book (9). The data were downloaded from www.it.lut.fi/research/color/database/database.html. The Munsell color system in its current refined form (10) represents our best available representation of perceptual space, and color chip atlases are available (9). Originally defined in terms of Value, Hue, and Chroma, the Munsell color system may be represented in a three-dimensional Euclidean space. For the present paper, we sampled the spectra of the Munsell color chips at the same 12 wavelengths used by De Valois et al. (1) in their measurement of LGN cells (see Table 3, which is published as supporting information on the PNAS web site).
To determine what the Munsell color space would look like represented in the tricone space of Derrington et al. (4), we analyzed the 1,269 Munsell spectra in the same way as the mean (by intensity levels) spectra of the LGN cells. The results shown in Fig. 2B show a striking qualitative similarity to Fig. 2 A. We have highlighted the 5 Red, 10 Yellow, 5 Blue-Green, and 10 Purple-Blue chips with the appropriate colors by analogy with the cell types. The colors occur in the same areas and show the same general pattern in the two representations.
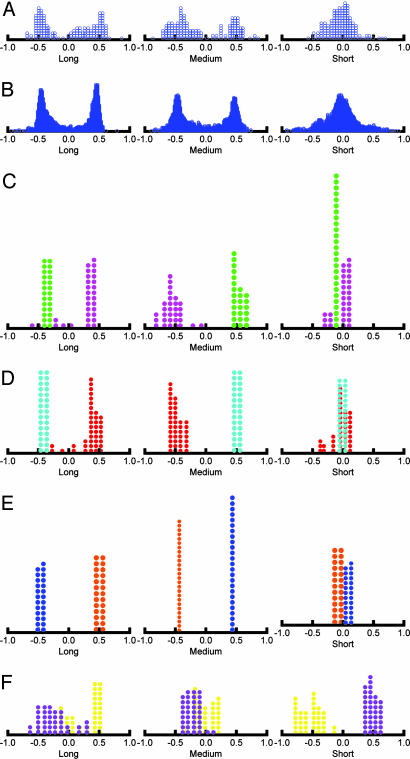
Additional insight into the distributions of cells and Munsell color chips in Fig. 2 may be obtained by plotting the frequency distributions of its normalized scores. These scores are normalized regression weights that represent the contribution of each cone (L, M, and S) to the prediction of the cell spectra and mathematically can take one any value from -1 to +l. Fig. 3 A and B displays the total distributions of the cells and the Munsell color chips, which are virtually identical in qualitative terms. The graphs show strong bimodal distributions for the L and M cones, with peaks somewhere in the neighborhood of -0.05 and 0.5, and a unimodal distribution for the S cone, with a peak ≈0.
Fig. 3.
Frequency distributions of normalized regression coefficients. (A) All 147 LGN cells. (B) All 1,269 Munsell color samples. (C) Comparison of Munsell 2.5 Red-Purple and 2.5 Green. (D) Comparison of Munsell 5 Red and 5 Blue-Green. (E) Comparison of Munsell 7.5 Yellow-Red and 7.5 Blue. (E) Comparison of Munsell 10 Yellow with 10 Purple-Blue.
Fig. 3 C–F displays distributions for four contrasting axes of the Munsell 40-spoke hue circle: 2.5 Red-Purple with 2.5 Green, 5 Red with 5 Blue-Green, 7.5 Yellow-Red with 7.5 Blue, and 10 Yellow with 10 Purple-Blue. The first three contrasts show a bimodal distribution for the L and M cones and a unimodal distribution for the S-cone normalized scores. The yellow versus purple-blue contrast, in comparison, is characterized by a strong bimodal distribution for the S cone with somewhat ambiguous distributions of the L and M cones. It appears that an unusually large portion of the color circle is dominated by the L and M cone contrast and a much smaller portion by the S cone bimodality.
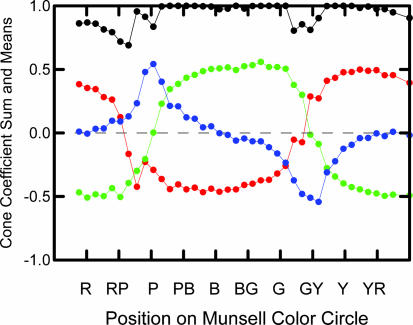
We have computed the mean normalized score for the L, M, and S cones and the sum of the absolute value of the three normalized scores for each of the 40 Munsell hues. The results are plotted in Fig. 4, where the x axis consists of the Munsell hue circle spread out in a single dimension beginning at 5 Red and going counterclockwise around the circle through red-purple, purple, purple-blue, and so on, to 2.5 Red. When a coefficient for a given cone is positive, it is presumably in an excitatory state; when it is negative, it is presumably in an inhibitory state. In Fig. 4, the sum of the absolute values for the three cones does not equal 1 at all hues because we excluded chips exceeding chroma = 8 after normalization for the calculation of means and sums.
Fig. 4.
The mean for each hue for normalized cone coefficients for the L cone (red), the M cone (green), and the S cone (blue) and the sum of the absolute values of all three cones (black). R, red; RP, red-purple; P, purple; PB, purple-blue; B, blue; BG, blue-green; G, green; GY, green-yellow; Y, yellow; YR, yellow-red.
As expected from an examination of Fig. 3, there is a very uneven distribution of cone contributions in different hue regions. Most notably, the L and M contrasts dominate much of the color circle. This finding corresponds well to the red-green channel of traditional opponent process theory (11), and it is consistent with the predominant L and M cone contributions to the center–surround receptive field of Wiesel and Hubel's (12) type I neurons. The sharply focused inhibition of the S cone in the yellow region and equally sharply focused excitation in the purple-blue region correspond well to the yellow-blue channel of traditional opponent process theory.
We next examine the Munsell reflectance spectra and the LGN cell spectra represented in three-dimensional Munsell color space. D'Andrade and Romney (13) devised a quantitative model for transforming reflectance spectra into the Munsell color space by using cone sensitivity functions. D'Andrade and Romney (13) multiplied Munsell reflectance spectra (illuminated by D65 spectra) by cone sensitivity spectra to obtain cone sums for the L, M, and S cones and showed that, when these sums were cube-rooted and regressed onto the Munsell conceptual system coordinates, a very satisfactory fit was obtained. By using the methods of D'Andrade and Romney (13), we estimated the Munsell coordinates of these spectra.
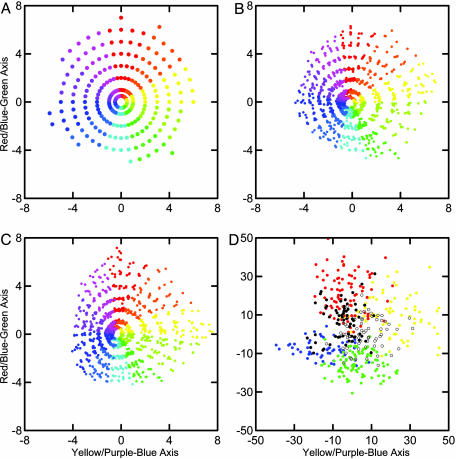
Fig. 5A displays the 1,269 Munsell color chips in the conceptual coordinate system (the dimension of value, going from black to white, is not shown here). Fig. 5B shows the results of taking the Commission International de l'Eclairage L*a*b* international color standard (measured over the whole 400- to 700-nm visual spectrum at 1-nm intervals) (14) regressed to the Munsell coordinates for comparison. Fig. 5C shows the results of the cone sum analysis (13). In Fig. 5 B and C, color chips of different value levels but of similar hue and chroma levels are not exactly superimposed because of errors in reproducing the conceptual system arising from psychometric measures, manufacturing errors, and physical measurement errors. The level of fit appears comparable to the results based on 12 wavelength intervals and shows that the two methods are qualitatively equivalent. The main point we want to convey with the plots in Fig. 5 A–C is that there are a number of rather simple ways to transform physically measured reflectance spectra of Munsell color chips that closely map the way humans perceive the relations among colors. The L*a*b* representation is based on color matching functions; the D'Andrade and Romney (13) representation is based on cone sensitivity functions, and similar results could be based on phosphor spectra, as in television sets, or on ink spectra, as in color printing. Fig. 5D shows the results of analyzing the 441 LGN cell response curves (each of the 147 cells was measured at three intensity levels) using the same methods to analyze the cell response data (including adjusting for D65 illumination) as were applied to the Munsell reflectance data in Fig. 5C, where the cell types are color-coded to show the location of each type as compared with the locations of the Munsell colors.
Fig. 5.
Munsell chip and LGN cell spectra represented in Munsell chromaticity space. (A) The ideal Munsell conceptual system chromaticity plane. (B) Fitted scores of Munsell color chips from the Commission International de l'Eclairage L*a*b* system based on color matching functions. (C) Fitted scores of Munsell color chips from the D'Andrade and Romney (13) system based on the cube root of the cone sums. (D) Scores of the 441 LGN cells computed in parallel with those shown in C, with the six cell types coded as in Fig. 2.
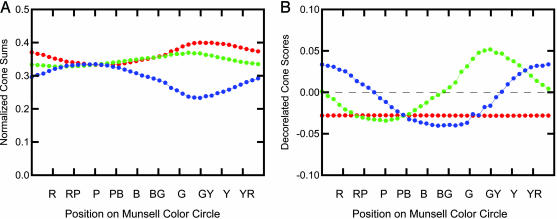
The structures of the reflectance spectra of Munsell color chips and the LGN cell response curves appear very different when represented in cone sum space as opposed to the normalized coefficient space of Fig. 2. It is also instructive to compare the cube root of the cone sums for the Munsell chips in a normalized form with the normalized cone coefficients in Fig. 4. For each color chip, we divided each cone sum (after taking its cube root) by the sum of the three cone sums. The results in Fig. 6A show the portion of activity that each cone sum contributes to the color chips as one proceeds counterclockwise around the color circle from 5 Red. Because the levels of the curves change with Munsell value and chroma, we present just chips for which value = 6 and chroma = 6. The L cone contributes the largest portion of the total activity, as measured by cone sums, around the Munsell yellows, where the contribution of the S cone is at its minimum. The situation is the reverse around the Munsell blues, where the L cone is at its lowest and the S cone is at its maximum. If we perform a singular value decomposition on the normalized cone sums, we obtain orthogonal chromaticity scores as in Fig. 6B. These scores are highly correlated with those obtained by slightly different methods and are plotted in Fig. 5C. It is apparent from Fig. 6 that the representation of Munsell reflectance spectra of color chips in this cone sum space is a close match to the way humans perceive color space as embodied in the Munsell system.
Fig. 6.
Plot of selected cube root cone sums around a Munsell Hue circle. (A) For value = 6 and chroma = 6 chips, the cube root of the L cone (red), M cone (green), and S cone (blue) on the Munsell Hue circle beginning at 2.5 Red. (B) The basis factors obtained by a singular value decomposition of the three curves in A. The x axis labels are as in Fig. 4.
Finally, to verify the results of Fig. 5 and to present as reliable a representation as possible of the LGN cells, we took the means of the three intensity levels of the cells to reduce error variance as much as possible. Then for each data set we simply took cone sums (after adjustment for D65 illumination for both sets), cube-rooted them, and, by using just the Munsell data, computed a linear transformation with regression analysis to fit the data to the Munsell conceptual system. We then applied the same linear transformation to both data sets. A careful examination of the three-dimensional results (data not shown) plotted in black and white so that color coding did not bias our perception revealed no qualitative differences in any of the dimensions of the distributions. From this perspective it is clear that the LGN cells have roughly the same distribution over the color space as the reflectance spectra of the Munsell color chips. Particularly noteworthy is the fact that in the yellow versus purple-blue plot the LGN cells show the same bias to yellow as value increases as the Munsell conceptual system. Allowing for the cube-root transformation, as originally suggested by Young (2), the LGN cell space is essentially congruent with the Munsell conceptual space. The cube roots of the cone sums of both the LGN cells and the Munsell spectra fit neatly into the Munsell conceptual coordinate system through a simple linear transformation.
Because these results may be contrary to some expectations (for example, the expectation there will be qualitatively distinct clusters of neurons at each pole of an opponent process), the question arises whether they are attributable to some extraneous factor, such as unreliable or faulty measurements. There are several reasons to believe that the LGN cell data are remarkably reliable and self-consistent. First, the results of the simple plotting of the cell spectral response curve means in Fig. 1 have a kind of face validity in terms of consistency across intensity levels. Second, the results of plotting the cells in normalized cone coefficient space are consistent with those of many subsequent studies (4, 7, 8). Third, all but 3.1% of the total sum of squares is accounted for by a three-dimensional Euclidean representation of the cells, as it should be given that the spectra are all formed from various mixtures of three cone responses. Finally, Young¶ demonstrated that the human tricone chromatic space and monkey LGN cell chromatic space are formally congruent. Young used principal component analysis to find an optimal set of basis factors that span the chromatic space of cone spectra from cone spectra raised to the 1/3 power, then orthogonally rotated these into the LGN eigenvectors and obtained correlations of 0.98, 0.99, and 0.92. Correlations of this magnitude would not be produced with unreliable data.
Discussion
Our most significant findings are as follows: First, the distribution of the LGN cell response profiles is remarkably similar to that of the reflectance spectra of Munsell color chips. These results are true from the perspective of cone coefficients, cone sums, and examination of the profiles themselves. All of the gradations of profiles seen in the Munsell reflectance spectra appear in the cell response profiles, including the U-shaped profiles characteristic of different shades and hues of purple. Second, cone coefficients reveal a very different pattern from cone sums for the Munsell color chips. The two predominant profiles of coefficients consist of an L and M cone paired opposition, with L cone inhibition and M cone activation or vice versa and an S cone variation from inhibition to activation. The L and M cones have a sharp crossover in the yellow and purple positions on the Munsell color circle. The S cone has a very sharp dip at yellow and an equally sharp peak at purple. The cone sums, in comparison, show smoother broad band curves over the whole color circle. A singular value decomposition of the normalized cone sums produces sine-like and cosine-like curves that give color circles of different size for various chroma levels that correspond well with the conceptual Munsell system.
We have shown that the LGN cell response profiles are rather smoothly spread through the color perceptual space represented by the surface reflectance spectra measured on Munsell color chips. This spacing suggests that the responses of the LGN cells are more or less evenly distributed in perceptual space by ganglion cells that aggregate cone receptor responses in a large variety of combinations that represent all areas of the space. This distribution would argue rather strongly that the receptive fields represented by the LGN cells are made up of 24–48, rather than a 6–12, cone receptors. On the basis of preliminary simulations, we found the measurement reliability of the cells was sufficient to demonstrate strong systematic patterning when receptive fields were simulated with random combinations of six cones. Young and Marrocco (15) developed a model of random connections between cones that predicted the same types and proportions of chromatic receptive fields reported in the physiological literature up through the LGN. Our overall results would be more consistent with this kind of random model compared with one that requires more cone-specific connections.
Along with the facts that perceptual color space seems continuous around the color circle and that the distribution of LGN cell response profiles seem rather evenly spaced over the space, there are orthogonal axes that correspond to the coordinates mathematically extracted from the physical spectra of Munsell chips by Romney and Indow (16) and to the orientation found by D'Andrade and Romney (13) for the rotated cube-rooted cone sums based on unitized regression weights. It is noteworthy that Fig. 4 based on the Derrington et al. (4) cone coefficients shows the same orientation. These observations, when coupled with the facts that the distribution of the LGN cells is so similar to the Munsell system and the similarity between the basis factors of the LGN cells and those of the Munsell reflectance spectra, suggest that these parallels in spectral distributions between physical, physiological, and perceptual representations contain useful information about the fundamental mechanisms underlying human color vision. It is also important to integrate the current results with more recent work exemplified by De Valois and coworkers (17, 18).
Supplementary Material
Acknowledgments
We thank Richard A. Young for providing data from De Valois et al. (1) and helpful suggestions on the manuscript and George Sperling and John I. Yellott for suggestions. The research was funded in part by National Science Foundation Grant SBR-9531213 (to A.K.R. and William H. Batchelder).
Abbreviations: LGN, lateral geniculate nucleus; L, long wavelength; M, medium wavelength; S, short wavelength.
Footnotes
Young, R. A. (1987) J. Opt. Soc., Am. A 4, P107 (abstr.).
References
- 1.De Valois, R. L., Abramov, I. & Jacobs, G. H. (1966) J. Opt. Soc. Am. 56, 966-977. [DOI] [PubMed] [Google Scholar]
- 2.Young, R. A. (1986) J. Opt. Soc. Am. A 3, 1735-1742. [DOI] [PubMed] [Google Scholar]
- 3.Guth, S. L., Massof, R. W. & Benzschawel, T. (1980) J. Opt. Soc. Am. 70, 197-212. [DOI] [PubMed] [Google Scholar]
- 4.Derrington, A. M., Krauskopf, J. & Lennie, P. (1984) J. Physiol. (London) 357, 241-265. [DOI] [PMC free article] [PubMed] [Google Scholar]
- 5.Stockman, A. & Sharpe, L. T. (2000) Vision Res. 40, 1711-1737. [DOI] [PubMed] [Google Scholar]
- 6.Ingling, C. R. & Tsou, B. H. (1977) Vision Res. 17, 1075-1082. [DOI] [PubMed] [Google Scholar]
- 7.Reid, R. C. & Shapley, R. M. (2002) J. Neurosci. 22, 6158-6175. [DOI] [PMC free article] [PubMed] [Google Scholar]
- 8.Johnson, E. N., Hawken, M. J. & Shapley, R. (2004) J. Neurophysiol. 91, 2501-2514. [DOI] [PubMed] [Google Scholar]
- 9.Munsell Color Company, Inc. (1976) Munsell Book of Color: Matte Finish Collection (Munsell, Baltimore).
- 10.Kuehni, R. G. (2003) Color Space and Its Divisions (Wiley, New York).
- 11.Jameson, D. & Hurvich, L. M. (1955) J. Opt. Soc. Am. 55, 546-552. [DOI] [PubMed] [Google Scholar]
- 12.Wiesel, T. N. and Hubel, D. H. (1966) J. Neurophysiol. 29, 1115-1156. [DOI] [PubMed] [Google Scholar]
- 13.D'Andrade, R. G. & Romney, A. K. (2003) Proc. Natl. Acad. Sci. USA 100, 6281-6286. [DOI] [PMC free article] [PubMed] [Google Scholar]
- 14.Wyszecki, G. & Stiles, W. S. (1982) Color Science: Concepts and Methods, Quantitative Data and Formulae (Wiley, New York), 2nd Ed., p. 168.
- 15.Young, R. A. & Marrocco, R. T. (1989) J. Theor. Biol. 141, 23-40. [DOI] [PubMed] [Google Scholar]
- 16.Romney, A. K. & Indow, T. (2002) Color Res. Appl. 28, 182-196. [Google Scholar]
- 17.De Valois, R. L., De Valois, K. K. & Mahon, L. E. (2000) Proc. Natl. Acad. Sci. USA 97, 512-517. [DOI] [PMC free article] [PubMed] [Google Scholar]
- 18.De Valois, R. L., Cottaris, N. P., Elfar, S. D., Mahon, L. E. & Wilson, J. A. (2000) Proc. Natl. Acad. Sci. USA 97, 4997-5002. [DOI] [PMC free article] [PubMed] [Google Scholar]
Associated Data
This section collects any data citations, data availability statements, or supplementary materials included in this article.


