

Abstract
Background
Major depressive disorder (MDD) is characterized by persistent feelings of sadness and loss of interest. Ketamine has been widely used to treat MDD owing to its rapid effect in relieving depressive symptoms. Importantly, not all patients respond to ketamine treatment. Identifying sub-populations who will benefit from ketamine, as well as those who may not, prior to treatment initiation, would significantly advance precision medicine in patients with MDD.
Methods
Here, we used mass spectrometry-based plasma proteomics to analyze matched pre- and post-ketamine treatment samples from a cohort of 30 MDD patients whose treatment outcomes and demographic and clinical characteristics were considered.
Results
Ketamine responders and non-responders were identified according to their individual outcomes after two weeks of treatment. We analyzed proteomic alterations in post-treatment samples from responders and non-responders and identified a collection of six proteins pivotal to the antidepressive effect of ketamine. Subsequent co-regulation analysis revealed that pathways related to immune response were involved in ketamine response. By comparing the proteomic profiles of samples from the same individuals at the pre- and post-treatment time points, dynamic proteomic rearrangements induced by ketamine revealed that immune-related processes were activated in association with its antidepressive effect. Furthermore, receiver operating characteristic curve analysis of pre-treatment samples revealed three proteins with strong predictive performance in determining the response of patients to ketamine before receiving treatment.
Conclusions
These findings provide valuable knowledge about ketamine response, which will ultimately lead to more personalized and effective treatments for patients.
Trial registration
The study was registered in the Chinese Clinical Trials Registry (ChiCTR-OOC-17012239) on May 26, 2017.
Supplementary Information
The online version contains supplementary material available at 10.1007/s10565-024-09981-3.
Keywords: MDD, Ketamine, Plasma Proteomics, Biomarkers, Immune response
Background
Major depressive disorder (MDD) is a severe mental health condition characterized by numerous emotional, cognitive, and physical symptoms that significantly impact the daily life of an individual (Gotlib and Joormann 2010). The core features of MDD include persistent low mood and loss of interest or pleasure in once-enjoyable activities (Kennedy 2008). Physical symptoms of MDD encompass fatigue and a lack of energy, contributing to a sense of physical and emotional exhaustion (Targum and Fava 2011). Feelings of worthlessness, excessive guilt, and self-criticism are frequent, which can distort one's self-perception. One of the most concerning aspects of MDD is the potential for suicidal thoughts or behaviors (Cai et al. 2021). Individuals may experience recurrent thoughts of death, contemplate suicide, or even formulate a specific plan to end their lives. This emphasizes the urgency of timely intervention and appropriate treatment.
The use of ketamine to treat MDD has progressed from laboratory research to clinical application (Grady et al. 2017). Ketamine has been found to rapidly alleviate depressive symptoms at low doses, especially in individuals who have not responded well to traditional antidepressant medications (Krystal et al. 2024). Ketamine's antidepressant mechanism of action is linked to its interaction with NMDA (N-methyl-D-aspartate) receptors in the brain (Zanos and Gould 2018). It blocks these receptors, which subsequently affects the release of certain neurotransmitters, such as glutamate. This alteration in neurotransmission is believed to contribute to its antidepressant effects. Moreover, ketamine has been shown to promote neuroplasticity, the ability of the brain to reorganize and form new neural connections (Wu et al. 2021). This can potentially help reshape dysfunctional neural circuits that are implicated in depression. Research trials have demonstrated the effectiveness of ketamine in various studies; hence, the U.S. Food and Drug Administration (FDA) approved esketamine (a derivative of ketamine) nasal spray for treatment-resistant depression in 2019 (Wei et al. 2020).
The response of individuals with MDD to ketamine treatment can vary widely (Shin and Kim 2020). Some individuals may experience substantial alleviation of their depressive symptoms, whereas others may see only partial or temporary relief. Proteomics, which involves the comprehensive study of proteins within a cell, tissue, or organism, is a valuable method for investigating drug mechanisms, developing personalized medicines, and identifying potential drug targets (Al-Amrani et al. 2021). However, little is known about how drugs interact with biological systems at the protein level, especially how ketamine affects MDD patients in this context.
Therefore, here we implemented high-resolution mass spectrometry (MS)-based plasma proteomics to study ketamine response in 30 MDD patients whose plasma samples were collected before and after treatment. First, alterations at the proteomic level between responders and non-responders were analyzed using post-treatment proteomics data. Second, the temporal dynamics of proteomic changes from pre- to post-treatment were examined to gain insights into the mechanism of action of ketamine following drug administration. Third, pre-treatment proteomics data were utilized to identify proteins that could serve as predictors of individual responses to ketamine prior to treatment.
Methods
Ethical approval
The study protocol was approved by the ethics committee for the Affiliated Brain Hospital of Guangzhou Medical University [(2016) No (030)] and was registered in the Chinese Clinical Trials Registry (Registration Number: ChiCTR-OOC-17012239; RRID:SCR_006037). The study was conducted according to the principles of the Declaration of Helsinki, and oral and written informed consent was obtained from all participants.
Participant recruitment and clinical data collection
The participants were administered six ketamine infusions (0.5 mg/kg, i.v.) in 50 mL 0.9% saline over a period of two weeks. Each infusion lasted 40 min, and the patients were closely monitored by proficient healthcare practitioners. Fasting plasma samples and clinical evaluations were obtained the day prior to the initial infusion and the day following the completion of the sixth infusion.
The efficacy of the intervention was evaluated using the Hamilton Rating Scale for Depression (HAMD). A positive response was indicated by a decrease of at least 50% in the overall HAMD score compared with the baseline score.
Plasma sample collection
We used 5 mL vacutainer anticoagulant tubes with heparin lithium to collect fasting blood samples. The collected samples were centrifuged at a speed of 3000 revolutions per minute for 12 min, one hour after sample collection. The supernatant was divided into Eppendorf tubes in equal volumes, and subsequently subjected to cryopreservation at a temperature of −80 °C until MS-based proteomics analysis was performed.
MS-based proteomics
All MS-based analyses in this study were performed at Novogene (Novogene Co., Ltd. Beijing). High-abundance proteins were removed. The proteins were digested with trypsin. An Orbitrap Q Exactive HF-X mass spectrometer (Thermo Fisher; RRID:SCR_020564) in data-independent acquisition (DIA) mode was used. For the DIA operation, the m/z range was 350 to 1500, the MS1 resolution was 60,000 (at m/z 200), the full-scan automatic gain control (AGC) target value was 5 × 10⁵, the maximum ion injection time was 20 ms, the MS2 resolution was 30,000 (at 200 m/z), the peptides were fragmented by higher-energy collisional dissociation (HCD), the AGC target value was 1 × 10⁶, and the normalized collision energy was 27%. The raw MS detection data were saved as raw files.
To identify and quantify proteins, the raw data generated by MS analysis were analyzed by Novogene (Novogene Co., Ltd., Beijing) in December 2022 using softwares such as Proteome Discoverer 2.2 (PD 2.2, Thermo; RRID:SCR_014477) and Spectronaut (version 14.0, Biognosys). For protein annotation, the Swiss-Prot/reviewed human reference proteome from the UniProt (https://www.uniprot.org; RRID:SCR_002380) database was used.
Proteomics data processing
Pre-treatment samples and post-treatment samples were sent for MS analysis at two different time points. For simplicity, we also referred to data derived from pre-treatment samples as DIA-pre, and data derived from post-treatment samples as DIA-post.
To discern proteomic dynamics from pre- to post-treatment, data from the two batches need to be merged into a single data set so that expression levels of the same protein at different time points are comparable. Therefore, two pre-treatment samples as bridge samples were added and analyzed alongside post-treatment samples. With the bridge samples, we could also evaluate technical reproducibility across different batches via correlation analysis.
When processing individual proteomics data sets, bridge samples in DIA-post were removed. Afterwards, DIA-pre and DIA-post were filtered such that proteins had at least 70% quantified values (proteins with > 30% missing values were discarded), and the missing values were set to 0. Protein abundance values were then log2 transformed for downstream analysis.
To merge DIA-pre and DIA-post, protein abundance values relative to the bridge sample were calculated within each data set. To avoid a zero denominator, proteins of 0 values in the bridge sample were discarded. DIA-pre and DIA-post were then merged into a single harmonized data set accordingly (also referred to as DIA-merge).
Differential abundance analysis
Differentially abundant proteins (DAPs) were identified via ANCOVA implemented in R (RRID:SCR_001905) while controlling for covariates body mass index (BMI) and family history. A protein was considered a DAP across a given condition if its fold change was > 1.2 and p was < 0.05 unless otherwise noted. Of note, no multiple testing correction was performed unless otherwise specified.
Human plasma proteins
The Human Plasma Proteome Project (HPPP), which is part of the HUPO (RRID:SCR_010707) Human Proteome Project (HPP), aims to detect an ensemble of human plasma proteins with high quality mass spectrometry evidence (Deutsch et al. 2021). The human plasma 2021–07 build that contains 4395 canonical proteins identified by HPPP was downloaded from the Human Plasma PeptideAtlas database (https://peptideatlas.org/builds/human/plasma/; RRID:SCR_006783).
Plasma sample contamination analysis
To assess and avoid sample-related biases originating from erythrocytes, platelets, and the blood coagulation system, three panels of quality markers defined by Geyer and colleagues via plasma proteome profiling were obtained (Geyer et al. 2019). Each of the erythrocyte and platelet panels contains 29 proteins, and the coagulation panel contains 31 proteins. For erythrocyte and platelet panels, the contamination index was calculated by summing their abundances and dividing by the summed abundance of all quantified plasma proteins. The coagulation contamination index was calculated as the sum of all plasma proteins divided by the sum of the proteins in the coagulation panel. We then assessed the quality of samples one by one by calculating the three contamination indices. For each panel of indices, we defined potentially contaminated samples as those with a value more than two standard deviations above the mean.
Secreted proteins
The human secretome, which comprises proteins secreted by various tissues, holds vital importance both for advancing our fundamental comprehension of human biology and for pinpointing promising targets in the development of novel diagnostic tools and therapeutic interventions. Final locations of proteins were obtained from the Human Protein Atlas (https://www.proteinatlas.org; RRID:SCR_006710) database, where the final location of a protein in the human body was defined by reviewing the literature, bioinformatics analyses, and experimental data (Uhlén et al. 2019; Uhlén et al. 2015). The downloaded data set contains 2793 genes that encode proteins secreted into 10 places, namely blood, brain, digestive system, female reproductive system, male reproductive system, other tissues, extracellular matrix, immunoglobulin genes, intracellular and membrane, and unknown location.
Protein existence
The protein existence status of a protein indicates the type of evidence that supports the existence of the protein (Zahn-Zabal et al. 2020). The data of protein existence were downloaded from the neXtProt database (https://www.nextprot.org/; RRID:SCR_008911) from the 2022–08–18 release. Lists of accession numbers for proteins with existence evidence at protein level (PE1), at transcript level (PE2), by homology (PE3), predicted (PE4), and uncertain (PE5) were obtained.
Functional enrichment analysis
To find enriched biological pathways of a gene list of interest, Metascape (RRID:SCR_016620) was used (Zhou et al. 2019). We narrowed gene set terms down to biological processes of Gene Ontology (RRID:SCR_002811), canonical pathways, hallmark gene sets, Reactome gene sets (RRID:SCR_003485), KEGG pathway (RRID:SCR_012773), BioCarta gene sets (RRID:SCR_006917), and PANTHER pathway (RRID:SCR_004869). Other parameters were set to their default values.
Correlation analysis
The correlation between protein abundance and HAMD scores was evaluated using the cor function in R software, with Pearson correlation coefficients and p values estimated as well.
Proteins with predictive value for ketamine response
To estimate the performance of a protein in predicting ketamine response before treatment, we performed receiver operating characteristic (ROC) curve analysis in pre-treatment samples using R software. The ROC analysis was conducted exclusively for DAPs that were significantly correlated with HAMD scores.
Statistics
Differences in demographics and clinical variables between the two groups at baseline (i.e., before treatment) were analyzed in R software using Fisher’s exact test, t test, and chi-squared test, whichever is appropriate.
Data deposition
The MS-based proteomics data have been deposited into the ProteomeXchange Consortium (http://proteomecentral.proteomexchange.org; RRID:SCR_004055) via the iProX (RRID:SCR_026109) partner repository (Chen et al. 2022).
Validation cohort
For external validation of dysregulated proteins between ketamine responders and nonresponders, the data set GSE185855 from GEO (Gene Expression Omnibus; RRID:SCR_005012) was used. It is derived from the investigation of whole blood transcriptional profiles related to human MDD and gene expression changes associated with treatment response to ketamine (Cathomas et al. 2022). We used a metric of effect size, Cliff’s delta, to determine up- or down-regulated genes in ketamine responders (Cliff 1996; Cliff 1993). The R package effsize was used to compute Cliff’s delta values, using TPM (transcripts per million) expression values as input. The computed Cliff’s delta, D, is a non-parametric measure of the segregation between responders and non-responders, and it ranges from −1 to 1. A negative D indicates expression levels in non-responders tend to be higher than responders, while a positive D indicates expression levels in responders tend to be higher than non-responders. The magnitude of the effect size of Cliff’s delta is assessed using |D|< 0.147 for negligible, |D|< 0.33 for small, |D|< 0.474 for medium, and others for large (Lin et al. 2024). For genes that passed the negligible effect size threshold, a positive D indicates up-regulation, while a negative D indicates down-regulation in ketamine responders.
Results
Study design and participants
We collected blood samples from a cohort of 30 MDD patients. For every participant, we collected samples both before and after ketamine treatment, which allowed us to examine the proteomic changes at different time points. At the end of the treatment, 20 responders (also referred to as R) and 10 non-responders (also referred to as NR) were identified (Fig. 1). We compared demographic differences between the responders and non-responders. Except for body mass index (BMI) and family history, there was no significant difference between the two sub-populations (Table 1). We then performed MS-based proteome profiling on each sample. The MS-based method implemented in this study has high robustness in terms of reproducibility, with a Pearson correlation coefficient of nearly 1 and p < 2.2e-16 (Supplementary Fig. 1). Afterwards, downstream analyses of the obtained proteomics data were carried out.
Fig. 1.
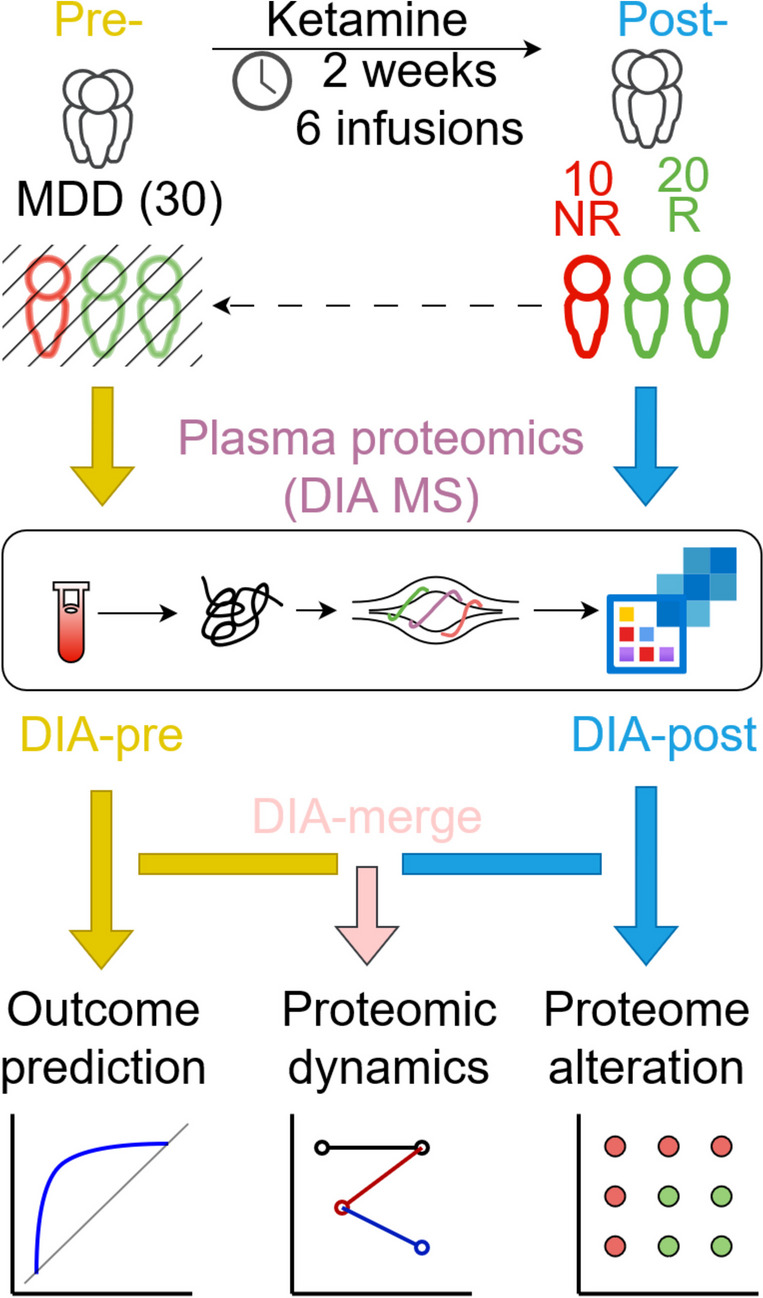
Overview of study population and schematic proteomic workflow. MS in DIA mode was used to profile plasma samples of 30 MDD patients before (pre) and after (post) ketamine treatment. Pre- and post-treatment proteomics data sets were also referred to as DIA-pre and DIA-post, respectively. Merged data, DIA-merge, was generated by merging DIA-pre and DIA-post. Afterwards, (1) proteins as indicators of patients’ response to ketamine were evaluated and selected by receiver operating characteristic (ROC) curve analysis (using DIA-pre), (2) proteomic dynamics reflecting temporal proteome changes caused by ketamine from pre- to post-treatment was discerned (using DIA-merge), and (3) proteome alterations in responders versus non-responders were investigated to capture response-relevant protein signatures in the bloodstream to reveal antidepressive mechanisms of ketamine (using DIA-post)
Table 1.
Demographics of the MDD patients involved in this study
| Item | NR (n = 10) | R (n = 20) | P value |
|---|---|---|---|
| Gender | / | / | 0.42 |
| 1 (Male) | 2 | 8 | / |
| 2 (Female) | 8 | 12 | / |
| Age | 36.5 (sd 13) | 33.1 (sd 9.85) | 0.72 |
| Year of education | 11.9 (sd 4.33) | 13.2 (sd 3.01) | 0.42 |
| BMI | 24.5 (sd 2.95) | 20.8 (sd 2.59) | 0.002 |
| Family history | / | / | 0.04 |
| 0 (Negative) | 4 | 16 | / |
| 1 (Positive) | 6 | 4 | / |
| Treat resistant depression | / | / | 1 |
| 0 (Non-TRD) | 1 | 3 | / |
| 1 (TRD) | 9 | 17 | / |
| Suicide | / | / | 0.46 |
| 0 (Yes) | 5 | 7 | / |
| 1 (No) | 5 | 13 | / |
Pre-treatment proteomic profiles
The in-depth proteomic landscape of 30 MDD patients before ketamine treatment was resolved using a high-resolution DIA MS-based method, and the proteome data, namely DIA-pre, was acquired.
From the cohort, 8034 peptides in total were obtained, with the number ranging between 3669 and 6280 in individual samples, and with 2881 peptides repeatedly detected across all samples (Fig. 2A). After mapping these peptides to the human reference proteome, a total of 562 proteins were quantified in at least one sample, with the number ranging between 320 and 530 proteins in individual samples, and with 264 proteins commonly quantified across all samples (Fig. 2B). These identified proteins were supported by an average of 14 peptides, and 493 of these proteins (87.7%) could be traced and supported by at least 2 peptides (Fig. 2C). The number of samples where a protein was observed was counted. A small number of proteins were found to be restricted to a few samples while most of the proteins were quantified in the majority of the samples analyzed. The distribution of proteins identified in different samples was analyzed, and we found that only 21 proteins were detected in a single sample, that 541 proteins were quantified in at least 2 samples, that up to 264 (47%) proteins were simultaneously quantified in all 30 samples, and that, on average, proteins could be detected across 22 samples (Fig. 2D).
Fig. 2.

Profiling of pre-treatment samples. A Distribution of the number of quantified peptides across samples; the dash-dotted line shows the number of common peptides in all samples. B Distribution of the number of quantified proteins across samples; the dash-dotted line shows the number of common proteins in all samples. C Distribution of peptide numbers of quantified proteins. D Distribution of protein numbers in samples. E Assessment of individual sample quality with respect to three contamination indices, i.e., coagulation, erythrocyte, and platelet, respectively; the dashed magenta line indicates two standard deviations from the average value. F Comparison of proteins identified in pre-treatment samples with Human Plasma Proteome Project (HPPP). G Location distribution of proteins identified in pre-treatment samples. H Existence distribution of proteins identified in pre-treatment samples; PE1-PE5, evidence levels in the neXtProt database; NA, no information available in the neXtProt database
To further evaluate the quality of DIA-pre, we compared it against public data sets. The sample contamination analysis revealed that no sample was contaminated by erythrocytes, platelets, or coagulation factors (Fig. 2E). Notably, the majority (522/562) of the proteins we identified were also in HPPP, constituting 12% of the HPPP data set (Fig. 2F). In line with the nature of our plasma samples, the identified proteins were mainly secreted into the blood (Fig. 2G). Nearly all of the identified proteins presented PE1 and PE2 levels of existence, and the majority had a level of PE1 (Fig. 2H). Therefore, these findings indicate high reliability of the MS-based analysis and high quality of the DIA-pre data set.
Post-treatment proteomic profiles
The proteome of MDD patients treated with ketamine holds great potential for advancing biomedical research and personalized medicine, but it has not been fully explored. In this study, we present an in-depth proteomic analysis of 30 MDD patients following ketamine treatment using a high-resolution, DIA-MS-based strategy. This resulted in the generation of a comprehensive proteome dataset, referred to as DIA-post.
From the cohort, 8118 peptides in total were obtained, with the number ranging between 4876 and 6231 in individual samples, and with 3606 peptides repeatedly detected across all samples (Fig. 3A). After mapping these peptides to the human reference proteome, a total of 528 proteins were quantified in at least one sample, with the number ranging between 401 and 490 proteins in individual samples, and with 315 proteins commonly quantified across all samples (Fig. 3B). These identified proteins were supported by an average of 15 peptides, and 457 of these proteins (86.5%) could be traced and supported by at least 2 peptides (Fig. 3C). The number of samples where a protein was observed was counted. A small number of proteins were found to be restricted to a few samples while most of the proteins were quantified in the majority of the samples analyzed. The distribution of proteins identified in different samples was analyzed, and we found that only 5 proteins were detected in a single sample, that 523 proteins were quantified in at least 2 samples, that up to 315 (59.7%) proteins were simultaneously quantified in all 30 samples, and that, on average, proteins could be detected across 24 samples (Fig. 3D).
Fig. 3.

Profiling of post-treatment samples. A Distribution of the number of quantified peptides across samples; the dash-dotted line shows the number of common peptides in all samples. B Distribution of the number of quantified proteins across samples; the dash-dotted line shows the number of common proteins in all samples. C Distribution of peptide numbers of quantified proteins. D Distribution of protein numbers in samples. E Assessment of individual sample quality with respect to three contamination indices, i.e., coagulation, erythrocyte, and platelet, respectively; the dashed magenta line indicates two standard deviations from the average value. F Comparison of proteins identified in post-treatment samples with Human Plasma Proteome Project (HPPP). G Location distribution of proteins identified in post-treatment samples. H Existence distribution of proteins identified in post-treatment samples; PE1-PE5, evidence levels in the neXtProt database; NA, no information available in the neXtProt database
We compared DIA-post with public data to further evaluate its quality. The sample contamination analysis revealed that no sample was contaminated by erythrocytes, platelets, or coagulation factors (Fig. 3E). Notably, the majority (489/528) of the proteins we identified were also in HPPP, constituting 11% of the HPPP data set (Fig. 3F). In line with the nature of our plasma samples, the identified proteins were mainly secreted into the blood (Fig. 3G). Nearly all of the identified proteins presented PE1 and PE2 levels of existence, and the majority had a level of PE1 (Fig. 3H). Therefore, these discoveries indicate high reliability of the MS-based analysis and high quality of the DIA-post data set.
Proteome differences between ketamine responders and non-responders
Hypothesizing that the differences in patients’ response to ketamine are merely superficial reflections of underlying molecular differences deeply rooted in the proteome, we analyzed altered proteins between ketamine responders and non-responders using the DIA-post data set.
Differential abundance analysis revealed 45 DAPs, accounting for 11.3% of the total quantified post-treatment proteome. Compared to non-responders, 38 out of the 45 DAPs were up-regulated in responders, while the remained were down-regulated (Fig. 4A and B). We then performed unsupervised principal component analysis (PCA) and hierarchical clustering of the samples on the basis of the DAPs. The PCA result revealed a clear separation between responders and non-responders in the first two components (Fig. 4C). In agreement with the PCA result, hierarchical clustering clearly separated the two groups of the samples (Fig. 4D).
Fig. 4.

Proteomic alterations in post-tretment samples between responders (R) and non-responders (NR). A Expression levels of DAPs in responders versus non-responders. Data points indicate the data of individual patients and are presented as medians with interquartile ranges; the center line within each box shows the median, and the top and bottom of each box represent the 75th and 25th percentile values, respectively; the upper and lower whiskers extend from the hinge to the largest and smallest values no further than 1.5 times the distance between the first and third quartiles, respectively; and outliers are presented as circles. B Differential protein abundance profile. C Separation of responders and non-responders by DAPs using principal component analysis. D Hierarchical clustering of responders and non-responders by DAPs
Correlations between protein abundance and HAMD scores measured post ketamine treatment were analyzed. As shown in Fig. 5A and B, there were 31 proteins significantly correlated with post-treatment HAMD scores (p < 0.05), and the correlations were predominantly negative. Among the 31 proteins, there were 9 DAPs, and they were all negatively correlated with post-treatment HAMD scores, with the exception of IGLV2-23.
Fig. 5.

Protein correlation with HAMD scores. A Correlation of proteins with HAMD scores measured post-treatment across samples. B Proteins in A significantly correlated with post-treatment HAMD scores. C Correlation of proteins with decreases in HAMD scores from pre-treatment to post-treatment across samples. D Proteins in C significantly correlated with HAMD score decreases. E-J Correlations of individual proteins with HAMD score decreases. In A and C, magenta dashed lines denote the p value (i.e., 0.05) threshold for a significant correlation; Sig represents significantly correlated; Sig DAP denotes significantly correlated DAP
Correlations between protein abundance and decreases in HAMD scores from pre-treatment to post-treatment were analyzed as well. As shown in Fig. 5C and D, 24 proteins were significantly correlated with HAMD score decreases (p < 0.05), and most of the correlations were positive. Among them, six proteins were also DAPs, namely IGKV2D-30, COMP, IGHV3-64, IGHV3-15, ADAMTSL4, and IGLV2-23. Intriguingly, these six proteins were also significantly correlated with post-treatment HAMD scores. Upon analyzing the correlations of the six proteins, we found a striking pattern: proteins negatively correlated with post-treatment HAMD scores were positively correlated with the reduction in HAMD scores, and vice versa (Supplementary Fig. 2 and Fig. 5E-J). These proteins may constitute a core set of plasma proteins associated with the mechanism by which ketamine alleviates depression.
To further elucidate the function of the six proteins, we annotated them with Gene Ontology terms. The main biological process they are involved in is related to immune response, and they mainly possess the molecular function of binding to other biomolecules (Supplementary Table 1). We then examined their differential expression profiles and found that all but IGLV2-23 were up-regulated in ketamine responders (Fig. 6A-F).
Fig. 6.

Protein function. A-F Expression differences of individual proteins between responders and non-responders. * p < 0.05. (G) Global correlation map showing co-regulation of proteins and clinical parameters; proteins are shown in red font color while clinical parameters are shown in blue font color; protein accession numbers are shown on the x axis and the corresponding genes are shown on the y axis; clinical parameters grp and v14hamdsum denote group label and post-treatment HAMD score, respectively
Proteins frequently collaborate with each other to exert their functions. We used 398 proteins in the DIA-post data set and incorporated 2 clinical parameters (group label and post-treatment HAMD score). The proteins, along with the clinical parameters, comprised a vector of 400 elements. We cross-correlated them to generate a matrix of 160,000 correlation coefficients. We then developed a global correlation map to capture the coordination between the proteins and clinical metrics, aiming to uncover the antidepressant mechanisms of ketamine. As can be seen in Fig. 6G, five of the six proteins form two big cluster areas with other proteins and the group clinical parameter. On the contrary, IGLV2-23, the only protein up-regulated in non-responders and positively correlated with post-treatment HAMD scores, clusters closely with the corresponding clinical parameter and maintains a distinct distance from the other two areas. We further carried out enrichment analysis of proteins belonging to the two clusters, and the enriched pathways are related to immune response. These findings indicate that the antidepressive effect of ketamine results from co-regulation of proteins that perform similar functions in the body.
Bearing these results in mind, we propose that the differences in patients’ response to ketamine is manifested by the six-protein panel and that the antidepressive mechanisms of ketamine is associated mainly with immune response. Compared with the other five proteins, IGLV2-23 functions in an opposite way. It is down-regulated in responders, negatively correlated with HAMD score decreases, and positively correlated with post-treatment HAMD scores. Ketamine is likely to take antidepressive effect by down-regulating IGLV2-23 and up-regulating the other five proteins.
Dynamic proteome rearrangements reveal the effect of ketamine over time
Drug response is reflected in the change that occurs between two states (e.g., pre- and post-treatment), rather than a snapshot of one of them. To identify how ketamine affects the proteome over time, we used matched samples from the same donors in our cohort and performed a paired Student’s t test between matched pre- and post-treatment samples for responders and non-responders, respectively. For easy writing and reading, the comparison in responders is named R_pre_post, and that in non-responders is named NR_pre_post.
Here the differential abundance analysis was performed via paired Student’s t-test using R software. P values were adjusted using the Benjamini–Hochberg method via the p.adjust function in R. A more stringent significance cutoff was used to select DAPs. We chose adjusted p < 0.01 instead of p < 0.05 to reduce the proportion of common DAPs between R_pre_post and NR_pre_post (Supplementary Fig. 3). The change in the cutoff mainly affected the number of DAPs in NR_pre_post, whereas the impact was subtle in R_pre_post. The number of DAPs in NR_pre_post dramatically decreased from 83 to 11. This stringent approach is designed to minimize false positives and uncover accurate results.
We identified 81 significantly altered proteins in responders over the entire time course, accounting for 22.3% of all proteins; however, 97% of the proteins remained unaltered after treatment in non-responders (Fig. 7A and Supplementary Fig. 4). Subsequent PCA and hierarchical clustering revealed that pre- and post-treatment samples of responders were clearly separated by the altered proteins (Fig. 7B and C). Enrichment analysis of up-regulated proteins upon treatment in responders revealed a significant enrichment of adaptive immune response, humoral immune response, plasma lipoprotein remodeling, hydrogen peroxide catabolic process, amyloid fiber formation, response to glucocorticoid, NABA ECM regulators, extracellular matrix organization, hemostasis, and axon development (Fig. 7D). Enrichment analysis of down-regulated proteins upon treatment in responders revealed a significant enrichment of adaptive immune response, blood vessel morphogenesis, response to wounding, and negative regulation of cell differentiation (Fig. 7E). The results indicate ketamine triggers changes in proteins belonging to different functional groups to execute its effect over time post administration.
Fig. 7.

Proteomic rearrangements in ketamine responders over time. A Differential abundance profile. B PCA with DAPs in A. C Hierarchical clustering with DAPs in A, with up- and down-regulated proteins in all samples from pre- to post-treatment shown in insets on the left. D-E Functional enrichment of up- and down-regulated proteins, respectively
Proteins capable of differentiating ketamine responders from non-responders
Identifying a metric to distinguish responders from non-responders before treatment is beneficial to patients and would ultimately facilitate personalized medicine in MDD treatment. Here, we used proteome data from pre-treatment samples to identify proteins that can predict the response of MDD patients to ketamine before treatment.
We performed PCA before differential abundance analysis and found that data points of two samples were located far from other data points (Supplementary Fig. 5). They seemed to be outliers and were removed from analysis to reduce distortion caused by them.
We found 14 DAPs in responders versus non-responders (Supplementary Fig. 6A). Next, PCA revealed that the two groups can be separated by these DAPs to a certain extent (Supplementary Fig. 6B). Even though there were two samples incorrectly clustered into the NR group by hierarchical clustering, the divergence of the two clusters was obvious (Supplementary Fig. 6C).
Next, we performed correlation analysis of protein abundance with HAMD scores measured before treatment. Twenty proteins significantly correlated with pre-treatment HAMD scores were discovered (Fig. 8A and B). Among them, three proteins were also DAPs (Supplementary Fig. 6C) and were negatively correlated with pre-treatment HAMD scores (Fig. 8C-E). These three proteins were also up-regulated in responders (Supplementary Fig. 6C). To determine whether a higher expression level of these proteins indicates a better clinical outcome, we performed receiver operating characteristic (ROC) analysis. Indeed, all three proteins achieved good performance in predicting ketamine response, using the pre-treatment proteomics data only (Fig. 8F-H). Therefore, it is reasonable to apply these proteins as treatment response biomarkers in clinic to identify MDD patients suitable for ketamine treatment at an early stage.
Fig. 8.

Three proteins with predictive value in the response of MDD patients to ketamine before treatment. A-B Protein correlation with pre-treatment HAMD scores. C-E Correlations of pre-treatment HAMD scores with PI16, NEO1, and TNXB, respectively. F–H Predictive performance of PI16, NEO1, and TNXB, with 95% confidence intervals shown as shadows
Discussion
Due to limitations such as low remission rate, delayed onset of effect, and side effects of most currently available antidepressants targeting the monoamine system, the need for a more effective and rapid-acting antidepressant is necessary (Katz et al. 2004). After the study demonstrating that intravenous administration of ketamine may have a rapid effect of antidepression in MDD patients, ketamine has been a focus of attention as a novel antidepressant with a novel target associated with the glutamatergic system (Berman et al. 2000).
Ketamine has been shown to be effective in treating suicidal ideation in emergency room settings, and numerous studies involving both humans and animals have demonstrated its antidepressant effects (Krystal et al. 2019). While encouraging clinical and preclinical findings have been reported, there is still controversy surrounding the efficacy of ketamine in treating MDD. Approximately 10% of depressed patients who receive ketamine treatment do not experience a response, and this percentage may be even higher for individuals with treatment-resistant depression (Murrough et al. 2013; Szymkowicz et al. 2014). This emphasizes efforts in studying ketamine response so that more effective treatment interventions for MDD can be developed.
To date, many efforts have been made to examine transcriptional regulations by ketamine. Mastrodonato et al. found that the activation of ventral CA3 mediates the prophylactic efficacy of ketamine against depressive-like behaviors caused by stress (Mastrodonato et al. 2018). Kim et al. found that the phosphorylation of methyl-CpG-binding protein 2 (MeCP2) at Ser421 is essential for the sustained, but not the rapid, antidepressant effects of ketamine, and additionally, this phosphorylation is required for the long-term regulation of synaptic strength following ketamine treatment (Kim et al. 2021). Ho et al. discovered that ketamine modulates the type I interferon pathway, at least in part by influencing signal transducer and activator of transcription 3 (STAT3) which is crucial for immune responses and may therefore contribute to the antidepressant effects of ketamine (Ho et al. 2019). Bagot et al. found that ketamine induces changes of gene expression in hippocampus and resilience-associated transcription in prefrontal cortex (Bagot et al. 2017).
Although some progress has been made in proteomic research on the antidepressant effects of ketamine, it remains limited to animal models. Shweiki and colleagues conducted label-free shotgun proteomics analysis on mouse brain tissues one hour after s-ketamine administration, and they discovered a significant proteomic pattern of the rapid effect of ketamine in the amygdala (Al Shweiki et al. 2020). In their research involving proteomics and metabolomics in mice, Weckmann and colleagues discovered that ketamine influences the AMPAR subunit Gria2, leading to reduced GABAergic inhibition and subsequently heightened excitatory neuronal activity (Weckmann et al. 2019). Weckmann and team analyzed the hippocampi of mice treated with ketamine using metabolomic and proteomic profiling. Their analysis found that mitochondrial energy metabolism and the antioxidant defense system are key downstream effectors in the response to ketamine (Weckmann et al. 2017).
Human plasma and serum are rich sources of biological information that reflects normal physiological conditions, disease processes, or responses to exposures or interventions (Anderson and Anderson 2002). Laboratory tests most frequently involve proteins and enzymes, highlighting the critical role of the plasma proteome in clinical diagnostics and guiding medical decisions (Geyer et al. 2017). MS-based proteomics now enables highly specific and quantitative analysis of the plasma proteome. Here, we employed plasma proteome profiling of a cohort of 30 MDD patients. To the best of our knowledge, this study represents the first investigation of ketamine response in human beings using plasma proteomics. Our study provides a foundation for future research in this area.
We revealed the proteomic landscape of MDD patients before ketamine treatment for the first time. In pre-treatment proteome, 8034 peptides were obtained, within which 2881 peptides repeatedly detected across all samples; 562 proteins were quantified in at least one sample, with 264 proteins commonly quantified across all samples; the identified proteins were supported by an average of 14 peptides, and 493 of these proteins (87.7%) could be traced and supported by at least 2 peptides; a small number of proteins were found to be restricted to a few samples while most of the proteins were quantified in the majority of the samples analyzed; contamination analysis showed no sample was contaminated by erythrocytes, platelets, or coagulation factors; compared to the HPPP data, the majority (522/562) of the proteins we identified were in HPPP, constituting 12% of the HPPP data set; the identified proteins were mainly secreted into the blood; and nearly all of the identified proteins have a protein existence level of PE1 and PE2, with the majority as PE1.
We revealed the proteomic landscape of MDD patients after ketamine treatment for the first time. In post-treatment proteome, 8118 peptides were obtained, within which 3606 peptides were repeatedly detected across all samples; 528 proteins were quantified in at least one sample, with 315 proteins commonly quantified across all samples; the identified proteins were supported by an average of 15 peptides, and 457 of these proteins (86.5%) could be traced and supported by at least 2 peptides; a small number of proteins were found to be restricted to a few samples while most of the proteins were quantified in the majority of the samples analyzed; contamination analysis showed no sample was contaminated by erythrocytes, platelets, or coagulation factors; compared to the HPPP data, the majority (489/528) of the proteins we identified were in HPPP, constituting 11% of the HPPP data set; the identified proteins were mainly secreted into the blood; and nearly all of the identified proteins have a protein existence level of PE1 and PE2, with the majority as PE1.
Changes in human plasma proteins are widely acknowledged as key indicators of drug effects (Li et al. 2022). After two weeks of ketamine treatment, MDD patients were grouped into responders and non-responders, according to their treatment outcomes. We then analyzed differentially abundant proteins between responders and non-responders. The differential abundance analysis identified 45 DAPs and most of them were up-regulated in responders (Fig. 4). Correlation analysis revealed that six DAPs (namely IGKV2D-30, COMP, IGHV3-64, IGHV3-15, ADAMTSL4, and IGLV2-23) were significantly correlated with the decrease of HAMD scores from pre- to post-treatment (Fig. 5C-J). IGLV2-23 was up-regulated in non-responders and negatively correlated with HAMD decreases. In contrast, the other five proteins were up-regulated in responders and positively correlated with HAMD score decreases. This indicates IGLV2-23 and the other five proteins need to be regulated in opposite modes for ketamine to achieve its intended effect. Using GSE185855 as a validation data set, we confirmed the up-regulation of ADAMTSL4 and IGKV2D-30 in ketamine responders within the external validation cohort (Supplementary Fig. 7) (Cathomas et al. 2022). The unsuccessful validation of the other four proteins may be attributed to differences between the cohorts. Specifically, the validation cohort consisted exclusively of treatment-resistant depression cases, whereas ours additionally included non-resistant depression cases. Furthermore, the discrepancy could also result from differences between RNA-seq and proteomics data because transcriptomes and proteomes of human tissues could be different from each other (Wilhelm et al. 2014). We annotated these six proteins by Gene Ontology, and they are mainly related to immune response biological processes and the biomolecule binding molecular function. Global correlation analysis of protein expression plus clinical parameters revealed that the six proteins and their co-expressed proteins were enriched in pathways associated with immune response (Fig. 6). It is widely recognized that depression correlates with inflammatory factors present in both the innate and adaptive immune systems (Roman and Irwin 2020). Repeated stress in animals can lead to immune activation, which may result in behaviors similar to depression (Hodes et al. 2014). Higher levels of circulating markers of inflammation are associated with a poor response to antidepressant treatment, but the findings regarding ketamine point in the opposite direction (Carvalho et al. 2013; O’Brien et al. 2007). A focused multiplexed proteomic analysis also revealed ketamine-induced alterations in immune markers within rat serum (Wesseling et al. 2015). In line with these existing studies, our findings provide a molecular rationale for the investigation of ketamine as an antidepressant by an immunologic lens that links immune dysfunction to depressive disorders.
We conducted quantitative proteomics analysis to elucidate termporal proteome dynamics of paired plasma samples obtained from MDD patients, both prior to ketamine administration and following completion of the treatment. The plasma proteome profiles of a meticulously documented longitudinal cohort, accompanied by extensive clinical annotations, offers an inaugural prospect for a systematic examination of the dynamic impact of ketamine on MDD over time. The comparison of paired proteomes in non-responders demonstrated subtle alterations over time (Supplementary Fig. 4). This may explain the lack of effectiveness observed in non-responders. Following the comparison of paired proteomes in responders, we characterized the longitudinal trajectories of 81 significantly altered proteins in response to ketamine administration. We then applied functional enrichment analysis to uncover the underlying physiological mechanisms driving these changes. The up-regulated proteins were enriched in adaptive immune response, humoral immune response, plasma lipoprotein remodeling, hydrogen peroxide catabolic process, amyloid fiber formation, response to glucocorticoid, NABA ECM regulators, extracellular matrix organization, hemostasis, and axon development (Fig. 7D). The down-regulated proteins were enriched in adaptive immune response, blood vessel morphogenesis, response to wounding, and negative regulation of cell differentiation (Fig. 7E). Interestingly, Herzog et al. conducted a longitudinal cerebrospinal fluid proteome profiling using an unbiased, hypothesis-free MS-based proteomics approach. Their findings revealed that significantly differentially expressed proteins are predominantly implicated in the glucocorticoid receptor signaling pathway, which aligns with our temporal dynamics analysis (Herzog et al. 2021). The results imply that glucocorticoid plays an important role in the antidepressive action of ketamine.
During the drug selection process, it is crucial to ascertain which patients will exhibit favorable responses to treatment. Clinical studies have demonstrated the efficacy of ketamine infusion in resolving symptoms in MDD patients. However, those findings are usually controversial. For example, Murrough et al. found that a slower processing speed at baseline predicted a better ketamine response, but Gorlyn et al. suggested that slower processing speed is linked to a poorer response (Gorlyn et al. 2008; Murrough et al. 2015). Here we expected to find predictors of ketamine response at the proteomic level. Taking ROC analysis as the strategy, we found the baseline expression levels of three proteins (i.e., PI16, NEO1, and TNXB) exhibit good performance in predicting MDD patients’ response to ketamine treatment. PI16 has shown anti-inflammatory properties and is involved in regulating the immune response (Garrity et al. 2024). NEO1 is known to play a role in various biological processes, including neural development and axon guidance (Wilson and Key 2006). TNXB is predominantly expressed in connective tissues and its function appears to be context-dependent (Chiquet-Ehrismann and Tucker 2011). All the three proteins are negatively correlated with HAMD scores, indicating that higher expression levels of these proteins are associated with lower depression severity. Therefore, these proteins not only have the potential to predict the response to ketamine treatment but also tend to be linked to the pathology of MDD.
Missing values caused by the limit of detection or quantification are widely observed in MS-based proteomics studies. In the present study, proteins of more than 30% missing values were discarded. This criteria of proteomics data filtration has been widely used and it ensures sufficient and high-quality data for downstream analysis (Shenoy et al. 2020; Shu et al. 2020). Regarding the imputation of missing values, we simply replaced them with 0, a common practice in similar studies (Bader et al. 2020; Blume et al. 2020). However, there are other imputation methods that merit consideration in future studies, such as imputation based on a (multivariate) normal distribution or replacing missing values with the minimum value from each sample (Liu and Dongre 2021).
We acknowledge that the present study has some limitations. First, due to the challenges in participant recruitment, the number of plasma samples available for proteomics profiling was limited. Regardless of the promising findings achieved in this initial study, it would be ideal to involve a larger number of clinical samples, preferably from multiple centers. Such an expansion would not only enhance the robustness and generalizability of our findings but also provide a more comprehensive understanding of the variability and consistency of our results across different populations and settings. Second, owing to the relatively small number of participants, the clinical nature of the six core proteins and the three treatment response biomarkers awaits further verification in larger independent populations. Besides statistical analyses, additional experiments need to be performed for stringent validation of the detailed roles of the core proteins and biomarker proteins. Lastly, the lack of long-term follow-up after treatment completion limits clinical manifestations, which should be carefully addressed during the initial design phase of future experiments to ensure more comprehensive outcomes and better support the translation of research into clinical practice.
Conclusions
Although ketamine has been used as a rapid-acting antidepressant, its molecular mechanisms of action remain elusive. In this work, we aimed to study ketamine response from a system-wide perspective at the proteomic level. This was carried out by profiling matched pre- and post-treatment samples of a cohort of 30 MDD patients using an MS-based plasma proteomics strategy. To our knowledge, this is the first large-scale plasma proteomics study in MDD patients. For the first time, we revealed the proteomic landscapes of MDD patients both before and after ketamine treatment. We discovered a panel of six proteins which has core functional relevance with the antidepressive effects of ketamine. By comparing pre- and post-treatment proteomes of the same sample donors, we discerned the temporal pattern of proteomic changes caused by ketamine administration. We analyzed the ability of protein expression levels to predict patients’ response to ketamine, and we identified three proteins as predictors of ketamine response prior to treatment initiation. In conclusion, this is the most extensive quantitative plasma proteomics study of ketamine response in MDD thus far, providing the research community with a rich resource to better understand the response of MDD patients to ketamine. Moreover, it will also shed light on the discovery of valuable biomarker candidates and new strategies for MDD treatment.
Supplementary Information
Below is the link to the electronic supplementary material.
Supplementary Figure 1. Pearson correlation between DIA-pre and DIA-post. Replicate measurements of the same sample show high reproducibility. Points in the diagram represent proteins.
Supplementary Figure 2. Correlation of individual proteins with post-treatment HAMD scores.
Supplementary Figure 3. Shared proteins at different cutoff values. (A) Common DAPs at p < 0.05. (B) Common DAPs at adjusted p < 0.01.
Supplementary Figure 4. Differential abundance profile of non-responders before and after treatment.
Supplementary Figure 5. The two samples as outliers denoted by blue arrows were removed from analysis.
Supplementary Figure 6. Analyses of the DIA-pre data. (A) Differential abundance analysis in R versus NR. (B) PCA based on DAPs in A. (C) Hierarchical clustering based on DAPs in A.
Supplementary Figure 7. Gene expression levels of six DAPs in the data set GSE185855. ADAMTSL4, IGKV2D-30 and IGLV2-23 were up-regulated, and IGHV3-64 was down-regulated in ketamine responders. COMP and IGHV3-15 did not pass the negligible effect size threshold. Large: ***; medium: **; Public data: https://ncbi.nlm.nih.gov/geo/query/acc.cgi?acc=GSE185855; Number of responders: 3; Number of non-responders: 2.
Acknowledgements
Not applicable.
Abbreviations
- MDD
Major depressive disorder
- NMDA
N-methyl-D-aspartate
- FDA
U.S. Food and Drug Administration
- MS
Mass spectrometry
- HAMD
Hamilton Rating Scale for Depression
- DIA
Data independent acquisition
- AGC
Automatic gain control
- HCD
Higher-energy collisional dissociation
- DAP
Differentially abundant protein
- HPPP
Human Plasma Proteome Project
- HPP
Human Proteome Project
- ROC
Receiver operating characteristic
- BMI
Body mass index
- PCA
Principal component analysis
- R
Responder
- NR
Non-responder
- GEO
Gene Expression Omnibus
- TPM
Transcripts per million
Author’s contributions
Nan Zhou: Data curation, Formal Analysis, Investigation, Methodology, Software, Visualization, Writing – original draft. Xiaolei Shi: Methodology, Validation, Writing – original draft. Runhua Wang: Formal Analysis, Investigation, Writing – original draft. Chengyu Wang: Data curation, Visualization. Xiaofeng Lan: Data curation, Visualization. Guanxi Liu: Data curation. Weicheng Li: Data curation. Yanling Zhou: Conceptualization, Project administration, Validation, Writing – review & editing. Yuping Ning: Conceptualization, Funding acquisition, Resources, Supervision, Writing – review & editing.
Funding
The study was partially funded by National Key Research and Development Program of China (grant number 2016YFC0906300), Research Capacity Enhancement Project of Guangzhou Medical University (50010724–1158), Guangdong Basic and Applied Basic Research Foundation (2021A1515011361, 2022A1515220119), and Guangzhou Research-oriented Hospital.
Data availability
All data generated or analyzed during this study are included in this published article and its supplementary information files. Proteomics data deposited in iProX can be accessed with accession IPX0009082000.
Declarations
Ethics approval and consent to participate
The study protocol was approved by the ethics committee for the Affiliated Brain Hospital of Guangzhou Medical University [(2016) No (030)] and was registered in the Chinese Clinical Trials Registry (Registration Number: ChiCTR-OOC-17012239). The study was conducted according to the principles of the Declaration of Helsinki, and oral and written informed consent was obtained from all participants.
This study does not involve any animals.
Consent for publication
Written informed consent was obtained from the participant for publication of this article and any accompanying tables/images. A copy of the written consent is available for review by the Editor of this journal.
Competing interests
The authors declare no competing interests.
Footnotes
Publisher's Note
Springer Nature remains neutral with regard to jurisdictional claims in published maps and institutional affiliations.
Contributor Information
Yanling Zhou, Email: zhouylivy@aliyun.com.
Yuping Ning, Email: ningjeny@126.com.
References
- Al Shweiki MR, Oeckl P, Steinacker P, Barschke P, Pryce C, Dorner-Ciossek C, et al. S-ketamine induces acute changes in the proteome of the mouse amygdala. J Proteomics. 2020;216:103679. [DOI] [PubMed] [Google Scholar]
- Al-Amrani S, Al-Jabri Z, Al-Zaabi A, Alshekaili J, Al-Khabori M. Proteomics: Concepts and applications in human medicine. World J Biol Chem. 2021;12(5):57–69. [DOI] [PMC free article] [PubMed] [Google Scholar]
- Anderson NL, Anderson NG. The Human Plasma Proteome. Mol Cell Proteomics. 2002;1(11):845–67. [DOI] [PubMed] [Google Scholar]
- Bader JM, Geyer PE, Müller JB, Strauss MT, Koch M, Leypoldt F, et al. Proteome profiling in cerebrospinal fluid reveals novel biomarkers of Alzheimer’s disease. Mol Syst Biol. 2020;16(6):e9356. [DOI] [PMC free article] [PubMed] [Google Scholar]
- Bagot RC, Cates HM, Purushothaman I, Vialou V, Heller EA, Yieh L, et al. Ketamine and Imipramine Reverse Transcriptional Signatures of Susceptibility and Induce Resilience-Specific Gene Expression Profiles. Biol Psychiat. 2017;81(4):285–95. [DOI] [PMC free article] [PubMed] [Google Scholar]
- Berman RM, Cappiello A, Anand A, Oren DA, Heninger GR, Charney DS, et al. Antidepressant effects of ketamine in depressed patients. Biol Psychiat. 2000;47(4):351–4. [DOI] [PubMed] [Google Scholar]
- Blume JE, Manning WC, Troiano G, Hornburg D, Figa M, Hesterberg L, et al. Rapid, deep and precise profiling of the plasma proteome with multi-nanoparticle protein corona. Nat Commun. 2020;11(1):3662. [DOI] [PMC free article] [PubMed] [Google Scholar]
- Cai H, Xie X-M, Zhang Q, Cui X, Lin J-X, Sim K, et al. Prevalence of Suicidality in Major Depressive Disorder: A Systematic Review and Meta-Analysis of Comparative Studies. Front Psychiatry. 2021;16(12):690130. [DOI] [PMC free article] [PubMed] [Google Scholar]
- Carvalho LA, Torre JP, Papadopoulos AS, Poon L, Juruena MF, Markopoulou K, et al. Lack of clinical therapeutic benefit of antidepressants is associated overall activation of the inflammatory system. J Affect Disord. 2013;148(1):136–40. [DOI] [PubMed] [Google Scholar]
- Cathomas F, Bevilacqua L, Ramakrishnan A, Kronman H, Costi S, Schneider M, et al. Whole blood transcriptional signatures associated with rapid antidepressant response to ketamine in patients with treatment resistant depression. Transl Psychiatry. 2022;12(1):12. [DOI] [PMC free article] [PubMed] [Google Scholar]
- Chen T, Ma J, Liu Y, Chen Z, Xiao N, Lu Y, et al. iProX in 2021: connecting proteomics data sharing with big data. Nucleic Acids Res. 2022;50(D1):D1522–7. [DOI] [PMC free article] [PubMed] [Google Scholar]
- Chiquet-Ehrismann R, Tucker RP. Tenascins and the Importance of Adhesion Modulation. Cold Spring Harb Perspect Biol. 2011;3(5):a004960–a004960. [DOI] [PMC free article] [PubMed] [Google Scholar]
- Cliff N. Dominance statistics: Ordinal analyses to answer ordinal questions. Psychol Bull. 1993;114(3):494–509. [Google Scholar]
- Cliff N. Answering Ordinal Questions with Ordinal Data Using Ordinal Statistics. Multivar Behav Res. 1996;31(3):331–50. [DOI] [PubMed] [Google Scholar]
- Deutsch EW, Omenn GS, Sun Z, Maes M, Pernemalm M, Palaniappan KK, et al. Advances and Utility of the Human Plasma Proteome. J Proteome Res. 2021;20(12):5241–63. [DOI] [PMC free article] [PubMed] [Google Scholar]
- Garrity R, Haque A, Kavelaars A, Heijnen C, Shepherd A. Fibroblast-derived PI16 Drives the Physiological Process of Immune Cell Recruitment and Activation During Inflammatory Response. J Pain. 2024;25(4):13. [Google Scholar]
- Geyer PE, Holdt LM, Teupser D, Mann M. Revisiting biomarker discovery by plasma proteomics. Mol Syst Biol. 2017;13(9):942. [DOI] [PMC free article] [PubMed] [Google Scholar]
- Geyer PE, Voytik E, Treit PV, Doll S, Kleinhempel A, Niu L, et al. Plasma Proteome Profiling to detect and avoid sample-related biases in biomarker studies. EMBO Mol Med. 2019;11(11):e10427. [DOI] [PMC free article] [PubMed] [Google Scholar]
- Gorlyn M, Keilp JG, Grunebaum MF, Taylor BP, Oquendo MA, Bruder GE, et al. Neuropsychological characteristics as predictors of SSRI treatment response in depressed subjects. J Neural Transm. 2008;115(8):1213–9. [DOI] [PMC free article] [PubMed] [Google Scholar]
- Gotlib IH, Joormann J. Cognition and Depression: Current Status and Future Directions. Annu Rev Clin Psychol. 2010;6(1):285–312. [DOI] [PMC free article] [PubMed] [Google Scholar]
- Grady SE, Marsh TA, Tenhouse A, Klein K. Ketamine for the treatment of major depressive disorder and bipolar depression: A review of the literature. Mental Health Clin. 2017;7(1):16–23. [DOI] [PMC free article] [PubMed] [Google Scholar]
- Herzog DP, Perumal N, Manicam C, Treccani G, Nadig J, Rossmanith M, et al. Longitudinal CSF proteome profiling in mice to uncover the acute and sustained mechanisms of action of rapid acting antidepressant (2R,6R)-hydroxynorketamine (HNK). Neurobiol Stress. 2021;15:100404. [DOI] [PMC free article] [PubMed] [Google Scholar]
- Ho M-F, Zhang C, Zhang L, Li H, Weinshilboum RM. Ketamine and Active Ketamine Metabolites Regulate STAT3 and the Type I Interferon Pathway in Human Microglia: Molecular Mechanisms Linked to the Antidepressant Effects of Ketamine. Front Pharmacol. 2019;5(10):1302. [DOI] [PMC free article] [PubMed] [Google Scholar]
- Hodes GE, Pfau ML, Leboeuf M, Golden SA, Christoffel DJ, Bregman D, et al. Individual differences in the peripheral immune system promote resilience versus susceptibility to social stress. Proc Natl Acad Sci USA. 2014;111(45):16136–41. [DOI] [PMC free article] [PubMed] [Google Scholar]
- Katz MM, Tekell JL, Bowden CL, Brannan S, Houston JP, Berman N, et al. Onset and Early Behavioral Effects of Pharmacologically Different Antidepressants and Placebo in Depression. Neuropsychopharmacol. 2004;29(3):566–79. [DOI] [PubMed] [Google Scholar]
- Kennedy SH. Core symptoms of major depressive disorder: relevance to diagnosis and treatment. Dialogues Clin Neurosci. 2008;10(3):271–7. [DOI] [PMC free article] [PubMed] [Google Scholar]
- Kim J-W, Autry AE, Na ES, Adachi M, Björkholm C, Kavalali ET, et al. Sustained effects of rapidly acting antidepressants require BDNF-dependent MeCP2 phosphorylation. Nat Neurosci. 2021;24(8):1100–9. [DOI] [PMC free article] [PubMed] [Google Scholar]
- Krystal JH, Abdallah CG, Sanacora G, Charney DS, Duman RS. Ketamine: A Paradigm Shift for Depression Research and Treatment. Neuron. 2019;101(5):774–8. [DOI] [PMC free article] [PubMed] [Google Scholar]
- Krystal JH, Kavalali ET, Monteggia LM. Ketamine and rapid antidepressant action: new treatments and novel synaptic signaling mechanisms. Neuropsychopharmacol. 2024;49(1):41–50. [DOI] [PMC free article] [PubMed] [Google Scholar]
- Li T, Qu H, Ding H, Deng H, Chen Y. Profiling of proteome changes in plasma of HIV-infected patients receiving antiretroviral therapy. Proteomics Clinical Apps. 2022;16(6):2100099. [DOI] [PubMed] [Google Scholar]
- Lin MS, Jo S-Y, Luebeck J, Chang HY, Wu S, Mischel PS, et al. Transcriptional immune suppression and up-regulation of double-stranded DNA damage and repair repertoires in ecDNA-containing tumors. eLife. 2024;12:RP88895. [DOI] [PMC free article] [PubMed] [Google Scholar]
- Liu M, Dongre A. Proper imputation of missing values in proteomics datasets for differential expression analysis. Brief Bioinform. 2021;22(3):bbaa112. [DOI] [PubMed] [Google Scholar]
- Mastrodonato A, Martinez R, Pavlova IP, LaGamma CT, Brachman RA, Robison AJ, et al. Ventral CA3 Activation Mediates Prophylactic Ketamine Efficacy Against Stress-Induced Depressive-like Behavior. Biol Psychiat. 2018;84(11):846–56. [DOI] [PMC free article] [PubMed] [Google Scholar]
- Murrough JW, Iosifescu DV, Chang LC, Al Jurdi RK, Green CE, Perez AM, et al. Antidepressant Efficacy of Ketamine in Treatment-Resistant Major Depression: A Two-Site Randomized Controlled Trial. Am J Psychiatry. 2013;170(10):1134–42. [DOI] [PMC free article] [PubMed] [Google Scholar]
- Murrough JW, Burdick KE, Levitch CF, Perez AM, Brallier JW, Chang LC, et al. Neurocognitive Effects of Ketamine and Association with Antidepressant Response in Individuals with Treatment-Resistant Depression: A Randomized Controlled Trial. Neuropsychopharmacol. 2015;40(5):1084–90. [DOI] [PMC free article] [PubMed] [Google Scholar]
- O’Brien SM, Scully P, Fitzgerald P, Scott LV, Dinan TG. Plasma cytokine profiles in depressed patients who fail to respond to selective serotonin reuptake inhibitor therapy. J Psychiatr Res. 2007;41(3–4):326–31. [DOI] [PubMed] [Google Scholar]
- Roman M, Irwin MR. Novel neuroimmunologic therapeutics in depression: A clinical perspective on what we know so far. Brain Behav Immun. 2020;83:7–21. [DOI] [PMC free article] [PubMed] [Google Scholar]
- Shenoy A, BelugaliNataraj N, Perry G, Loayza Puch F, Nagel R, Marin I, et al. Proteomic patterns associated with response to breast cancer neoadjuvant treatment. Mol Syst Biol. 2020;16(9):e9443. [DOI] [PMC free article] [PubMed] [Google Scholar]
- Shin C, Kim Y-K. Ketamine in Major Depressive Disorder: Mechanisms and Future Perspectives. Psychiatry Investig. 2020;17(3):181–92. [DOI] [PMC free article] [PubMed] [Google Scholar]
- Shu T, Ning W, Wu D, Xu J, Han Q, Huang M, et al. Plasma Proteomics Identify Biomarkers and Pathogenesis of COVID-19. Immunity. 2020;53(5):1108-1122.e5. [DOI] [PMC free article] [PubMed] [Google Scholar]
- Szymkowicz SM, Finnegan N, Dale RM. Failed Response to Repeat Intravenous Ketamine Infusions in Geriatric Patients With Major Depressive Disorder. J Clin Psychopharmacol. 2014;34(2):285–6. [DOI] [PMC free article] [PubMed] [Google Scholar]
- Targum SD, Fava M. Fatigue as a residual symptom of depression. Innov Clin Neurosci. 2011;8(10):40–3. [PMC free article] [PubMed] [Google Scholar]
- Uhlén M, Fagerberg L, Hallström BM, Lindskog C, Oksvold P, Mardinoglu A, et al. Tissue-based map of the human proteome. Science. 2015;347(6220):1260419. [DOI] [PubMed] [Google Scholar]
- Uhlén M, Karlsson MJ, Hober A, Svensson A-S, Scheffel J, Kotol D, et al. The human secretome. Sci Signal. 2019;12(609):eaaz0274. [DOI] [PubMed] [Google Scholar]
- Weckmann K, Deery MJ, Howard JA, Feret R, Asara JM, Dethloff F, et al. Ketamine’s antidepressant effect is mediated by energy metabolism and antioxidant defense system. Sci Rep. 2017;7(1):15788. [DOI] [PMC free article] [PubMed] [Google Scholar]
- Weckmann K, Deery MJ, Howard JA, Feret R, Asara JM, Dethloff F, et al. Ketamine’s Effects on the Glutamatergic and GABAergic Systems: A Proteomics and Metabolomics Study in Mice. Complex Psychiatry. 2019;5(1):42–51. [DOI] [PMC free article] [PubMed] [Google Scholar]
- Wei Y, Chang L, Hashimoto K. A historical review of antidepressant effects of ketamine and its enantiomers. Pharmacol Biochem Behav. 2020;190:172870. [DOI] [PubMed] [Google Scholar]
- Wesseling H, Rahmoune H, Tricklebank M, Guest PC, Bahn S. A Targeted Multiplexed Proteomic Investigation Identifies Ketamine-Induced Changes in Immune Markers in Rat Serum and Expression Changes in Protein Kinases/Phosphatases in Rat Brain. J Proteome Res. 2015;14(1):411–21. [DOI] [PubMed] [Google Scholar]
- Wilhelm M, Schlegl J, Hahne H, Gholami AM, Lieberenz M, Savitski MM, et al. Mass-spectrometry-based draft of the human proteome. Nature. 2014;509(7502):582–7. [DOI] [PubMed] [Google Scholar]
- Wilson NH, Key B. Neogenin interacts with RGMa and Netrin-1 to guide axons within the embryonic vertebrate forebrain. Dev Biol. 2006;296(2):485–98. [DOI] [PubMed] [Google Scholar]
- Wu H, Savalia NK, Kwan AC. Ketamine for a Boost of Neural Plasticity: How, but Also When? Biol Psychiat. 2021;89(11):1030–2. [DOI] [PMC free article] [PubMed] [Google Scholar]
- Zahn-Zabal M, Michel P-A, Gateau A, Nikitin F, Schaeffer M, Audot E, et al. The neXtProt knowledgebase in 2020: data, tools and usability improvements. Nucleic Acids Res. 2020;48(D1):D328–34. [DOI] [PMC free article] [PubMed] [Google Scholar]
- Zanos P, Gould TD. Mechanisms of ketamine action as an antidepressant. Mol Psychiatry. 2018;23(4):801–11. [DOI] [PMC free article] [PubMed] [Google Scholar]
- Zhou Y, Zhou B, Pache L, Chang M, Khodabakhshi AH, Tanaseichuk O, et al. Metascape provides a biologist-oriented resource for the analysis of systems-level datasets. Nat Commun. 2019;10(1):1523. [DOI] [PMC free article] [PubMed] [Google Scholar]
Associated Data
This section collects any data citations, data availability statements, or supplementary materials included in this article.
Supplementary Materials
Supplementary Figure 1. Pearson correlation between DIA-pre and DIA-post. Replicate measurements of the same sample show high reproducibility. Points in the diagram represent proteins.
Supplementary Figure 2. Correlation of individual proteins with post-treatment HAMD scores.
Supplementary Figure 3. Shared proteins at different cutoff values. (A) Common DAPs at p < 0.05. (B) Common DAPs at adjusted p < 0.01.
Supplementary Figure 4. Differential abundance profile of non-responders before and after treatment.
Supplementary Figure 5. The two samples as outliers denoted by blue arrows were removed from analysis.
Supplementary Figure 6. Analyses of the DIA-pre data. (A) Differential abundance analysis in R versus NR. (B) PCA based on DAPs in A. (C) Hierarchical clustering based on DAPs in A.
Supplementary Figure 7. Gene expression levels of six DAPs in the data set GSE185855. ADAMTSL4, IGKV2D-30 and IGLV2-23 were up-regulated, and IGHV3-64 was down-regulated in ketamine responders. COMP and IGHV3-15 did not pass the negligible effect size threshold. Large: ***; medium: **; Public data: https://ncbi.nlm.nih.gov/geo/query/acc.cgi?acc=GSE185855; Number of responders: 3; Number of non-responders: 2.
Data Availability Statement
All data generated or analyzed during this study are included in this published article and its supplementary information files. Proteomics data deposited in iProX can be accessed with accession IPX0009082000.