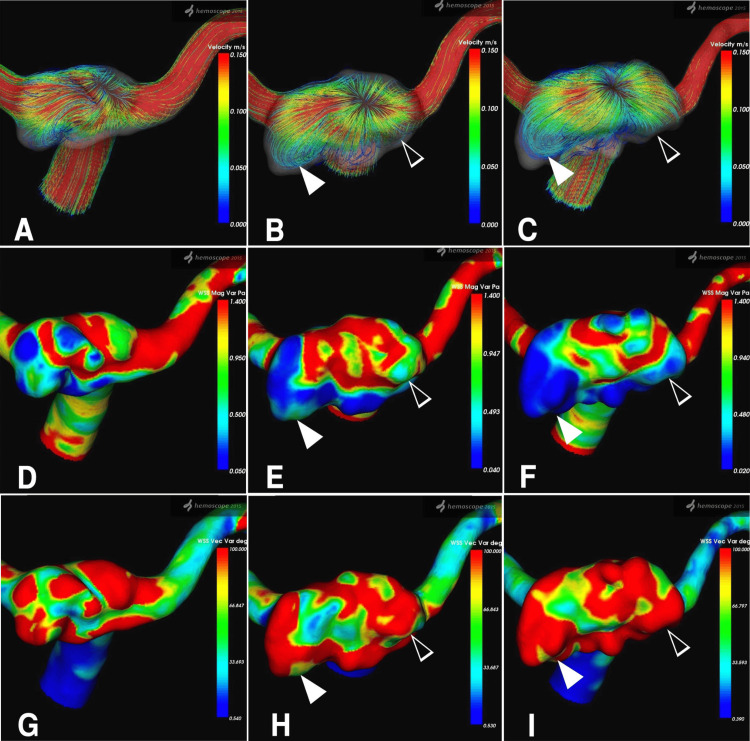
Figure 3. Hemodynamic assessment of the RC, demonstrating temporal changes in the streamline, WSSm, and WSSv parameters.
A-C) Sequential images of streamlines viewed from the superior-inferior direction at 14 days, 6 months, and 1-year post-treatment, respectively. The color bar on the right indicates velocity (m/s), ranging from 0.150 (red, representing higher velocity) to 0.000 (blue, representing lower velocity). A high-velocity streamline (red) is observed centrally in the remnant, streaming in and out like a fountain. In contrast, reduced streamline velocity (blue) is seen in the left postero-lateral region (white arrowhead) and the right lateral region (empty white arrowhead) of the enlarged RC. D-F) Sequential images of WSSm at 14 days, 6 months, and 1 year post-treatment, respectively. WSSm (Pa) is represented by a color bar ranging from 1.400 (red) to 0.050 (blue). A decrease in WSSm is evident in the left postero-lateral region (white arrowhead) and the right lateral region (empty white arrowhead) of the enlarged RC. G-I) Sequential images of WSSv at 14 days, 6 months, and 1-year post-treatment, respectively. WSSv (degree) is displayed with a range of 100.000 (red) to 0.540 (blue). An increase in WSSv is shown in the left postero-lateral region (white arrowhead) and the right lateral region (empty white arrowhead) of the enlarged RC.
RC: residual cavity; WSSm: wall shear stress magnitude; WSSv: wall shear stress vector

