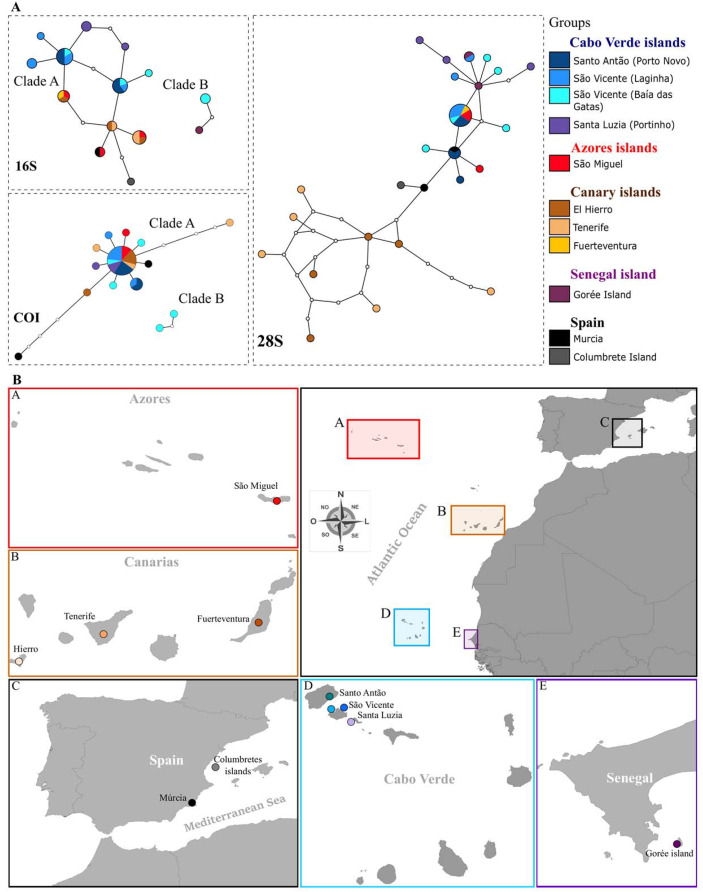
Figure 4. Haplotype networks and Map of sampling localities.
(A) Haplotype networks (95% parsimony connection limit) for all sequenced P. rudis COI, 16S and 28S data. Lines connecting white dots represent mutation steps between haplotypes, while white dots represent theoretical intermediate haplotypes. (B) Map of sampling localities included in the present work: A-Azores islands, B-Canary Islands, C-Spain, D–Cabo Verde islands, E-Gorée Island.

