Abstract
In recent years, machine learning has gained substantial attention for its ability to predict complex chemical and biological properties, including those of pharmaceutical compounds. This study proposes a machine learning-based quantitative structure-property relationship (QSPR) model for predicting the physicochemical properties of anti-arrhythmia drugs using topological descriptors. Anti-arrhythmic drug development is challenging due to the complex relationship between chemical structure and drug efficacy. To address this, we applied machine learning techniques, specifically linear regression models combined with K-fold cross-validation, to predict critical properties such as Density, Boiling Point, Flash Point, Bioconcentration Factor (BCF), Organic Carbon Partition Coefficient (KOC), Polarizability, and Molar Volume. The models were developed using data from ten anti-arrhythmic drugs ( to
to  ). We evaluated the models based on performance metrics such as R and
  and obtained significant results. Most accurate predictions are obtained for polarizability from models with H(G) and
  .
.
Keywords: Anti-arrhythmia drugs, Linear regression model, Pyhton algorithm, Topological indices, Entropy, QSPR analysis
Subject terms: Physical chemistry, Applied mathematics
Introduction
Arrhythmia is an irregular heartbeat that is either too fast (tachycardia), too slow (bradycardia) or erratic. This disruption to the smooth flow of heart activity can obstruct blood circulation, which results in more severe complications like stroke, heart failure, or sudden cardiac arrest. There are several causes of arrhythmia, including heart structural changes, electrolyte imbalances, and health conditions. Understanding the mechanisms and consequences of arrhythmia is essential for developing the best solutions to overcome this disease1,2.
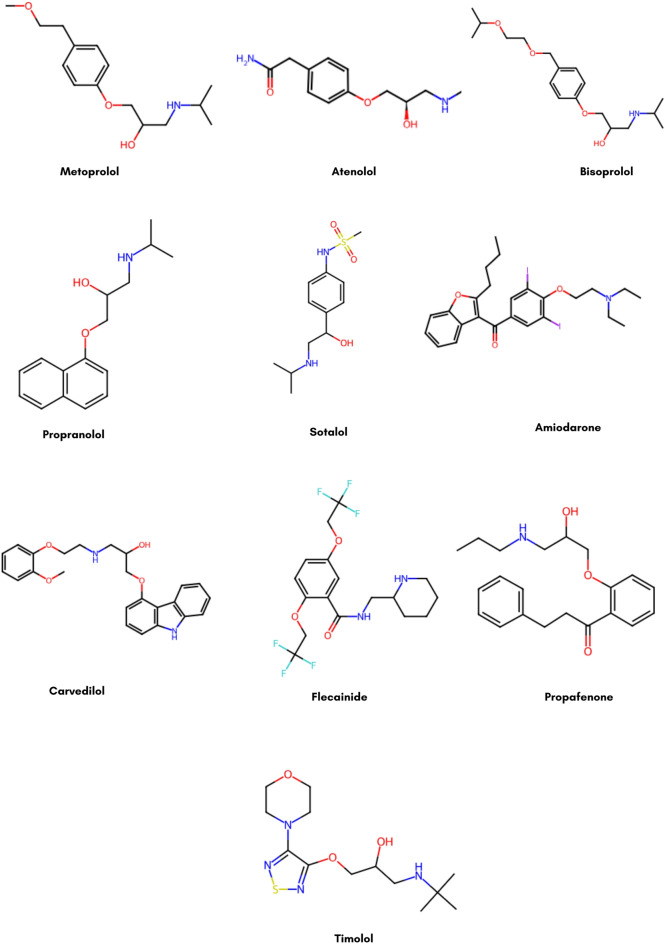
We have used the ten most effective anti-arrhythmia drugs in Fig. 2 from literature in our study. Metoprolol 3, Atenolol
 4, Bisoprolol
 5 and Propranol
 6 are beta-blockers slow the heart rate and decrease how much oxygen the heart needs. Sotalol
 7 is a beta-blocker and an antiarrhythmic agent that can mediate arrhythmias (maintain sinus rhythm). Amiodarone
 8 and Carvedilol
 9 are frequently prescribed for more severe arrhythmias because they can also control heart rate. Flecainide
 10 and Propafenone
 11 are sodium channel blockers used to stabilize the heart’s electrical signals. Another beta-blocker is timolol
 12, which helps control heart rate in certain arrhythmias. The decision to use these drugs is based on their well-known mechanism of action affecting a wide range of arrhythmias. There are some slight side effects of these drugs, such as metoprolol and atenolol, which can cause fatigue and dizziness. In contrast, amiodarone is related to severe adverse effects like thyroid dysfunction and pulmonary toxicity. By prolonging the QT interval, sotalol carries a risk of causing additional arrhythmias. We have utilized topological indices, entropy, and chemical graph theory to predict the physicochemical properties of drugs so that more effective drugs can be developed faster.
Fig. 2.
Structures of anti-arrhythmia drugs.
Graph theory is a branch of mathematics that originated in the 18th century by Euler with the famous Seven Bridges of Königsberg problem, in which we study the properties and applications of graphs. Graphs consist of a set of points, known as vertices, and the lines connecting them are edges. The degree of a vertex  represents the number of edges incident to that vertex13,14. By using chemical graph theory chemical structures in the form of graphs can be used to analyze and predict their physicochemical properties through the application of topological descriptors15. These graph-based structures are also employed in QSPR (Quantitative Structure-Property Relationship) analysis to facilitate the design of new drugs16,17.
Entropy has become a crucial analytical tool in various scientific disciplines, including mathematics, graph theory, and computational modeling. Haynes et al. explain that entropy is now used in social sciences and engineering beyond its original use in environmental sciences, showing its adaptability in modeling complex systems18. Constantino Tsallis introduced a new type of entropy to link natural and social sciences to facilitate the study of unpredictable systems, such as drug molecules with different structures19. Omar El Deeb analyzed voter uncertainty and transitions and applied entropic spatial autocorrelation to identify disorder patterns in structured systems such as electoral districts20. Entropy is also known to have an essential role in drug discovery, particularly in Quantitative Structure-Property Relationship (QSPR) analysis, where researchers use this measure of variability within molecular graphs to improve the prediction accuracy of molecule properties. Bokhary et al.21 explored breast cancer drugs and did their analysis. Phenolic compounds in moringa oleifera were studied by Yang et al.22 using molecular descriptors. Wei et al.23 conducted a QSPR analysis using linear regression models to explore the relationship between the topological indices of various drugs and their physical properties. Siddiqui et al.24 analyzed enthalpy and entropy measures of iron oxide. Liu et al.25 did a curvilinear regression analysis of benzene models using some new proposed entropies. Hanif et al.26 conducted a comprehensive analysis of a two-dimensional star gold structure, focusing on the relationship between degree-based topological indices and entropy through regression models. Their study enhances the understanding of the network’s behavior by showing patterns that link topological descriptors with entropies. Huang et al.27 performed a detailed physical analysis of topological indices for the iron disulfide using a curve-fitting model to explore the relationship between these indices and thermodynamic properties.
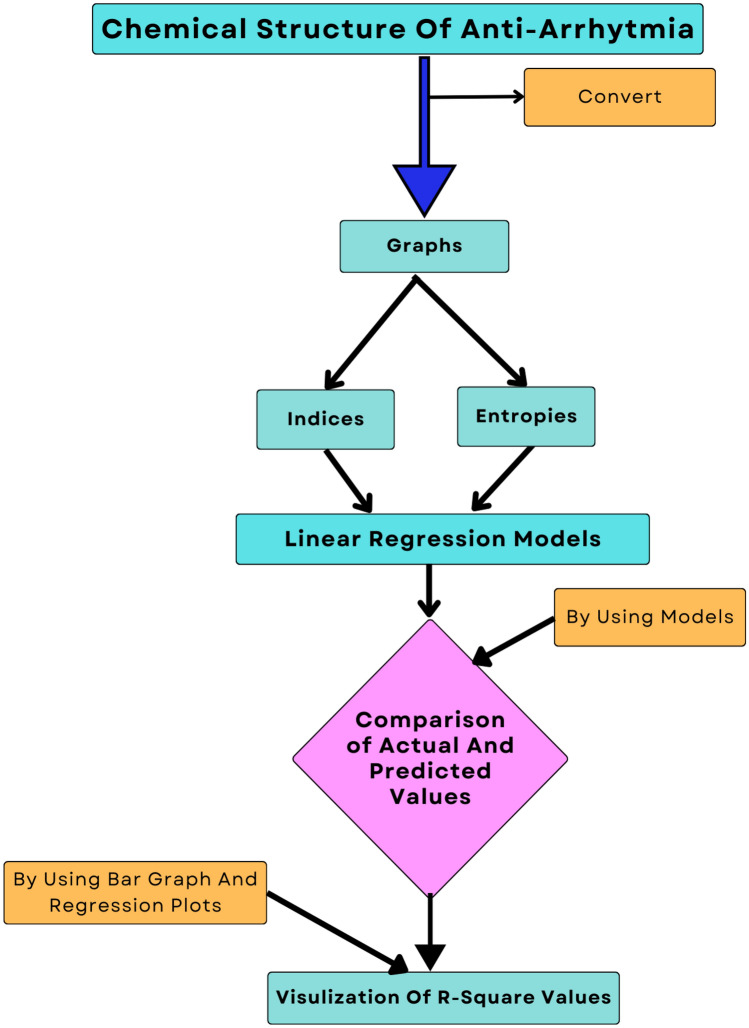
In our study, we analyzed the chemical structures of anti-arrhythmia drugs using degree-based topological indices and entropy Table 1 calculated through a Python script developed for this study. We then conducted a QSPR analysis, developed linear regression models, and utilized k-fold cross-validation for more accurate predictions Fig. 1.
Table 1.
Topological descriptors and entropy.
| Descriptor name | Indices | Formula | Entropy | Formula |
|---|---|---|---|---|
| First Zagreb Index |  |
 |
 |
 |
| Second Zagreb Index |  |
 |
 |
 |
| Harmonic Index | H(G) |  |
 |
 |
| Forgotten Index | F(G) |  |
 |
 |
| Shilpa-Shanmukha Index | SS(G) |  |
 |
 |
Fig. 1.
Flow chart.
Methodology
Different most effective drugs for Arrhythmia were selected based on the literature review, and their chemical structures were converted into graphs with the help of chemical graph theory.
Degree-based edge partition was performed on all structures to get frequencies of edges with the same start and end vertices
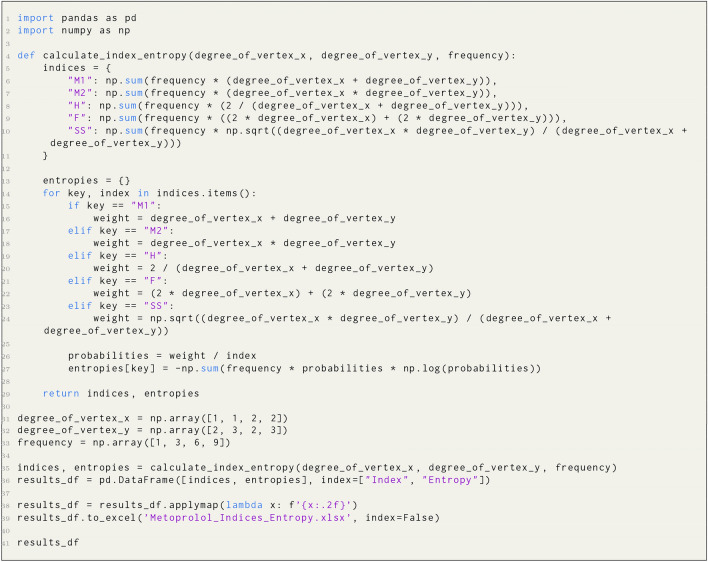
Instead of manual calculations, a Python program was developed to perform the computation of topological indices and entropies. The program begins by importing the necessary libraries, such as Numpy, for numerical computations and Pandas for processing data into data frames Listing 1, Listing 2.
For all physicochemical properties 3 regression models were developed based on indices and entropies using the Python library for more accurate results, and an anaconda environment was used to maintain consistency and enhance computational efficiency.
Effectiveness of predicted values using entropies and indices regression model was analyzed by comparing actual vs predicted values.
In the final step, the
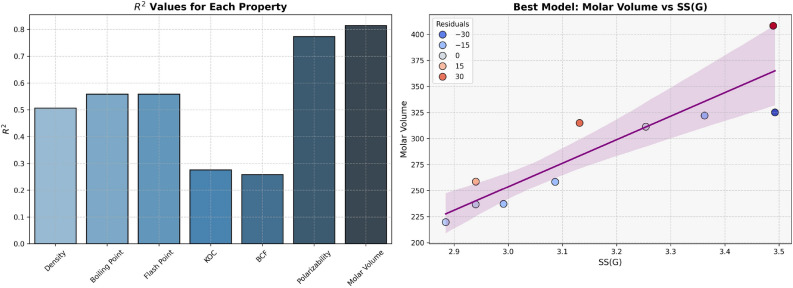
 value for all models was visualized using a bar graph to decide which is best. Further, for the best model, a scatter plot was visualized to see how much difference there is between the original and predicted values.
The Best model for predicting a property is selected based on
 value, which is visualized using bar graphs for each property and a scatter plot with residual values plotted.
Table 3.
Topological indices and entropy values for drugs.
| Drugs |

|

|
H(G) | F(G) | SS(G) |

|

|

|

|

|
|---|---|---|---|---|---|---|---|---|---|---|
| Metoprolol | 84.00 | 89.00 | 8.77 | 168.00 | 19.27 | 2.94 | 2.90 | 2.93 | 2.94 | 2.94 |
| Atenolol | 86.00 | 91.00 | 8.50 | 172.00 | 19.28 | 2.94 | 2.90 | 2.94 | 2.94 | 2.94 |
| Bisoprolol | 102.00 | 107.00 | 10.50 | 204.00 | 23.28 | 3.13 | 3.10 | 3.13 | 3.13 | 3.13 |
| Propranolol | 92.00 | 103.00 | 8.87 | 184.00 | 20.81 | 2.99 | 2.94 | 2.99 | 2.99 | 2.99 |
| Sotalol | 86.00 | 92.00 | 7.67 | 172.00 | 18.33 | 2.88 | 2.84 | 2.88 | 2.88 | 2.88 |
| Amiodarone | 156.00 | 184.00 | 14.53 | 312.00 | 34.86 | 3.48 | 3.42 | 3.47 | 3.48 | 3.49 |
| Carvedilol | 154.00 | 180.00 | 14.53 | 308.00 | 35.05 | 3.48 | 3.44 | 3.48 | 3.48 | 3.49 |
| Flecainide | 140.00 | 153.00 | 12.23 | 280.00 | 29.95 | 3.36 | 3.32 | 3.36 | 3.36 | 3.36 |
| Propafenone | 116.00 | 128.00 | 11.93 | 232.00 | 26.86 | 3.25 | 3.21 | 3.25 | 3.25 | 3.25 |
| Timolol | 104.00 | 115.00 | 9.50 | 208.00 | 22.82 | 3.08 | 3.04 | 3.08 | 3.08 | 3.09 |
Result and discussion
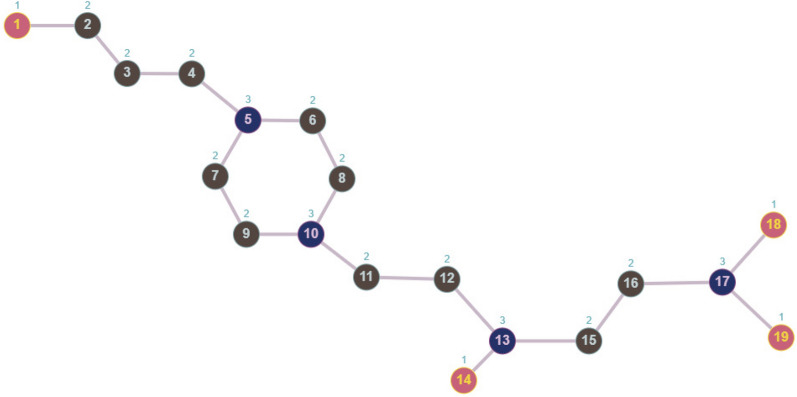
The Topological indices and entropy used in our study and their calculated values are shown in Table 3. The actual values for the chemical properties of these drugs, such as Density, Boiling Point, Flash Point, BCF, KOC, Polarizability, and Molar Volume, have been sourced from ChemSpider and are listed in Table 4. Python has been used to calculate topological indices and entropy, and code for a few drugs is given below. In the first algorithm, topological indices and entropy values are computed for Metoprolol using degree-based edge partition as given in Table 2 from Fig. 3.
Table 4.
Physicochemical properties.
| Name of drugs | Density | Boiling point | Flash point | BCF | KOC | Polarizability | Molar volume |
|---|---|---|---|---|---|---|---|
| Metoprolol | 1.00 | 398.60 | 194.90 | 1.00 | 1.00 | 30.60 | 258.70 |
| Atenolol | 1.10 | 508.00 | 261.10 | 1.00 | 1.00 | 29.40 | 236.70 |
| Bisoprolol | 1.00 | 445.00 | 222.90 | 1.00 | 1.00 | 36.70 | 315.00 |
| Propranolol | 1.10 | 434.90 | 216.80 | 1.25 | 1.00 | 31.30 | 237.20 |
| Sotalol | 1.20 | 443.30 | 221.90 | 1.00 | 1.00 | 28.60 | 219.70 |
| Amiodarone | 1.60 | 635.10 | 337.90 | 214.87 | 223.42 | 57.20 | 408.20 |
| Carvedilol | 1.30 | 655.20 | 350.10 | 1.51 | 8.15 | 47.40 | 325.10 |
| Flecainide | 1.30 | 434.90 | 216.80 | 1.00 | 1.07 | 34.80 | 322.10 |
| Propafenone | 1.10 | 519.60 | 268.00 | 1.00 | 1.61 | 39.80 | 311.40 |
| Timolol | 1.20 | 487.20 | 248.50 | 1.00 | 1.00 | 32.60 | 258.50 |
Table 2.
Edge partition for metoprolol.
| Edge Partition | (1,2) | (1,3) | (2,2) | (2,3) |
|---|---|---|---|---|
| Frequency | 1 | 3 | 6 | 9 |
Fig. 3.
Graph for metoprolol.
Algorithm 1
The linear equation  represents the relationship between topological indices and properties, and the linear equation
  represents the relationship between entropy and properties. Here, P is the dependent variable referred to as the target property. TI and ENT are independent variables referred to as Topological Index and Entropy. (S) denotes the slope of the regression line, and C denotes the
  intercept. To minimize the difference between the actual and predicted value, the (TI) and C values must be ascertained. Here, R denotes the correlation coefficient, and R2 denotes its square. If the correlation coefficient’s value is near 1, it shows the best prediction. For a better assessment of the QSPR Model, it is necessary to measure its prediction using different metrics, including the (R),
  and
and  .
.
Algorithm 2
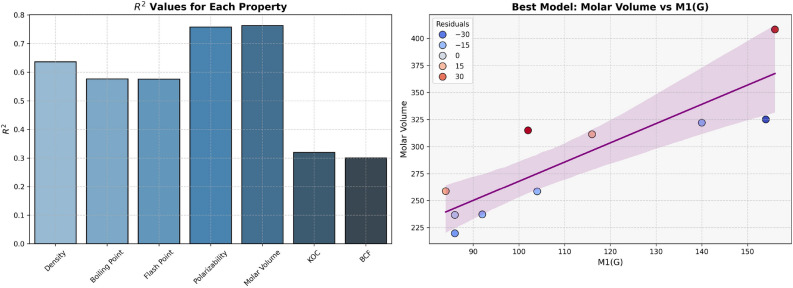
Table 5 shows that the regression models for Polarizability and Molar Volume have strong correlations, as indicated by their high  values, which are 0.7577 and 0.7631 respectively, and low p-values, suggesting that
  is a good predictor for these properties. Conversely, models like BCF and KOC have lower
  values of 0.3003 and 0.3196, respectively, and higher p-values, indicating weaker predictive strength. Density, Boiling Point, and Flashpoint models show moderate predictive strength as indicated by average
  and p-values, also visualized in Fig. 4.
Table 5.
Statistical parameters and regression models for  .
.
| Models | R |  |
P-value |
|---|---|---|---|
Density = 
|
0.7980 | 0.6368 | 0.0057 |
Boiling Point = 
|
0.7594 | 0.5766 | 0.0108 |
Flash Point = 
|
0.7591 | 0.5763 | 0.0109 |
Polarizability = 
|
0.8705 | 0.7577 | 0.0011 |
Molar Volume = 
|
0.8736 | 0.7631 | 0.0010 |
BCF = 
|
0.5480 | 0.3003 | 0.1010 |
KOC = 
|
0.5653 | 0.3196 | 0.0886 |
Fig. 4.
Graphical representation of  .
.
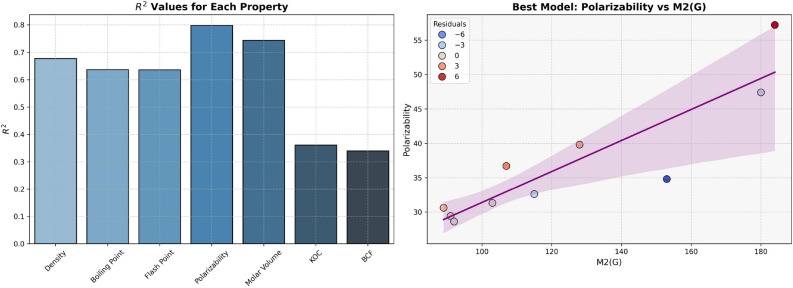
Table 6 and Fig. 5 demonstrate that the regression models for Polarizability and Molar Volume have strong correlations because these two properties have high  values, which is 0.7977 and 0.7438 and low p-values which is 0.0005 and 0.0013, suggesting that
  is a good predictor for these properties. On the other hand, models like BCF and KOC have lower
  values, which are 0.3401 and 0.3615, and higher p-values, which are 0.0768 and 0.0660, indicating weaker predictive strength. Density, Boiling Point, and Flash Point models show moderate predictive strength, as indicated by average
  and p-values.
Table 6.
Statistical parameters and regression models for  .
.
| Models | R |  |
P-value |
|---|---|---|---|
Density = 
|
0.8226 | 0.6767 | 0.0035 |
Boiling Point = 
|
0.7979 | 0.6366 | 0.0057 |
Flash Point = 
|
0.7976 | 0.6362 | 0.0057 |
Polarizability = 
|
0.8931 | 0.7977 | 0.0005 |
Molar Volume = 
|
0.8624 | 0.7438 | 0.0013 |
BCF = 
|
0.5832 | 0.3401 | 0.0768 |
KOC = 
|
0.6013 | 0.3615 | 0.0660 |
Fig. 5.
Graphical representation of  .
.
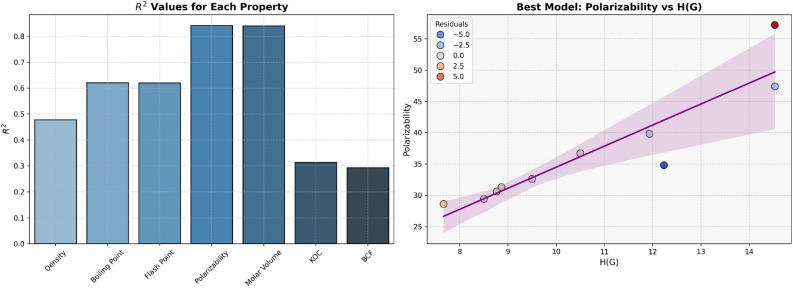
The models for Polarizability and Molar Volume display the highest  values (0.8412 and 0.8402, respectively) and low p-values as shown in Table 7, also visualized by bar graph in Fig. 6. Models for BCF and KOC have lower
  values (0.2932 and 0.3132, respectively) and higher p-values, suggesting weaker predictive strength. Models for Density, Boiling Point, and Flashpoint show moderate predictive strength, as indicated by average
  and p-values.
Table 7.
Statistical parameters and regression models for H(G).
| Models | R |  |
P-value |
|---|---|---|---|
Density = 
|
0.6910 | 0.4775 | 0.0269 |
Boiling Point = 
|
0.7878 | 0.6206 | 0.0068 |
Flash Point = 
|
0.7875 | 0.6202 | 0.0068 |
Polarizability = 
|
0.9172 | 0.8412 | 0.0002 |
Molar Volume = 
|
0.9166 | 0.8402 | 0.0002 |
BCF = 
|
0.5415 | 0.2932 | 0.1060 |
KOC = 
|
0.5597 | 0.3132 | 0.0925 |
Fig. 6.
Graphical representation of H(G).
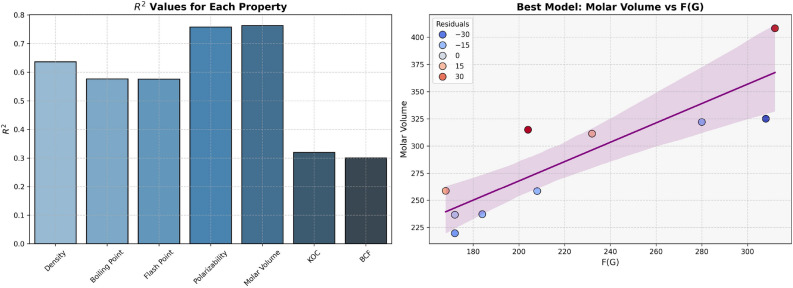
For regression models developed using F(G), properties like Density, Boiling Point and Flash Point have average  and p-values, as shown in Table 8 and visualized in Fig. 7, which indicates the moderate predictive strength. In contrast, Polarizability and Molar Volume model shows the highest
  values (0.7577 and 0.7631, respectively), indicating strong predictive power. Models for BCF and KOC have lower
  values (0.3003 and 0.3196, respectively) and higher p-values, suggesting weaker predictive strength.
Table 8.
Statistical parameters and regression models for F(G).
| Models | R |  |
P-value |
|---|---|---|---|
Density = 
|
0.7980 | 0.6368 | 0.0057 |
Boiling Point = 
|
0.7594 | 0.5766 | 0.0108 |
Flash Point = 
|
0.7591 | 0.5763 | 0.0109 |
Polarizability = 
|
0.8705 | 0.7577 | 0.0011 |
Molar Volume = 
|
0.8736 | 0.7631 | 0.0010 |
BCF = 
|
0.5480 | 0.3003 | 0.1010 |
KOC = 
|
0.5653 | 0.3196 | 0.0886 |
Fig. 7.
Graphical representation of F(G).
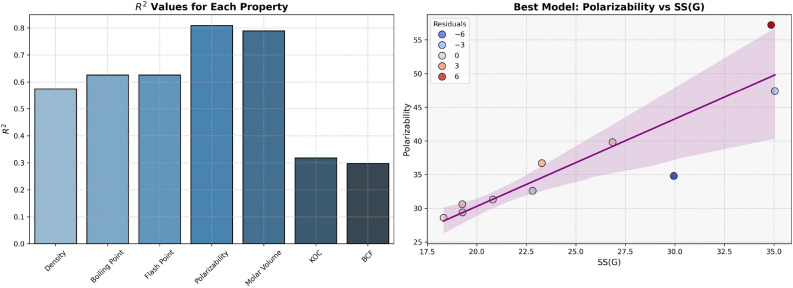
The Density, Boiling Point, and Flash Point models indicate the average predictive power. In contrast, Polarizability and Molar Volume indicate high predictive strength, as these two properties have high  values (0.8092 and 0.7889, respectively) given in Table 9 and visualized in Fig. 8. Models for BCF and KOC exhibit lower
  values (0.2976 and 0.3180, respectively) and higher p-values, indicating low predictive performance.
Table 9.
Statistical parameters and regression models for SS(G).
| Models | R |  |
P-value |
|---|---|---|---|
Density = 
|
0.7577 | 0.5741 | 0.0111 |
Boiling Point = 
|
0.7912 | 0.6261 | 0.0064 |
Flash Point = 
|
0.7910 | 0.6257 | 0.0064 |
Polarizability = 
|
0.8995 | 0.8092 | 0.0004 |
Molar Volume = 
|
0.8882 | 0.7889 | 0.0006 |
BCF = 
|
0.5455 | 0.2976 | 0.1029 |
KOC = 
|
0.5639 | 0.3180 | 0.0895 |
Fig. 8.
Graphical representation of SS(G).
High  values, 0.7681 and 0.8137 respectively and low p-values for models of Polarizability and Molar Volume have demonstrated strong correlation with the entropy
  . In contrast, properties such as BCF and KOC exhibit weaker relationships, as evidenced by their lower
  values (0.2551 and 0.2728, respectively) and higher p-values. The models for Density, Boiling Point, and Flash Point demonstrate moderate predictive strength and average
  value given in Table 10 and visualized in Fig. 9. These results highlight the potential of entropy based models for prediction of physicochemical properties.
Table 10.
Statistical parameters and regression models for  .
.
| Models | R |  |
P-value |
|---|---|---|---|
Density = 
|
0.7098 | 0.5038 | 0.0215 |
Boiling Point = 
|
0.7447 | 0.5546 | 0.0135 |
Flash Point = 
|
0.7444 | 0.5542 | 0.0135 |
BCF = 
|
0.5051 | 0.2551 | 0.1364 |
KOC = 
|
0.5223 | 0.2728 | 0.1215 |
Polarizability = 
|
0.8764 | 0.7681 | 0.0009 |
Molar Volume = 
|
0.9020 | 0.8137 | 0.0004 |
Fig. 9.
Graphical representation of  .
.
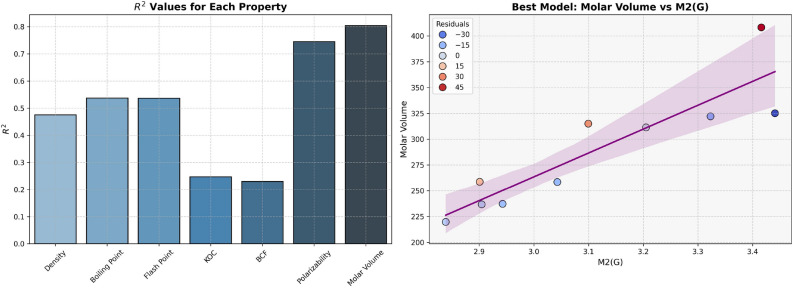
These models demonstrate predictive power of the entropy  and its relation with physicochemical properties. The predictions for Polarizability and Molar Volume exhibit high accuracy and reliability. These two properties have high
  values (0.7453 and 0.8044, respectively) and low p-values. At the same time, BCF and KOC have low
  values and high p-values that display weaker predictive strength. The model for other properties shows a moderate predictive relationship since these properties have average
  and p-values as shown in Table 11 and visualized by bar graph as shown in Fig. 10.
Table 11.
Statistical parameters and regression models for  .
.
| Models | R |  |
P-value |
|---|---|---|---|
Density = 
|
0.6897 | 0.4757 | 0.0273 |
Boiling Point = 
|
0.7331 | 0.5375 | 0.0158 |
Flash Point = 
|
0.7328 | 0.5371 | 0.0159 |
BCF = 
|
0.4801 | 0.2305 | 0.1602 |
KOC = 
|
0.4974 | 0.2474 | 0.1435 |
Polarizability = 
|
0.8633 | 0.7453 | 0.0013 |
Molar Volume = 
|
0.8969 | 0.8044 | 0.0004 |
Fig. 10.
Graphical representation of  .
.
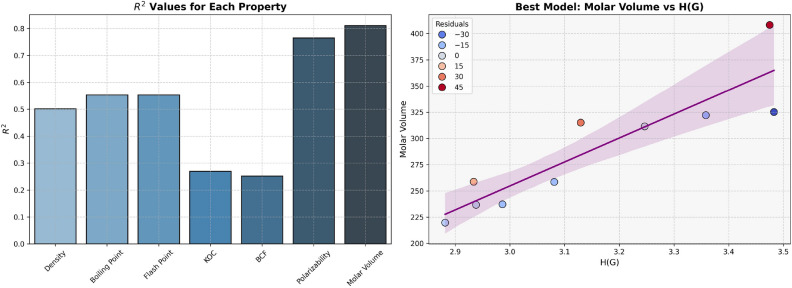
The models involving the entropy with H(G) index demonstrate strong predictive power for Polarizability and Molar Volume, as indicated by their high  values (0.7654 and 0.8112, respectively) and low p-values as shown in Table 12 and visualized in Fig. 11. On the other hand, properties like BCF and KOC show weak relationships, as indicated by their lower
  values and higher p-values. Models for other properties, like Density, Boiling Point, and Flash Point, show moderate predictive power with average
  and p-values.
Table 12.
Statistical parameters and regression models for  .
.
| Models | R |  |
P-value |
|---|---|---|---|
Density = 
|
0.7081 | 0.5014 | 0.0219 |
Boiling Point = 
|
0.7439 | 0.5534 | 0.0136 |
Flash Point = 
|
0.7437 | 0.5530 | 0.0137 |
BCF = 
|
0.5019 | 0.2519 | 0.1393 |
KOC = 
|
0.5191 | 0.2695 | 0.1242 |
Polarizability = 
|
0.8749 | 0.7654 | 0.0009 |
Molar Volume = 
|
0.9007 | 0.8112 | 0.0004 |
Fig. 11.
Graphical representation of  .
.
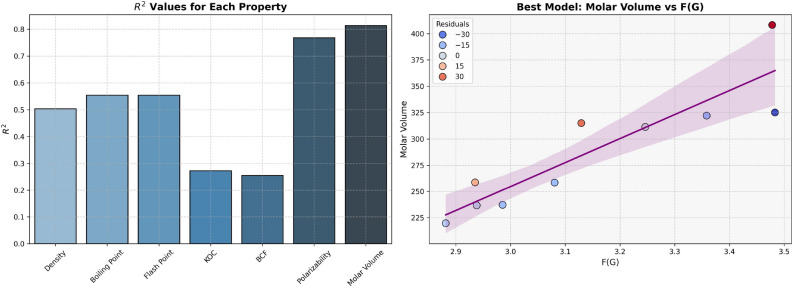
Table 13 shows the statistical parameters and regression models for entropy with F(G) index. The entropy analysis with F(G) index shows that it can predict Polarizability and Molar Volume values with high accuracy, as indicated by the high  values (0.7681 and 0.8137, respectively). Meanwhile, models for BCF and KOC reveal weak prediction power, as suggested by their lower
  values (0.2551 and 0.2728, respectively) and higher p-values. Models for Density, Boiling Point, and Flash Point demonstrate moderate prediction with average
  and p-values visualized in Fig. 12.
Table 13.
Statistical parameters and regression models for  .
.
| Models | R |  |
P-value |
|---|---|---|---|
Density = 
|
0.7098 | 0.5038 | 0.0215 |
Boiling Point = 
|
0.7447 | 0.5546 | 0.0135 |
Flash Point = 
|
0.7444 | 0.5542 | 0.0135 |
BCF = 
|
0.5051 | 0.2551 | 0.1364 |
KOC = 
|
0.5223 | 0.2728 | 0.1215 |
Polarizability = 
|
0.8764 | 0.7681 | 0.0009 |
Molar Volume = 
|
0.9020 | 0.8137 | 0.0004 |
Fig. 12.
Graphical representation of  .
.
For entropies using the SS(G) index, the prediction accuracies for Polarizability and Average Mass are the highest, with  values of 0.7728 and 0.8143 respectively, given in Table 14. These results, also illustrated in Fig. 13, indicate that the model offers strong predictive capability for these two properties. In particular, the linear relationship observed for Polarizability shows the effectiveness of SS(G). However, for BCF and KOC, the model exhibits considerably lower predictive performance, with
  values of 0.2587 and 0.2765, respectively, indicate that
  can not predict these properties with high accuracy. Meanwhile, Density, Boiling Point, and Flashpoint demonstrate moderate predictive accuracy, as evidenced by their intermediate
  values and p-values.
Table 14.
Statistical parameters and regression models for  .
.
| Models | R |  |
P-value |
|---|---|---|---|
Density = 
|
0.7119 | 0.5068 | 0.0209 |
Boiling Point = 
|
0.7474 | 0.5585 | 0.0130 |
Flash Point = 
|
0.7471 | 0.5581 | 0.0130 |
BCF = 
|
0.5086 | 0.2587 | 0.1333 |
KOC = 
|
0.5258 | 0.2765 | 0.1185 |
Polarizability = 
|
0.8791 | 0.7728 | 0.0008 |
Molar Volume = 
|
0.9024 | 0.8143 | 0.0004 |
Fig. 13.
Graphical representation of  .
.
Tables 15, 16, 17, 18, 19, 20 and 21 show the comparision of actual and predicted values of different indices and entropies for the drugs. We named out the drugs as Metoprolol= Atenolol=
 Bisoprolol=
 Propranolol=
 Sotalol=
 Amiodarone=
 Carvedilol=
 Flecainide=
 Propafenone=
 and Timolol=
 for our convenience. Table 15 presents a comparison of actual and predicted density values, revealing only minor discrepancies. For instance, slight differences are observed in the predicted values for
  demonstrating the reliability of the predictive models developed using indices and entropies for density estimation. Table 16 shows a strong correlation between actual and predicted boiling points, with the
  and
and  models consistently delivering the most accurate results for all drugs except
  , which exhibits a slight deviation. In Table 17, the overall results align closely with actual values. Table 18 highlights a significant discrepancy between the actual and predicted values for
  , primarily due to its higher values compared to other drugs. The models were unable to accurately capture this non-linear pattern, resulting in less precise predictions. Similarly, Table 20 indicates that
  and
and  display slightly larger variations, suggesting the need for further optimization in these cases. Based on the results across all tables, the development of more advanced models, such as polynomial regression or XGBoost, using descriptors with most accurate predictions can enhance results.
Table 15.
Comparison of actual and predicted density for various indices and entropy.
| Drugs | D |  |
 |
H(G) | F(G) | SS(G) |  |
 |
 |
 |
 |
|---|---|---|---|---|---|---|---|---|---|---|---|
 |
1.00 | 1.05 | 1.05 | 1.09 | 1.04 | 1.07 | 1.07 | 1.07 | 1.07 | 1.07 | 1.07 |
 |
1.10 | 1.06 | 1.06 | 1.08 | 1.05 | 1.07 | 1.07 | 1.08 | 1.07 | 1.07 | 1.07 |
 |
1.00 | 1.14 | 1.12 | 1.18 | 1.13 | 1.15 | 1.18 | 1.18 | 1.18 | 1.18 | 1.18 |
 |
1.10 | 1.09 | 1.10 | 1.10 | 1.09 | 1.10 | 1.10 | 1.10 | 1.10 | 1.10 | 1.10 |
 |
1.20 | 1.06 | 1.06 | 1.04 | 1.05 | 1.04 | 1.09 | 1.09 | 1.09 | 1.09 | 1.09 |
 |
1.60 | 1.42 | 1.44 | 1.38 | 1.40 | 1.40 | 1.37 | 1.36 | 1.37 | 1.37 | 1.37 |
 |
1.30 | 1.41 | 1.42 | 1.38 | 1.39 | 1.40 | 1.38 | 1.37 | 1.38 | 1.38 | 1.38 |
 |
1.30 | 1.34 | 1.31 | 1.27 | 1.32 | 1.29 | 1.31 | 1.31 | 1.31 | 1.31 | 1.31 |
 |
1.10 | 1.22 | 1.21 | 1.25 | 1.20 | 1.23 | 1.24 | 1.24 | 1.24 | 1.24 | 1.24 |
 |
1.20 | 1.15 | 1.15 | 1.13 | 1.14 | 1.14 | 1.15 | 1.15 | 1.15 | 1.15 | 1.15 |
Table 16.
Comparison of actual and predicted boiling point for various indices and entropy.
| Drugs | B.P |  |
 |
H(G) | F(G) | SS(G) |  |
 |
 |
 |
 |
|---|---|---|---|---|---|---|---|---|---|---|---|
 |
398.60 | 430.93 | 428.69 | 433.04 | 430.94 | 433.55 | 434.75 | 436.24 | 434.37 | 434.75 | 434.95 |
 |
508.00 | 435.59 | 432.53 | 435.72 | 435.60 | 433.67 | 435.60 | 437.27 | 435.60 | 435.60 | 434.87 |
 |
445.00 | 472.88 | 490.26 | 490.60 | 472.89 | 477.03 | 489.84 | 492.78 | 489.84 | 489.84 | 488.98 |
 |
434.90 | 449.57 | 455.93 | 454.78 | 449.58 | 450.21 | 449.36 | 448.06 | 449.36 | 449.36 | 449.36 |
 |
443.30 | 443.44 | 412.85 | 443.04 | 413.00 | 423.31 | 419.53 | 418.95 | 419.53 | 419.53 | 419.27 |
 |
635.10 | 598.71 | 601.84 | 601.28 | 598.73 | 602.52 | 588.85 | 582.88 | 588.87 | 588.50 | 589.83 |
 |
655.20 | 594.05 | 611.04 | 598.73 | 602.54 | 590.30 | 589.04 | 590.30 | 589.04 | 589.04 | 590.30 |
 |
434.90 | 561.43 | 561.38 | 561.44 | 561.44 | 549.23 | 554.86 | 556.52 | 555.00 | 555.00 | 554.07 |
 |
519.60 | 505.50 | 503.47 | 529.93 | 505.51 | 515.75 | 523.03 | 522.84 | 523.21 | 523.03 | 523.47 |
 |
487.20 | 477.54 | 478.54 | 463.16 | 477.55 | 472.01 | 476.01 | 476.66 | 476.22 | 476.01 | 476.26 |
Table 17.
Comparison of actual and predicted flash point for various indices and entropy.
| Drugs | F.P |  |
 |
H(G) | F(G) | SS(G) |  |
 |
 |
 |
 |
|---|---|---|---|---|---|---|---|---|---|---|---|
 |
194.90 | 214.44 | 213.08 | 221.75 | 214.44 | 216.01 | 216.74 | 217.65 | 216.52 | 216.74 | 216.87 |
 |
261.10 | 217.25 | 215.40 | 217.33 | 217.25 | 216.09 | 217.26 | 218.27 | 217.26 | 217.26 | 216.81 |
 |
222.90 | 239.80 | 233.95 | 250.52 | 239.80 | 242.31 | 250.05 | 251.84 | 250.14 | 250.05 | 249.54 |
 |
216.80 | 225.71 | 229.31 | 223.41 | 225.71 | 226.09 | 225.38 | 224.86 | 225.56 | 225.38 | 225.58 |
 |
221.90 | 217.25 | 216.56 | 203.50 | 217.25 | 209.82 | 207.54 | 206.95 | 207.54 | 207.54 | 207.38 |
 |
337.90 | 315.90 | 323.23 | 317.44 | 315.90 | 318.19 | 309.93 | 306.32 | 309.52 | 309.93 | 310.52 |
 |
350.10 | 313.08 | 318.60 | 317.44 | 313.08 | 319.41 | 310.80 | 310.61 | 310.86 | 310.80 | 311.06 |
 |
216.80 | 293.35 | 287.29 | 279.28 | 293.35 | 285.97 | 289.37 | 290.32 | 289.45 | 289.37 | 288.90 |
 |
268.00 | 259.53 | 258.30 | 274.30 | 259.53 | 265.72 | 270.13 | 270.01 | 270.24 | 270.13 | 270.39 |
 |
248.50 | 242.62 | 243.23 | 233.92 | 242.62 | 239.27 | 241.69 | 242.09 | 241.82 | 241.69 | 241.85 |
Table 18.
Comparison of actual and predicted BCF for various indices and entropy.
| Drugs | BCF |  |
 |
H(G) | F(G) | SS(G) |  |
 |
 |
 |
 |
|---|---|---|---|---|---|---|---|---|---|---|---|
 |
1.00 | 14.24 | 15.99 | 6.02 | 14.24 | 11.20 | 10.02 | 8.14 | 10.05 | 10.02 | 10.02 |
 |
1.00 | 11.62 | 13.80 | 9.94 | 11.62 | 11.14 | 9.57 | 7.62 | 9.40 | 9.57 | 10.07 |
 |
1.00 | 9.34 | 3.67 | 19.45 | 9.34 | 12.15 | 19.09 | 20.71 | 19.18 | 19.09 | 18.62 |
 |
1.00 | 3.76 | 0.70 | 4.55 | 3.76 | 2.25 | 2.47 | 2.05 | 2.19 | 2.47 | 2.38 |
 |
1.00 | 11.62 | 12.71 | 22.18 | 11.62 | 16.70 | 18.06 | 17.17 | 17.85 | 18.06 | 18.34 |
 |
214.87 | 80.08 | 87.73 | 78.71 | 80.08 | 79.55 | 71.41 | 66.67 | 70.79 | 71.41 | 72.09 |
 |
1.51 | 77.46 | 83.36 | 78.71 | 77.46 | 80.63 | 72.17 | 70.29 | 71.95 | 72.17 | 72.56 |
 |
1.00 | 59.12 | 53.88 | 44.92 | 59.12 | 50.93 | 53.45 | 53.17 | 53.35 | 53.45 | 53.13 |
 |
1.00 | 27.68 | 26.59 | 40.51 | 27.68 | 32.95 | 36.63 | 36.04 | 36.65 | 36.63 | 36.91 |
 |
1.00 | 11.96 | 12.40 | 4.76 | 11.96 | 9.46 | 11.78 | 12.48 | 11.95 | 11.78 | 11.88 |
Table 19.
Comparison of actual and predicted KOC for various indices and entropy.
| Drugs | KOC |  |
 |
H(G) | F(G) | SS(G) |  |
 |
 |
 |
 |
|---|---|---|---|---|---|---|---|---|---|---|---|
 |
1.00 | 15.17 | 17.02 | 6.44 | 15.18 | 12.00 | 10.74 | 8.79 | 10.77 | 10.74 | 10.73 |
 |
1.00 | 12.37 | 14.68 | 10.63 | 12.38 | 11.93 | 10.26 | 8.22 | 10.09 | 10.26 | 10.78 |
 |
1.00 | 10.05 | 3.98 | 20.85 | 10.04 | 13.03 | 20.46 | 22.19 | 20.56 | 20.46 | 19.96 |
 |
1.25 | 3.96 | 0.68 | 4.86 | 3.97 | 2.40 | 2.65 | 2.25 | 2.35 | 2.65 | 2.55 |
 |
1.00 | 12.37 | 13.52 | 23.75 | 12.38 | 17.89 | 19.36 | 18.48 | 19.14 | 19.36 | 19.64 |
 |
223.42 | 85.69 | 93.82 | 84.34 | 85.68 | 85.25 | 76.53 | 71.55 | 75.88 | 76.53 | 77.25 |
 |
8.15 | 82.89 | 89.15 | 84.34 | 82.88 | 86.41 | 77.35 | 75.43 | 77.13 | 77.35 | 77.77 |
 |
1.07 | 63.28 | 57.65 | 48.13 | 63.27 | 54.58 | 57.28 | 57.05 | 57.19 | 57.28 | 56.94 |
 |
1.61 | 29.66 | 28.49 | 43.41 | 29.65 | 35.31 | 39.26 | 38.65 | 39.28 | 39.26 | 39.56 |
 |
1.00 | 12.85 | 13.32 | 5.11 | 12.84 | 10.14 | 12.63 | 13.36 | 12.80 | 12.63 | 12.74 |
Table 20.
Comparison of actual and predicted polarizability for various indices and entropy.
| Drugs | Pol |  |
 |
H(G) | F(G) | SS(G) |  |
 |
 |
 |
 |
|---|---|---|---|---|---|---|---|---|---|---|---|
 |
30.60 | 28.97 | 28.89 | 30.33 | 28.98 | 29.35 | 29.24 | 29.42 | 29.20 | 29.24 | 29.27 |
 |
29.40 | 29.53 | 29.35 | 29.44 | 29.54 | 29.37 | 29.34 | 29.54 | 29.35 | 29.34 | 29.26 |
 |
36.70 | 34.03 | 32.96 | 36.16 | 34.04 | 34.55 | 36.05 | 36.42 | 36.07 | 36.05 | 35.95 |
 |
31.30 | 31.22 | 32.05 | 30.67 | 31.23 | 31.35 | 31.00 | 30.90 | 31.05 | 31.00 | 31.05 |
 |
28.60 | 29.53 | 29.57 | 26.64 | 29.54 | 28.13 | 27.35 | 27.23 | 27.36 | 27.35 | 27.33 |
 |
57.20 | 49.20 | 50.34 | 49.71 | 49.21 | 49.55 | 48.31 | 47.58 | 48.22 | 48.31 | 48.42 |
 |
47.40 | 48.64 | 49.43 | 49.71 | 48.65 | 49.80 | 48.49 | 48.46 | 48.49 | 48.49 | 48.54 |
 |
34.80 | 44.70 | 43.34 | 41.98 | 44.72 | 43.18 | 44.10 | 44.30 | 44.11 | 44.10 | 44.00 |
 |
39.80 | 37.96 | 37.70 | 40.97 | 37.97 | 39.18 | 40.16 | 40.14 | 40.18 | 40.16 | 40.22 |
 |
32.60 | 34.59 | 34.76 | 32.80 | 34.60 | 33.95 | 34.34 | 34.42 | 34.37 | 34.34 | 34.38 |
Table 21.
Comparison of actual and predicted molar volume for various indices and entropy.
| Drugs | MV |  |
 |
H(G) | F(G) | SS(G) |  |
 |
 |
 |
 |
|---|---|---|---|---|---|---|---|---|---|---|---|
 |
258.70 | 239.45 | 240.85 | 248.23 | 239.45 | 242.61 | 239.88 | 240.60 | 239.61 | 239.88 | 240.20 |
 |
236.70 | 243.01 | 243.61 | 242.58 | 243.01 | 242.70 | 240.57 | 241.43 | 240.59 | 240.57 | 240.14 |
 |
315.00 | 271.47 | 265.61 | 284.95 | 271.47 | 274.99 | 284.16 | 286.50 | 284.28 | 284.16 | 283.49 |
 |
237.20 | 253.68 | 260.11 | 250.35 | 253.68 | 255.02 | 251.36 | 250.29 | 251.62 | 251.36 | 251.75 |
 |
219.70 | 243.01 | 244.98 | 224.92 | 243.01 | 234.98 | 227.65 | 226.24 | 227.69 | 227.65 | 227.64 |
 |
408.20 | 367.53 | 371.50 | 370.40 | 367.53 | 368.47 | 363.75 | 359.65 | 363.16 | 363.75 | 364.29 |
 |
325.10 | 363.97 | 366.00 | 370.40 | 363.97 | 369.96 | 364.91 | 365.40 | 364.94 | 364.91 | 365.01 |
 |
322.10 | 339.07 | 328.87 | 321.67 | 339.07 | 328.78 | 336.43 | 338.16 | 336.51 | 336.43 | 335.64 |
 |
311.40 | 296.37 | 294.49 | 315.32 | 296.37 | 303.84 | 310.84 | 310.90 | 310.98 | 310.84 | 311.13 |
 |
258.50 | 275.03 | 276.61 | 263.77 | 275.03 | 271.25 | 273.05 | 273.42 | 273.23 | 273.05 | 273.30 |
Table 15 shows the close alignment of the experimental density with the calculated values from several molecular graph invariants and their corresponding entropy forms. For example, for  , the experimental density is 1.00, while the calculated values from
  ,
,  , H(G), F(G), and SS(G) are all 1.05, while their corresponding entropy forms
  ,
,  ,
,  ,
,  ,
,  are also identical at 1.07, thus very consistent. For example, the real density is 1.20 for
  , whereas the predicted values for all indices vary from 1.06 up to 1.09; hence, the deviation is small. Another very good example can be seen at
  : the actual density is 1.10 and was approximated well,
  , H(G) = 1.25, and entropy forms of the both indices equal to 1.24. These small values of deviation are the sign that this and some other indices together with its entropy variants are able to estimate densities with great accuracy being generally reliable in this respect.
Table 16 shows a close agreement of the experimental boiling points (B.P.) with the calculated values from various molecular graph indices and their entropy forms for all drugs  . In the case of
  , the experimental boiling point is 398.60, while the predicted values from
  ,
,  , H(G), F(G), and SS(G) lie within the range of 428.69 to 433.55, with entropy-based values clustered tightly around 434.75 to 434.95. In a similar manner, for
  , the experimental value of 508.00 is well approximated with the values of predictions lying in the range of 432.53 to 435.60 and very consistent entropy-based values of around 435.60. The boiling point for
  is 443.30 experimentally, and the range for predictions lies from 412.85 to 450.21 with entropy forms around 419.53.
  has a much higher boiling point of 635.10 which the indices captured well within the range of 588.55 to 602.52 and entropy values of 582.88 to 589.83. Accordingly,
  and
and  also revealed predicted values for entropy with good approximation while their estimated values,
  ,
,  , H(G), F(G) and SS(G), remain in acceptable deviations from experimental ones. This is because, for the only value which may be critical, namely, for
  , with the experimental boiling point being 487.20, the estimates resulting from the
  ,
,  , H(G), F(G), SS(G) in addition to its respective entropies turn out very satisfactorily: ranging from 463.16 up to 476.26. Across all drugs, the differences between the experimental and predicted values are minimal, which points toward these molecular graph indices and entropy forms as inclusions that estimate boiling points rather reliably.
Table 17 shows the experimental F.P. versus the calculated ones obtained by using the graph indices and their corresponding entropy forms for the set of ten drugs: from  to
to  . For
. For  , the experimental flash point is 194.90, while the respective calculated value from
  , and SS(G) varies between 213.08 to 221.75, and entropy values cluster in a close vicinity of 216.52 to 216.87 showing moderate consistency. While for
  , the spread of the values in indices lies in the range between 215.40 and 217.33, the entropy-based predictions show variations between 216.81 and 218.27, hence providing close approximations. Correspondingly, in the case of
  , all the indices and entropy measures lie within a narrow window ranging from 225.38 to 225.71, hence reflecting values that are quite proximal with regard to experimentally obtained values.
  has an experimentally determined flash point of 337.90, while the values of the indices range from 315.90 to 323.23, with the entropy forms lying in the range of 309.52 to 310.52. For
  , the experimentally determined flash point is 268.00, falling within the predictions, standing between 258.30 and 270.13 for all indices and entropy forms. For
  , the flash point is 248.50, and the indices and entropy forms come in the range of 233.92 to 242.09, hence, it captures the experimental value well. Overall, the table shows a strong correlation between the experimental and predicted flash points, proving the dependability of these molecular graph indices and their variants of entropy to model the flash points with minimum deviation.
Table 18 depicts the actual and predicted values of the Bioconcentration Factors (BCF) for various drugs using different types of indices along with entropy values. It reveals the variation across the indices, such as  , and entropy measures, where some drugs show consistency and others show significant deviation, in particular
  . The results support the fact that entropy-based topological indices may give a perception about the accuracy of the BCF prediction.
Table 19 shows the actual versus predicted KOC values for various drugs based on indices, and entropy measures. Large deviations are measured with and, which indicate estimation issues regarding KOC predictions for certain specific drugs. Entropy-based measures of and express smooth trends for the majority of cases; hence, these measures can be reliable in the estimation of the KOC. These results raise question marks over the choice of the appropriate indices used to carry out accurate predictions.
This Table 20 depicts the actual and predicted polarizability values by using indices and entropy measures for different drugs. Most of the indices and entropy values closely lie in accordance with the actual polarizability, especially for drugs like  and
and  . Indices
  and
and  , and their corresponding entropy measures
  and
and  , are relatively good in predicting most of the drugs. However, a slight deviation is observed for
  and
and  , which may be due to the need for refined modeling in such cases.
Table 21 shows the comparison of the experimental molar volume of drugs  and the computational results based on the selected topological indices along with the entropy . Most of the predicted values by the indices and entropies are close to actual molar volumes, as seen for most drugs. For instance,
  presents a good accordance of MV (258.70) with its predicted values, such as
  , reflecting minimal deviation. Similarly, in the case of drugs like, all values across indices and entropy measures are the same, reflecting uniformity in predictions. Larger discrepancies were noted in, where the actual MV (408.20) has a greater difference with the predicted values, such as, which might suggest limitations for the indices regarding outliers. The table, in general, underlines the predictive power of the indices and entropy measures while pointing to areas that may call for model refinement.
Conclusion
This study aimed to analyze different anti-arrhythmia drugs to predict physicochemical properties, which will help in the design and development of new generalized drugs that can be more effective for arrhythmia patients. Although the dataset used in this study consists of only ten anti-arrhythmic drugs, the models developed can serve as base models for generalization and practical applications. Initially, the models were trained specifically for anti-arrhythmic drugs and cannot be directly applied to drugs for other diseases due to different structures of drugs for each disease. However, these models can be utilized for transfer learning to train specialized models for other drug categories. Additionally, these models can be deployed using frameworks such as Flask, enabling their use in real-world applications. For future work, additional drug data can be added into the dataset for generalization. Linear regression models have been developed using entropies and topological indices for prediction. In this study, instead of traditional computation methods, advanced machine learning-based techniques have been utilized, making the process faster and more reliable. Topological indices and entropies were calculated automatically using a Python script explicitly developed for this study, as presented in Listing-1 and Listing-2. Datasets of physicochemical properties, calculated experimentally in laboratories, were collected from various databases. After organizing the complete data, the model was applied to predict all properties and indices, aiming to determine the best model for each property. To enhance reliability, K-Fold cross-validation was employed instead of a simple statistical model, ensuring the best results on unseen data. After a comprehensive comparison, Polarizability and Molar Volume were best predicted by H(G) and SS(G) based on their highest  values. The predicted values for these properties from all models are presented in Tables 20 and 21. Additionally, the prediction accuracy for these properties was highest using
  and
and  , respectively. For Density and Boiling Point, the most accurate predictions were obtained using
  and
and  , as shown in Tables 15 and 16. Predicted values for Flash Point were most consistent with the original values using the models of
  and
and  , as presented in Table 17. For KOC and BCF, the overall
  values are lower compared to other properties. This difference is due to the higher numerical values of specific drugs, such as
  and
and  . Due to the limited size of dataset, we opted not to remove these outliers at this stage. However, for future work, we plan to address this issue by increasing the dataset size through data augmentation and incorporating more drug data. Despite these challenges, the models based on
  ,
,  ,
,  , and
, and  demonstrated the most accurate predictions for these properties, showcasing their potential for further study.
In addition to the predictive performance, feature importance metrics were derived from the regression models, providing insights into which topological indices and entropies contributed most to the predictions of each physicochemical property. For example, H(G) and SS(G) were found to have the most significant impact on Polarizability and Molar Volume predictions. These metrics offer a deeper chemical interpretation of the models, highlighting the descriptors most influential in predicting each property. We have also used SHAP analysis in our study which is a local interpretability technique and provides explanation of individual predictions to understand each feature’s impact per sample. This work can be further extended using supervised machine learning algorithms such as random forest and neural networks
Author contributions
Huiling Qin designed the tests and contributed to the investigation by analyzing the curation of data. Mudassar Rehman helped with the computation, data analysis, funding, and verification of the calculations. Muhammad Farhan Hanif prepared the first draft of the article and helped with conceptualization, methodology, project management, and resource acquisition. Muhammad Yousaf Bhatti examined and approved the paper’s final text in addition to helping with calculation. Funding, software, validation, and formal analysis of experiments are all aided by Muhammad Kamran Siddiqui. Mohamed Abubakar Fiidow authored the first draft of the article and assisted with supervision, conceptualization, and methodology. All writers read and approved the final draft.
Funding
There is no funding to support this article.
Data availability
The datasets used and/or analysed during the current study are available from the corresponding author on reasonable request.
Declarations
Competing interests
The authors declare no competing interests.
Footnotes
Publisher’s note
Springer Nature remains neutral with regard to jurisdictional claims in published maps and institutional affiliations.
References
- 1.Zipes, D. P. & Wellens, H. J. Sudden cardiac death. Circulation98(21), 2334–2351 (1998). [DOI] [PubMed] [Google Scholar]
- 2.Camm, A. J. et al. Guidelines for the management of atrial fibrillation. Eur. Heart J.31(19), 2369–2429 (2010). [DOI] [PubMed] [Google Scholar]
- 3.Dan, G. A., Martinez-Rubio, A., Agewall, S., Boriani, G., Borggrefe, M., & Gaita, F. ESC Scientific Document Group Sticherling Christian (Reviewer Coordinator) Ehrlich Joachim R Schilling Richard Pavlovic Nikola De Potter Tom Lubinski Andrzej Svendsen Jesper Hastrup Ching Keong Sapp John Lewis Chen-Scarabelli Carol Martinez Felipe. Antiarrhythmic drugs-clinical use and clinical decision making: A consensus document from the European Heart Rhythm Association (EHRA) and European Society of Cardiology (ESC) working group on cardiovascular pharmacology, endorsed by the Heart Rhythm Society (HRS), Asia-Pacific Heart Rhythm Society (APHRS) and international society of cardiovascular pharmacotherapy (ISCP). Ep Europace20(5), 731–732 (2018). [DOI] [PubMed]
- 4.Karunarathna, I. et al. Atenolol in special populations: Considerations for renal impairment and diabetes. Uva Clin. Anaesth. Intensive Care1(1), 1–10 (2024). [Google Scholar]
- 5.Maysitha, B. K. Comparison of the use of bisoprolol and metoprolol in heart failure patients systematic review study. J. Pharm. Care Anwar Med.5(2), 31–39 (2024). [Google Scholar]
- 6.Arslan, A. et al. Oral amiodarone and propranolol in maintenance therapy of postimplantation tachycardia: An observational study. Medicine103(28), e38839 (2024). [DOI] [PMC free article] [PubMed] [Google Scholar]
- 7.Rochelson, E. et al. Safety and efficacy of intravenous sotalol following congenital heart surgery. Clin. Electrophysiol.10(1), 135–136 (2024). [DOI] [PubMed] [Google Scholar]
- 8.Yarlagadda, C. et al. Navigating the incidence of postoperative arrhythmia and hospitalization length: The role of amiodarone and other antiarrhythmics in prophylaxis. Cureus16(4), 5–10 (2024). [DOI] [PMC free article] [PubMed] [Google Scholar]
- 9.Lee, W. C. et al. Ivabradine could not decrease mitral regurgitation triggered atrial fibrosis and fibrillation compared with carvedilol. ESC Heart Failure11(1), 251–260 (2024). [DOI] [PMC free article] [PubMed] [Google Scholar]
- 10.Hauguel-Moreau, M. et al. Flecainide to prevent atrial arrhythmia after patent foramen ovale closure, the AFLOAT study: A randomized clinical trial. Circulation10(3), 521–530 (2024). [DOI] [PubMed] [Google Scholar]
- 11.Springer, J. et al. Effectiveness of antazoline versus amiodarone, flecainide and propafenone in restoring sinus rhythm at the emergency department. Adv. Med. Sci.69(2), 248–255 (2024). [DOI] [PubMed] [Google Scholar]
- 12.Aftab, O. M., Khan, H., Sangani, R. & Khouri, A. S. A national analysis of systemic adverse events of beta-blockers used for glaucoma therapy. Cutaneous Ocular Toxicol.50(1), 1–6 (2024). [DOI] [PubMed] [Google Scholar]
- 13.Diestel, R. Graph Theory 3rd edn, 125–130 (Springer, 2005). [Google Scholar]
- 14.Gross, J. L. & Yellen, J. Graph Theory and its Applications 2nd edn, 85–92 (CRC Press, 2006). [Google Scholar]
- 15.Yirik, M. A., Colpan, K. E., Schmidt, S., Sorokina, M. & Steinbeck, C. Review on chemical graph theory and its application in computer-assisted structure elucidation. J. Comput. Chem.42(3), 215–230 (2021). [Google Scholar]
- 16.Gutman, I. & Polansky, O. E. Mathematical Concepts in Organic Chemistry (Springer, 1986). [Google Scholar]
- 17.Trinajstić, N. Chemical Graph Theory 2nd edn, 50–58 (CRC Press, 1992). [Google Scholar]
- 18.Haynes, K. E., Phillips, F., & Yu, M. C. Y. Recent applications of entropy in social and environmental sciences. In Handbook on Entropy, Complexity, and Spatial Dynamics 1st edn, 55–68 (Edward Elgar Publishing, 2021).
- 19.Tsallis, C. Non-additive entropies and statistical mechanics at the edge of chaos: A bridge between natural and social sciences. Philos. Trans. R. Soc. A381(2256), 20–35 (2023). [DOI] [PubMed] [Google Scholar]
- 20.El Deeb, O. Entropic spatial auto-correlation of voter uncertainty and voter transitions in parliamentary elections. Physica A: Stat. Mech. Appl.617(128675), 25–35 (2023). [Google Scholar]
- 21.Bokhary, S. A. U. H., Adnan, Siddiqui, M. K. & Cancan, M. On topological indices and QSPR analysis of drugs used for the treatment of breast cancer. Polycycl. Aromat. Compd.42(9), 6233–6253 (2021). [Google Scholar]
- 22.Yang, J. et al. QSPR analysis of some phenolic compounds present in Moringa Oleifera. Polycycl. Aromat. Compd.44(6), 4197–4214 (2024). [Google Scholar]
- 23.Wei, J., Hanif, M. F., Mahmood, H., Siddiqui, M. K. & Hussain, M. QSPR analysis of diverse drugs using linear regression for predicting physical properties. Polycycl. Aromat. Compd.45(3), 1–21 (2023). [Google Scholar]
- 24.Siddiqui, M. K. et al. On physical analysis of enthalpy and entropy measures of iron (III) oxide. Eur. Phys. J. Plus137(3), 306–326 (2022). [DOI] [PMC free article] [PubMed] [Google Scholar]
- 25.Liu, G., Siddiqui, M. K., Manzoor, S., Naeem, M. & Abalo, D. On curvilinear regression analysis via newly proposed entropies for some benzene models. Complexity2022(1), 441664, 18–247 (2022). [Google Scholar]
- 26.Hanif, M. F., Mahmood, H., Ahmad, S. & Fiidow, M. A. On comparative analysis of a two-dimensional star gold structure via regression models. Sci. Rep.14(1), 15712, 55–66 (2024). [DOI] [PMC free article] [PubMed] [Google Scholar]
- 27.Huang, R. et al. On physical analysis of topological indices for iron disulfide network via curve fitting model. Sci. Rep.14(1), 19177, 18–39 (2024). [DOI] [PMC free article] [PubMed] [Google Scholar]
Associated Data
This section collects any data citations, data availability statements, or supplementary materials included in this article.
Data Availability Statement
The datasets used and/or analysed during the current study are available from the corresponding author on reasonable request.


