

Abstract
Hibernation is a necessary means for animals to maintain survival while coping with low temperatures and food shortages. While most studies have largely focused on mammalian hibernation, its reptilian equivalent has been less studied. In order to provide insights into the energy metabolism and potential microbial regulatory mechanisms in hibernating snakes, the serum, liver, gut content samples were measured by multi-omic methods. Here we show the active snakes have more vigorous lipid metabolism, whereas snakes in hibernation groups have higher sphingolipid metabolism. Furthermore, the results indicate that the potential energy supply pathway was gluconeogenesis. Microbial analysis reveals that Proteobacteria and Firmicutes showed dynamic changes with the transformation among active, pre-hibernation and hibernation periods. The correlation analysis reveals the potential role of Romboutsia, Providencia and Vagococcus in regulating above metabolism by producing certain metabolites. The results advance the understanding of the complex energy-saving strategy in hibernating poikilotherms.
Subject terms: Animal physiology, Herpetology
Multi-omics approach provides insights into unique energy-saving strategies and the potential mechanisms of gut microbiota regulating sphingolipid and bile acid metabolism in the energy storage and supply in hibernating snakes.
Introduction
Hibernation is the biological process in which animals overwinter in a suspended state as an adaptation to seasonal energy shortages and temperature drops. However, Mammals and poikilotherms (like reptiles and amphibians) hibernate very differently: mammals lower their body temperature and metabolic rate but maintain some activity and respond to environmental cues; poikilotherms essentially match their body temperature to the environment and can be in a suspended state where they do not respond to ref. 1. Many studies have explored the physiological regulatory mechanisms of mammalian hibernation, and found that available endogenous resources and the innate physiological mechanism determine its survival in hibernation2, and the energy supply gradually changes from carbohydrate metabolism to high-energy lipid metabolism after the rapid depletion of glycogen3,4. That is, lipid metabolism is crucial for mammals that alternately live in active and hibernation seasons5, and gut microbiota plays an important regulatory role6. Nevertheless, the reptile hibernation is largely understudied, and whether the mechanisms of hibernation are shared between mammals and reptiles needs validation. Though several studies7,8 underscore the unique role of lipids in the energy supply of snakes during hibernation, the regulatory mechanism of lipid metabolism warrants further elucidation.
In recent years, accumulating studies have demonstrated the important role of the gut microbiota in regulating energy metabolism and proposed the microbial control strategy of hosts’ energy balance9, indicating that the gut microbiota is the key factor regulating fat metabolism in animals10. Further studies have shown that the gut microbiota regulates lipid metabolism by regulating short-chain fatty acid (SCFA) production, fatty acid oxidation11, and bile acid (BA) function12. Gut microbes utilize a wide range of food matrix and intestinal secretions to produce diverse metabolites involved in host energy metabolism, which directly or indirectly affect lipid metabolism12,13. Therefore, a comprehensive analysis of the composition, function, and metabolites of the gut microbiota may more accurately reveal its role in the regulatory mechanism of lipid metabolism.
Previous studies on the gut microbiota of snakes focused on the comparison between wild and captive populations14, the influence of food15, the description of the structure and function16,17, the comparison of different parts of the digestive tract18,19 and the comparison among species20. Changes in the composition and function of gut microbiota could be of great biological significance during hibernation when snakes undergo a long-term fasting process and face the survival challenge of low temperature and hypoxia. At present, little is known about the changes in the gut microbiota in snakes between active and hibernation stages and the regulatory mechanism of the gut microbiota in lipid metabolism.
The Oriental rat snake (Ptyas mucosus) is a type of non-venomous snake that has a broad distribution in the southern regions of the Yangtze River within China and South and Southeast Asia. The rat snakes begin preparing for hibernation around November each year, fully enter hibernation from December to February, and emerge from hibernation in March. The 23–30 °C is the most active temperature range for rat snakes, and some snakes start to refuse food below 22 °C, and snakes stop all activity below 12 °C. The present study used the multi-omics approach combined microbial 16S rRNA gene sequencing, targeted metabolome, and transcriptome to profile serum lipid metabolism indices, liver fat metabolism genes expression, gut microbiota, and metabolites of oriental rat snake, to address the following questions: (1) are there significant differences in the snakes’ lipid metabolism during active and hibernating periods? (2) Are these microbial differences closely related to lipid metabolism? (3) Which microbes play a regulatory role? (4) How do these microbes play the regulatory role?
Results
Serum lipidome
The overall experimental design is shown in Fig. 1A. The serum lipidome was conducted to profile the lipid metabolism among active (Active), pre-hibernation (Pre-Hib), and hibernation (Hib) snakes. Partial least squares discriminant analysis (PLS‐DA) was performed on total lipids of serum and revealed significant differences in lipid profiles among active, pre-hibernation and hibernation groups (p < 0.01; Fig. 1B). The quantitative comparison of conventional serum lipid indicators was performed, including free fatty acids, diacylglycerol (DAG), triacylglycerol (TAG), acylcarnitine (ACar) and BA, which differed significantly with higher levels of these indices observed in active snakes and lower concentrations in hibernation snakes (Kruskal–Wallis, p < 0.05, Fig. 1C). Further, the stress indicator corticosterone showed the highest levels in hibernation snakes (Kruskal–Wallis, p < 0.05, Fig. 1C).
Fig. 1. Schematic overview of the experimental design and the comparison of serum lipidome.

Schematic overview of the experimental design (A). The partial least squares discriminant analysis (PLS‐DA, B) plots exhibit the overall serum lipid levels of each sample among three groups active (Active), pre-hibernation (Pre-Hib), and hibernation (Hib) snakes (C–E). Red points and cycles are the markers of active snakes, blue points and cycles are the markers of hibernation snakes, and green points and cycles are the markers of pre-hibernation snakes. The comparisons (C) of serum acylcarnitine (ACar), bile acid, cholesterol, diacylglycerol (DAG), free fatty acid, triacylglycerol (TAG), corticosterone, and testosterone among active (Active), pre-hibernation (Pre-Hib) and hibernation (Hib) snakes, n = 10 biologically independent samples. *Indicate p < 0.05, **indicate p < 0.01 and more * means more significant differences. The volcano plots D, E show the different serum lipid species in paired comparisons of active vs hibernation snakes (Active vs Hib; panel D), active vs pre-hibernation snakes (Active vs Pre-Hib; panel E). The error bars represent the standard deviation of each group of data.
Analysis of individual lipid species demonstrated that 433 species significantly differed between the Active and Hib groups, and 9 of the top 10 differential species were significantly upregulated, with most of these species belonging to subclasses phosphatidylethanolamine (PE) and BA (Fig. 1D). Similarly, 379 species significantly differed between the Active and Pre-Hib groups and 9 of the top 10 differential species were significantly upregulated, with most of these species belong to subclasses PE and BA (Fig. 1E). However, only 66 species were significantly differed between the Pre-Hib and Hib groups (Supplementary Fig. 1A), and 4 of 5 downregulated species belong to phosphatidylcholine (PC) and phytosphingosine, which are both the intermediate metabolites of sphingolipid (SP).
Further analysis of lipid subclasses and categories highlighted above found higher BA metabolism in active snakes (Fig. 2A, B), and higher SP metabolism in hibernation snakes (Fig. 2A and Supplementary Fig. 1B). Furthermore, the analysis of KEGG functions also confirmed the higher BA metabolism in active snakes (Fig. 2C, D). Though the SP metabolism showed no significant difference, it was also at the forefront of hibernating snake metabolic indicators (Supplementary Fig. 1C). Thus, the serum lipidome results could conclude that active snakes showed higher lipid metabolism mediated by BA secretion, and hibernating snakes showed higher SP metabolism.
Fig. 2. Comparison of serum lipid metabolites and KEGG functional analysis.

The cycle FC barplots (A, B) and KEGG enrichment scatter (C, D) show the different serum lipid subclasses and categories, and KEGG functions in paired comparisons of active vs hibernation snakes (Active vs Hib; panels A and C), active vs pre-hibernation snakes (Active vs Pre-Hib; panels B and D). Red boxes in the KEGG enrichment scatter highlighted several key KEGG pathways for focused attention.
Liver transcriptome
Secondly, in order to reveal the regulatory pathways of BA secretion and SP metabolism, we conducted a liver metabolome to investigate the key regulatory genes. The principal component analysis (PCA) plots display the overall gene expression of each sample among the three groups. It was found that the overlap of Active vs Hib, and Active vs Pre-Hib was smaller than that of Hib vs Pre-Hib (Supplementary Fig. 2). Then, the volcano plots exhibited that prosaposin (PSAP) gene, which was the key gene of SP degradation was upregulated in hibernation snakes (Fig. 3A and Supplementary Fig. 3A). Interestingly, the volcano plots identified a key gene (fructose-1,6-bisphosphatase, FBP) related to gluconeogenesis was upregulated in pre-hibernating (Fig. 3B) and hibernating snakes (Fig. 3A). However, these volcano plots failed to identify genes related to BA metabolism in active snakes, thus multiple-group volcano analyses were performed. The results identified some genes related to BA metabolism in active snakes, including cytochrome P450 2A (CYP2A), CYP3A5, CYP7B, CYP17A, solute carrier family 27 A6 (SLC27A6), and SLC4A5 (Fig. 3C, D). Further, the multiple-group volcano plots also verified the upregulated PSAP in hibernating snakes (Fig. 3C, D, Supplementary Fig. 3B), and FBP in pre-hibernating (Fig. 3D) and hibernating snakes (Fig. 3C). The differences in relative expression of CYP7B, PSAP and FBP were verified by qRT-PCR (Supplementary Fig. 4). Then, the correlation analysis combined serum lipidome with liver transcriptome highlighted the BA metabolism (Fig. 3E) and SP metabolism (Fig. 3F) when the snakes transformed from the active season to the hibernating season, which was in line with the dot plots of gene function (Supplementary Fig. 5).
Fig. 3. The volcano plot analysis of liver transcriptomics and its correlation analysis with serum lipidome.

The volcano plots identify the significantly up/down regulated genes in liver of paired comparisons of hibernation vs active snakes (Hib vs Active, A), and pre-hibernation vs active snakes (Pre-Hib vs Active, B). The upregulated genes closely related to energy metabolism are marked with red names, and the downregulated genes are marked with green names. The multiple-groups volcano plots identify the significantly up/down regulated genes in liver of paired comparisons of hibernation vs active snakes (Hib vs Active, C), and pre-hibernation vs active snakes (Pre-Hib vs Active, D) after the genes are pooled into fatty acids metabolism, bile acids metabolism and carbohydrates metabolism. The correlation analysis of functions of serum lipidome (Met, cycle) and liver transcriptome (Tran, triangle) revealed the highly enriched bile acid metabolism function in active snakes (E), and highly enriched sphingolipid metabolism in hibernating snakes (F). Redder colors indicate more significant correlations, while larger triangles or circles represent more genes or metabolites annotated to that function.
Gut microbiome
Thirdly, the microbiomics was performed to explore the potential role of gut microbiota in regulating the above BA metabolism and SP metabolism. The results of principal coordinate analysis (PCoA, based on Bray–Curtis dissimilarities) showed a different cluster among active, pre-hibernation, and hibernation snakes, and Analysis of similarities (ANOSIM) confirmed these significant differences from the statistical perspective (Supplementary Fig. 6). The α-diversity of the luminal microbiome was significantly higher in hibernating snakes than in active snakes, including the Shannon index and Simpson index (one-way analysis of variance, ANOVA, p < 0.05, Fig. 4A).
Fig. 4. Comparison of gut microbial diversity and composition, and their correlation analysis with serum lipidomes and liver metabolomics.

The comparisons A of microbial α-diversity (Shannon and Simpson) among different sampling groups, n = 10 biologically independent samples. *Indicate p < 0.05. The Sankey plot B shows the dominant microbial phyla and genera in different sampling groups, and the relationship between phyla and genera. The comparison of the relative abundance (%) of dominant genera C among active (Active), pre-hibernation (Pre-Hib), and hibernation snakes (Hib), n = 10 biologically independent samples. *indicate p < 0.05, **indicate p < 0.01 and more * means more significant differences. Random forest analysis D of the gut bacterial community. The y-axis, from top to bottom, displays the genera ranked by their relative importance based on mean decrease accuracy in the classification of groups. The correlation network heatmap showed the relationship between Providencia, Romboutsia and Vagococcus with dominant serum lipids (E), and liver differential genes (F). Blue lines mean negative correlation, red lines mean positive correlation; dash lines indicate no significant correlation, and solid lines indicate significant correlation. The error bars represent the standard deviation of each group of data.
Taxonomic analysis at the phylum level revealed that the Proteobacteria (average relative abundance: 60.77%), Firmicutes (average relative abundance: 33.46%), and Bacteroidota (average relative abundance: 5.03%) were the dominant microbial phyla in all the 30 snakes, and the relative abundance of Proteobacteria was significantly lower in active snakes than that in pre-hibernation snakes (Kruskal–Wallis, p = 0.012), whereas the Firmicutes (Kruskal–Wallis, p = 0.023) showed significantly higher abundance in active snakes than in pre-hibernation (Kruskal–Wallis, p = 0.023) and hibernating (Kruskal–Wallis, p = 0.044) snakes, and Bacteroidota (Kruskal–Wallis, p = 0.013) showed significantly higher abundance in hibernating snakes than in pre-hibernation snakes (Fig. 4B and Supplementary Table 1). The linear discriminant analysis effect size (LEfSe) analysis confirmed the above differences in dominant phyla among the three groups (Supplementary Fig. 7).
Among the dominant genera (Fig. 4B), the relative abundance of Providencia was significantly lower in active snakes than in pre-hibernation (Kruskal–Wallis, p = 0.011) and hibernating snakes (Kruskal–Wallis, p = 0.004), and Romboutsia showed a significantly higher abundance in active snakes than in pre-hibernation (Kruskal–Wallis, p = 0.010) and hibernation snakes (Kruskal–Wallis, p = 0.021), and Vagococcus (Kruskal–Wallis, p < 0.001) was more enriched in pre-hibernation snakes (Fig. 4C and Supplementary Table 1). In addition, the random forest was further applied to classify groups and selected the 10 most important bacterial genera ranked by mean decrease accuracy of classification of bacterial communities (Fig. 4D), and confirmed Providencia and Vagococcus were the two most representative genera for the pre-hibernation and hibernating snakes, whilst Romboutsia was the most representative genus for active snakes. Then, correlation analysis revealed that Romboutsia was positively correlated with BA level; Providencia was positively related with carnitine and Gangliosides (GM), while Vagococcus was negatively correlated with Ceramide (Cer) and phytosphingosine (Fig. 4E and Supplementary Fig. 8). In addition, Romboutsia was positively correlated with genes related with BA biosynthesis, and Providencia was positively related with key gene of gluconeogenesis (FBP) and SP degradation (PSAP); and Vagococcus was negatively correlated with most BA genes and PSAP, while positively correlated with FBP (Fig. 4F and Supplementary Fig. 9).
Gut trimethylamine N-oxide (TMAO) determination and N300 metabolomes
Finally, targeted metabolome was used to investigate how Providencia, Vagococcus, and Romboutsia get involved in SP degradation and BA biosynthesis. The concentrations of total BAs, dominant primary BAs (including cholic acid CA and chenodeoxycholic acid CDCA) and numerous secondary BAs (including deoxycholic acid DCA, lithochalic acid LCA, taurodeoxycholic acid TDCA, ursocholic acid UCA, and ursodeoxycholic acid UDCA) were significantly higher in active snakes than in pre-hibernation and hibernation snakes (Figs. 5A and S10). Furthermore, the concentrations of propionic acid, butyric acid, isovaleric acid, ethylmethylacetic acid, and valeric acid were dramatically higher in active snakes (Fig. 5B and Supplementary Table 2). The levels of phenylpropanoic acids (Supplementary Fig. 11A), organic acids (Supplementary Fig. 11B), and fatty acids (Supplementary Fig. 11C) were higher in active snakes. The levels of carnitine and acetylcarnitine, which are the predominant carnitine metabolites, were significantly higher in hibernation snakes than in active and pre-hibernation snakes (Supplementary Fig. 11D). The levels of glucose 6-phosphate and fructose 6-phosphate—the dominant carbohydrate metabolites—were highest in hibernation snakes and lowest in active snakes (Supplementary Fig. 11E). TMAO and creatinine levels were substantially higher in pre-hibernation snakes, whereas betaine and l-carnitine levels were the highest in hibernation snakes (Supplementary Fig. 11F).
Fig. 5. The comparison of gut bile acids and short-chain fatty acids (SCFAs).

The comparisons of dominant bile acids (A) and all kinds of SCFAs (B) in the gut of snakes during active (Active), pre-hibernation (Pre-Hib), and hibernation (Hib) period, n = 10 biologically independent samples. *Indicate p < 0.05, **p < 0.01 and more * means more significant differences, and ns means no significant differences. The error bars represent the standard deviation of each group of data.
Correlation analysis revealed that Romboutsia showed a robust correlation with BAs, fatty acids, and partly SCFAs (Fig. 6A), in line with the higher concentrations of BAs, fatty acids, and SCFAs in active snakes. Providencia was closely related to metabolites with higher concentrations in hibernation snakes, including carnitines, carbohydrates, organic acids, and fatty acids, which should be the metabolites degraded from SPs (Fig. 6B). Vagococcus was more abundant in pre-hibernation snakes and were closely related to TMAO, which is an important substance that inhibits fat degradation, and this result might explain the negative relationship between Vagococcus and serum SP lipids (Fig. 4E) and liver genes (Fig. 4F and Fig. 6B). Finally, based on data of liver gene expressions, serum lipid levels and gut metabolite concentrations, three more detailed and focused pathway maps of primary BA biosynthesis (Fig. 7A), SP degradation (Fig. 7B) and glycolysis/gluconeogenesis (Fig. 7C) were constructed.
Fig. 6. Correlation analysis between gut microbiota and gut metabolites.

The correlation analysis between dominant microbial genera with gut metabolites. A Romboutsia, Lactobacillus, Epulopiscium, and Clostridium_sensu_stricto_13 are closely correlated with gut bile acids, short-chain fatty acids (SCFAs), and fatty acids. B The correlativity between other dominant genera, including Romboutsia, Vagococcus, Providencia, Enterococcus, Erysipelothrix, Bacteroides, Morganella, and Parabacteroides, with carnitines, carbohydrates, organic acids, fatty acids, trimethylamine N-oxide (TMAO) and precursors (betaine, creatinine, and l-carnitine). The Heatmap on the left of the genera shows the differences in the relative abundance of these genera among active (Active), pre-hibernation (Pre-Hib), and hibernation (Hib) snakes, and the heatmap in the bottom shows the differences in the concentrations of gut metabolites among active (Active), pre-hibernation (Pre-Hib) and hibernation (Hib) snakes. *Means the significant positively (bluer) or negatively (redder) correlation relationships.
Fig. 7. The hand-painted heatmap pathway maps comprehensively compared the substances and genes involved in the main processes of snake metabolism.

The hand-painted heatmap pathway maps of bile acid biosynthesis (A), sphingolipid degradation (B), gluconeogenesis (C), and their potential roles in the energy metabolism of snakes’ annual life cycle based on the identified genes, serum lipids, and gut metabolites from liver transcriptome, serum lipidome, and gut metabolome. Words in boxes are the names of genes, and the words in ellipses are the names of metabolites, and the heatmaps near them show the differences in the gene expression, or metabolites levels/concentrations among active (AL, AM, AF), pre-hibernation (PL, PM, PF), and hibernation (HL, HM, HF) snakes.
Discussion
Higher BA secretion in active snakes promotes lipid metabolism: The higher levels of serum lipids in active snakes found in the present study were consistent with a previous study21, in which active Naja haje haje exhibited higher concentrations of serum total lipids, free fatty acids, and triglycerides. The present study also found higher levels of gut fatty acids, phenylpropanoic acids, and organic acids in active snakes, which are direct or indirect metabolites produced from the host’s digestion or microbes’ fermentation and can affect lipid metabolism22. The highly robust lipid metabolism suggested the digestion, absorption, and accumulation of more fat in the active phase, and this physiological phenomenon has been reported in poikilotherms23 and endotherms3,24. Nevertheless, a previous study found that hibernating mammals always showed high lipid degradation to supply energy during hibernation and storage lipids in active season6, whereas the present study found lower lipid levels in snakes during pre-hibernation and hibernation. Although no other study has explored serum and gut lipid concentrations in reptiles, a transcriptomic study on alligators found that the fat catabolism pathway was highly suppressed during hibernation23. This unique energy strategy in snakes may result from the distinct hibernation pattern: Large hibernators, such as bears, can only lower their body temperature by a few degrees during hibernation. In other hibernating mammals, although their body temperatures will approach the environmental temperature, the ability to regulate body temperature is partially retained. Therefore, their energy consumption may be higher than that of hibernating reptiles24,25. Passive hibernators mainly include some poikilotherms, such as snakes, turtles, crocodiles, and frogs, whose body temperature passively changes with the ambient temperature, and this very low body temperature greatly prevents vast energy consumption1,26. Another possible reason is that snakes only have white adipose tissue without brown adipose tissue, and only the latter can respond to cold by activating thermogenesis and burning itself to produce heat, initiating the catabolism of white adipose tissue27,28.
Mounting evidence has demonstrated that BAs play a critical role in regulating energy absorption, lipid metabolism, and cholesterol homeostasis29,30. CA and CDCA are the main downstream products of cholesterol catabolism in the liver and are conjugated with glycine and taurine to produce GCA, TCA, GCDCA, and TCDCA. These six BAs are classified as primary BAs31. Primary BAs are secreted into the intestine through the enterohepatic circulation and transformed into secondary BAs mediated by intestinal bacteria12. The present study found that active snakes had the highest levels of both serum and gut BAs, which was consistent with the highly robust lipid metabolism; however, cholesterol showed no significant difference among the three groups. BAs not only aid in the digestion and absorption of fat and fat-soluble vitamins as a fat emulsifier32,33 but also play a key role as signaling molecules in modulating lipid and glucose metabolism34. Multiple genes regulate BA synthesis in the liver, including Farnesoid X Receptor (FXR), CYP, and SLC gene families35,36. We discovered various upregulated CYP and SLC genes in active snakes. Generally, BAs are produced by the oxidation of cholesterol in liver parenchymal cells mediated by CYP genes, and the synthetic pathways include the neutral pathway mediated by CYP7A1 and the alternative pathway mediated by CYP27A1, as well as several other CYP genes. Thus, CYP genes are the rate-limiting factor of BA synthesis37. SLC27 genes are well known to encode fatty acid transport proteins and can transport BAs38. The multi-level results based on metabolite levels and gene expression fully confirmed the vigorous fat digestion, absorption, and lipid metabolism mediated by BAs in active snakes.
Higher SP degradation in hibernation snakes provides new insight into the energy-saving strategy: Given that lipid metabolites and BAs are present in very low levels, and in the absence of carbohydrates, it is therefore essential to explore the alternative energy source for hibernating snakes to maintain their basic life. Similar to mammalian hibernators, some hibernating ectotherms, such as common lizards (Lacerta vivipara) and geckos (Phyllodactylus marmoratus), rely on fat stores during hibernation39,40, while some use glycogen, such as the side-spotted lizard (Uta stansburiana)41. Whether the glycogen can be used as an energy supplier during lengthy hibernation is the question, as the liver and muscle glycogen will be used for several hours to several days after the exhaustion of carbohydrates. The present study did not support the utilization of glycogen in hibernation, because of the limited change in lactic and pyruvate acids, which are the key intermediate of glycogen degradation. A recent study on alligators found that in addition to muscle glycogen, β-oxidation of uncertain lipids may also be a potential source of energy supply during hibernation23. Another study reported higher levels of phospholipid in the serum of hibernating than active snakes21. These clues point to membrane lipids, mainly including phospholipids (including GPs and SM) and SP.
The present study found higher levels of phosphocholine (PC), phytosphingolipids, and several SPs (Cer-NS, Cer-NP, and GM3) in hibernation snakes. Further, the highly upregulated gene PSAP in hibernation snakes confirmed the changes in the above serum indexes from different levels. PSAP encodes a highly conserved lysosomal protein prosaposin, which plays a pivotal role in SP metabolism42. SPs are the core components of membrane lipids, including ceramides, SM, and other various forms of glycosphingolipids. SP metabolites, especially ceramides, can enter gluconeogenesis via the tricarboxylic acid (TCA) cycle and act as second messengers to regulate multiple cellular processes involved in inflammation, cell cycle, and metabolism43. In poikilotherms, changes in membrane lipids composition in response to cold and starvation are associated with an increase in unsaturated fatty acid levels44, which can also partly be reflected by serum-free fatty acid levels. The degradation of SPs found in the current study provides novel insight into the energy strategy of hibernation snakes.
Higher gluconeogenesis in hibernation snakes helping energy supply: Although we detected the degradation of SP during hibernation, the downstream pathway that drives the conversion of non-sugar substrates into directly usable glucose was not clarified. Gluconeogenesis is the most important process through which to convert non-sugar substances into sugars. The sugars then enter the glycolysis process leading to the production of energy for the body26. In this study, we found two types of evidence indicating the enrichment of gluconeogenesis in hibernating snakes: firstly, the genes involved in gluconeogenesis were upregulated in hibernating snakes, especially FBP. FBP encodes the rate-limiting enzyme of gluconeogenesis45,46. Secondly, the key substrate (acetate and lactate) and intermediates (fructose 6-phosphate, glucose 6-phosphate) of gluconeogenesis47,48 were increased in hibernating snakes. Although these metabolites were identified in the intestine, they can be absorbed by intestinal epithelial cells into the bloodstream, with elevated concentrations indicating a dynamic state of gluconeogenesis at the metabolic level49. Although the prevailing literature suggests that reptiles can significantly decrease their metabolism during extended fasting23,26, our study uncovered a potential energy supply pathway during snake hibernation.
Hibernation-induced microbial response and potential role in regulation metabolism: Although the α-diversity exhibited the biggest gap between hibernation and pre-hibernation, analysis of PCoA and phylum revealed a close distance between these two periods and far distance between active with hibernation and pre-hibernation. The predominant phyla were Proteobacteria and Firmicutes, followed by Bacteroidota. The results were consistent with the precious findings on the same species19. Similarly, other studies on snakes have reported the dominant niche of these three phyla50,51. Herein, we found higher Proteobacteria and Bacteroidota abundance in hibernating snakes, but the abundance of Firmicutes was decreased. Although Proteobacteria has been recognized as a hallmark feature of dysbiosis in gut microbiota because it contains many opportunistic pathogens, it is closely related to a high-fat diet or obesity52,53, indicating it plays a role in fat metabolism. The Firmicutes have been extensively known to ferment dietary fiber and indigestible carbohydrates54. In contrast, Bacteroidota favors more digestible carbohydrates55. Dynamic changes in these three phyla during hibernation have been reported in other animals56,57, implying the phyla have specific functions in nutrition, immune, or thermogenesis that help animals to thrive. The dynamic changes in microbial genera and species may explain the changes in the phylum. The correlation analysis revealed that Romboutsia was the main genus involved in the BA metabolism of active snakes, and Providencia was mainly involved in SP degradation and gluconeogenesis of hibernating snakes, whereas Vagococcus was significantly related to the inhibition of SP degradation in pre-hibernation snakes.
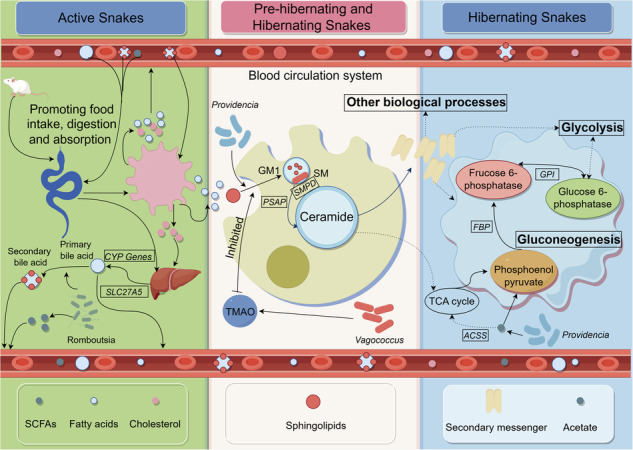
Further measurements of gut microbial metabolites showed that Romboutsia promoted the metabolism of lipids into long-chain fatty acids by producing secondary BAs, and then fermented to produce SCFAs to provide energy. Romboutsia is a new genus isolated from animal gut and is classified into family Peptostreptococcaceae, which has the capability to transform primary BAs into secondary BAs58, and previous studies reported its positive correlation with BAs produced in animals59,60. Providencia facilitated the degradation of SP through the production of carnitine and then produced fatty acids, organic acids and carbohydrates as host energy. Carnitine is the key medium for fatty acids to enter the mitochondria for oxidative decomposition, known as “fat carrier”. In the process of lipolysis, l-carnitine first promotes the hydrolysis of fatty acids, and then transports the decomposed fatty acids through the blood circulation system to the various cells of the body, especially muscle tissue, for further oxidative decomposition61. We also found a highly positive correlation in hibernating snakes between Providencia and creatinine, which is an index to indicates the level of muscle metabolism. Vagococcus inhibited SP degradation by producing TMAO. TMAO is produced in the liver from trimethylamine (TMA), which is synthesized from dietary or endogenetic carnitines, betaine, creatinine, and choline under the catalysis of trimethylaminelyase produced by gut microbes62. Vagococcus may accelerate the conversion from carnitines into TMAO, resulting in the reduction of carnitines, and then inhibited the SP metabolism63. Briefly, Romboutsia was involved in fat metabolism in active snakes by producing BAs and SCFAs in active snakes, and Providencia promoted SP degradation by producing carnitines in hibernation snakes, whereas Vagococcus inhibited SP degradation by producing TMAO in pre-hibernation snakes.
In this study, we show that snakes showed distinct characteristics of lipid and energy metabolism coping with cold and fasting hibernation, founding the certain microbes and their potential mechanism of BA metabolism and SP degradation. Specially, this study revealed the unique role of sphingolipid metabolism in snake hibernation, rather than relying on fat degradation for energy in mammalian hibernation. These findings advance our understanding of the complex energy-saving strategy in hibernating poikilotherm.
It is important to acknowledge a limitation that exists within this research. The investigation into the role of snake gut microbiomes via fecal microbiota transplantation (FMT) holds potential utility. However, the utilization of mammalian model animals for FMT, which necessitates the colonization of donor microbiota, raises doubts and necessitates further validation. In future studies, the potential of developing a reptilian model organism holds great promise, while the exploration of bacterial isolation and culture techniques should also be duly acknowledged for future research endeavors.
Methods
Ethics statement
We have complied with all relevant ethical regulations for animal use. This study was approved by the Animal Care and Use Committee of Jiangxi Agricultural University.
Animals and experimental design
Oriental rat snakes in this study were bred in specially designed rooms, where bricks and wooden boards were used to create 4–5 layers of compartments as hiding and hibernation spaces, and the rooms were semi-open, allowing the full use of natural light. Thirty male oriental rat snakes (one year old) were randomly divided into three groups: Active group, Pre-hibernation group, and Hibernation group, 10 snakes per group were bred in one room. The Active group was sampled at September 2022, and the average temperature range within one month before sampling in snake house was 23–32 °C, and the food was provided regularly; the Pre-hibernation group was sampled at November 2022, when the average temperature range within one month before sampling in snake house was 15–18 °C, and no food was provided; the Hibernation group was sampled at January 2023, and the temperature within one month before sampling in snake house was controlled at about 8–12 °C, and no food was provided. On extremely hot and cold days, heating equipment and air conditioners were used to control the temperature within the above range. The food for these snakes was the culled newborn chicks bought from a chicken farm, while the snakes were fed frogs and mice two months before the start of the experiment. The experimental design was visualized in Fig. 1A.
Sampling scheme
Firstly, the blood sample was collected from the snake cloaca by using a syringe, and the blood was transferred to centrifuge tubes without anticoagulant, then the serum (about 4 mL) was collected after the blood was centrifuged. Then, the selected snakes were sacrificed, and the liver and intestine were isolated. Two liver samples (about 2 g) were collected from each snake and were used for transcriptome and Quantitative Real-time PCR (qRT-PCR) validation, respectively. Finally, luminal contents were collected from the whole intestinal segments (no less than 1 g) by extrusion of luminal contents into tubes using a sterile spatula. The luminal samples were collected in triplicate, which were used for microbial 16S amplicon sequencing and metabolome, respectively. All the samples were temporarily stored in liquid nitrogen and finally stored in the −80 °C refrigerator after transport to the laboratory. The information on sampled snakes and samples is exhibited in Supplementary Table 3. AB, AL, AF, and AM respectively represent blood, liver, and gut content samples collected from active snakes (F for microbiota analysis and M for metabolite analysis); PB, PL, PF, and PM respectively represent blood, liver, and gut content samples collected from pre-hibernation snakes; HB, HL, HF and HM respectively represent blood, liver, and gut content samples collected from hibernation snakes. Due to the lack of precise indicators to determine whether snakes have entered hibernation, the serum concentrations of glucose, lactate, lactate dehydrogenase, and lipase were measured to verify whether the hibernating snakes are in a state of low metabolism, and the result suggests that the snakes’ direct energy demand at hibernation is very low (Supplementary Table 4).
Serum biochemistry
Serum glucose, lactate, lactate dehydrogenase, and lipase concentrations were measured at a fully automated biochemical analyzer (BK-600, BIOBASE, Jinan, Shandong) by using specific kits (BIOBASE, Jinan, Shandong). Glucose was measured using the glucose kit (hexokinase method), lactate was measured using the lactate kit (enzymatic colorimetric method), lactate dehydrogenase was measured using the lactate dehydrogenase kit (DGKC recommended method), and lipase was measured using the lactate lipase kit (enzymatic colorimetric method). All procedures were carried out according to the official instructions.
Serum lipidome
A 100 μL sample was combined with 0.75 mL of methanol in a glass tube with a Teflon-lined cap, and then the tube was vortexed. 2.5 ml of methyl tert-butyl ether (MTBE) was introduced into the mixture, which was then placed in a shaker and incubated at room temperature for 1 h. The addition of 0.625 ml of MS-grade water triggered phase separation. After being incubated at room temperature for 10 min, the sample underwent centrifugation at a speed of 1000g for 10 min. The upper organic phase was gathered, and the lower phase was undergoing an additional extraction using 1 mL of the solvent mixture (MTBE/methanol/water in a ratio of 10:3:2.5, v/v/v), and the upper phase was then collected. The organic phases were combined, dried, and then dissolved in 100 μL of isopropanol for storage. The ultra-high-performance liquid chromatographic-tandem mass spectrometry method (UHPLC-MS/MS) analyses were performed using a Vanquish UHPLC system (Thermo Fisher, Germany) coupled with an Orbitrap Q ExactiveTM HF mass spectrometer (Thermo Fisher, Germany) in Novogene (Beijing, China).
The raw data files were analyzed using the Compound Discoverer 3.01 (CD3.1, Thermo Fisher) to align peaks, select peaks, and quantify each metabolite. Partial least squares discriminant analysis (PLS‐DA) was performed at metaX64. The metabolites with VIP > 1 and p < 0.05 and fold change ≥ 2 or FC ≤ 0.5 were considered to be differential metabolites. Metabolites were filtered using volcano plots, which relied on Log2(FC) and −log10(p-value) of metabolites. FC barplots and KEGG enrichment scatters were plotted in OmicStudio65. The Kruskal-Wallis test was used to calculate the significance of relative concentrations of ACar, BA, cholesterol, DAG, free fatty acids, TAG, corticosterone, and testosterone among groups, and then the box plots were produced.
Gut microbiome
Environmental DNA was extracted from crushed luminal contents in liquid nitrogen using the sodium dodecyl sulfate (SDS) technique. After the DNA concentration and purity were tested, DNA was diluted to 1 ng/µL with sterile water. The above DNA served as the template to amplify the 16S rRNA gene’s V3–V4 region using the specific primer 341F (CCTAYGGGRBGCASCAG) and 806R (GGACTACNNGGGTATCTAAT). Novogene (Beijing, China) utilized an Illumina platform to construct the sequencing library, followed by high-throughput sequencing on a NovaSeq PE250 platform. The raw data were subjected to quality control involving the removal of barcodes, chimeras, and low-quality reads. The clean reads obtained were then classified into amplicon sequence variants (ASVs) by Divisive Amplicon Denoising Algorithm 2 (DADA2) in the Quantitative Insights into Microbial Ecology 2 (QIIME 2) pipeline66,67. ASVs were annotated into bacterial taxa using the SILVA 138 database to obtain the taxonomic information. The α-diversity was calculated from seven indices in QIIME266, including Observed_otus, Chao1, Shannon, Simpson, Dominance, Good’s coverage, and Pielou_e. After calculation of Bray-Curtis dissimilarity, principal coordinate analysis (PCoA) was performed in combination with analysis of similarities (ANOSIM) via R. Linear discriminant analysis (LDA) effect size (LEfSe) was performed using online software (https://huttenhower.sph.harvard.edu/lefse). Further, the PICRUSt2 software68 was used for function annotation analysis. The one-way analysis of variance (ANOVA) or Kruskal-Wallis test was used to calculate the significance of α-diversity (Shannon and Simpson), dominant phyla, genera, and species after the normality of data was determined using the nonparametric one-sample Kolmogorov–Smirnov test in SPSS 24.0 (IBM, Chicago, IL, USA).
Gut metabolome
Targeted metabolomic determination of trimethylamine N-oxide (TMAO)
After grinding the frozen samples in liquid nitrogen, a certain amount of the sample was added to mass spectrometry water and then vortexed to obtain a diluted sample. Then 50 μL of diluted sample were taken respectively and homogenized with 200 μL of acetonitrile which contained mixed internal standards by well vortexing. Next, put it on ice for 30 min. After that, centrifuged at 12,000 rpm for 10 min. Then, the supernatant was injected into the liquid chromatography coupled to tandem mass spectrometry (LC–MS/MS) system (QTRAP 6500+ and ExionLC AD, SCIEX, Framingham, MA, USA) for analysis in Novogene (Beijing, China). Finally, the absolutely quantitative contents of TMAO and four precursors were obtained, and the Kruskal-Wallis test was used to calculate the significance of these metabolites.
High-throughput targeted metabolome (N300)
The N300 metabolome is a targeted metabolomic technology developed for high-throughput absolute quantification of small molecule metabolites, enabling absolute quantification of 300+ substances in biological samples in one assay. About 10 mg samples were mixed with 10 pre-chilled zirconium oxide beads and 20 μL of deionized water. The sample was homogenated for 3 min and 120 μL of Methanol containing internal standard was added to extract the metabolites. The mixture was homogenated for another 3 min and then centrifuged at 18,000g for 20 min. Then the supernatant was transferred to a 96-well plate, which was sealed for LC–MS analysis after being processed on an Eppendorf epMotion Workstation. A UHPLC–MS/MS system (ACQUITY UPLC-Xevo TQ-S, Waters Corp., Milford, MA, USA) was used to quantify all targeted metabolites in Novogene (Beijing, China). Finally, the Kruskal–Wallis test (for discrete data) or ANOVA (for normalized data) was used to calculate the significance of the absolute concentrations of these metabolites, and box plots were produced.
Liver transcriptome and quantitative real-time PCR
Liver transcriptome
After the total RNA was extracted, the RNA Nano 6000 Assay Kit of the Bioanalyzer 2100 system (Agilent Technologies, CA, USA) was used to evaluate the amounts and integrity of RNA. The cDNA library was established, qualified, and pooled, then the transcriptome sequencing was performed by the Illumina NovaSeq 6000 in Novogene (Beijing, China). Through a series of conversion of data, elimination of redundancy and quality control, the clean data was obtained, and the Q20, Q30, and GC content were calculated. The Trinity software (v2.15.1) was used to assemble the clean reads with min_kmer_cov set to 2 by default and all other parameters set default69. The BUSCO software70 was used to evaluate the above transcript, and the results were shown in Supplementary Fig. 12. On the basis of splicing, Corset (version 4.6)71 aggregated transcripts into many clusters according to inter-transcriptional SharedReads. Then, combined with the expression level of transcripts among different samples and the H-Cluster algorithm, transcripts with different expression differences between samples were separated from the original cluster to establish a new cluster, which was defined as “Gene”. Functional annotation was done using DIAMOND to subject the UniGenes to BLAST searches against the NCBI non-redundant protein sequences (Nr), NCBI non-redundant nucleotide sequences (Nt), Protein family (Pfam), Clusters of Orthologous Groups of proteins (KOG/COG), KEGG Ortholog database (KO) and Gene Ontology (GO). Differential expression analysis among groups was performed using the DESeq2 R package (1.20.0)72, and p adj < 0.05 and |log2(FC)| > 1 were set as the threshold for significantly differential expression. KOBAS (v2.0.12)73 software was used for the KEGG pathway enrichment analysis of differential genes. The up-regulated and downregulated differential genes were identified by Volcano plots and multiple-group Volcano plots based on Log2(FC) and −log10(p-value). Multiple-groups Volcano plots are based on the traditional volcano plot method, but with an additional column in the input table, which contains grouping information representing the KEGG functions to which each gene belongs. Both Volcano plots and multiple-group Volcano plots were conducted in the OmicStudio platform.
qRT-PCR
The qRT-PCR was performed to verify the differences in the expression of genes CYP7B, PSAP, and FBP. Total RNA was extracted from the liver samples using TRIzol reagent (Invitrogen, Carlsbad, CA, USA). The Revert Aid First Strand cDNA Synthesis Kit (Thermo, Waltham, MA, USA) was utilized to conduct reverse transcription. First-strand cDNA synthesis utilized various components including Total RNA, Oligo (dT)18 primer, Random Hexamer primer, nuclease-free water, 5×Reaction Buffer, RiboLock RNase Inhibitor, 10 mM dNTP mix, and RevertAid M-MuLV RT. The PCR procedure consisted of an initial incubation at 25 °C for 5 min, followed by a subsequent incubation at 42 °C for 60 min. The reaction was then concluded by heating at 70 °C for 5 min. In this study, qRT-PCR was conducted using TB Green™Premix Ex Taq™II (TaKaRa, Shiga, Japan) with β-actin serving as the control gene. Each reaction included 3 μL of cDNA, 12.5 μL of TB Green Premix Ex Taq II, 1 μL of each primer (taken from a 10 μmol/L stock), and ultra-pure water to reach a total volume of 25 μL. The CFX96 Real-Time PCR Detection System (Bio-Rad, Hercules, CA, USA) was utilized for conducting PCR. Technically, every sample that was analyzed in three duplicates. Finally, the relative expression levels of CYP7B, PSAP, and FBP were calculated. Supplementary Table 5 contains the listed primers’ sequences.
Correlation analysis
Firstly, to verify the consistency of the results between the serum lipidomics and liver metabolomics, a pathway enrichment correlation analysis (Fig. 3E, F) between the two omics was conducted by inputting the pathway enrichment tables on an online platform (magic.novogene.com). Next, to explore the relationship between gut microbiota and serum metabolites as well as liver transcription, the correlation network heatmap analysis (Fig. 4E, F) and correlation heatmap analysis (Supplementary Figs. 8 and 9) was performed by inputting the relative abundance table of gut microbiota, the concentration table of differential serum metabolites, and the relative expression table of differentially expressed liver genes on the OmicStudio platform (www.omicstudio.cn). Then, the correlation between dominant microbial genera and gut metabolites was performed to identify the specific microbes and metabolites involved in the above differential pathways in R. Finally, for a clearer exhibition of differential pathways, the hand-painted heatmap pathway maps were produced by PowerPoint (Microsoft, Redmond, WA, USA) based on the serum lipid levels, liver gene expressions and gut metabolites concentrations.
Statistics and reproducibility
The number size was 10 for each group. Firstly, the normality of data was determined using the nonparametric one-sample Kolmogorov–Smirnov test. Then, The Kruskal–Wallis test (for discrete data) was used to calculate the significance of relative concentrations of ACar, BA, cholesterol, DAG, free fatty acids, TAG, corticosterone, and testosterone among groups, and then the box plots were produced. Subsequently, the ANOVA (for normalized data) or Kruskal-Wallis test was used to calculate the significance of α-diversity (Shannon and Simpson), dominant phyla, and genera. Finally, the Kruskal–Wallis test or ANOVA was used to calculate the significance of the absolute concentrations of these gut metabolites. All the above statistical analyses were performed in SPSS 24.0 (IBM, Chicago, IL, USA).
Reporting summary
Further information on research design is available in the Nature Portfolio Reporting Summary linked to this article.
Supplementary information
Description of Additional Supplementary File
Acknowledgements
We are grateful for all constructive comments from anonymous reviewers and editors to improve the paper. We are grateful to Linan Qiu of the Snake Breeding Farm for his help in sample collection. This study was funded by the National Natural Science Foundation of China (32160257) and Natural Science Foundation of Jiangxi Province (20202BABL213048).
Author contributions
X.H. and Y.Z. designed and conceived this study. Y.W., H.M., Q.L., W.F., and T.Z. performed the experiments, collected and analyzed data. C.B., Y.X., and W.Z. contributed to data analysis and interpretation. Y.W. wrote the paper and X.H. revised the paper. All authors read and approved the final paper.
Peer review
Peer review information
Communications Biology thanks the anonymous reviewers for their contribution to the peer review of this work. Primary Handling Editors: Aylin Bircan, David Favero.
Data availability
The raw data reported in this paper have been deposited in the Genome Sequence Archive (https://ngdc.cncb.ac.cn/gsa) or OMIX in the National Genomics Data Center, China National Center for Bioinformation/Beijing Institute of Genomics, Chinese Academy of Sciences. The accession number of 16S rRNA gene sequencing and transcriptome data are CRA013808 and CRA014049, respectively. The accession number of metabolome for TMAO, N300 and lipidome are OMIX005415, OMIX005416, and OMIX005420, respectively. Source data are provided in this paper as Supplementary Data 1.
Code availability
This article contains no original code, and software used in this study can be accessed through the following link: 10.5281/zenodo.1438051474.
Competing interests
The authors declare no competing interests.
Footnotes
Publisher’s note Springer Nature remains neutral with regard to jurisdictional claims in published maps and institutional affiliations.
These authors contributed equally: Yuting Wei, Huirong Mao
Supplementary information
The online version contains supplementary material available at 10.1038/s42003-025-07493-2.
References
- 1.Rial, R. V. et al. Evolution of wakefulness, sleep and hibernation: from reptiles to mammals. Neurosci. Biobehav. Rev.34, 1144–1160 (2010). [DOI] [PubMed] [Google Scholar]
- 2.Ruf, T. & Geiser, F. Daily torpor and hibernation in birds and mammals. Biol. Rev. Camb. Philos. Soc.90, 891–926 (2015). [DOI] [PMC free article] [PubMed] [Google Scholar]
- 3.Bao, Z. et al. Fatty acid metabolization and insulin regulation prevent liver injury from lipid accumulation in Himalayan marmots. Cell Rep.42, 112718 (2023). [DOI] [PubMed] [Google Scholar]
- 4.Jansen, H. T. et al. Hibernation induces widespread transcriptional remodeling in metabolic tissues of the grizzly bear. Commun. Biol.2, 336 (2019). [DOI] [PMC free article] [PubMed] [Google Scholar]
- 5.Secor, S. M. & Carey, H. V. Integrative physiology of fasting. Compr. Physiol.6, 773 (2016). [DOI] [PubMed] [Google Scholar]
- 6.Sommer, F. et al. The gut microbiota modulates energy metabolism in the hibernating brown bear Ursus arctos. Cell Rep.14, 1655–1661 (2016). [DOI] [PubMed] [Google Scholar]
- 7.Sheridan, M. A. Regulation of lipid metabolism in poikilothermic vertebrates. Comp. Biochem. Phys. B107, 495–508 (1994). [Google Scholar]
- 8.Gavrić, J. et al. Oxidative stress biomarkers, cholinesterase activity and biotransformation enzymes in the liver of dice snake (Natrix tessellata laurenti) during pre-hibernation and post-hibernation: a possible correlation with heavy metals in the environment. Ecotoxicol. Environ. Saf.138, 154–162 (2017). [DOI] [PubMed] [Google Scholar]
- 9.Lindsay, E. C., Metcalfe, N. B. & Llewellyn, M. S. The potential role of the gut microbiota in shaping host energetics and metabolic rate. J. Anim. Ecol.89, 2415–2426 (2020). [DOI] [PubMed] [Google Scholar]
- 10.Bäckhed, F., Manchester, J. K., Semenkovich, C. F. & Gordon, J. I. Mechanisms underlying the resistance to diet-induced obesity in germ-free mice. Proc. Natl Acad. Sci. USA104, 979–984 (2007). [DOI] [PMC free article] [PubMed] [Google Scholar]
- 11.Kindt, A. et al. The gut microbiota promotes hepatic fatty acid desaturation and elongation in mice. Nat. Commun.9, 3760 (2018). [DOI] [PMC free article] [PubMed] [Google Scholar]
- 12.Wahlström, A., Sayin, S. I., Marschall, H. & Bäckhed, F. Intestinal crosstalk between bile acids and microbiota and its impact on host metabolism. Cell Metab.24, 41–50 (2016). [DOI] [PubMed] [Google Scholar]
- 13.Romano, K. A., Vivas, E. I., Amador-Noguez, D., Rey, F. E. & Blaser, M. J. Intestinal microbiota composition modulates choline bioavailability from diet and accumulation of the proatherogenic metabolite trimethylamine-n-oxide. mBio6, e02481 (2015). [DOI] [PMC free article] [PubMed] [Google Scholar]
- 14.Ferreira Junior, R. S. et al. Comparison of wildlife and captivity rattlesnakes (Crotalus durissus terrificus) microbiota. Pesqui. Vet. Bras.29, 999–1003 (2009). [Google Scholar]
- 15.Costello, E. K., Gordon, J. I., Secor, S. M. & Knight, R. Postprandial remodeling of the gut microbiota in Burmese pythons. ISME J.4, 1375–1385 (2010). [DOI] [PMC free article] [PubMed] [Google Scholar]
- 16.Mclaughlin, R. W., Cochran, P. A. & Dowd, S. E. Metagenomic analysis of the gut microbiota of the timber rattlesnake, Crotalus horridus. Mol. Biol. Rep.42, 1187–1195 (2015). [DOI] [PubMed] [Google Scholar]
- 17.Pawlak, A. et al. Cloacal gram-negative microbiota in free-living grass snake Natrix natrix from poland. Curr. Microbiol.77, 2166–2171 (2020). [DOI] [PMC free article] [PubMed] [Google Scholar]
- 18.Tang, W. et al. Characterizing the microbiota in gastrointestinal tract segments of Rhabdophis subminiatus: dynamic changes and functional predictions. Microbiologyopen8, e789 (2018). [DOI] [PMC free article] [PubMed] [Google Scholar]
- 19.Wei, Y. T. et al. Differences in the luminal and mucosal gut microbiomes and metabolomes of oriental rat snake (Ptyas mucosus). Appl. Microbiol. Biotechnol.107, 3257–3271 (2023). [DOI] [PubMed] [Google Scholar]
- 20.Zhang, B., Ren, J., Yang, D., Liu, S. & Gong, X. Comparative analysis and characterization of the gut microbiota of four farmed snakes from southern China. PeerJ7, e6658 (2019). [DOI] [PMC free article] [PubMed] [Google Scholar]
- 21.El-Deib, S. Lipid changes in blood serum and tissues of the egyptian cobra “Naja haje haje” during the hibernation cycle. J. Therm. Biol.30, 51–59 (2005). [Google Scholar]
- 22.Chen, W. et al. Microbial phenolic metabolites 3-(3’,4’-dihydroxyphenyl) propanoic acid and 3’,4’-dihydroxyphenylacetic acid prevent obesity in mice fed high-fat diet. Food Sci. Hum. Wellness13, 327–338 (2024). [Google Scholar]
- 23.Lin, J., Huang, Y., Bian, M., Wan, Q. & Fang, S. A unique energy-saving strategy during hibernation revealed by multi-omics analysis in the Chinese alligator. iScience23, 101202 (2020). [DOI] [PMC free article] [PubMed] [Google Scholar]
- 24.Mohr, S. M., Bagriantsev, S. N. & Gracheva, E. O. Cellular, molecular, and physiological adaptations of hibernation: the solution to environmental challenges. Annu. Rev. Cell Dev. Biol.36, 315–338 (2020). [DOI] [PubMed] [Google Scholar]
- 25.Tøien, O. et al. Hibernation in black bears: independence of metabolic suppression from body temperature. Science331, 906–909 (2011). [DOI] [PubMed] [Google Scholar]
- 26.Price, E. R. The physiology of lipid storage and use in reptiles. Biol. Rev. Camb. Philos. Soc.92, 1406–1426 (2017). [DOI] [PubMed] [Google Scholar]
- 27.Giralt, M. & Villarroya, F. White, brown, beige/brite: different adipose cells for different functions? Endocrinology154, 2992–3000 (2013). [DOI] [PubMed] [Google Scholar]
- 28.Saely, C. H., Geiger, K. & Drexel, H. Brown versus white adipose tissue: a mini-review. Gerontology58, 15–23 (2011). [DOI] [PubMed] [Google Scholar]
- 29.Hu, H. et al. Gut microbiota promotes cholesterol gallstone formation by modulating bile acid composition and biliary cholesterol secretion. Nat. Commun.13, 252 (2022). [DOI] [PMC free article] [PubMed] [Google Scholar]
- 30.Just, S. et al. The gut microbiota drives the impact of bile acids and fat source in diet on mouse metabolism. Microbiome6, 134 (2018). [DOI] [PMC free article] [PubMed] [Google Scholar]
- 31.Di Ciaula, A. et al. Bile acid physiology. Ann. Hepatol.16, S4–S14 (2017). [DOI] [PubMed] [Google Scholar]
- 32.Lin, H., An, Y., Tang, H. & Wang, Y. Alterations of bile acids and gut microbiota in obesity induced by high fat diet in rat model. J. Agric. Food Chem.67, 3624–3632 (2019). [DOI] [PubMed] [Google Scholar]
- 33.Schmidt, D. R. et al. Regulation of bile acid synthesis by fat-soluble vitamins a and d. J. Biol. Chem.285, 14486–14494 (2010). [DOI] [PMC free article] [PubMed] [Google Scholar]
- 34.Zhou, H. & Hylemon, P. B. Bile acids are nutrient signaling hormones. Steroids86, 62–68 (2014). [DOI] [PMC free article] [PubMed] [Google Scholar]
- 35.Fiorucci, S., Distrutti, E., Carino, A., Zampella, A. & Biagioli, M. Bile acids and their receptors in metabolic disorders. Prog. Lipid Res.82, 101094 (2021). [DOI] [PubMed] [Google Scholar]
- 36.Hrycay, E. et al. Hepatic bile acid metabolism and expression of cytochrome p450 and related enzymes are altered in bsep −/− mice. Mol. Cell. Biochem.389, 119–132 (2014). [DOI] [PubMed] [Google Scholar]
- 37.Chiang, J. Y. L. & Ferrell, J. M. Up to date on cholesterol 7 alpha-hydroxylase (CYP7A1) in bile acid synthesis. Liver Res.4, 47–63 (2020). [DOI] [PMC free article] [PubMed] [Google Scholar]
- 38.Anderson, C. M. & Stahl, A. Slc27 fatty acid transport proteins. Mol. Asp. Med.34, 516–528 (2013). [DOI] [PMC free article] [PubMed] [Google Scholar]
- 39.Avery, R. A. Utilization of caudal fat by hibernating common lizards, Lacerta vivipara. Comp. Biochem. Phys.37, 119–121 (1970). [Google Scholar]
- 40.Daniels, C. B. The importance of caudal lipid in the gecko Phyllodactylus marmoratus. Herpetologica40, 337–344 (1984). [Google Scholar]
- 41.Zani, P. A. et al. Glycogen, not dehydration or lipids, limits winter survival of side-blotched lizards (Uta stansburiana). J. Exp. Biol.215, 3126–3134 (2012). [DOI] [PubMed] [Google Scholar]
- 42.He, Y. et al. Prosaposin maintains lipid homeostasis in dopamine neurons and counteracts experimental parkinsonism in rodents. Nat. Commun.14, 5804 (2023). [DOI] [PMC free article] [PubMed] [Google Scholar]
- 43.van Leent, M. M. T. et al. Prosaposin mediates inflammation in atherosclerosis. Sci. Transl. Med.13, eabe1433 (2021). [DOI] [PMC free article] [PubMed] [Google Scholar]
- 44.Fadhlaoui, M. & Couture, P. Combined effects of temperature and metal exposure on the fatty acid composition of cell membranes, antioxidant enzyme activities and lipid peroxidation in yellow perch (Perca flavescens). Aquat. Toxicol.180, 45–55 (2016). [DOI] [PubMed] [Google Scholar]
- 45.Say, R. F. & Fuchs, G. Fructose 1,6-bisphosphate aldolase/phosphatase may be an ancestral gluconeogenic enzyme. Nature464, 1077–1081 (2010). [DOI] [PubMed] [Google Scholar]
- 46.Yang, Z. et al. Retinoic acid inhibits the angiogenesis of human embryonic stem cell-derived endothelial cells by activating FBP1-mediated gluconeogenesis. Stem Cell Res. Ther.13, 239 (2022). [DOI] [PMC free article] [PubMed] [Google Scholar]
- 47.Emhoff, C. W. et al. Gluconeogenesis and hepatic glycogenolysis during exercise at the lactate threshold. J. Appl. Physiol.114, 297–306 (2013). [DOI] [PMC free article] [PubMed] [Google Scholar]
- 48.Rajas, F., Gautier-Stein, A. & Mithieux, G. Glucose-6 phosphate, a central hub for liver carbohydrate metabolism. Metabolites9, 282 (2019). [DOI] [PMC free article] [PubMed] [Google Scholar]
- 49.Chung, S. T., Chacko, S. K., Sunehag, A. L. & Haymond, M. W. Measurements of gluconeogenesis and glycogenolysis: a methodological review. Diabetes64, 3996–4010 (2015). [DOI] [PMC free article] [PubMed] [Google Scholar]
- 50.Zhong, J. et al. Comparative analysis of the gut microbiota composition between two sea snakes, Hydrophis curtus, and Hydrophis cyanocinctus. Coral Reefs41, 53–62 (2022). [Google Scholar]
- 51.Qin, Z. et al. Comparative analysis of intestinal bacteria among venom secretion and non-secretion snakes. Sci. Rep.9, 6335 (2019). [DOI] [PMC free article] [PubMed] [Google Scholar]
- 52.Jeong, M., Jang, H. & Kim, D. High-fat diet causes psychiatric disorders in mice by increasing proteobacteria population. Neurosci. Lett.698, 51–57 (2019). [DOI] [PubMed] [Google Scholar]
- 53.Méndez-Salazar, E. O., Ortiz-López, M. G., Granados-Silvestre, M. D. L. Á., Palacios-González, B. & Menjivar, M. Altered gut microbiota and compositional changes in Firmicutes and Proteobacteria in Mexican undernourished and obese children. Front. Microbiol.9, 2494 (2018). [DOI] [PMC free article] [PubMed] [Google Scholar]
- 54.Sun, Y. et al. Gut firmicutes: relationship with dietary fiber and role in host homeostasis. Crit. Rev. Food Sci. Nutr.63, 12073–12088 (2023). [DOI] [PubMed] [Google Scholar]
- 55.Gorvitovskaia, A., Holmes, S. P. & Huse, S. M. Interpreting Prevotella and Bacteroides as biomarkers of diet and lifestyle. Microbiome4, 15 (2016). [DOI] [PMC free article] [PubMed] [Google Scholar]
- 56.Gao, W. Z., Yang, Y. & Shi, L. Seasonal dietary shifts alter the gut microbiota of a frugivorous lizard Teratoscincus roborowskii (Squamata, Sphaerodactylidae). Ecol. Evol.13, e10363 (2023). [DOI] [PMC free article] [PubMed] [Google Scholar]
- 57.Zhang, B., Ding, X., Jiang, J., Li, L. & Yang, D. Metagenomic analysis of Mangshan pit viper (Protobothrops mangshanensis) gut microbiota reveals differences among wild and captive individuals linked to hibernating behaviors. Asian Herpetol. Res.13, 251–268 (2022). [Google Scholar]
- 58.Gerritsen, J. et al. Genomic and functional analysis of Romboutsia ilealis CRIBT reveals adaptation to the small intestine. PeerJ5, e3698 (2017). [DOI] [PMC free article] [PubMed] [Google Scholar]
- 59.Xie, X. et al. Effects of paraprobiotics on bile acid metabolism and liver health in largemouth bass (Micropterus salmoides) fed a cottonseed protein concentrate-based diet. Anim. Nutr.13, 302–312 (2023). [DOI] [PMC free article] [PubMed] [Google Scholar]
- 60.Yin, H., Huang, J., Guo, X., Xia, J. & Hu, M. Romboutsia lituseburensis JCM1404 supplementation ameliorated endothelial function via gut microbiota modulation and lipid metabolisms alterations in obese rats. FEMS Microbiol. Lett.370, 1–9 (2023). [DOI] [PubMed] [Google Scholar]
- 61.Yin, J. et al. Obese Ningxiang pig-derived microbiota rewires carnitine metabolism to promote muscle fatty acid deposition in lean DLY pigs. Innovation4, 100486 (2023). [DOI] [PMC free article] [PubMed] [Google Scholar]
- 62.Hoyles, L. et al. Metabolic retroconversion of trimethylamine N-oxide and the gut microbiota. Microbiome6, 73 (2018). [DOI] [PMC free article] [PubMed] [Google Scholar]
- 63.Maiti, A. & Daschakraborty, S. Effect of TMAO on the structure and phase transition of lipid membranes: potential role of TMAO in stabilizing cell membranes under osmotic stress. J. Phys. Chem. B125, 1167–1180 (2021). [DOI] [PubMed] [Google Scholar]
- 64.Wen, B., Mei, Z., Zeng, C. & Liu, S. metaX: a flexible and comprehensive software for processing metabolomics data. BMC Bioinforma.18, 183 (2017). [DOI] [PMC free article] [PubMed] [Google Scholar]
- 65.Lyu, F. et al. OmicStudio: A composable bioinformatics cloud platform with real‐time feedback that can generate high-quality graphs for publication. iMeta2, e85 (2023). [DOI] [PMC free article] [PubMed] [Google Scholar]
- 66.Bolyen, E. et al. Reproducible, interactive, scalable and extensible microbiome data science using QIIME 2. Nat. Biotechnol.37, 852–857 (2019). [DOI] [PMC free article] [PubMed] [Google Scholar]
- 67.Callahan, B. J. et al. DADA2: High-resolution sample inference from Illumina amplicon data. Nat. Methods13, 581–583 (2016). [DOI] [PMC free article] [PubMed] [Google Scholar]
- 68.Douglas, G. M. et al. PICRUSt2 for prediction of metagenome functions. Nat. Biotechnol.38, 685–688 (2020). [DOI] [PMC free article] [PubMed] [Google Scholar]
- 69.Grabherr, M. G. et al. Full-length transcriptome assembly from RNA-Seq data without a reference genome. Nat. Biotechnol.29, 644–652 (2011). [DOI] [PMC free article] [PubMed] [Google Scholar]
- 70.Simão, F. A., Waterhouse, R. M., Ioannidis, P., Kriventseva, E. V. & Zdobnov, E. M. BUSCO: assessing genome assembly and annotation completeness with single-copy orthologs. Bioinformatics31, 3210–3212 (2015). [DOI] [PubMed] [Google Scholar]
- 71.Davidson, N. M. & Oshlack, A. Corset: enabling differential gene expression analysis for de novo assembled transcriptomes. Genome Biol.15, 410 (2014). [DOI] [PMC free article] [PubMed] [Google Scholar]
- 72.Love, M. I., Huber, W. & Anders, S. Moderated estimation of fold change and dispersion for RNA-seq data with DESeq2. Genome Biol.15, 550 (2014). [DOI] [PMC free article] [PubMed] [Google Scholar]
- 73.Xie, C. et al. KOBAS 2.0: a web server for annotation and identification of enriched pathways and diseases. Nucleic Acids Res.39, W316–W322 (2011). [DOI] [PMC free article] [PubMed] [Google Scholar]
- 74.Hu, X. L. Comm_Bio_2024: Lipid metabolism and microbial regulation analyses provide insights into the energy-saving strategies of hibernating snakes. Zenodo10.5281/zenodo.14380514 (2024). [DOI] [PMC free article] [PubMed] [Google Scholar]
Associated Data
This section collects any data citations, data availability statements, or supplementary materials included in this article.
Supplementary Materials
Description of Additional Supplementary File
Data Availability Statement
The raw data reported in this paper have been deposited in the Genome Sequence Archive (https://ngdc.cncb.ac.cn/gsa) or OMIX in the National Genomics Data Center, China National Center for Bioinformation/Beijing Institute of Genomics, Chinese Academy of Sciences. The accession number of 16S rRNA gene sequencing and transcriptome data are CRA013808 and CRA014049, respectively. The accession number of metabolome for TMAO, N300 and lipidome are OMIX005415, OMIX005416, and OMIX005420, respectively. Source data are provided in this paper as Supplementary Data 1.
This article contains no original code, and software used in this study can be accessed through the following link: 10.5281/zenodo.1438051474.