

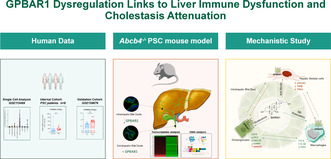
ABSTRACT
Background and Aims
Primary sclerosing cholangitis (PSC) is a chronic cholestatic liver disease characterised by progressive biliary inflammation and fibrosis, leading to liver cirrhosis and cholangiocarcinoma. GPBAR1 (TGR5) is a G protein‐coupled receptor for secondary bile acids. In this study, we have examined the therapeutic potential of BAR501, a selective GPBAR1 agonist in a PSC model.
Methods
Single‐cell analysis of healthy human liver samples and gene expression analysis of PSC liver samples were conducted. In vitro studies on a human cholangiocyte cell line (NHC), U937 and human hepatic stellate cells (hSteCs) were performed. Additionally, Abcb4 −/− mice were treated with BAR501 for 12–24 weeks.
Results
Single‐cell analysis demonstrated that GPBAR1 is expressed by macrophages, NK cells, sinusoidal cells and to a lesser extent by cholangiocytes. Total liver expression of GPBAR1 increases in PSC patients compared to that in healthy controls and positively correlates with markers for monocytes and NK cells and cytokeratin 19. In vitro treatment of NHCs with BAR501 reversed the acquisition of a pro‐inflammatory phenotype and the downregulation of GPBAR1 expression promoted by LPS in an NF‐κB‐dependent manner. Treating Abcb4 −/− mice reduced bile duct inflammation and liver fibrosis and prevented the downregulation of GPBAR1 expression. Treating mice with BAR501 also modulated the bile acid pool composition and reduced the dysbiosis‐associated gut permeability, and intestinal and systemic inflammation. Ex vivo experiments using conditioned media from BAR501‐treated cholangiocytes mitigated the activation of macrophages.
Conclusions
Our study provides evidence for the therapeutic potential of selective GPBAR1 agonists in intestinal inflammation–associated cholestasis, warranting the evaluation of BAR501 in PSC patients.
Keywords: bile acids, cholangiocytes–macrophages cross‐talk, GPBAR1 (TGR5), gut–liver axes, intestinal microbiota, primary sclerosing cholangitis
Summary.
Primary sclerosing cholangitis (PSC) is a progressive liver disease characterised by chronic inflammation and fibrosis of the bile ducts.
In this study, we investigated the therapeutic potential of BAR501, a selective agonist of the GPBAR1 receptor, in a mouse model of PSC.
Our findings demonstrate that BAR501 effectively reduces bile duct inflammation, mitigates liver fibrosis and restores bile acid homeostasis and gut microbiota balance.
These results suggest that BAR501 could represent a novel therapeutic strategy for managing PSC in patients.
Abbreviations
- Abcb4
ATP binding cassette subfamily B member 4
- ALP
alkaline phosphatase
- ALT
alanine transaminase
- ANIT
α‐naphthyl‐isothiocyanate
- AST
aspartate aminotransferase
- BECs
biliary epithelial cells
- CA
cholic acid
- CDCA
chenodeoxycholic acid
- ConA
concanavalin A
- EC50
half‐maximal effective concentration
- Elf3
E74‐like factor 3
- Fgf15
fibroblast growth factor 15
- FXR
farnesoid X receptor
- Glp1
glucagon‐like peptide 1
- GPBAR1
G protein bile acid–activated receptor 1
- GUDCA
glycoursodeoxycholic acid
- HCA
hyocholic acid
- HLA
human leukocyte antigen
- hSteCs
human hepatic stellate cells
- IBD
inflammatory bowel disease
- IHC
immunohistochemistry
- IL
interleukin
- KRT
cytokeratin
- LC/MS/MS
liquid chromatography with tandem mass spectrometry
- LCA
lithocholic acid
- LPS
lipopolysaccharide
- MCA
muricholic acid
- Mdr2
multidrug‐resistance transporter 2
- MRGPR4
Mas‐related G protein‐coupled receptor 4
- NF‐κB
nuclear factor kappa‐light‐chain‐enhancer of activated B cells
- NHCs
normal human cholangiocytes
- NK
natural killer
- NLRP3
NOD‐, LRR‐ and pyrin domain‐containing protein 3
- Ntrk2
neurotrophic receptor tyrosine kinase 2
- PCA
principal component analysis
- PSC
primary sclerosing cholangitis
- TGFβ
tumour growth factor β
- TGR5
Takeda G protein receptor 5
- TNF‐α
tumour necrosis factor α
- tSNE
t‐distributed stochastic neighbour embedding
- TUDCA
tauroursodeoxycholic acid
- U937
human monocytes
- UDCA
ursodeoxycholic acid
1. Introduction
Primary sclerosing cholangitis (PSC) is a chronic liver disorder characterised by a progressive inflammation of intrahepatic and extrahepatic bile ducts leading to bile duct strictures and fibrosis, and eventually to liver cirrhosis and cholangiocarcinoma [1]. Despite genome‐wide association studies positioned the PSC as an immune‐mediated disorder with both human leukocyte antigen (HLA) and non‐HLA predisposing genes [2], the aetiology of PSC remains elusive. A key mechanistic point, however, is that in 70%–80% of patients, PSC develops in the context of inflammatory bowel disease (IBD), mostly a right‐sided ulcerative colitis, indicating that PSC with IBD should be viewed as the standard phenotype of a disease that manifests in two organs [3]. A current pathogenetic hypothesis is that, in genetically predisposed individuals, intestinal inflammation and dysbiosis lead to impaired intestinal mucosal barrier and aberrant trafficking of intestinal lymphocytes towards the liver, leading to damage and senescence of biliary epithelial cells (BECs) [4]. Activated cholangiocytes, in turn, engage in a cross‐talk with immune cells, particularly macrophages, amplifying the inflammatory milieu in the liver. This interaction between cholangiocytes and macrophages is a central driver of the fibrotic processes observed in PSC [5]. Despite improvements in the understanding of pathogenesis and the recent development of risk‐stratification tools, therapeutic progress to fundamentally alter the course of PSC is lacking and no effective medical therapy exists [4]. The development of therapies directed towards the two main diseases remains a major medical need.
The G protein bile acid–activated receptor (GPBAR) 1, also known as Takeda G protein receptor (TGR)5 [6], is a membrane receptor for secondary bile acids [7]. The receptor is highly expressed in the intestine, epithelial and non‐epithelial cells, as well as in non‐parenchymal liver cells, that is Kupffer cells, liver sinusoidal and stellate cells, cholangiocytes [8, 9, 10] and particularly in cells of innate immunity, including monocytes, macrophages and natural killer (NK) cells [6, 11].
In the context of PSC, GPBAR1 plays several roles [12]: in macrophages, activation of GPBAR1 is associated with the development of a tolerogenic phenotype, whereas receptor ablation promotes liver and intestinal inflammation [13], and in cholangiocytes, GPBAR1 promotes a bicarbonate‐enriched choleretic and exerts cell‐protective effects, including anti‐apoptotic and anti‐senescence effects [9], highlighting a functional role for this receptor in maintaining cholangiocytes homeostasis. Even though GPBAR1‐deficient mice do not develop spontaneously cholestatic disorders, it has been shown that PSC development is associated with a selective reduction of the expression/function of GPBAR1 in BECs, which is reversed by treatment with ursodeoxycholic acid (UDCA) [10].
A similar pattern of dysregulation occurs in BECs isolated from the liver of ATP‐binding cassette subfamily B member 4 (Abcb4 −/−) mice, a mouse model for PSC [5]. However, although UDCA reverses PSC‐induced GPBAR1 downregulation in cholangiocytes, the contribution of GPBAR1 to the pharmacological activity of UDCA in PSC remains unclear. Indeed, UDCA is only partially effective in PSC, and while there is evidence that UDCA and its tauro derivative (TUDCA) weakly transactivate GPBAR1 in vitro [14], others have suggested that the main pharmacological effects of UDCA, its main metabolite in humans, glyco (G)‐UDCA, are mainly contributed by a direct and/or indirect antagonistic effect on the farnesoid X receptor (FXR) [15].
Building on this premise, we investigated whether treating mice with BAR501 [16], a selective agonist for GPABR1, reverses cholestasis and inflammation in Abcb4 −/− mice. Our findings highlight the potential of GPBAR1 agonism as a novel therapeutic strategy to modulate the inflammatory cross‐talk between cholangiocytes and macrophages, thereby addressing the underlying immune dysfunction and fibrosis characteristic of PSC.
2. Materials and Methods
2.1. 2D Culture Cell Lines
Epithelial‐like kidney cells (HEK293T), normal human cholangiocytes (NHCs), human monocytes (U937) and human hepatic stellate cells (hSteCs) were used in this study.
2.2. Mice Models of Cholestasis
Abcb4−/− and Gpbar1−/− mice, along with their C57BL/6 congenic littermates, were used in this study.
Extensive materials and methods are detailed in the Supporting Information S1.
3. Results
Previous studies have shown that expression of GPBAR1 (TGR5) in the liver is restricted to non‐parenchymal cells [8], but a comparison of relative abundance of the receptors in different liver cell subsets of normal subjects and PSC patients is lacking. We have therefore examined the expression profiles of GPBAR1 by single‐cells analysis carried out on the GSE115469 dataset, along with two human cohorts of PSC patients. Single‐cell analysis further revealed that GPBAR1 expression is higher in immune cell populations, particularly macrophages and NKT cells, whereas cholangiocytes showed only mild expression of the receptor (Figure 1A). The internal cohort consisting of nine PSC patients and nine age‐ and sex‐matched healthy controls (n = 9) (Table S1, Figure 1B), and a validation cohort of 12 PSC patients and healthy controls were retrieved from the GSE159676 repository (Figure 1C). Both cohorts demonstrated that the expression of GPBAR1 increases in the whole liver tissue of PSC patients compared to healthy controls (Figure 1B,C). The immune deconvolution analysis of the GSE196009 dataset, which showed a significant increase in the expression of biomarkers for monocytes, NK cells and T cell subsets, indicated immune dysregulation in PSC (Figure 1D). Furthermore, a correlation analysis revealed a direct association between GPBAR1 expression levels and markers for monocytes, NK cells and CD4+ T cells in PSC patients (Figure 1E). Additionally, we found a direct correlation between cytokeratin 7 (KRT7) and GPBAR1 expression (Figure 1E).
FIGURE 1.
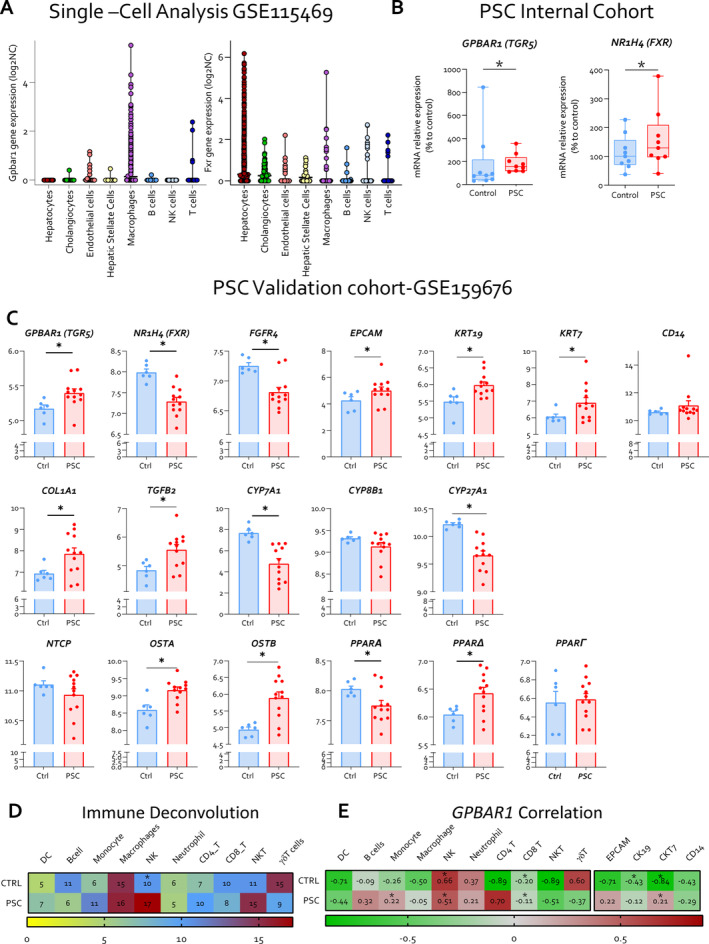
Single‐cell analysis of GPBAR1 expression in human parenchymal and non‐parenchymal liver cells, and GPBAR1 expression in the whole liver of PSC patients compared to healthy controls. Panel (A) illustrates single‐cell analysis of healthy human liver, derived from the GSE115469 dataset, showing the expression of GPBAR1 (TGR5) and FXR across different liver cell types. Panel (B) displays the relative mRNA expression levels of GPBAR1 and NR1H4 (FXR) in liver samples from an internal cohort of PSC patients and healthy controls (Ctrl) (n = 9). Panel (C) depicts a comprehensive human microarray analysis of liver tissues from healthy controls (Ctrl) and PSC patients, sourced from the GSE159676 series. Particularly, in the first row, gene expression of GPBAR1 (TGR5), FGFR4 and NR1H4 (FXR) is displayed, along with cholangiocyte proliferation markers including EPCAM, KRT19 and KRT7 as well as the macrophage marker CD14 (from left to right). The second row illustrates the expression of fibrosis markers COL1A1 and TGFΒ2, alongside genes involved in bile acid homeostasis, CYP7A1, CYP8B1 and CY27A1. In the third line, the expression levels of various transporter genes, NTCP, OSTA and OSTB, and PPAR isoforms genes PPARA, PPARD and PPARG are showed. In panel (D), immune deconvolution analysis based on human microarray and in panel (E), correlation analysis between immune population, cholangiocytes markers and GPBAR1 expression in both healthy controls and PSC patients are exhibited. COL1A1, collagen type I alpha 1 chain; EPCAM, epithelial cell adhesion molecule; NTCP, Na+−taurocholate co‐transporting polypeptide; OSTA, organic solute transporter alpha; OSTB, organic solute transporter beta; PPAR, peroxisome proliferator‐activated receptor.
3.1. Gpbar1 Expression Was Reduced in Inflamed Primary Cholangiocyte Cell Lines
Because these data suggest a potential role of GPBAR1 at the interface of macrophages and biliary epithelial cells, we have investigated whether the agonism towards GPBAR1 modulates the inflammatory response at the interface between cholangiocytes, macrophages and stellate cells using primary and immortalised cell lines. In these studies, LPS‐activated cell co‐cultures were exposed to BAR501 (Figure 2A), a selective GPBAR1 agonist (EC50 of 1 μM in transactivation assay on HEK293 cells) [16, 17]. The results of these studies demonstrate that while exposure of NHC cells, a human cholangiocyte primary culture, to 100 ng/mL of LPS promotes the acquisition of a pro‐inflammatory phenotype, cell activation resulted in a profound downregulation of GPBAR1 expression [10], gene and protein (Figure 2B,C). Treating LPS‐primed NHC cells with BAR501 effectively reversed GPBAR1 downregulation (Figure 2C). BAR501 counteracted the development of a pro‐inflammatory phenotype, reducing the expression of inflammatory biomarkers in a concentration‐dependent manner (Figure 2C, Figure S1). Activation of NHC by LPS also promoted the phosphorylation of NF‐κB, which was reversed by BAR501 (1 μM) (Figure 2D). Given that, in addition to cholangiocytes, GPBAR1 is expressed by macrophages [13] and hepatic stellate cells (HSCs) [18, 19], we investigated whether inflamed cholangiocytes could form a pro‐inflammatory niche by recruiting activated macrophages and HSCs and whether this property could be reversed by GPBAR1 activation. As illustrated in Figure 2E,F, challenging U937/HSC co‐cultures with the conditioned media harvested from LPS‐primed NHC activates a pro‐inflammatory program, as demonstrated by a robust increase in the expression of IL‐1β, IL‐6 and TNF‐α mRNAs in U937 and COL1A1, TGFβ/R2 and TNF‐α mRNA in HSCs. This pattern was reversed by BAR501 (Figure 2E,F), highlighting the concept that GPBAR1 agonism could mitigate inflammation at the cholangiocyte/macrophage/fibroblast interface.
FIGURE 2.
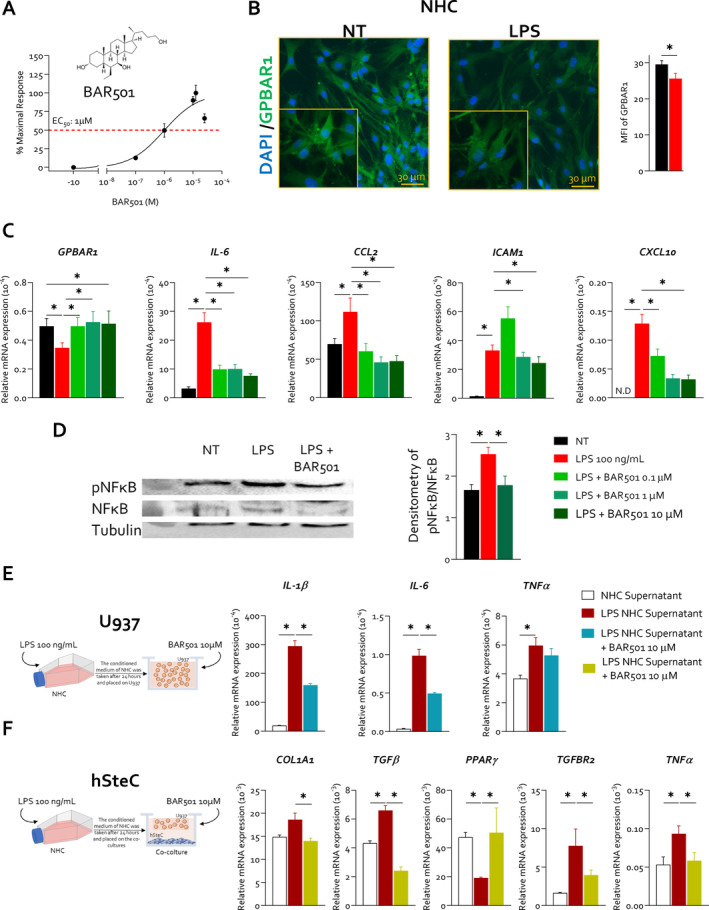
BAR501 reversed the LPS‐induced Gpbar1 downregulation in normal human cholangiocyte cell line, reducing NFκB phosphorylation, and exerts a protective role at macrophage/stellate cells interface. NHC cells were exposed to LPS 100 ng/mL alone or plus 0.1, 1 and 10 μM of BAR501 for 24 h or left untreated. In panel (A), 2D structure of the Gpbar1 agonist, BAR501, is shown and GPBAR1 transactivation assay of BAR501 on HEK393T cells. (B) This panel exhibits IF analysis of GPBAR1 (green) in NHC cells, with the estimated mean fluorescence intensity (MFI) analysis. Panel (C) illustrates the relative mRNA expression GPBAR1, IL‐6, CCL2, ICAM1 and CXCL10 (from left to right). Each value is normalised to GAPDH. In panel (D), representative Western blot analysis of pNFkB and NFkB, and tubulin protein analysis with densitometric analysis demonstrating pNFkB/NFkB ratio are displayed. Results are the mean ± SEM of three samples of the group. (*represents statistical significance versus NT, p < 0.05). NHCs were seeded and exposed to LPS or vehicle, and their supernatant was used to treat serum‐starved U937 cells and HSC, with or without BAR501, for 48 h. RNA was then extracted from U937 and hSteC cells for gene expression analysis. Panels (E and F) depict the effects of BAR501 on co‐culture of U937, a human macrophage cell line, and human HSCs stimulated with supernatants from LPS‐activated cholangiocytes. Particularly, in panel (E), relative mRNA expression of IL‐1B, IL‐6 and TNF‐α in U937 is exhibited. Similarly, panel (F) presents the relative mRNA expression of Col1a1, TGFB, PPARγ, TGFBR2 and TNF‐α in HSCs. Each value is normalised to GAPDH. Results are the mean ± SEM of three samples of the group. (*Statistical significance vs. NT, p < 0.05). These results highlight the concept that GPBAR1 agonism mitigates inflammation at the cholangiocyte/macrophage/fibroblast interface. CCL2, C‐C motif chemokine ligand 2; CXCL10, C‐X‐C motif chemokine ligand 10; GAPDH, glyceraldehyde‐3‐phosphate dehydrogenase; ICAM1, intercellular adhesion molecule 1; MFI, mean fluorescent intensity.
3.2. GPBAR1 Agonism Attenuates Cholestasis in Mouse Models of PSC
We have then investigated whether GPBAR1 agonism attenuates disease development in a mouse model of cholestasis. Two‐month‐old Abcb4 −/− mice were administered with 10 mg/kg BAR501 or left untreated and monitored until the age of 5 or 8 months. Wild‐type mice were used as controls (Figure 3, Figure S2). As shown in Figure 3, while there was no difference in body weight changes among the three experimental groups over the time, AST, ALT, ALP and bilirubin plasma levels were significantly higher in naïve Abcb4 −/− mice compared to their wild‐type counterparts (Figure 3B). Administering Abcb4 −/− mice with BAR501 reduced AST, ALT, ALP and bilirubin at 5 and 8 months (Figure 3B). The pathology examination at both time points demonstrated that Abcb4−/− mice left untreated develop PSC‐like features: accumulation of inflammatory cells surrounding the bile ducts and extending into the hepatic parenchyma, bile duct proliferation (cytokeratin 19 immunostaining) and liver fibrosis (Sirius red staining) (Figure 3C–E). Treating Abcb4 −/− mice with BAR501 effectively attenuated development of these changes at both 5 and 8 months (Figure 3D,E, Figure S3). By immunofluorescence, GPBAR1 expression was detected in bile epithelial cells (BECs) from intrahepatic (Figure 3F) and extrahepatic bile ducts (Figure S4A–D), and as shown in Figure 3F, the expression of the receptor in intrahepatic BECs was robustly reduced in 5‐ and 8‐month‐old Abcb4 −/− mice. In contrast, there were no changes in GPBAR1 expression in extrahepatic bile duct epithelia (Figure S4A–D). This differential regulation may be attributed to the distribution of ciliated and non‐ciliated cholangiocytes along the biliary tree [20]. The ciliated cholangiocytes, which harbour the higher expression of the receptor, are abundant in larger bile ducts that were less inflamed in comparison to small intrahepatic ducts [20]. Treating Abcb4 −/− mice with BAR501 reversed Gpbar1 downregulation in BECs (Figure 3F, Figure S4).
FIGURE 3.
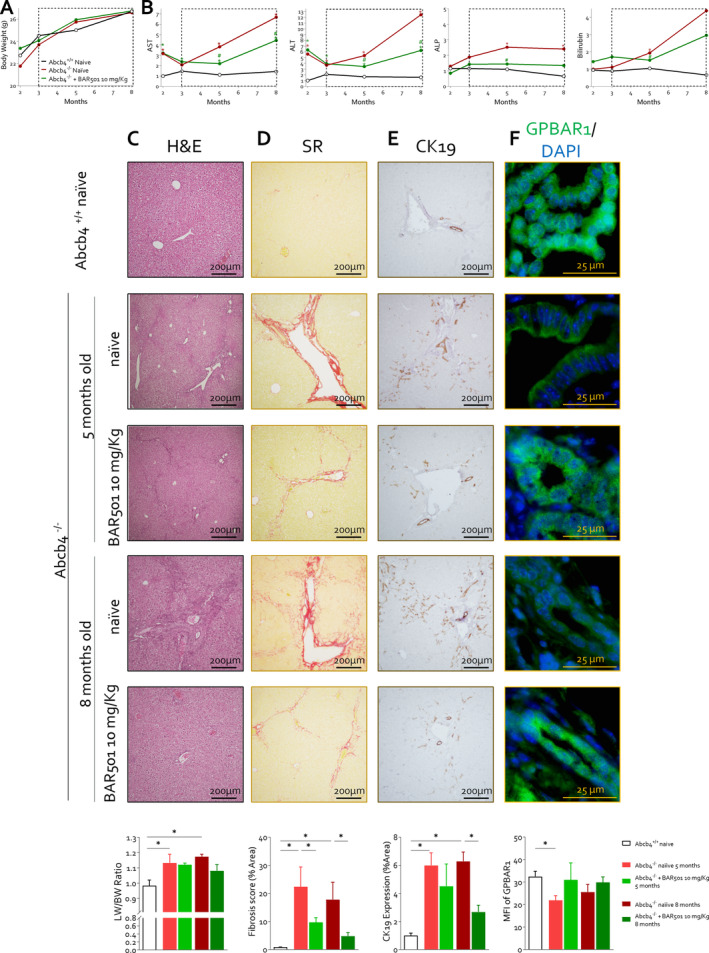
BAR501 exerted a protective effect on Abcb4 −/− cholestatic mice, improving liver biochemical function and histopathological features. In this experimental set, 2‐month‐old Abcb4 −/− mice were administered 10 mg/Kg of BAR501 or left untreated and monitored until the age of 5 or 8 months. Abcb4+/+ mice were used as control. (A) In this panel is reprented the trend of body weight (g) over time in Abcb4 +/+ (black), Abcb4 −/− (red) and Abcb4 −/− mice administered BAR501 (10 mg/kg) (green). Panel (B) displays the trend of plasma levels of AST, ALT, ALP and bilirubin (vs. Abcb4 +/+ ). Liver histopathology analysis is illustrated in panels (C–F). Particularly, panel (C) illustrates haematoxylin and eosin (H&E) staining of liver sections and liver weight/body weight ratio. The H&E staining demonstrates cytoplasmic vacuolization of hepatocytes and loss of normal lobular organisation occurring in portal areas. Panel (D) portrays the assessment of liver fibrosis by Sirius red staining of liver collagen and relative fibrosis score (% of area). The Sirius red staining demonstrates that Abcb4−/− develop portal–portal bridging and portal–central bridging that were reversed by BAR501. Panel (E) shows the assessment of proliferation of cholangiocytes through IHC of cytokeratin 19 (CK19) in liver section and its relative expression in % of area. Panel (F) describes the protein expression of Gpbar1 evaluated through immunofluorescence analysis (green) of intrahepatic bile duct and mean fluorescence (MFI) analysis. Results are the mean ± SEM of seven mice per group. *p < 0.05.
Consistent with the IHC analysis, we found that expression of GPBAR1 mRNA and protein was significantly reduced in BECs isolated from naïve Abcb4 −/− but was restored by in vivo treatment with BAR501 (Figure S5).
To further investigate whether GPBAR1 contributes to maintain immune homeostasis, we have then investigated whether deletion of GPBAR1 worsens liver damage in two chemical models of cholestasis (Figures S6 and S7). In the model of cholestasis induced by ANIT, GPBAR1 gene ablation failed to worsen the disease severity (Figure S6). As this model is considered mostly a model of direct hepatocyte/cholangiocyte toxicity, with minor immune activation, these findings confirm that GPBAR1, in contrast to FXR, does not regulate xenobiotic metabolism in the liver, whereas it exerts a role in immune cell regulation. Confirming this view, GPBAR1 gene ablation dramatically worsened the severity of liver injury induced by ConA, a model for autoimmune liver disease (Figure S7).
3.3. Gpbar1 Agonism Resets the Liver Immune Landscape in Abcb4 −/− Mice, Modulating Macrophage Polarisation and Immune Cell Dynamics
To gain further detail on the transcriptional profile promoted by Gpbar1 agonism through BAR501 treatment, AmpliSeq Transcriptome analysis (RNAseq) was performed on total livers of wild‐type and Abcb4−/− le BAR501. These transcriptomic studies revealed that 1907 transcripts were differentially modulated in Abcb4−/− in comparison to Abcb4 +/+‐naïve mice (red circle), whereas only 27 transcripts were exclusively modulated by BAR501 treatment (green circle). The intersection between the two red and green circles included 43 common transcripts that were modulated in Abcb4−/− mice treated or not treated with BAR501, highlighting the extent of gene expression changes due to Gpbar1 agonism (Figure 4A).
FIGURE 4.
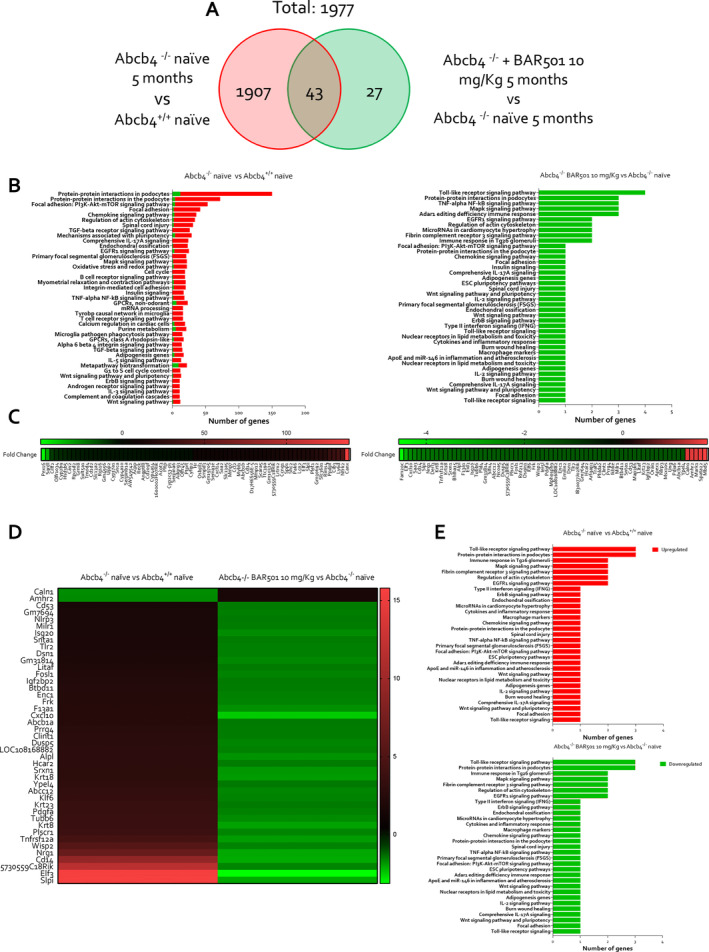
BAR501 downregulates genes involved in hepatic inflammation and fibrosis process in Abcb4 −/− mice. Two‐month‐old Abcb4 −/− mice were administered 10 mg/kg of BAR501 or left untreated and monitored until the age of 5 months. Abcb4+/+ mice were used as control. Transcriptomic analysis of liver tissue was performed. In panel (A), Venn diagram of differentially expressed genes showing the overlapping region between the Abcb4 −/− naïve versus Abcb4 +/+ (red circle) and Abcb4 −/− naïve Abcb4 −/− plus BAR501 (10 mg/kg) (green circle) are depicted. Panel (B) describes per pathway analysis in Abcb4 −/− naïve versus Abcb4 +/+ naïve (on left) and Abcb4 −/− naïve versus Abcb4 −/− plus BAR501 (10 mg/kg) (on right). Expression (Log2) of most up‐ and downregulated genes in (C) Abcb4 −/− naïve versus Abcb4 +/+ naïve analysis (on left) and Abcb4 −/− naïve Abcb4 −/− plus BAR501 (10 mg/kg) analysis (on right). The overlapping region between the experimental groups of mice was considered. Panel (D) shows the expression (Log2) of the most up‐ and downregulated genes, and in panel (E), the per pathway analysis in Abcb4 −/− naïve versus Abcb4 +/+ naïve (on top) and Abcb4 −/− naïve and Abcb4 −/− plus BAR501 (10 mg/kg) (on bottom) is illustrated. Results are the mean ± SEM of seven mice per group; (fold change < −2 or > 2, p value < 0.05).
The per pathway analysis of these differentially expressed genes was performed by the TAC software (Affimetrix) to dissect the molecular pathways underlining the development of the disease (Figure 4B on left) and the effect of Gpbar1 agonism (Figure 4B on right). The analysis demonstrated that BAR501 downregulated several pathways in inflammation, fibrosis and cellular proliferation (Figure 4C). The most upregulated gene in Abcb4−/− mice in comparison to wild‐type mice was Calnexin (Canx), a calcium‐binding chaperone critical for glycoprotein folding, whose dysregulation exacerbates bile duct inflammation and fibrosis [21]. Additionally, the neurotrophic receptor tyrosine kinase 2 (Ntrk2) gene [22] and the E74‐like factor 3 (Elf3) [23] and Cd14, a marker for myeloid cells in humans [6], were robustly upregulated in the model and their expression was reversed by treating mice with BAR501 (Figure 4D,E) [12, 24].
The heatmap shown in Figure 4D summarises the folds of changes of 43 genes differentially modulated in both settings, that is Abcb4 −/− versus wild type, and Abcb4 −/− plus BAR501 versus Abcb4 −/− . As shown in this figure, treating mice with BAR501 reversed these changes. Additionally, as shown in Figure 4E, treating mice with BAR501 downregulated the expression of several genes involved in immune responses and cytokine signalling including several components of NF‐κB and the Nlrp3 pathway. The activation of the NLRP3 inflammasome in biliary epithelial cells is NF‐κB dependent and once assembled leads to increased production of pro‐inflammatory cytokines and disruption of epithelial barrier integrity, which contributes to disease progression [28].
The immune deconvolution analysis of the liver transcriptome in the three experimental subsets revealed the assembly of a distinct immune cell population within the liver of Abcb4 −/− mice compared to their wild‐type counterparts (Figure 5A). Specific signatures of this cholestatic models were an increase in M1, pro‐inflammatory macrophages, in Abcb4 −/− mice compared to their wild‐type counterparts. Treating mice with BAR501 (Figure 5B) skewed the macrophage polarisation by reducing M1 macrophages while increasing the expression of marker for M2, anti‐inflammatory, macrophages (Figure 5C).
FIGURE 5.
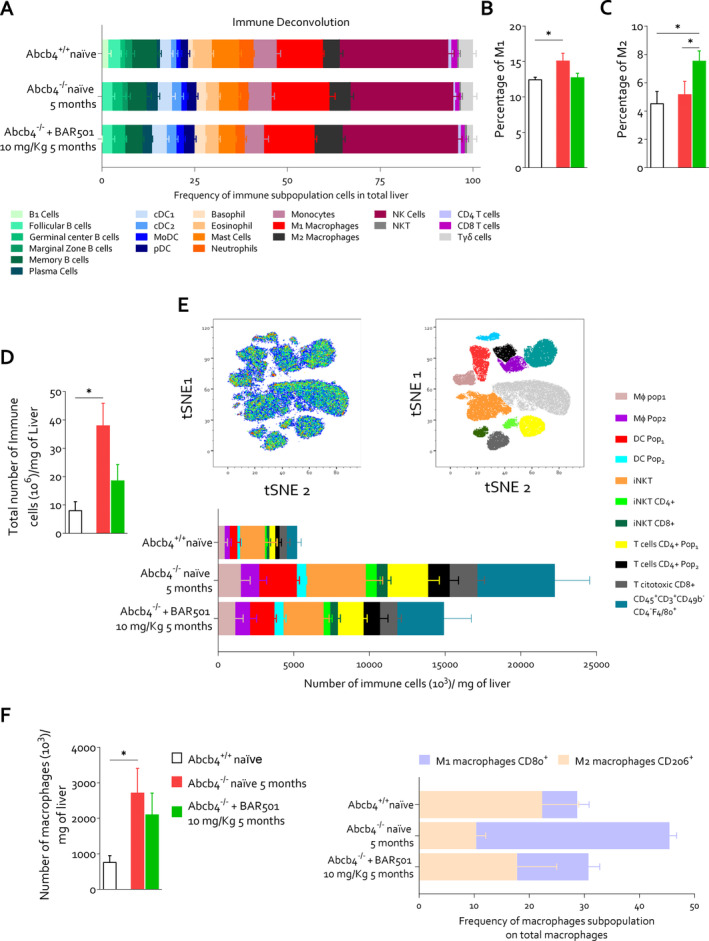
Gpbar1 agonism modulates hepatic immune infiltrate promoting macrophage polarisation towards an anti‐inflammatory phenotype in Abcb4 −/− mice. Immune deconvolution analysis based on mouse liver transcriptomic analysis was performed. In panel (A), the frequencies of immune subpopulation in total liver are represented. Panel (B) shows the percentage of pro‐inflammatory macrophages (M1) and panel (C) illustrates the percentage of anti‐inflammatory macrophages (M2) in all experimental groups. Non‐parenchymal cells were isolated from liver tissue derived from Abcb4+/+ naïve, Abcb4−/− naïve and Abcb4−/− plus BAR501 (10 mg/kg). Panel (D) exhibits the ratio of total number of immune cells (106) and liver weight (mg). Panel (E) displays tSNE analysis of non‐parenchymal liver cells and frequencies of immune cell populations. Panel (F) presents the ratio between number of macrophages (106) and liver weight (mg) and frequencies of macrophage subpopulation on total macrophages classified into M1 and M2 subtypes. Results are the mean ± SEM of five mice per group. *p < 0.05.
To further characterise the immune phenotypes, we have carried out a t‐SNE analysis of non‐parenchymal liver cells isolated from the three experimental groups. The results of these studies demonstrated that the development of cholestasis in Abcb4 −/− mice associates with a significant inflow of leukocytes in the liver microcirculation (Figure 5D–F). A prototypal signature of this inflammatory response is the expansion of the myeloid compartment with the recruitment of two distinct macrophage subsets (Figure 5F), pop1 and pop2. The macrophages in the pop1 subset were further classified as M1 and M2. The M1 macrophages were found to be elevated in Abcb4 −/− mice compared to both controls and BAR501‐treated mice. In contrast, M2 macrophages were increased in BAR501‐treated mice, suggesting a shift towards an anti‐inflammatory phenotype induced by the treatment (Figure 5F). A similar change was observed for T cells, which increased dramatically in Abcb4 −/− mice and were reduced by BAR501 treatment. Together, with the immune deconvolution, these findings provide evidence that GPBAR1 agonism in Abcb4 −/− resets the immune cell dynamics, skewing the macrophage polarisation towards an anti‐inflammatory phenotype.
3.4. BAR501 Administration Remodels the Bile Acid Pool in Abcb4−/− Mice
We have then assessed whether development of cholestasis in Abcb4 −/− mice and its reversal by BAR501 associates with remodelling of the bile acid pool. The LC/MS/MS analysis of bile acids in relevant compartments of Abcb4 −/− mice confirmed that changes in bilirubin and ALP associate with increased levels of total bile acids in the plasma and liver, whereas the faecal excretion was reduced. Furthermore, although levels of primary bile acids (CA, CDCA and MCAs) were increased in both plasma and liver, the faecal excretion of secondary bile acids was reduced, leading to a higher primary/secondary bile acid ratio in various compartments (Figure 6A–D). Plasma levels of CDCA, TCDCA and GCDCA were increased in Abcb4 −/− mice (Figure S8B), as well as αMCA and its amidated derivatives (Figure S8C). Among secondary bile acids, plasma levels of lithocholic acid (LCA) (Figure S8E) and UDCA (Figure S8F) were increased in Abcb4 −/− mice compared with their naïve counterparts. These biochemical changes were reversed by treating mice with BAR501 (Figure S8), which also led to the normalisation of the primary/secondary bile acid ratio (Figure 6B).
FIGURE 6.
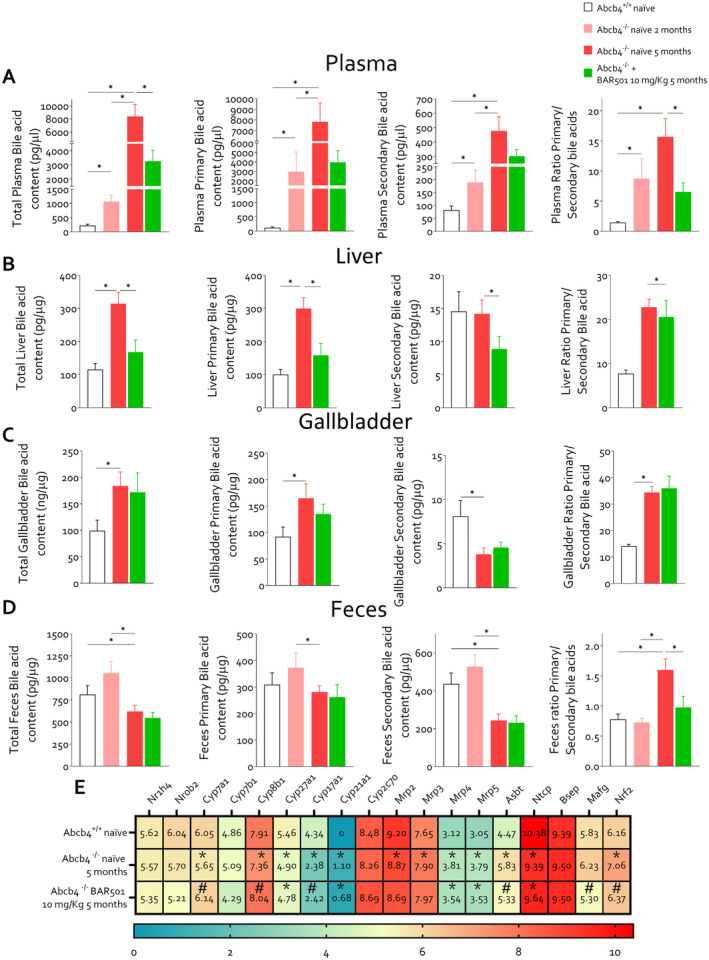
Bile acid changes in the mouse model of PSC. Two‐month‐old Abcb4 −/− mice were administered 10 mg/kg of BAR501 or left untreated and monitored until the age of 5 months. Abcb4+/+ mice were used as control. Panel (A) presents hepatic bile acids content (pg/μg), primary bile acid content (pg/μg), secondary bile acid content (pg/μg) and ratio of primary and secondary bile. In panel (B), plasmatic bile acid content (pg/μg), primary bile acid content (pg/μg), secondary bile acid content (pg/μg) and ratio of primary and secondary bile are exhibited. Panel (C) displays gallbladder bile acid content (pg/μg), primary bile acid content (pg/μg), secondary bile acid content (pg/μg) and ratio of primary and secondary bile. Panel (D) presents faecal bile acids content (pg/μg), primary bile acid content (pg/μg), secondary bile acid content (pg/μg) and ratio of primary and secondary bile. Panel (E) describes hepatic bile acid homeostasis gene expression (Log2). *p < 0.05.
The liver content of CA, the main FXR ligand in mice, GCA, TCA and T‐HyoCA (THCA) (Figure S9A) and levels of TCDCA (Figure S9B) and MCAs and their tauro‐derivatives (Tα‐ and TβMCA) were also higher in naïve Abcb4 −/− mice compared to wild‐type mice (Figure S9C). Treating Abcb4 −/− mice with BAR501 reduced the levels of amidated and non‐amidated primary bile acids in the liver. The content of secondary bile, including hyodeoxycholic acid (HDCA) and THDCA (Figure S9D), LCA and its derivatives (tauro‐, 3‐oxo‐, T3Oxo‐ and 7keto‐LCA) (Figure S9E), and UDCA and its derivatives (Figure S9F), was higher in Abcb4 −/− mice but was reduced by treatment with BAR501.
Accumulation of bile acids in the plasma, liver and gallbladder (Figure 6C, Figure S10) is associated with a reduction in their faecal excretion (Figure 6D). This reduction was significant for both primary bile acids, CDCA and MCAs, and their derivatives, and secondary bile acids, including DCA and 3oxoDCA, LCA and isoAlloLCA, and TUDCA (Figure S11B–F). The ratio of primary‐to‐secondary bile acids in faeces was also normalised by BAR501 treatment. Overall, these findings indicate that obstructive cholestasis in Abcb4 −/− mice leads to significant alterations in bile acid metabolism, which are consistent with changes observed in PSC patients and were partially corrected by BAR501.
The RNAseq analysis of liver transcriptome in the three experimental groups confirmed that the development of cholestasis in Abcb4 −/− mice associates with adaptive changes that typically occur in cholestasis, including downregulation of the expression of Cyp7a1 and Cyp27a1, the two rate limiting enzymes of the bile acid synthesis (26). Treating mice with BAR501 restored the liver expression of Cyp7a1 and Cyp8b1, but not that of Cyp27a1 (Figure 6E). As Cyp27a1 is essential for the synthesis of CDCA, which in mice is converted into MCAs by the activity of Cyp2c70 (27), these findings might contribute to explain the observed reduction in αMCA levels in Abcb4 −/− mice, treated or not treated with BAR501. Overall, these findings suggest that obstructive cholestasis in Abcb4 −/− mice led to significant alterations in bile acid metabolism, which was partially corrected by BAR501, which also modulated the expression of genes involved in bile acid homeostasis.
3.5. Gpbar1 Agonism Modulates Gut–Liver Axes and Systemic Inflammation in Abcb4 −/− Mice
The analysis of faecal microbiota demonstrated that Abcb4 −/− mice develop a severe dysbiosis (Figure 7). This view is supported by several statistical approaches, including the principal component analysis (PCA) plot, which illustrates the clustering of microbiota samples based on their composition, showing distinct patterns between the three experimental groups: Abcb4 +/+ , Abcb4 −/− and Abcb4 −/− treated with BAR501 (Figure 7A). The Abcb4 −/− mice showed lower species diversity and evenness compared to the wild‐type controls, which were partially corrected by treating mice with BAR501 (Figure 7B,C).
FIGURE 7.
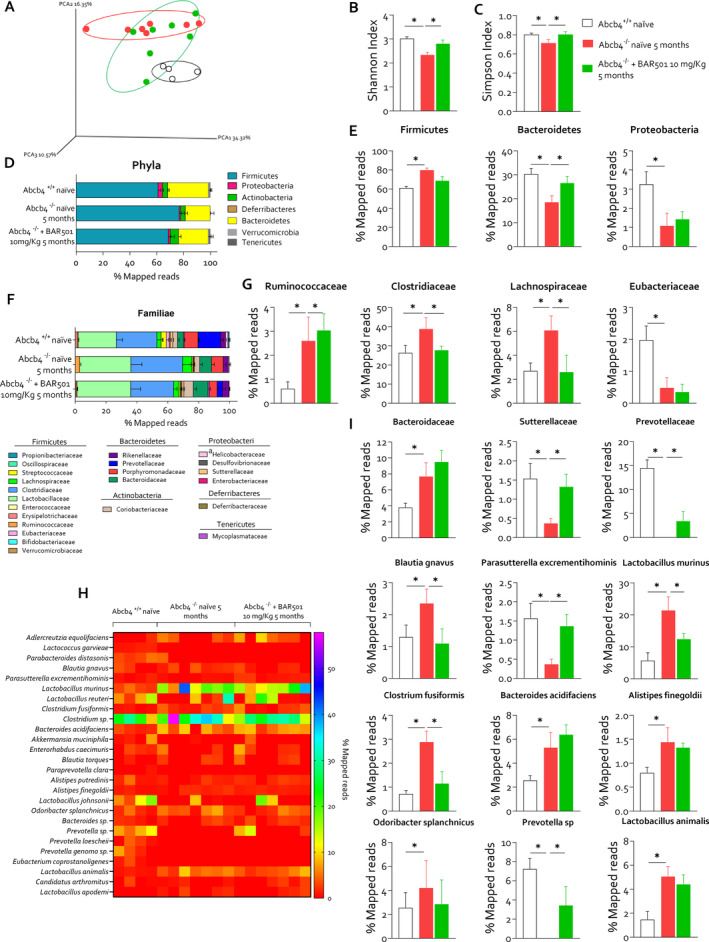
GPBAR1 agonism restores intestinal dysbiosis in Abcb4 −/− mice. Two‐month‐old Abcb4 −/− mice were administered 10 mg/kg of BAR501 or left untreated and monitored until the age of 5 months. Abcb4 +/+ mice were used as control. At the end of experiment, colonic faeces were collected and microbiota was analysed as described in the Materials and Method section. Panel (A) shows the analysis of the microbiota taxonomic profiles at the family level using the principal component analysis (PCA) plot of β diversity showing the distribution of all experimental groups: Abcb4 +/+ (black circle), Abcb4 −/− naϊve (red circle) and Abcb4 −/− plus BAR501 (green circle). Measurement of α diversity through, in panel (B), the Shannon and, in panel (C), the Simpson index. Panel (D) exhibits the relative abundance (% mapped reads) of phyla and panel (E) portrays the representative histograms of phyla statistically modulated: Firmicutes, Bacteroidetes and Proteobacteria in each experimental group. In panel (F), relative abundance (% mapped reads) of familiae and in panel (G) representative histograms of familiae statistically modulated in each experimental group are described. Panel (H) shows the relative abundance (% mapped reads) of species and (I) histograms of species statistically modulated.
Generi (Figure S12) and phyla analyses (Figure 7D,E) were performed. Phyla analysis demonstrated a significant increase in Firmicutes and a reduction in Bacteroidetes and Proteobacteria compared to wild‐type control, which were partially restored by BAR501. Further analysis at the bacterial families showed an enrichment in Ruminococcacae, Clostridiaceae and Lachnospiraceae, linked to inflammatory and metabolic alterations (Figure 7F,G). BAR501 also modulated specific bacterial families including Clostridium fusiformis and Prevotella sp. (Figure 7H), which are associated with intestinal barrier function and immune regulation [25, 26]. Particularly, the Prevotella sp. family is a butyrate producer, and its relative abundance is associated with enhanced intestinal tight junction regulation and maintenance of intestinal barrier function [25, 26]. Lower butyrate levels might weaken the barrier integrity and reduce mucosal immunity. Additionally, BAR501 administration effectively reduced the Blautia gnavus species (Figure 7H), whose relative abundance is increased in Abcb4 −/− mice and PSC patients and linked to increased intestinal permeability in systemic lupus erythematosus [27].
At the age of 5 and 8 months, Abcb4 −/− mouse developed an increased gut permeability (Figure 8A,B) as demonstrated by a decreased expression of the tight junction genes E‐Cadherin and Claudin, and an upregulation of the pro‐inflammatory genes Il‐6 and Tnf‐α and Gpbar1 in the colonic lamina propria, likely due to immune cell infiltration (Figure 8C). Additionally, we detected reduction in Glp1 and Fgf15 gene expression in the small intestine of Abcb4 −/− mice compared to wild‐type control (Figure 8D). Consistent with the development of altered intestinal permeability, Abcb4 −/− mice developed a systemic inflammation, as demonstrated by enhanced expression of Tnf‐α, Cd11b and Cd4 mRNAs in the spleen (Figure 8E) and mesenteric lymph nodes (mLNs) (Figure 8F) in Abcb4 −/− compared to naïve mice. These changes were reversed by Gpbar1 agonism. To further clarify how colonic inflammation in Abcb4 −/− mice contributes to systemic inflammation, macrophages isolated from the buffy coat of healthy blood donors were exposed to faecal homogenates prepared from Abcb4 −/− mice treated or not with BAR501 (Figure 8G). Gene expression analysis revealed that faecal homogenate from Abcb4 −/− mice exerted a potent pro‐inflammatory activity, increasing IL‐6 and Il‐1β expression, polarising macrophages towards the M1 phenotype. In contrast, faeces obtained from Abcb4 −/− mice administered BAR501 failed to promote polarisation towards the M1 phenotype while increasing the expression of IL‐10 (Figure 8G).
FIGURE 8.
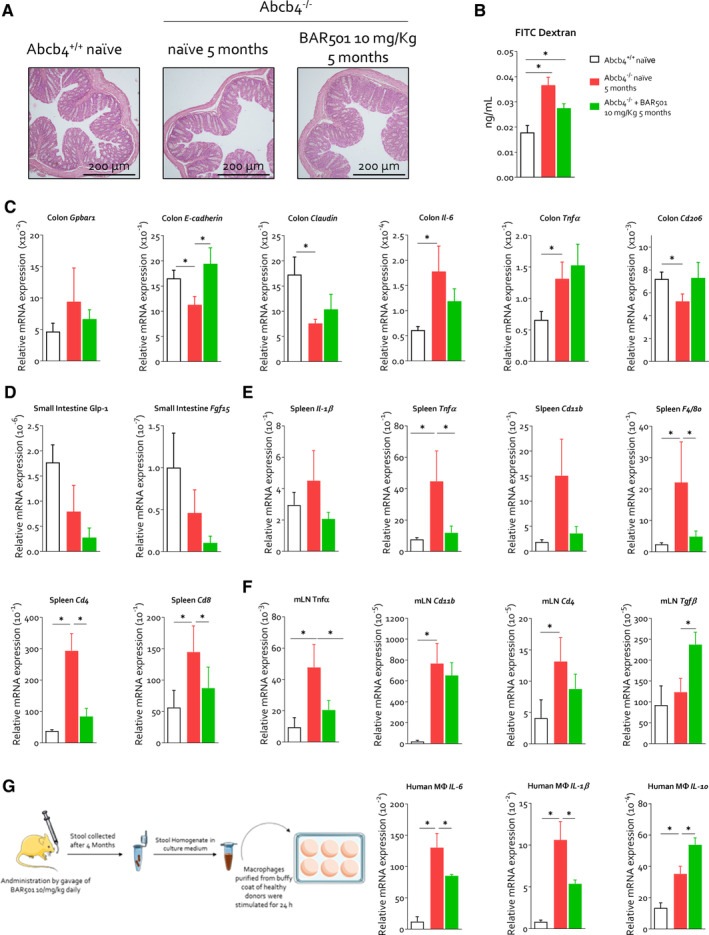
BAR501 ameliorates intestinal permeability and systemic inflammation in Abcb4 −/− mice. Two‐month‐old Abcb4 −/− mice were administered 10 mg/kg of BAR501 or left untreated and monitored until the age of 5 months. Abcb4 +/+ mice were used as control. At the end of experiment, gut, colonic faeces, spleen and mLN were collected. Panel (A) shows H&E staining of colonic tissue section. Panel (B) illustrates that gut permeability was measured through FITC dextran assay as described in the Materials and Methods section. Panel (C) describes the relative mRNA expression of Gpbar1, E‐cadherin, Claudin, Il‐6, TNF‐α and Cd206 of colon tissue on all experimental groups. In panel (D), the relative mRNA expression of Glp‐1 and Fgf15 in the small intestine is depicted. Panel (E) shows the relative mRNA expression of Il1‐β, Tnfa, Cd11b, Tgfβ, F4/80, Cd4 and Cd8 in spleen. Panel (F) illustrates the relative mRNA expression of Tnfa, Cd11b, Cd4 and Tgfβ in mLN. Each value is normalised to Gapdh. Finally, as illustrated in panel (G), faeces from PSC naïve or administered with 10 mg/kg of BAR501 were homogenised and filtered to remove all microorganisms. The obtained faecal homogenate was used to stimulate macrophages obtained from the healthy donor buffy coat. Relative mRNA expression of Il‐6, Il1‐β, Il‐10 was assessed in macrophages. Each value is normalised to GAPDH. Results are the mean ± SEM of seven mice per group. *p < 0.05. FITC, fluorescein isothiocyanate; mLN, mesenteric lymph nodes.
4. Discussion
Previous studies have suggested that dysregulation of GPBAR1 in cholangiocytes is mechanistically linked to PSC development. Thus, not only GPBAR1 maintains cholangiocytes homeostasis, but its disruption or nonsynonymous mutation leads to increased susceptibility to develop intestinal, biliary and systemic inflammation. Furthermore, UDCA that is currently recommended [28] as first‐line therapy in the treatment of PSC in Europe [29, 30, 31] might function as a GPBAR1 agonist [14]. Relevant to its putative mechanistic role in PBC, it has been shown that UDCA and NorUDCA might positively regulate the expression of GPBAR1 in cholangiocytes isolated from PSC patients [10]. Furthermore, Gpbar1 overexpression in transgenic Abcb4 −/− mice alters the disease progression and protects from cholestasis development [10]. Although these findings suggest that activation of GPBAR1 could be beneficial in PSC and could support the beneficial effects of bile acid–based therapies, it must be recognised that UDCA is a weak GPBAR1 agonist and its beneficial effects in PSC patients are limited.
BAR501 is a steroidal derivative of UDCA that, as shown in the present study (Figure S13), undergoes an extensive liver metabolism when administered in vivo, with the taurine derivative representing its main circulating form. In previous studies we have shown that BAR501 dose‐dependently attenuates inflammation and leukocytes recruitment in animal models of intestinal [13], liver [32, 33] and vascular inflammation [34]. Here, we report that treating Abcb4−/− mice with BAR501 effectively reverses inflammation, immune dysfunction and fibrosis in in vitro human and murine cholangiocytes and in Abcb4 −/− mice, a validated model of PSC, suggesting potentially translational relevance of this agent for the pharmacological treatment of PSC patients. In details, we have shown the following. (1) In human cholangiocytes, GPBAR1 expression is downregulated by LPS. This model of inflammation‐driven senescence of cholangiocytes is thought to reproduce some of the feature of dysfunctional BEC isolated from PSC patients and is deemed useful to obtain mechanistic insights in disease development [12, 35]. (2) Treating LPS‐primed cholangiocytes with BAR501, concentration dependently restores the expression of GPBAR1, mRNA and protein, whereas blunts the generation of cytokines, chemokines and adhesion molecules mechanistically involved in recruiting leukocytes to the biliary interface [12]. (3) Mechanistically, we have demonstrated that BAR501 reverses NFκB phosphorylation induced by LPS [36], indicating that GPBAR1 agonism might directly protect from cholangiocytes senescence, which is central to PSC pathogenesis [12]. (4) Results from co‐culture experiments demonstrated that BAR501 also counteracts the activation of macrophages and stellate cells stimulated with conditioned media obtained from LPS‐activated cholangiocytes.
These in vitro findings translate to the in vivo model, because 3–5 months’ treatment of Abcb4 −/− mice with BAR501 improved biochemical signs of cholestasis along with histopathological features of PSC, including bile duct proliferation, inflammatory cell infiltration and fibrosis. Additionally, treating Abcb4–/– mice with BAR501 resulted in a strong remodelling of bile acid profiles. Thus, although Abcb4–/– mice were characterised by an accumulation of primary bile acids in the liver and plasma, coupled with reduced excretion in faeces, treatment with BAR501 reversed this pattern. After 12 weeks of treatment with BAR501, the 5‐month‐old Abcb4 −/− mice showed improved biochemical signs of cholestasis and reduced plasma levels of primary bile acids along with recovery of secondary bile acids [37]. The resetting of bile acid structure might contribute to the beneficial effects of BAR501 in the model, because secondary bile acids are GPBAR1 agonists and their relative increase enhances GPBAR1 signalling in the intestine and liver [6]. Several mechanisms support the beneficial effects exerted by BAR501 in remodelling the bile acid structure. First, we have shown that BAR501 selectively impacts the liver expression of genes involved in bile acid synthesis. Specifically, although treating Abcb4 −/− mice with BAR501 restored the liver expression of Cyp7a1 and Cyp81 (the expression of both genes was downregulated in response to cholestasis), there was no effect on the expression of Cyp27a1 mRNA, whose gene product is essential for the synthesis of CDCA, which in mice is converted to MCAs by the activity of Cyp2c70 [38]. As CA is the main bile acid ligand of FXR in mice, while TβMCA functions as FXR antagonists [39], this pattern might contribute to the beneficial effects exerted by BAR501 in vivo by increasing FXR signalling. A second explanation pinpoints the effects BAR501 exerts on the intestinal microbiota. Dysbiosis, or the imbalance in the microbial community, has been implicated in the exacerbation of liver inflammation and bile duct injury in PSC patients and rodent models of PSC [25]. In our study, the Abcb4 −/− mice developed a severe dysbiosis, characterised by reduced microbial diversity and altered composition of gut bacteria, as shown by changes in the Shannon and Simpson indices. The key features of the PSC‐like dysbiosis observed in Abcb4–/– mice were an increase in the relative abundance of Firmicutes and a reduction in Bacteroidetes and Proteobacteria [40], with an increase in the relative abundance of Ruminococcaceae, Clostridiaceae, and Lachnospiraceae, which are usually associated with metabolic and inflammatory disorders and PSC development [31, 41]. Although the relative abundance of Lachnospiraceae has been found to either increase or decrease [26] in PSC patients, Mendelian randomization studies have identified a positive correlation between the relative abundance of Ruminococcaceae and the risk of developing PSC [42]. One functional consequence of intestinal dysbiosis observed in Abcb4−/− mice was the development of loss of tight junction integrity, resulting in enhanced gut permeability, bacterial translocation to mLNs and systemic inflammation [43]. Treatment with BAR501 mitigated these changes by restoring gut barrier function, reducing microbial translocation and lowering systemic inflammatory responses, a finding that is consistent with previously reported beneficial effects of GPBAR1 agonism in rodent models of colitis [13].
Although the present findings suggest a potential benefit of BAR501 in clinical settings, these conclusions should be taken carefully because of potential GPBAR1‐related adverse events, such as pruritus and gallbladder enlargement. However, although an initial study by Alemi et al. [44] has suggested a potential role for GPBAR1 in mediating itching caused by topical application of bile acids, this finding has not been confirmed by others [45, 46]. Currently, there is a robust evidence that the Mas‐related G protein‐coupled receptor 4 (MRGPR4), rather than GPBAR1, mediates the pruritogenic effects of natural and semi‐synthetic bile acids in cholestasis, and clinical trials are currently ongoing to evaluate the effect of EP457, a MRGPRX4 antagonist, in PSC patients (ClinicalTrials.gov ID NCT05525520) [47]. Furthermore, Yang et al. have recently shown that an essential structural requirement for MRGPRX4 activation by bile acids is the presence of a 3‐hydroxyl (3‐OH) group in the A ring, which, however, is not present in BAR501 [48]. Furthermore, GPBAR1 agonists are currently under development for their benefit in metabolic syndrome [49].
Despite our having shown a beneficial effect of GPBAR1 agonism by BAR501 in Abcb4 −/−, a previous study by Baghdasaryan et al. [50] has reported that selective GPBAR1 (TGR5) agonism lacks efficacy in this model. The two studies, however, differ substantially and are not comparable. First INT‐777, the GPBAR1 ligand used in the Baghdasaryan et al.'s paper [50], is a CDCA derivative, similar to OCA, whereas BAR501 is a UDCA derivative, resulting in substantially different PK and PD. Furthermore, the Abcb4 −/− mice used in the previous paper were on an FVB/N background, whereas mice used in the present paper were on a C57BL6 background. The two strains have specific characteristics in terms of disease development and duration. Finally, the treatment length was significantly longer in the present study (12 weeks vs. 4 weeks).
In conclusion, in this study, we have provided evidence supporting the therapeutic potential of a selective GPBAR1 agonist in PSC. BAR501 reduces bile duct inflammation and liver fibrosis but also restores bile acid homeostasis and modulates the gut–liver axes, offering a multifaceted approach to managing this challenging disease. The present results ground a study of BAR501 in PSC patients.
Author Contributions
Stefano Fiorucci conceived the idea. Stefano Fiorucci, Cristina Di Giorgio and Ginevra Urbani designed the study and provided the conceptual framework for the study. Cristina Di Giorgio, Ginevra Urbani, Silvia Marchianò, Martina Bordoni, Rachele Bellini, Carmen Massa and Ginevra Lachi performed the experiments, and Cristina Di Giorgio, Silvia Marchianò and Michele Biagioli analysed the data. Luigi Cari performed in silico analyses. Elva Morretta, Maria Chiara Monti and Angela Zampella performed bile acid analysis. Jesus M. Banales provided primary human cholangiocytes and Ainhoa Lapitz gene expression analysis on an internal PSC cohort. Piotr Milkiewicz and Malgorzata Milkiewicz performed single – cell analysis. Stefano Fiorucci provided resources. Cristina Di Giorgio and Stefano Fiorucci wrote the manuscript. All authors commented on and approved the final version of the manuscript.
Ethics Statement
Ethics approval for the use of human liver samples was obtained from Donostia University Hospital in San Sebastián (Spain) (permit no KB‐0012/129/13). Experimental protocols involving animals were reviewed and approved by the Animal Care and Use Committee of the University of Perugia, the Italian Ministry of Health and the Istituto Superiore di Sanità (Italy). All animal experiments were conducted in accordance with European guidelines for the care and use of laboratory animals (Directive 2010/63/EU, permission n. 727/2023–PR).
Consent
The authors have nothing to report.
Conflicts of Interest
The authors declare the following competing financial interest(s): Stefano Fiorucci and Angela Zampella have received research grants from BAR Pharmaceuticals SRL (Reggio Emilia, Italy). The remaining authors declare that the research was conducted in the absence of any commercial or financial relationships that could be construed as a potential conflict of interest.
Supporting information
Data S1.
Data S2.
Data S3.
Acknowledgements
Open access publishing facilitated by Universita degli Studi di Perugia, as part of the Wiley ‐ CRUI‐CARE agreement.
Handling Editor: Alessio Aghemo
Funding: This work was partially supported by grants from the Italian Ministry of University and Research (MUR): PRIN‐2022 no. 20223K7L88 and PRIN‐2022‐PNRR no. 20227JB3W to SF and MB, and by Spanish Carlos III Health Institute (ISCIII) (FIS PI24/00148, PI21/00922 and Miguel Servet CPII19/00008) co‐funded by the European Union, and PSC Partners and PSC Supports to JMB.
Contributor Information
Cristina Di Giorgio, Email: cristi.digiorgio@gmail.com.
Stefano Fiorucci, Email: stefano.fiorucci@unipg.it.
Data Availability Statement
The transcriptomic and metagenomic data are publicly available in Mendeley Data, doi: 10.17632/xf635572vb.1. RNA‐seq data that support the findings of this study were obtained from the GSE159676 series (https://www.ncbi.nlm.nih.gov/geo/query/acc.cgi?acc=GSE159676) that includes gene expression profiles by Affymetrix Human Gene 1.0 ST array.
References
- 1. Bowlus C. L., Arrivé L., Bergquist A., et al., “AASLD Practice Guidance on Primary Sclerosing Cholangitis and Cholangiocarcinoma,” Hepatology 77 (2023): 659–702. [DOI] [PubMed] [Google Scholar]
- 2. Jiang X. and Karlsen T. H., “Genetics of Primary Sclerosing Cholangitis and Pathophysiological Implications,” Nature Reviews. Gastroenterology & Hepatology 14 (2017): 279–295. [DOI] [PubMed] [Google Scholar]
- 3. Ji S.‐G., Juran B. D., Mucha S., et al., “Genome‐Wide Association Study of Primary Sclerosing Cholangitis Identifies New Risk Loci and Quantifies the Genetic Relationship With Inflammatory Bowel Disease,” Nature Genetics 49 (2017): 269–273. [DOI] [PMC free article] [PubMed] [Google Scholar]
- 4. Assis D. N. and Bowlus C. L., “Recent Advances in the Management of Primary Sclerosing Cholangitis,” Clinical Gastroenterology and Hepatology 21 (2023): 2065–2075. [DOI] [PubMed] [Google Scholar]
- 5. Pollheimer M. J. and Fickert P., “Animal Models in Primary Biliary Cirrhosis and Primary Sclerosing Cholangitis,” Clinical Reviews in Allergy and Immunology 48 (2015): 207–217. [DOI] [PubMed] [Google Scholar]
- 6. Fiorucci S., Marchianò S., Urbani G., et al., “Immunology of Bile Acids Regulated Receptors,” Progress in Lipid Research 95 (2024): 101291. [DOI] [PubMed] [Google Scholar]
- 7. Maruyama T., Miyamoto Y., Nakamura T. T. T., et al., “Identification of Membrane‐Type Receptor for Bile Acids (M‐BAR),” Biochemical and Biophysical Research Communications 298 (2002): 714–719. [DOI] [PubMed] [Google Scholar]
- 8. Keitel V., Cupisti K., Ullmer C., Knoefel W. T., Kubitz R., and Häussinger D., “The Membrane‐Bound Bile Acid Receptor TGR5 Is Localized in the Epithelium of Human Gallbladders,” Hepatology 50 (2009): 861–870. [DOI] [PubMed] [Google Scholar]
- 9. Reich M., Deutschmann K., Sommerfeld A., et al., “TGR5 Is Essential for Bile Acid‐Dependent Cholangiocyte Proliferation In Vivo and In Vitro,” Gut 65 (2016): 487–501. [DOI] [PubMed] [Google Scholar]
- 10. Reich M., Spomer L., Klindt C., et al., “Downregulation of TGR5 (GPBAR1) in Biliary Epithelial Cells Contributes to the Pathogenesis of Sclerosing Cholangitis,” Journal of Hepatology 75 (2021): 634–646. [DOI] [PubMed] [Google Scholar]
- 11. Cipriani S., Mencarelli A., Chini M. G., et al., “The Bile Acid Receptor GPBAR‐1 (TGR5) Modulates Integrity of Intestinal Barrier and Immune Response to Experimental Colitis,” PLoS One 6 (2011): e25637. [DOI] [PMC free article] [PubMed] [Google Scholar]
- 12. Banales J. M., Huebert R. C., Karlsen T., Strazzabosco M., LaRusso N. F., and Gores G. J., “Cholangiocyte Pathobiology,” Nature Reviews. Gastroenterology & Hepatology 16 (2019): 269–281. [DOI] [PMC free article] [PubMed] [Google Scholar]
- 13. Biagioli M., Carino A., Cipriani S., et al., “The Bile Acid Receptor GPBAR1 Regulates the M1/M2 Phenotype of Intestinal Macrophages and Activation of GPBAR1 Rescues Mice From Murine Colitis,” Journal of Immunology 199 (2017): 718–733. [DOI] [PubMed] [Google Scholar]
- 14. Carino A., Biagioli M., Marchianò S., et al., “Ursodeoxycholic Acid Is a GPBAR1 Agonist and Resets Liver/Intestinal FXR Signaling in a Model of Diet‐Induced Dysbiosis and NASH,” Biochimica et Biophysica Acta – Molecular and Cell Biology of Lipids 1864 (2019): 1422–1437. [DOI] [PubMed] [Google Scholar]
- 15. Mueller M., Thorell A., Claudel T., et al., “Ursodeoxycholic Acid Exerts Farnesoid X Receptor‐Antagonistic Effects on Bile Acid and Lipid Metabolism in Morbid Obesity,” Journal of Hepatology 62 (2015): 1398–1404. [DOI] [PMC free article] [PubMed] [Google Scholar]
- 16. Festa C., Renga B., D'Amore C., et al., “Exploitation of Cholane Scaffold for the Discovery of Potent and Selective Farnesoid X Receptor (FXR) and G‐Protein Coupled Bile Acid Receptor 1 (GP‐BAR1) Ligands,” Journal of Medicinal Chemistry 57 (2014): 8477–8495. [DOI] [PubMed] [Google Scholar]
- 17. D'Amore C., Di Leva F. S. S., Sepe V., et al., “Design, Synthesis, and Biological Evaluation of Potent Dual Agonists of Nuclear and Membrane Bile Acid Receptors,” Journal of Medicinal Chemistry 57 (2014): 937–954. [DOI] [PubMed] [Google Scholar]
- 18. Klindt C., Reich M., Hellwig B., et al., “The G Protein‐Coupled Bile Acid Receptor TGR5 (Gpbar1) Modulates Endothelin‐1 Signaling in Liver,” Cells 8 (2019): 8. [DOI] [PMC free article] [PubMed] [Google Scholar]
- 19. Tsuchida T. and Friedman S. L., “Mechanisms of Hepatic Stellate Cell Activation,” Nature Reviews. Gastroenterology & Hepatology 14 (2017): 397–411. [DOI] [PubMed] [Google Scholar]
- 20. Keitel V., Ullmer C., and Häussinger D., “The Membrane‐Bound Bile Acid Receptor TGR5 (Gpbar‐1) is Localized in the Primary Cilium of Cholangiocytes,” Biological Chemistry 391 (2010): 785–789. [DOI] [PubMed] [Google Scholar]
- 21. Kaser A., Martínez‐Naves E., and Blumberg R. S., “Endoplasmic Reticulum Stress: Implications for Inflammatory Bowel Disease Pathogenesis,” Current Opinion in Gastroenterology 26 (2010): 318–326. [DOI] [PMC free article] [PubMed] [Google Scholar]
- 22. Hegarty S. V., O'Keeffe G. W., and Sullivan A. M., “Neurotrophic Factors: From Neurodevelopmental Regulators to Novel Therapies for Parkinson's Disease,” Neural Regeneration Research 9 (2014): 1708–1711. [DOI] [PMC free article] [PubMed] [Google Scholar]
- 23. Subbalakshmi A. R., Sahoo S., Manjunatha P., et al., “The ELF3 Transcription Factor Is Associated With an Epithelial Phenotype and Represses Epithelial‐Mesenchymal Transition,” Journal of Biological Engineering 17 (2023): 17. [DOI] [PMC free article] [PubMed] [Google Scholar]
- 24. Trivedi P. J., Hirschfield G. M., Adams D. H., and Vierling J. M., “Immunopathogenesis of Primary Biliary Cholangitis, Primary Sclerosing Cholangitis and Autoimmune Hepatitis: Themes and Concepts,” Gastroenterology 166 (2024): 995–1019. [DOI] [PubMed] [Google Scholar]
- 25. Özdirik B. and Schnabl B., “Microbial Players in Primary Sclerosing Cholangitis: Current Evidence and Concepts,” Cellular and Molecular Gastroenterology and Hepatology 17 (2024): 423–438. [DOI] [PMC free article] [PubMed] [Google Scholar]
- 26. Quraishi M. N., Acharjee A., Beggs A. D., et al., “A Pilot Integrative Analysis of Colonic Gene Expression, Gut Microbiota, and Immune Infiltration in Primary Sclerosing Cholangitis‐Inflammatory Bowel Disease: Association of Disease With Bile Acid Pathways,” Journal of Crohn's & Colitis 14 (2020): 935–947. [DOI] [PMC free article] [PubMed] [Google Scholar]
- 27. Lapidot Y., Amir A., Ben‐Simon S., et al., “Alterations of the Salivary and Fecal Microbiome in Patients With Primary Sclerosing Cholangitis,” Hepatology International 15 (2021): 191–201. [DOI] [PubMed] [Google Scholar]
- 28. Prokopič M. and Beuers U., “Management of Primary Sclerosing Cholangitis and Its Complications: An Algorithmic Approach,” Hepatology International 15 (2021): 6–20. [DOI] [PMC free article] [PubMed] [Google Scholar]
- 29. Black D. D., Mack C., Kerkar N., et al., “A Prospective Trial of Withdrawal and Reinstitution of Ursodeoxycholic Acid in Pediatric Primary Sclerosing Cholangitis,” Hepatology Communications 3 (2019): 1482–1495. [DOI] [PMC free article] [PubMed] [Google Scholar]
- 30. Halilbasic E., Steinacher D., and Trauner M., “Nor‐Ursodeoxycholic Acid as a Novel Therapeutic Approach for Cholestatic and Metabolic Liver Diseases,” Digestive Diseases 35 (2017): 288–292. [DOI] [PubMed] [Google Scholar]
- 31. Fickert P., Hirschfield G. M., Denk G., et al., “norUrsodeoxycholic Acid Improves Cholestasis in Primary Sclerosing Cholangitis,” Journal of Hepatology 67 (2017): 549–558. [DOI] [PubMed] [Google Scholar]
- 32. Biagioli M., Carino A., Fiorucci C., et al., “The Bile Acid Receptor GPBAR1 Modulates CCL2/CCR2 Signaling at the Liver Sinusoidal/Macrophage Interface and Reverses Acetaminophen‐Induced Liver Toxicity,” Journal of Immunology 204 (2020): 2535–2551. [DOI] [PubMed] [Google Scholar]
- 33. Biagioli M., Carino A., Fiorucci C., et al., “GPBAR1 Functions as Gatekeeper for Liver NKT Cells and Provides Counterregulatory Signals in Mouse Models of Immune‐Mediated Hepatitis,” Cellular and Molecular Gastroenterology and Hepatology 8 (2019): 447–473. [DOI] [PMC free article] [PubMed] [Google Scholar]
- 34. Marchianò S., Biagioli M., Bordoni M., et al., “Defective Bile Acid Signaling Promotes Vascular Dysfunction, Supporting a Role for G‐Protein Bile Acid Receptor 1/Farnesoid X Receptor Agonism and Statins in the Treatment of Nonalcoholic Fatty Liver Disease,” Journal of the American Heart Association 12 (2023): e031241. [DOI] [PMC free article] [PubMed] [Google Scholar]
- 35. Chen X.‐M., O'Hara S. P., Nelson J. B., et al., “Multiple TLRs Are Expressed in Human Cholangiocytes and Mediate Host Epithelial Defense Responses to Cryptosporidium parvum via Activation of NF‐kappaB,” Journal of Immunology 175 (2005): 7447–7456. [DOI] [PubMed] [Google Scholar]
- 36. Chen W. D., Yu D., Forman B. M., Huang W., and Wang Y. D., “Deficiency of G‐Protein‐Coupled Bile Acid Receptor Gpbar1 (TGR5) Enhances Chemically Induced Liver Carcinogenesis,” Hepatology 57 (2013): 656–666. [DOI] [PMC free article] [PubMed] [Google Scholar] [Retracted]
- 37. Mohanty I., Allaband C., Mannochio‐Russo H., et al., “The Changing Metabolic Landscape of Bile Acids ‐ Keys to Metabolism and Immune Regulation,” Nature Reviews. Gastroenterology & Hepatology 21 (2024): 493–516, 10.1038/s41575-024-00914-3. [DOI] [PubMed] [Google Scholar]
- 38. Guo G. L. and Chiang J. Y. L., “Is CYP2C70 the Key to New Mouse Models to Understand Bile Acids in Humans?,” Journal of Lipid Research 61 (2020): 269–271. [DOI] [PMC free article] [PubMed] [Google Scholar]
- 39. Gonzalez F. J., Jiang C., and Patterson A. D., “An Intestinal Microbiota‐Farnesoid X Receptor Axis Modulates Metabolic Disease,” Gastroenterology 151 (2016): 845–859. [DOI] [PMC free article] [PubMed] [Google Scholar]
- 40. Kummen M., Holm K., Anmarkrud J. A., et al., “The Gut Microbial Profile in Patients With Primary Sclerosing Cholangitis Is Distinct From Patients With Ulcerative Colitis Without Biliary Disease and Healthy Controls,” Gut 66 (2017): 611–619. [DOI] [PubMed] [Google Scholar]
- 41. Ma H.‐D., Zhao Z.‐B., Ma W.‐T., et al., “Gut microbiota translocation promotes autoimmune cholangitis,” Journal of Autoimmunity 95 (2018): 47–57. [DOI] [PMC free article] [PubMed] [Google Scholar]
- 42. Yang J., Ma G., Wang K., et al., “Causal Associations Between Gut Microbiota and Cholestatic Liver Diseases: A Mendelian Randomization Study,” Frontiers in Medicine 11 (2024): 1342119. [DOI] [PMC free article] [PubMed] [Google Scholar]
- 43. Dean G., Hanauer S., and Levitsky J., “The Role of the Intestine in the Pathogenesis of Primary Sclerosing Cholangitis: Evidence and Therapeutic Implications,” Hepatology 72 (2020): 1127–1138. [DOI] [PubMed] [Google Scholar]
- 44. Alemi F., Kwon E., Poole D. P., et al., “The TGR5 Receptor Mediates Bile Acid‐Induced Itch and Analgesia,” Journal of Clinical Investigation 123 (2013): 1513–1530. [DOI] [PMC free article] [PubMed] [Google Scholar]
- 45. Meixiong J., Vasavda C., Snyder S. H., and Dong X., “MRGPRX4 Is a G Protein‐Coupled Receptor Activated by Bile Acids That May Contribute to Cholestatic Pruritus,” Proceedings of the National Academy of Sciences of the United States of America 116 (2019): 10525–10530. [DOI] [PMC free article] [PubMed] [Google Scholar]
- 46. Yu H., Zhao T., Liu S., et al., “MRGPRX4 Is a Bile Acid Receptor for Human Cholestatic Itch,” eLife 8 (2019): 8. [DOI] [PMC free article] [PubMed] [Google Scholar]
- 47. Fiorucci S., Urbani G., Di Giorgio C., Biagioli M., and Distrutti E., “Bile Acids‐Based Therapies for Primary Sclerosing Cholangitis: Current Landscape and Future Developments,” Cells 13 (2024): 13. [DOI] [PMC free article] [PubMed] [Google Scholar]
- 48. Yang J., Zhao T., Fan J., et al., “Structure‐Guided Discovery of Bile Acid Derivatives for Treating Liver Diseases Without Causing Itch,” Cell 187 (2024): 7164–7182.e18, 10.1016/j.cell.2024.10.001. [DOI] [PubMed] [Google Scholar]
- 49. Hodge R. J., Lin J., Vasist Johnson L. S., Gould E. P., Bowers G. D., and Nunez D. J., “Safety, Pharmacokinetics, and Pharmacodynamic Effects of a Selective TGR5 Agonist, SB‐756050, in Type 2 Diabetes,” Clinical Pharmacology in Drug Development 2 (2013): 213–222. [DOI] [PubMed] [Google Scholar]
- 50. Baghdasaryan A., Claudel T., Gumhold J., et al., “Dual Farnesoid X Receptor/TGR5 Agonist INT‐767 Reduces Liver Injury in the Mdr2−/− (Abcb4−/−) Mouse Cholangiopathy Model by Promoting Biliary HCO−₃ Output,” Hepatology 54 (2011): 1303–1312. [DOI] [PMC free article] [PubMed] [Google Scholar]
Associated Data
This section collects any data citations, data availability statements, or supplementary materials included in this article.
Supplementary Materials
Data S1.
Data S2.
Data S3.
Data Availability Statement
The transcriptomic and metagenomic data are publicly available in Mendeley Data, doi: 10.17632/xf635572vb.1. RNA‐seq data that support the findings of this study were obtained from the GSE159676 series (https://www.ncbi.nlm.nih.gov/geo/query/acc.cgi?acc=GSE159676) that includes gene expression profiles by Affymetrix Human Gene 1.0 ST array.