

Abstract
Objectives: Work-related musculoskeletal disorders (WMSDs) are among the most common occupational diseases, affecting various sectors such as agriculture, small-scale industries, handicrafts, construction, and banking. These disorders, caused by overexertion and repetitive motion, lead to work absenteeism, productivity loss, and economic impacts. The aim of the study was to determine the magnitude of musculoskeletal disorders among different occupational workers in India.
Methods: We identified studies reporting the prevalence of WMSDs using the Nordic Musculoskeletal Questionnaire in different databases between 2005 and 2023 through searches on SCOPUS, PubMed Central, and Google Scholar. The required information was then extracted. A random effects model was used to pool estimates of prevalence with 95% CIs. Publication bias was assessed by applying funnel plots.
Results: The 12-month prevalence of WMSDs was reported across several occupational groups, and the meta or the pooled prevalence was estimated as 0.76 (95% CI, 0.70 to 0.82) along with substantial variability in the prevalence estimates between different industries and studies. The meta-prevalence for low back pain was estimated as 0.60 (95% CI, 0.54 to 0.66). The meta-prevalence for neck pain was estimated as 0.40 (95% CI, 0.34 to 0.47) whereas for shoulder pain it was estimated as 0.36 (95% CI, 0.30 to 0.42), respectively. The risk of bias was statistically nonsignificant, and overall publication bias was low as per visual inspections from funnel plots.
Conclusions: WMSDs are prevalent across various Indian industries in significant proportions, particularly in agriculture, health care, and mining, leading to significant productivity loss and economic impact. The variation in prevalence highlights the need for sector-specific interventions. Addressing WMSDs requires comprehensive ergonomic and policy measures. Effective strategies are essential to mitigate these disorders’ widespread impact.
Keywords: WMSDs, low back pain, shoulder pain, neck pain, funnel plot, forest plot
Key points
What is already known on this topic: Work-related musculoskeletal disorders (WMSDs) are a significant concern for India's workforce, directly impacting productivity and economic output. Previous research has shown that occupational risks in Southeast Asia contribute to a substantial disease burden, with 2.04 million disability-adjusted life years attributed to these risks. Over 90% of Indian workers are in the informal economy, lacking adequate workplace health protections, including insurance. Prior studies on WMSDs in India have been fragmented, occupation-specific, and reported varying prevalence rates across sectors, such as agriculture (76% to 99%), manufacturing (47% to 92%), and health care (51% to 100%). However, there has been a lack of national-level meta-estimates, limiting informed decision-making for worker welfare.
What this study adds: This study provides a comprehensive epidemiological overview of WMSDs across various occupational groups in India, a region underrepresented in global assessments. By conducting a systematic review and meta-analysis, the research offers robust and generalizable prevalence estimates across different occupations. The study identifies the sectors with the highest prevalence of WMSDs and outlines the primary ergonomic and risk factors contributing to these disorders. These data fill a critical gap in occupational health literature, offering valuable insights into the burden of WMSDs in India.
How this study might affect research, practice, or policy: The findings highlight the need for targeted ergonomic interventions and preventive strategies in high-risk sectors like health care and agriculture. These insights can guide policymakers and occupational health practitioners in developing tailored health programs, potentially reducing WMSD incidence and improving workforce productivity. Implementing these measures could reduce the incidence of WMSDs, lower the economic burden associated with these disorders, and improve overall workforce well-being.
1. Introduction
Musculoskeletal disorders (MSDs) have been characterized as injuries affecting muscles, nerves, tendons, joints, cartilage, or spinal disks, and work-related musculoskeletal disorders (WMSDs) are conditions where the work environment and the execution of tasks play a substantial role in the development of these conditions. MSDs are often overlooked by researchers due to their infrequent fatality, yet they have seen a rising global burden with total cases surging by 83.9% from 1990 to 2019 (Global Burden of Disease Study 2019).1 In 2019, MSDs accounted for 150 million disability-adjusted life years (DALYs).2 Low back pain (LBP) was the most significant contributor, affecting 568 (95% CI, 505-640) million people and causing 64 (95% CI, 45-85) million years lived with disability (YLDs) globally.3,4 Liu et al4 in 2022 identified occupational risks as the leading contributors to the incidence of MSDs, including LBP and neck pain (NP). In Southeast Asia, occupational risks had one of the highest contributions to DALYs, amounting to 2.04 million (95% CI, 1.39-2.77 million).
India, with over 60% of its population engaged in agriculture and contributing about 17% to the country’s gross domestic product, faces a significant prevalence of WMSDs among farmers due to the labor-intensive nature of agricultural work.5,6 The lifetime prevalence of MSDs among farmers is reported at 90.6%, with a 1-year prevalence of 76.9%,7 primarily affecting the hands, forearms, lower back, and hips.8-15 The textile sector, including handloom and handicrafts, is the second-largest employer after agriculture, with WMSDs in the neck, shoulder, lower back, and knee being prevalent among artisans.16 Health care workers also face high susceptibility to WMSDs due to prolonged static positions and awkward postures, leading to back, neck, shoulder, and knee issues17-24 In the banking and finance sectors, as well as information technology, poorly designed workstations and prolonged computer use contribute to significant musculoskeletal health concerns, with a prevalence of WMSDs as high as 90% among bank workers and 40.4% reporting LBP.25,26 The construction industry also employs a large workforce, with WMSDs accounting for 77% of all newly reported occupational illnesses.27,28
Previous systematic reviews and meta-analyses (SRMAs) on WMSDs have primarily focused on individual occupational groups. SRMAs have revealed that dentists in Iran exhibit a high prevalence of WMSDs, particularly in the neck and shoulders.29 Similarly, blue-collar workers in Europe’s secondary industries, especially in the food industry, face significant risks.30 Psychosocial risk factors, such as high demands and low job control, are strongly associated with WMSDs among hospital nurses and nursing aides.31 Surgeons and interventionalists also show a high prevalence of WMSDs, particularly in the neck, back, and upper extremities.32 However, there is a clear lack of epidemiological overview and pooled evidence of WMSDs across various occupational groups. This study aimed to systematically investigate the prevalence and risk factors of WMSDs across various occupational groups in India. The specific objectives were to determine the pooled prevalence of WMSDs in different occupational sectors and identify the primary risk factors contributing to WMSDs in these sectors. By offering a thorough overview of these aspects, the study expected to underscore the need for targeted interventions. The findings will inform policy and practice, contributing to improved occupational health outcomes and a reduced economic burden associated with WMSDs.
2. Methods
2.1. Search strategy
We conducted this systematic review in accordance with the guidelines of the Preferred Reporting Items for Systematic Reviews and Meta-Analyses (PRISMA)33 and the Meta-analysis of Observational Studies in Epidemiology (MOOSE).34 The protocol for this review was registered prospectively in PROSPERO (CRD42020206433). We searched electronic databases including Scopus, PubMed/MEDLINE, and Google Scholar.
The search strategy for identifying relevant research articles involved a comprehensive query designed to capture a broad range of studies on WMSDs and their prevalence among workers in India. The search terms included various forms and synonyms of musculoskeletal disorders, such as “musculoskeletal pain,” “low back pain,” “neck pain,” “shoulder pain,” and related conditions. These terms were combined with the geographic keyword “India” to focus on studies conducted within this region. Additionally, the search was refined to include articles that specifically address the prevalence of these conditions, using terms like “prevalence” and “prevalence study.” Finally, to ensure the focus was on occupational health, the search included terms like “worker,” “office worker,” “industrial worker,” “professional,” and “personnel.” The review period considered was from January 2005 to December 2023. For the database search queries refer to the Supplementary material.
2.2. Study selection and eligibility criteria
We included observational studies conducted on Indian workers who reported musculoskeletal disorders, with outcomes assessed using Nordic questionnaires. We excluded studies reporting musculoskeletal discomfort not related to work.
The database search results were exported and saved into the Rayyan platform (http://rayyan.qcri.org). Two independent and blinded reviewers (S.M. and J.V.) removed duplicates and nonrelevant papers based on abstracts and titles. Full-text secondary screening was also conducted in duplicate (S.M. and J.V.) to assess eligibility. A third reviewer (A.D. or M.G.K.) acted as an arbiter for any discrepancies to ensure an unbiased selection of articles for full-text review.
We excluded the studies that involved children below the age of 18, studies reporting musculoskeletal discomfort not related to occupational hazards, and studies that did not report the prevalence of LBP, neck pain, shoulder pain, or overall effect (Figure 1).
Figure 1.

PRISMA (Preferred Reporting Items for Systematic Reviews and Meta-Analyses) diagram for study selection.
2.3. Quality assessment: risk-of-bias assessment
The quality of the included studies (Table S1) was evaluated using the Newcastle-Ottawa scale (NOS) adapted for cross-sectional studies. The criteria for assessment included sample representativeness, with 1 star awarded if the sample was appropriate for the study title; sample size, with 1 star awarded if statistical justification was provided; response rate, with 1 star awarded if the number of respondents was reported; outcome assessment, with 1 star awarded if the assessment technique was clearly detailed; and statistical testing, with 1 star awarded if valid statistical tests were employed to address the study question. Quality appraisal was performed by a single reviewer (G.A.), and any points of uncertainty were resolved through discussion and consensus with a second reviewer (S.M.). Studies scoring 3 stars or more were considered to be of high quality.
Further, we conducted publication bias assessment to address impact on validity and generalization of conclusions using funnel-plots (Figure S1), specifically the Egger test, to assess publication bias. The Egger test statistically evaluated the funnel plot for asymmetry.35,36 A P value <.05 in the Egger test indicated potential publication bias. The opted delineated approach ensured a rigorous and systematic approach for identifying, assessing, and synthesizing relevant studies on WMSDs among different occupational workers in India.
2.4. Data extraction
We extracted data from each included study in a standardized Excel sheet. The following information was extracted: author’s name, location of the study, year of publication, occupation of subjects, sample size, number of male and female subjects (if provided), percentage prevalence of LBP, neck pain, and shoulder pain, and overall prevalence.
2.5. Data analysis
We applied a random-effects model for analyzing the prevalence of WMSDs across different occupational studies, underscored by the significant heterogeneity observed in the data. The pooled prevalence estimates and their 95% CIs were calculated using the DerSimonian and Laird method.37 Between-study heterogeneity was assessed using the  based Cochran Q test and the tau-squared estimate, with an I value of 97% indicating substantial variability in prevalence estimates that a fixed-effects model could not address.38 The random-effects model accounted for both within-study and between-study variances, providing more accurate and generalizable estimates. We further generated forest plots, visually depicting the distribution and variance of prevalence estimates across studies. Publication bias was assessed by a funnel plot, and its asymmetry was tested using the Egger linear regression method. All statistical analyses were conducted using R 4.4.0 with the metafor package.39,40
3. Results
The analysis of WMSDs across different occupational groups using the Nordic Musculoskeletal Questionnaire (NMQ) revealed significant variability in 12-month pooled prevalence. A total of 64 unique studies (Table 1) were included in reporting various musculoskeletal disorders. The industry-specific variations among pooled prevalence are discussed in detail below.
Table 1.
Characteristics of Included studies.
| Author | Location | Female, % | Occupation | Overall, % | Low back pain, % | Neck pain, % | Shoulder pain, % | Sample size | Method |
|---|---|---|---|---|---|---|---|---|---|
| Das et al (2012)41 | West Bengal | 100 | Agriculture | 0.00 | 49.17 | 32.50 | 37.50 | 120 | MNMQ |
| Das et al (2013)42 | West Bengal | — | Agriculture | 0.00 | 98.82 | 56.47 | 61.18 | 85 | MNMQ |
| Das and Gangopadhyay (2015)43 | West Bengal | — | Agriculture | 90.00 | 100.00 | 71.43 | 75.71 | 70 | MNMQ |
| Das (2015)44 | West Bengal | 50 | Agriculture | 99.09 | 93.64 | 0.00 | 60.91 | 220 | MNMQ |
| Das and Gangopadhyay (2015)43 | West Bengal | 0 | Agriculture | 0.00 | 100.00 | 0.00 | 0.00 | 70 | MNMQ |
| Gupta (2013)45 | Uttar Pradesh | — | Agriculture | 0.00 | 60.00 | 10.33 | 22.00 | 300 | NMQ |
| Latha (2005)46 | Tamilnadu | — | Agriculture | 84.33 | 30.67 | 16.67 | 17.67 | 300 | MNMQ |
| Jain et al (2018)47 | Rajasthan | 17.14 | Agriculture | 76.09 | 72.46 | 41.30 | 57.25 | 138 | MNMQ |
| Jain et al (2018)48 | Rajasthan | 18.57 | Agriculture | 77.86 | 73.57 | 0.00 | 55.71 | 140 | MNMQ |
| Murthy and Nikhade (2017)49 | Gujarat | 38 | Agriculture | 0.00 | 70.00 | 14.00 | 14.00 | 100 | NMQ |
| Pal and Dhara (2017)50 | West Bengal | 100 | Agriculture | 0.00 | 92.17 | 73.49 | 81.33 | 166 | NMQ |
| Panat (2017)102 | Maharastra | — | Agriculture | 0.00 | 87.95 | 0.00 | 0.00 | 224 | NMQ |
| Vasanth et al (2015)51 | Tamilnadu | — | Agriculture | 83.59 | 52.82 | 53.33 | 55.38 | 195 | NMQ |
| Vasave and Anap (2016)52 | Gujarat | 43 | Agriculture | 0.00 | 50.00 | 19.00 | 13.00 | 100 | NMQ |
| Das et al (2020)53 | Rajasthan | 0 | Artisan | 0.00 | 78.61 | 60.82 | 54.90 | 388 | MNMQ |
| Gangopadhyay et al (2007)54 | West Bengal | — | Artisan | 0.00 | 0.00 | 0.00 | 20.00 | 100 | NMNMQ |
| Ghosh et al (2010)55 | Karnataka | — | Artisan | 0.00 | 0.00 | 80.00 | 20.00 | 120 | MNMQ |
| Kumar (2017)56 | West Bengal | 0 | Artisan | 0.00 | 79.87 | 60.73 | 58.75 | 303 | MNMQ |
| Salve (2015)57 | Maharastra | — | Artisan | 0.00 | 66.59 | 33.41 | 6.90 | 464 | NMQ |
| Alex et al (2013)58 | Tamilnadu | — | Construction | 50.97 | 59.03 | 11.29 | 23.55 | 310 | MNMQ |
| Chatterjee and Sahu (2018)59 | West Bengal | 0 | Construction | 0.00 | 69.51 | 47.56 | 36.59 | 164 | MNMQ |
| Das (2014)60 | West Bengal | 0 | Construction | 0.00 | 98.18 | 64.55 | 75.91 | 220 | MNMQ |
| Das et al 201342 | West Bengal | 100 | Construction | 0.00 | 70.27 | 0.00 | 0.00 | 148 | MNMQ |
| Reddy and Yasobant (2015)61 | Tamilnadu | 8.40 | Construction | 33.77 | 20.78 | 27.92 | 11.69 | 308 | MNMQ |
| Shettar and Sherkhane (2017)62 | Karnataka | 100 | Construction | 0.00 | 56.67 | 45.00 | 41.67 | 60 | NMQ |
| Iti et al (2016)63 | Karnataka | 68.84 | Education | 0.00 | 38.44 | 12.81 | 32.16 | 398 | NMQ |
| Ponmathi et al (2017)64 | Tamilnadu | — | Education | 22.65 | 28.82 | 30.59 | 30.29 | 340 | NMQ |
| Vaghela and Parekh (2017)65 | Gujarat | 72.21 | Education | 51.91 | 50.00 | 27.07 | 33.12 | 314 | MNMQ |
| Batham and Yasobant (2016)66 | Madhya Pradesh | 62.90 | Health care | 92.47 | 83.87 | 88.17 | 34.41 | 93 | NMQ |
| Bedi et al (2015)67 | Northern India | 36.70 | Health care | 68.33 | 41.67 | 56.67 | 28.33 | 60 | NMQ |
| Chandralekha et al (2022)68 | Karnataka | — | Health care | 0.00 | 55.07 | 43.48 | 43.00 | 207 | NMQ |
| Anap et al (2013)69 | Maharastra | — | Health care | 89.15 | 56.60 | 33.02 | 34.43 | 212 | NMQ |
| Joseph et al (2016)70 | Karnataka | 93 | Health care | 68.67 | 53.01 | 48.19 | 49.40 | 83 | NMQ |
| Kumar et al (2013)71 | India | 61.94 | Health care | 82.97 | 59.75 | 62.85 | 57.59 | 646 | NMQ |
| Mahajan et al (2023)72 | Rajasthan | 35 | Health care | 72.90 | 49.68 | 36.45 | 0.00 | 310 | NMQ |
| Majumdar (2014)73 | India | — | Health care | 83.41 | 66.99 | 47.37 | 33.81 | 627 | NMQ |
| Maulik et al (2014)74 | India | 36.92 | Health care | 0.00 | 0.00 | 73.33 | 28.33 | 60 | NMQ |
| Raithatha and Mishra (2016)75 | Gujarat | 100 | Health care | 89.19 | 69.59 | 14.86 | 20.95 | 296 | NMQ |
| Rambabu and Suneetha (2014)76 | Andhra Pradesh | — | Health care | 0.00 | 50.00 | 40.00 | 15.00 | 300 | NMQ |
| Thacker et al (2023)77 | Gujarat | 64.70 | Health care | 75.83 | 39.17 | 45.00 | 30.00 | 120 | NMQ |
| Yasobant and Rajkumar (2014)78 | Chennai | 58.60 | Health care | 50.71 | 45.71 | 28.57 | 23.57 | 140 | NMQ |
| Moom et al (2015)79 | Punjab | 40 | IT | 83.33 | 33.33 | 31.67 | 15.00 | 60 | NMQ |
| Saleem et al (2015)80 | Tamilnadu | 42.40 | IT | 69.00 | 15.80 | 20.40 | 12.20 | 500 | NMQ |
| Subbarayalu (2013)81 | Tamilnadu | 41.05 | IT | 57.78 | 40.00 | 13.33 | 5.56 | 180 | NMQ |
| Sulaiman et al (2015)82 | Tamilnadu | 40.20 | IT | 0.00 | 0.00 | 49.00 | 40.00 | 300 | NMQ |
| Nafeesa et al (2018)83 | Tamilnadu | 32.30 | IT | 0.00 | 20.65 | 53.55 | 36.77 | 155 | NMQ |
(Continued)
Table 1.
Continued
| Author | Location | Female, % | Occupation | Overall, % | Low back pain, % | Neck pain, % | Shoulder pain, % | Sample size | Method |
|---|---|---|---|---|---|---|---|---|---|
| Vinod and Arun (2015)84 | Tamilnadu | 37.75 | IT | 74.00 | 30.75 | 17.75 | 13.00 | 400 | NMQ |
| Vissamsetti et al (2022)85 | Andhra Pradesh | 32.20 | IT | 74.00 | 56.75 | 43.00 | 28.25 | 400 | NMQ |
| Ali et al (2023)86 | Uttar Pradesh | 0 | Loaders | 58.94 | 47.91 | 40.30 | 0.00 | 263 | NMQ |
| Khan and Singh (2018)87 | Odisha | — | Loaders | 64.71 | 43.14 | 47.06 | 50.98 | 51 | MNMQ |
| Chowdhury et al (2012)88 | Maharastra | — | Loaders | 0.00 | 34.00 | 16.00 | 20.00 | 100 | MNMQ |
| Salve et al (2017)89 | Maharastra | — | Loaders | 0.00 | 38.89 | 27.78 | 26.11 | 360 | MNMQ |
| Sarkar et al (2016)90 | West Bengal | — | Loaders | 95.00 | 79.00 | 70.00 | 59.00 | 100 | NMQ |
| Ahmad and Alvi (2017)91 | Rajasthan | 2.80 | Mining | 81.19 | 61.47 | 0.00 | 10.09 | 218 | NMQ |
| Bandyopadhyay et al (2012)92 | West Bengal | — | Mining | 0.00 | 58.18 | 18.18 | 14.55 | 55 | MNMQ |
| Krishna et al (2015)93 | Eastern India | — | Mining | 78.95 | 64.47 | 53.95 | 55.26 | 76 | NMQ |
| Reddy and Yasobant (2015)61 | Tamilnadu | 40.56 | Solid waste collectors | 0.00 | 84.55 | 0.00 | 0.00 | 220 | NMQ |
| Singh and Chokhandre (2015)94 | Maharastra | 42.50 | Solid waste collectors | 0.00 | 54.00 | 0.00 | 0.00 | 200 | NMQ |
| Angeline and Bobby (2017)95 | Tamilnadu | 100 | Textiles | 201.87 | 29.91 | 49.53 | 50.47 | 107 | NMQ |
| Durlov et al (2014)96 | West Bengal | 80 | Textiles | 0.00 | 68.00 | 0.00 | 0.00 | 175 | MNMQ |
| Kolgiri (2018)97 | Maharastra | 100 | Textiles | 47.00 | 67.00 | 42.00 | 64.00 | 100 | NMQ |
| Naz et al (2015)103 | Uttarakhand | 56.25 | Textiles | 76.56 | 59.38 | 70.31 | 70.31 | 64 | NMQ |
| Pal and Dhara (2017)99 | West Bengal | 100 | Textiles | 0.00 | 87.82 | 50.00 | 48.72 | 156 | MNMQ |
| Shankar et al (2017)100 | Tamilnadu | — | Textiles | 91.95 | 75.06 | 0.00 | 66.23 | 385 | MNMQ |
Abbreviations: IIT, Information Technology; MNMQ, Modified Nordic Musculoskeletal Questionnaire; NMNMQ, Nordic Musculoskeletal Questionnaire (Modified Version) ; NMQ, Musculoskeletal Questionnaire.
3.1. Overall prevalence of WMSDs in various occupations
The 12-month prevalence of WMSDs was reported in 35 studies across the occupational groups; the meta or the pooled prevalence was estimated as 0.76 (95% CI, 0.70 to 0.82; I2 = 97%). Figure 2 underscores the significant burden of WMSDs across various industries, with health care, agriculture, and mining showing particularly high prevalence, which is summarized further in subgroup analysis occupation-wise.
Figure 2.

Forest plot for overall work-related musculoskeletal disorders (WMSDs) sector-specific results.
The prevalence of WMSDs varies across different industries, with agriculture showing a high pooled prevalence of 0.87 (95% CI, 0.78 to 0.93) and the health care sector following closely with a prevalence of 0.80 (95% CI, 0.72 to 0.85). The IT industry has a moderate prevalence of 0.71 (95% CI, 0.60 to 0.79), whereas the textile industry shows a prevalence of 0.74 (95% CI, 0.50 to 0.89). Weight loaders and miners report high prevalence rates of 0.78 (95% CI, 0.42 to 0.94) and 0.81 (95% CI, 0.76 to 0.85), respectively. In contrast, the construction and education sectors have lower pooled prevalence rates, with construction at 0.42 (95% CI, 0.27 to 0.59) and education at 0.36 (95% CI, 0.14 to 0.67). These findings highlight significant variations in WMSD prevalence across sectors, with agriculture, health care, and mining exhibiting particularly high rates.
3.2. Overall prevalence of LBP in various occupations
The 12-month prevalence of work-related LBP was reported in 59 studies across various occupational groups. The meta-analysis or pooled prevalence was estimated as 0.60 (95% CI, 0.54 to 0.66; I2 = 97%) as shown in Figure 3. Industry-specific results are discussed further.
Figure 3.
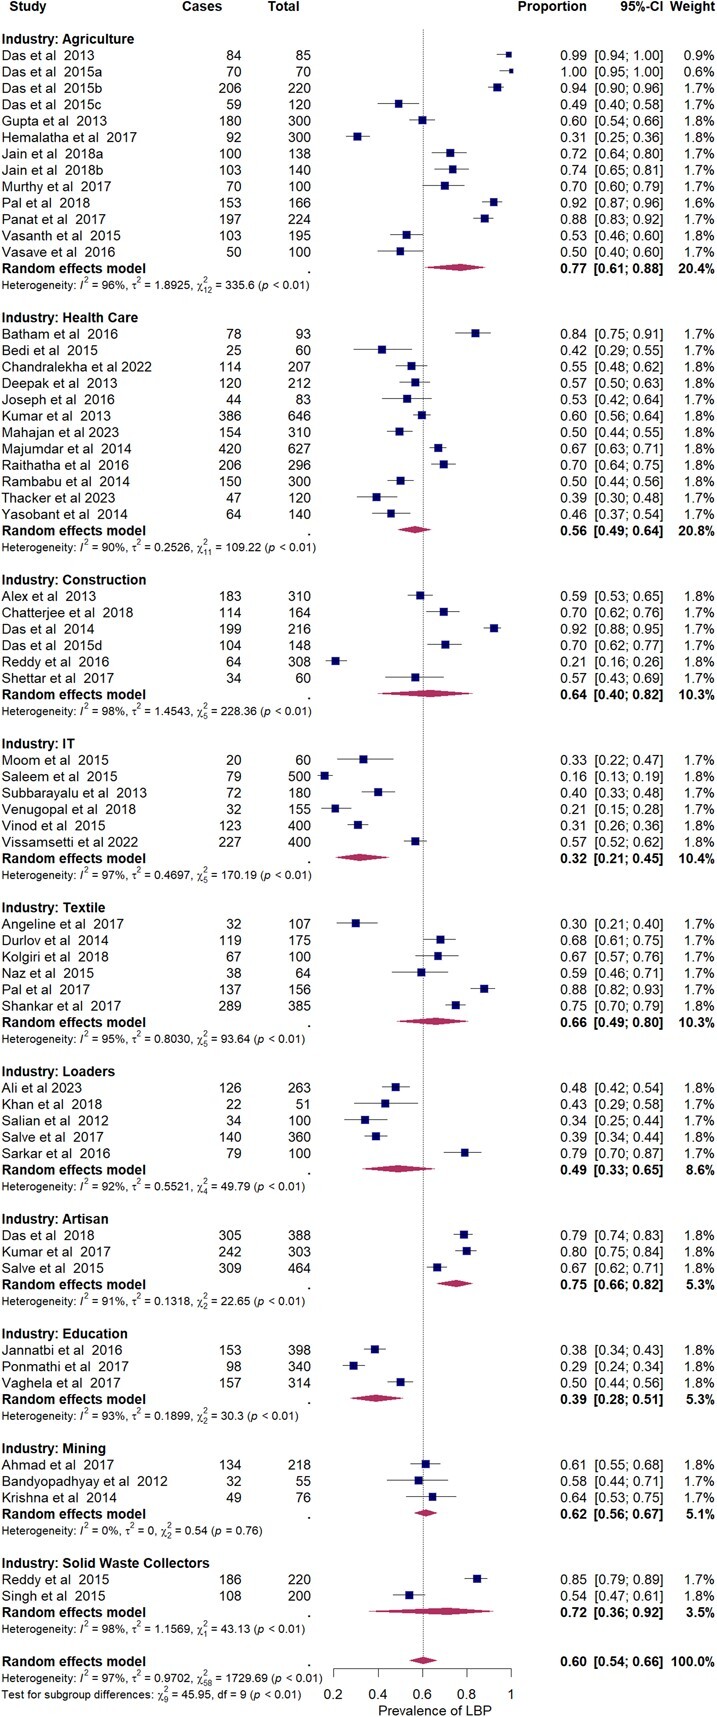
Forest plot for low back pain sector-specific results.
The prevalence of LBP varies significantly across different industries. In the agriculture industry, prevalence ranges from 0.31 to 1.00, with a pooled prevalence of 0.77 (95% CI, 0.61 to 0.88), indicating a high prevalence in this sector. The health care industry shows a prevalence range of 0.39 to 0.84, with a pooled prevalence of 0.56 (95% CI, 0.49 to 0.64), reflecting moderate to high prevalence. In the construction industry, prevalence varies from 0.21 to 0.92, with a pooled prevalence of 0.64 (95% CI, 0.40 to 0.82), indicating high prevalence. The IT industry shows a lower prevalence range of 0.16 to 0.57, with a pooled prevalence of 0.32 (95% CI, 0.21 to 0.45). The textile industry exhibits a range from 0.30 to 0.88, with a pooled prevalence of 0.66 (95% CI, 0.49 to 0.80), suggesting moderate to high prevalence. The loaders industry refers to workers involved in tasks such as loading and unloading goods, which shows a prevalence of musculoskeletal disorders ranging from 0.34 to 0.79, with a pooled prevalence of 0.49 (95% CI, 0.33 to 0.65), indicating a moderate prevalence among this occupational group. The artisan industry has a high prevalence, ranging from 0.67 to 0.80, with a pooled prevalence of 0.75 (95% CI, 0.66 to 0.82). The education sector shows a lower prevalence range of 0.29 to 0.50, with a pooled prevalence of 0.39 (95% CI, 0.28 to 0.51). The mining industry shows a prevalence from 0.58 to 0.64, with a pooled prevalence of 0.62 (95% CI, 0.56 to 0.67), and the solid waste collectors industry shows a range from 0.54 to 0.85, with a pooled prevalence of 0.72 (95% CI, 0.36 to 0.92), both indicating high prevalence of LBP.
3.3. Overall prevalence of neck pain in various occupations
The 12-month prevalence of work-related neck pain was reported in 56 studies across various occupational groups. The meta-analysis or pooled prevalence was estimated as 0.40 (95% CI, 0.34 to 0.47; I2 = 97%) as shown in Figure 4. Industry-wise results are discussed further.
Figure 4.

Forest plot for neck pain sector-specific results.
The prevalence of neck pain varies across different industries. In the health care industry, it ranges from 0.18 to 0.88, with a summary proportion of 0.47 (95% CI, 0.36 to 0.57), indicating a moderate to high prevalence. The agriculture industry shows a prevalence range of 0.10 to 0.73, with a summary proportion of 0.36 (95% CI, 0.21 to 0.53), suggesting moderate prevalence. The IT industry reports lower neck pain prevalence ranging from 0.13 to 0.54, with a summary proportion of 0.31 (95% CI, 0.20 to 0.44). In the construction industry, prevalence varies widely from 0.11 to 0.89, with a summary proportion of 0.44 (95% CI, 0.17 to 0.75), indicating moderate to high prevalence. The loaders industry shows a prevalence range of 0.16 to 0.70, with a summary proportion of 0.36 (95% CI, 0.21 to 0.53), reflecting moderate prevalence. The textile industry has a prevalence range of 0.35 to 0.70, with a summary proportion of 0.49 (95% CI, 0.38 to 0.60), indicating moderate to high prevalence. The artisan industry shows a higher prevalence, ranging from 0.33 to 0.80, with a summary proportion of 0.59 (95% CI, 0.39 to 0.77). The education sector reports lower neck pain prevalence, ranging from 0.13 to 0.31, with a summary proportion of 0.22 (95% CI, 0.13 to 0.36). Finally, the mining industry shows a prevalence range of 0.18 to 0.54, with a summary proportion of 0.34 (95% CI, 0.09 to 0.73), indicating moderate prevalence.
3.4. Overall prevalence of shoulder pain in workers
The 12-month prevalence of work-related shoulder pain was reported in 56 studies across various occupational groups. The pooled prevalence of shoulder pain across all industries was 0.36 (95% CI, 0.30 to 0.42; I2 = 96%), indicating a substantial burden of shoulder pain in the studied populations (Figure 5). The presence of heterogeneity indicates variability across studies; hence, the detailed results are discussed subsequently.
Figure 5.

Forest plot for shoulder pain sector-specific results.
The prevalence of shoulder pain varies across different industries. In the agriculture industry, it ranges from 0.13 to 0.81, with a pooled prevalence of 0.44 (95% CI, 0.30 to 0.60), indicating moderate prevalence. The health care industry shows a range from 0.21 to 0.73, with a pooled prevalence of 0.38 (95% CI, 0.29 to 0.48), also reflecting moderate prevalence. In the IT industry, prevalence is lower, ranging from 0.04 to 0.40, with a pooled prevalence of 0.19 (95% CI, 0.11 to 0.31). The textile industry shows higher prevalence, ranging from 0.39 to 0.70, with a pooled prevalence of 0.56 (95% CI, 0.46 to 0.66), indicating moderate to high prevalence. The artisan industry has a wide range from 0.07 to 0.55, with a pooled prevalence of 0.28 (95% CI, 0.11 to 0.53), suggesting moderate prevalence. The construction industry also shows a range from 0.12 to 0.75, with a pooled prevalence of 0.30 (95% CI, 0.18 to 0.46), indicating moderate prevalence. In the loaders industry, shoulder pain prevalence ranges from 0.20 to 0.59, with a pooled prevalence of 0.37 (95% CI, 0.21 to 0.58). The education sector shows a narrow range of prevalence from 0.30 to 0.33, with a pooled prevalence of 0.32 (95% CI, 0.29 to 0.35), reflecting relatively low prevalence. Finally, the mining industry has a prevalence range from 0.10 to 0.55, with a pooled prevalence of 0.22 (95% CI, 0.06 to 0.56), indicating moderate prevalence of shoulder pain.
4. Discussion
4.1. Overall WMSDs
The WMSDs in different occupational groups exhibit significant variability, underscoring the diverse risk factors inherent to each sector. The agriculture industry, with a pooled prevalence of 0.87, reflects the intense physical demands placed on workers, such as repetitive bending, heavy lifting, and prolonged awkward postures, as observed in studies by Jain et al (2018) 48 and Das and Gangopadhyay.43 Similarly, the health care sector demonstrates a high burden of WMSDs, with a pooled prevalence of 0.82 due to the physically demanding nature of caregiving roles, including patient handling and long hours, evidenced by studies from Yasobant and Rajkumar78 and Kumar et al.71
In contrast, the IT industry shows a lower pooled prevalence of 0.71, with studies by Subbarayalu81 and Moom et al79 indicating variability likely due to ergonomic factors, prolonged sedentary work, and lack of proper workstation setup. The textile industry, with a pooled prevalence of 0.74, also reveals a considerable MSD burden, driven by repetitive tasks, awkward postures, and long working hours, as highlighted by Kolgiri (2018)97 and Shankar et al.100 Weight loaders, facing heavy lifting and strenuous activities, show a pooled prevalence of 0.78, with significant variability reported by Ali et al86 and Sarkar et al.101
The construction industry, however, presents a lower pooled prevalence of 0.42, suggesting possible underreporting or varied exposure levels, as seen in studies by Chandralekha68, Reddy and Alex.28,58 This sector often involves heavy physical work, but the use of machinery and equipment might mitigate some risks. The education sector, with a pooled prevalence of 0.36, indicates a lower MSD burden, possibly due to less physically demanding tasks, but still has significant prevalence due to factors like prolonged standing and poor ergonomic environments, as reported by Ponmathi et al64 and Vaghela and Parekh.65
Conversely, the mining industry shows a high prevalence of 0.81, highlighting the extreme physical conditions, manual labor, and harsh environmental conditions involved, supported by findings from Krishna et al93 and Ahmad and Alvi.91
4.2. Low back pain
The prevalence of LBP across different occupational groups underscores significant occupational health challenges that vary by industry. In agriculture, the high prevalence (0.77) observed in studies by Latha46 and Das et al41 can be attributed to strenuous physical activities, intense manual labor, and adverse working conditions, which often involve heavy lifting, awkward postures, and repetitive motions. Similarly, health care professionals experience a considerable burden of LBP (0.56), reflecting the physical demands of patient handling, long hours, and prolonged standing, as reported by Thacker et al77 and Das.60
Conversely, the IT sector shows a relatively lower prevalence of LBP (0.32), with studies by Saleem et al80 and Vissamsetti et al85 pointing to issues like prolonged sitting and poor workstation ergonomics. This suggests that even less physically demanding jobs are not immune to WMSDs, emphasizing the need for ergonomic solutions tailored to each industry.
In more physically demanding industries, such as construction and textile, the prevalence of LBP varies widely but remains substantial. The construction industry (0.64) and textile industry (0.66), reported by Kumar56 and Pal and Dhara,50 respectively, face unique risks associated with repetitive tasks, heavy manual labor, and poor ergonomic conditions. Loaders and artisans also show high prevalence rates of LBP (0.49 and 0.75), indicating significant occupational strain. This is supported by findings from Chowdhury Salian et al88 and Salve,57 which highlight the intense physical demands placed on workers involved in manual handling and intricate, often repetitive tasks.
In the education sector, the prevalence of LBP is moderate (0.39), stemming from prolonged standing and inadequate ergonomic support, as noted by Ponmathi et al64 and Vaghela and Parekh.65 The mining industry, with a pooled prevalence of 0.62, shows high risks associated with physically demanding and hazardous conditions, supported by studies from Bandyopadhyay et al92 and Krishna et al.93 The solid waste collector industry also faces a high prevalence of LBP (0.72), with Singh and Chokhandre94 and Reddy and Yasobant61, highlighting the significant physical demands and often inadequate ergonomic conditions faced by these workers.
4.3. Neck pain
The prevalence of work-related neck pain across various occupational groups reveals significant variability, highlighting the distinct ergonomic challenges faced by workers in different industries. In the health care industry, neck pain prevalence ranges from 0.18 (Das53) to 0.88 (Batham and Yasobant66),with a pooled prevalence of 0.47. This wide range underscores the physical demands and postural stresses health care workers endure. Similarly, in the agriculture industry, neck pain prevalence spans from 0.1045 to 0.73,99 with a pooled prevalence of 0.36, reflecting the strenuous and repetitive tasks common in farming largely due to frequent repetitive movements, heavy lifting, sustained awkward postures, and prolonged neck flexion associated with farming tasks such as planting, weeding, and harvesting.45 These physical demands, combined with limited ergonomic support and exposure to whole-body vibrations from machinery, contribute significantly to the musculoskeletal strain experienced by agricultural workers, thus reflecting the sector’s unique ergonomic challenges.
The IT industry shows lower prevalence rates, ranging from 0.1381 to 0.54,83 with a pooled prevalence of 0.31. This suggests that although IT work is less physically demanding, ergonomic issues such as prolonged sitting and poor workstation setups contribute to neck pain. In contrast, the construction industry displays a wider prevalence range, from 0.1158 to 0.89,60 with a pooled prevalence of 0.44, indicating significant physical strain and varying safety standards. In construction, differences in safety regulations and practices often impact the availability and use of ergonomic equipment, lifting aids, and protective gear, which are essential for reducing strain on the neck and upper body.58 Sites with lower safety standards may lack these supports, leading to increased physical strain, awkward postures, and repetitive neck movements, which elevate the risk of neck pain among workers.
Textile workers experience moderate to high neck pain prevalence, ranging from 0.3596 to 0.70,98 with a pooled prevalence of 0.49, reflecting repetitive motions and inadequate ergonomic conditions in factories. Similarly, the artisan industry shows high prevalence rates, from 0.3357 to 0.80,55 with a pooled prevalence of 0.59, due to the intricate and repetitive nature of the work. The education sector has relatively low prevalence rates, ranging from 0.1363 to 0.31,64 with a pooled prevalence of 0.22. This may be attributed to less physically demanding tasks but still highlights ergonomic issues such as prolonged standing and poor posture. In the mining industry, prevalence ranges from 0.1892 to 0.54,93 with a pooled prevalence of 0.34, indicating the physically taxing and hazardous nature of mining work and relatable to factors such as prolonged isometric postures, forceful exertions, and repetitive overhead movements required in confined, low-clearance environments in mines.91,92 Poor ergonomics force miners into awkward postures, heightening neck muscle strain and fatigue, and raising the risk of neck pain.
4.4. Shoulder pain
The prevalence of shoulder pain across various occupational groups underscores the diverse ergonomic challenges and risk factors inherent in different industries. In the agriculture sector, shoulder pain prevalence ranges widely from 0.13 to 0.8152,99 indicating the significant physical demands and repetitive tasks faced by agricultural workers. The health care industry also exhibits considerable variability, with prevalence ranging from 0.21 to 0.73,74,75 reflecting the strenuous activities such as patient lifting and prolonged static postures that are common in this field.
In contrast, the IT industry shows a lower prevalence of shoulder pain, ranging from 0.04 to 0.40,81,82 which highlights the ergonomic issues related to prolonged sitting and computer use. The textile industry, with a prevalence range of 0.39 to 0.70,97,98 suggests that repetitive motions and poor ergonomic conditions contribute significantly to shoulder pain in this sector. Artisans experience moderate shoulder pain prevalence, from 0.07 to 0.55,53,57 which can be attributed to the detailed, repetitive nature of their work. Similarly, the construction industry shows a range from 0.12 to 0.75,61,62 indicating the physically demanding and often hazardous nature of construction work. Construction tasks often involve heavy lifting, overhead work, and handling of heavy tools, which place significant strain on the shoulder muscles and joints.62 Additionally, frequent exposure to unstable surfaces, awkward postures, and prolonged forceful exertions increases the risk of shoulder injuries.
The loaders industry, with a prevalence range from 0.20 to 0.59,88,90 highlights the significant physical strain associated with manual loading tasks. In the education sector, the relatively narrow prevalence range of 0.30 to 0.3364,65 suggests ergonomic issues related to prolonged standing and poor posture among educators. Educators frequently spend hours standing in classrooms while teaching, often writing on blackboards, which can lead to muscular fatigue and strain in the shoulders. Poor posture, combined with repetitive blackboard writing, further intensifies this strain. Finally, the mining industry exhibits a wide range of shoulder pain prevalence from 0.10 to 0.55,91,93 reflecting the harsh working conditions and significant physical demands of mining.
5. Conclusion
This comprehensive analysis of WMSDs across various occupational groups reveals substantial variability in prevalence rates, reflecting the unique ergonomic challenges in each sector. Agriculture demonstrates the highest overall WMSD prevalence at 0.87, driven by physically demanding tasks and inadequate ergonomic support. Artisan workers exhibit significant rates of LBP (0.75) and neck pain (0.59) due to repetitive, intricate tasks and prolonged postures, whereas textile industry workers face a high prevalence of shoulder pain (0.56), often due to static positions and poor workstation design. Additionally, high prevalence rates are observed in health care and mining industries, where physical demands and harsh working conditions contribute heavily to WMSDs. In contrast, the IT industry, with moderate overall prevalence, highlights issues stemming from sedentary work and inadequate workstation setups. These findings underscore the need for tailored ergonomic interventions and preventive measures across sectors to mitigate the burden of WMSDs, ultimately enhancing worker health, productivity, and reducing the prevalence of these debilitating conditions.
Supplementary Material
Acknowledgments
We would like to express the deepest gratitude for encouragement and guidance from the Director of the ICMR-National Institute of Occupational Health, Ahmedabad.
Contributor Information
SukhDev Mishra, Department of Biostatistics, Division of Health Sciences, ICMR-National Institute of Occupational Health, Ahmedabad, Gujarat, India.
G Avinash, Department of Biostatistics, Division of Health Sciences, ICMR-National Institute of Occupational Health, Ahmedabad, Gujarat, India.
Madan G Kundu, Department of Biostatistics, Daiichi-Sankyo Inc, Basking Ridge, New Jersey, United States.
Jyotsna Verma, Department of Biostatistics, Division of Health Sciences, ICMR-National Institute of Occupational Health, Ahmedabad, Gujarat, India.
Ankit Sheth, Division of Health Sciences, ICMR-National Institute of Occupational Health, Ahmedabad, Gujarat, India.
Abhijit Dutta, Research Officer (H), International Cooperation Section, Ministry of Ayush, New Delhi, India.
Author contributions
S.M. conceived and designed the study, performed data extraction, and developed the statistical codes and manuscript. G.A. prepared and edited the manuscript, conducted the statistical analysis, and created the figures. M.G.K. contributed to the statistical analysis and programming and provided critical reviews of the manuscript. J.V. performed the database and literature searches and extracted the relevant data. A.S. contributed to the writing and editing of the manuscript and provided critical reviews. A.D. conducted the literature search, data review, and extracted relevant data. All authors read and approved the final version of the manuscript.
Supplementary material
Supplementary material is available at Journal of Occupational Health online.
Funding
We received no funding to carry out this work.
Conflicts of interest
All conflicts of interest or disclosures for myself and my co-authors have been reviewed, and there are no conflicts to declare.
Data availability
The data for this study were extracted from published scientific literature. All data are presented in both the article and its Supplementary material.
References
- 1. Global Burden of Disease Study . Data resources 2019. IHME. https://ghdx.healthdata.org/gbd-2019.
- 2. Institute For Health M. Evaluation . Musculoskeletal disorders—level 2 cause. 2020. https://www.healthdata.org/research-analysis/diseases-injuries-risks/factsheets/2021-musculoskeletal-disorders-level-2-disease
- 3. Cieza A, Causey K, Kamenov K, Hanson SW, Chatterji S, Vos T. Global estimates of the need for rehabilitation based on the Global Burden of Disease Study 2019: a systematic analysis for the Global Burden of Disease Study 2019. Lancet. 2021;396(10267):2006-2017. 10.1016/s0140-6736(20)32340-0 [DOI] [PMC free article] [PubMed] [Google Scholar]
- 4. Liu S, Wang B, Fan S, Wang Y, Zhan Y, Ye D. Global burden of musculoskeletal disorders and attributable factors in 204 countries and territories: a secondary analysis of the Global Burden of Disease 2019 study. BMJ Open. 2022;12(6):e062183. 10.1136/bmjopen-2022-062183 [DOI] [PMC free article] [PubMed] [Google Scholar]
- 5. Fathallah FA. Musculoskeletal disorders in labor-intensive agriculture. Appl Ergon. 2010;41(6):738-743. 10.1016/j.apergo.2010.03.003 [DOI] [PubMed] [Google Scholar]
- 6. Rosecrance J, Rodgers G, Merlino L. Low back pain and musculoskeletal symptoms among Kansas farmers. Am J Ind Med. 2006;49(7):547-556. 10.1002/ajim.20324 [DOI] [PubMed] [Google Scholar]
- 7. Osborne A, Blake C, Fullen BM, et al. Prevalence of musculoskeletal disorders among farmers: a systematic review. Am J Ind Med. 2012;55(2):143-158. 10.1002/ajim.21033 [DOI] [PubMed] [Google Scholar]
- 8. Holmberg S, Stiernström E-L, Thelin A, Svärdsudd K. Musculoskeletal symptoms among farmers and non-farmers: a population-based study. Int J Occup Environ Health. 2002;8(4):339-345. 10.1179/oeh.2002.8.4.339 [DOI] [PubMed] [Google Scholar]
- 9. Kolstrup C. Work-related musculoskeletal discomfort of dairy farmers and employed workers. J Occup Med Toxicol. 2012;7(1):23. 10.1186/1745-6673-7-23 [DOI] [PMC free article] [PubMed] [Google Scholar]
- 10. Skovron ML, Szpalski M, Nordin M, Melot C, Cukier D. Sociocultural factors and back pain: a population-based study in Belgian adults. Spine. 1994;19(suppl):129-137. 10.1097/00007632-199401001-00002 [DOI] [PubMed] [Google Scholar]
- 11. Arcury TA, Quandt SA. Pesticides at work and at home: exposure of migrant farmworkers. Lancet. 2003;362(9400):2021. 10.1016/S0140-6736(03)15027-1 [DOI] [PubMed] [Google Scholar]
- 12. Earle-Richardson G, Jenkins P, Fulmer S, Mason C, Burdick P, May J. An ergonomic intervention to reduce back strain among apple harvest workers in New York state. Appl Ergon. 2005;36(3):327-334. 10.1016/j.apergo.2004.12.003 [DOI] [PubMed] [Google Scholar]
- 13. Kirkhorn SR, Schenker MB. Current health effects of agricultural work: respiratory disease, cancer, reproductive effects, musculoskeletal injuries, and pesticide-related illnesses. J Agric Saf Health. 2002;8(2):199-214. 10.13031/2013.8432 [DOI] [PubMed] [Google Scholar]
- 14. Rautiainen RH, Reynolds SJ. Mortality and morbidity in agriculture in the United States. J Agric Saf Health. 2002;8(3):259-276. 10.13031/2013.9054 [DOI] [PubMed] [Google Scholar]
- 15. Woolf AD, Vos T, March L. How to measure the impact of musculoskeletal conditions. Best Pract Res Clin Rheumatol. 2010;24(6):723-732. 10.1016/j.berh.2010.11.002 [DOI] [PubMed] [Google Scholar]
- 16. Srivastava P, Khan MS. Musculoskeletal disorders among the bone carving artisans of Uttar Pradesh: a study on cognitive space and accessory design for MSD and health-related problems. MaterToday Proc. 2022;64:1465-1474. 10.1016/j.matpr.2022.04.781 [DOI] [Google Scholar]
- 17. Smith DR, Wei N, Ishitake T, Wang R-S. Musculoskeletal disorders among Chinese medical students. Kurume Med J. 2005;52(4):139-146. 10.2739/kurumemedj.52.139 [DOI] [PubMed] [Google Scholar]
- 18. Smith DR, Leggat PA. Musculoskeletal disorders among rural Australian nursing students. Australian J Rural Health. 2004;12(6):241-245. 10.1111/j.1440-1854.2004.00620.x [DOI] [PubMed] [Google Scholar]
- 19. Thornton LJ, Barr AE, Stuart-Buttle C, et al. Perceived musculoskeletal symptoms among dental students in the clinic work environment. Ergonomics. 2008;51(4):573-586. 10.1080/00140130701728277 [DOI] [PubMed] [Google Scholar]
- 20. Alexopoulos EC, Stathi I-C, Charizani F. Prevalence of musculoskeletal disorders in dentists. BMC Musculoskelet Disord. 2004;5(1):16. 10.1186/1471-2474-5-16 [DOI] [PMC free article] [PubMed] [Google Scholar]
- 21. Picavet HSJ, Schouten JSAG. Musculoskeletal pain in the Netherlands: prevalences, consequences and risk groups, the DMC3-study. Pain. 2003;102(1):167-178. 10.1016/s0304-3959(02)00372-x [DOI] [PubMed] [Google Scholar]
- 22. Tinubu BM, Mbada CE, Oyeyemi AL, Fabunmi AA. Work-related musculoskeletal disorders among nurses in Ibadan, south-West Nigeria: a cross-sectional survey. BMC Musculoskelet Disord. 2010;11(1):12. 10.1186/1471-2474-11-12 [DOI] [PMC free article] [PubMed] [Google Scholar]
- 23. Mishra SD, Sarkar K. Work-related musculoskeletal disorders and associated risk factors among urban metropolitan hairdressers in India. J Occup Health. 2021;63(1):e12200-e12209. 10.1002/1348-9585.12200 [DOI] [PMC free article] [PubMed] [Google Scholar]
- 24. Bodin J, Ha C, Sérazin C, et al. Effects of individual and work-related factors on incidence of shoulder pain in a large working population. J Occup Health. 2012;54(4):278-288. 10.1539/joh.11-0262-OA [DOI] [PubMed] [Google Scholar]
- 25. Etana G, Ayele M, Abdissa D, Gerbi A. Prevalence of work related musculoskeletal disorders and associated factors among bank staff in Jimma City, Southwest Ethiopia, 2019: an institution-based cross-sectional study. J Pain Res. 2021;14:2071-2082. 10.2147/JPR.S299680 [DOI] [PMC free article] [PubMed] [Google Scholar]
- 26. Adhikari SAK, Humagain M, Sanjel S. Musculoskeletal disorders among the oral health professionals of a district in Nepal. J Chitwan Med Coll. 2023;13(2):8-13. 10.54530/jcmc.1322 [DOI] [Google Scholar]
- 27. Punnett L, Wegman DH. Work-related musculoskeletal disorders: the epidemiologic evidence and the debate. J Electromyogr Kinesiol. 2004;14(1):13-23. 10.1016/j.jelekin.2003.09.015 [DOI] [PubMed] [Google Scholar]
- 28. Reddy GM, Nisha B, Prabhushankar T, Vishwambhar V. Musculoskeletal morbidity among construction workers: a cross-sectional community-based study. Indian J Occup Environ Med. 2016;20(3):144-149. 10.4103/0019-5278.203134 [DOI] [PMC free article] [PubMed] [Google Scholar]
- 29. ZakerJafari HR, YektaKooshali MH. Work-related musculoskeletal disorders in Iranian dentists: a systematic review and meta-analysis. Saf Health Work. 2018;9(1):1-9. 10.1016/j.shaw.2017.06.006 [DOI] [PMC free article] [PubMed] [Google Scholar]
- 30. Govaerts R, Tassignon B, Ghillebert J, et al. Prevalence and incidence of work-related musculoskeletal disorders in secondary industries of 21st century Europe: a systematic review and meta-analysis. BMC Musculoskelet Disord. 2021;22(1):751. 10.1186/s12891-021-04615-9 [DOI] [PMC free article] [PubMed] [Google Scholar]
- 31. Bernal D, Campos-Serna J, Tobias A, Vargas-Prada S, Benavides FG, Serra C. Work-related psychosocial risk factors and musculoskeletal disorders in hospital nurses and nursing aides: a systematic review and meta-analysis. Int J Nurs Stud. 2015;52(2):635-648. 10.1016/j.ijnurstu.2014.11.003 [DOI] [PubMed] [Google Scholar]
- 32. Epstein S, Sparer EH, Tran BN, et al. Prevalence of work-related musculoskeletal disorders among surgeons and interventionalists: a systematic review and meta-analysis. JAMA Surg. 2018;153(2) e174947. 10.1001/jamasurg.2017.4947 [DOI] [PMC free article] [PubMed] [Google Scholar]
- 33. Moher D, Tsertsvadze A. Systematic reviews: when is an update an update? Lancet. 2006;367(9514):881-883. 10.1016/S0140-6736(06)68358-X [DOI] [PubMed] [Google Scholar]
- 34. Stroup DF, Berlin JA, Morton SC, et al. Meta-analysis of observational studies in epidemiology. A proposal for reporting. JAMA. 2000;283(15):2008-2012. 10.1001/jama.283.15.2008 [DOI] [PubMed] [Google Scholar]
- 35. Egger M, Smith GD, Schneider M, Minder C. Bias in meta-analysis detected by a simple, graphical test. BMJ. 1997;315(7109):629-634. 10.1136/bmj.315.7109.629 [DOI] [PMC free article] [PubMed] [Google Scholar]
- 36. Rothstein HR. Publication bias. In: D'Agostino RB, Sullivan L, Massaro J eds. Wiley Encyclopedia of Clinical Trials. 1st ed. Wiley; 2007:1-11. [Google Scholar]
- 37. DerSimonian R, Laird N. Meta-analysis in clinical trials. Control Clin Trials. 1986;7(3):177-188. 10.1016/0197-2456(86)90046-2 [DOI] [PubMed] [Google Scholar]
- 38. Higgins JPT, Thompson SG, Deeks JJ, Altman DG. Measuring inconsistency in meta-analyses. BMJ. 2003;327(7414):557-560. 10.1136/bmj.327.7414.557 [DOI] [PMC free article] [PubMed] [Google Scholar]
- 39. R Core Team . R: A Language and Environment for Statistical Computing. R Foundation for Statistical Computing; 2023.
- 40. Viechtbauer W. Conducting meta-analyses in R with the metafor package. J Stat Softw. 2010;36(3):1-48. 10.18637/jss.v036.i03 [DOI] [Google Scholar]
- 41. Das B, Ghosh T, Gangopadhyay S. Assessment of ergonomic and occupational health-related problems among female prawn seed collectors of Sunderbans, West Bengal, India. Int J Occup Saf Ergon. 2012;18(4):531-540. 10.1080/10803548.2012.11076949 [DOI] [PubMed] [Google Scholar]
- 42. Das B, Ghosh T, Gangopadhyay S. Child work in agriculture in West Bengal, India: assessment of musculoskeletal disorders and occupational health problems. J Occup Health. 2013;55(4):244-258. 10.1539/joh.12-0185-oa [DOI] [PubMed] [Google Scholar]
- 43. Das B, Gangopadhyay S. Prevalence of musculoskeletal disorders and physiological stress among adult, male potato cultivators of West Bengal, India. Asia Pac J Public Health. 2015;27(2):NP1669-NP1682. 10.1177/1010539511421808 [DOI] [PubMed] [Google Scholar]
- 44. Das B. Gender differences in prevalence of musculoskeletal disorders among the rice farmers of West Bengal, India. Work. 2015;50(2):229-240. 10.3233/wor-131694 [DOI] [PubMed] [Google Scholar]
- 45. Gupta G. Prevalence of musculoskeletal disorders in farmers of Kanpur-rural, India. J Community Med Health Educ. 2013;3:249. 10.4172/2161-0711.1000249 [DOI] [Google Scholar]
- 46. Latha H. Prevalence of musculoskeletal disorder among agricultural workers in rural area of Tamil Nadu. Int J Community Health Med Res. 2005;3(3):26-31 [Google Scholar]
- 47. Jain R, Meena ML, Dangayach GS, Bhardwaj AK. Association of risk factors with musculoskeletal disorders in manual-working farmers. Arch Environ Occup Health. 2018;73(1):19-28. 10.1080/19338244.2017.1289890 [DOI] [PubMed] [Google Scholar]
- 48. Jain R, Meena ML, Dangayach GS, Bhardwaj AK. Risk factors for musculoskeletal disorders in manual harvesting farmers of Rajasthan. Ind Health. 2018;56(3):241-248. 10.2486/indhealth.2016-0084 [DOI] [PMC free article] [PubMed] [Google Scholar]
- 49. Murthy S, Nikhade N. Prevalence of musculoskeletal disorders in farmers of Ahmednagar District. Int J Innov Res Med Sci. 2017;2(3):635-641 [Google Scholar]
- 50. Pal A, Dhara P. Evaluation of work-related musculoskeletal disorders and postural stress of female “Jari” workers. Indian J Occup Environ Med. 2017;21(3):132-137. 10.4103/ijoem.IJOEM_55_17 [DOI] [PMC free article] [PubMed] [Google Scholar]
- 51. Vasanth D, Ramesh N, Fathima FN, Fernandez R, Jennifer S, Joseph B. Prevalence, pattern, and factors associated with work-related musculoskeletal disorders among pluckers in a tea plantation in Tamil Nadu, India. Indian J Occup Environ Med. 2015;19(3):167-170. 10.4103/0019-5278.173992 [DOI] [PMC free article] [PubMed] [Google Scholar]
- 52. Vasave SY, Anap D. Prevalence of musculoskeletal disorders among sugarcane workers – a cross-sectional study. Indian J Basic Appl Med Res. 2016;5(4):752-758 [Google Scholar]
- 53. Das D, Kumar A, Sharma M. A systematic review of work-related musculoskeletal disorders among handicraft workers. Int J Occup Saf Ergon. 2020;26(1):55-70. 10.1080/10803548.2018.1458487 [DOI] [PubMed] [Google Scholar]
- 54. Gangopadhyay S, Ghosh T, Das T, Ghoshal G, Das BB. Prevalence of upper limb Musculoskeletal disorders among brass metal workers in West Bengal, India. Ind Health. 2007;45(2):365-370. 10.2486/indhealth.45.365 [DOI] [PubMed] [Google Scholar]
- 55. Ghosh T, Das B, Gangopadhyay S. Work-related musculoskeletal disorder: an occupational disorder of the goldsmiths in India. Indian J Community Med. 2010;35(2):321-325. 10.4103/0970-0218.66890 [DOI] [PMC free article] [PubMed] [Google Scholar]
- 56. Kumar DN. Ergonomic evaluation of work related musculoskeletal disorders and postural stress among bell metal workers of West Bengal, India. Int J Pure App Biosci. 2017;5(4):671-682. 10.18782/2320-7051.4046 [DOI] [Google Scholar]
- 57. Salve U. Prevalence of musculoskeletal discomfort among the workers engaged in jewelry manufacturing. Indian J Occup Environ Med. 2015;19(1):44-55. 10.4103/0019-5278.157008 [DOI] [PMC free article] [PubMed] [Google Scholar]
- 58. Alex R, Inbaraj L, Haebar O, et al. Prevalence of musculoskeletal disorders among brick kiln workers in rural southern India. Indian J Occup Environ Med. 2013;17(2):71-75. 10.4103/0019-5278.123170 [DOI] [PMC free article] [PubMed] [Google Scholar]
- 59. Chatterjee A, Sahu S. A physiological exploration on operational stance and occupational musculoskeletal problem manifestations amongst construction labourers of West Bengal, India. J Back Musculoskelet Rehabil. 2018;31(4):775-783. 10.3233/BMR-170935 [DOI] [PubMed] [Google Scholar]
- 60. Das B. Assessment of occupational health problems and physiological stress among the brick field workers of West Bengal, India. Int J Occup Med Environ Health. 2014;27(3):413-425. 10.2478/s13382-014-0262-z [DOI] [PubMed] [Google Scholar]
- 61. Reddy EM, Yasobant S. Musculoskeletal disorders among municipal solid waste workers in India: a cross-sectional risk assessment. J Family Med Prim Care. 2015;4(4):519-524. 10.4103/2249-4863.174270 [DOI] [PMC free article] [PubMed] [Google Scholar]
- 62. Shettar D, Sherkhane MS. Assessment of risk factors for the development of musculoskeletal disorders among working women. Int J Community Med Public Health. 2017;4(3):718. 10.18203/2394-6040.ijcmph20170746 [DOI] [Google Scholar]
- 63. Iti JL, Sunil D, Nigudgi S, Reddy S. Assessment of musculoskeletal disorders by standardized Nordic questionnaire among computer engineering students and teaching staff of Gulbarga city. Int J Community Med Public Health. 2016;3:668-3:674. 10.18203/2394-6040.ijcmph20160630 [DOI] [Google Scholar]
- 64. Ponmathi P, Keeerthiga M, Sivakumar VPR. Prevalence of musculoskeletal disorders and awareness of physiotherapy management for the above among primary school teachers. Int J Pharm Sci Res. 2017;8(6):2648-2653 [Google Scholar]
- 65. Vaghela N, Parekh S. Prevalence of the musculoskeletal disorder among school teachers. Natl J Physiol Pharm Pharmacol. 2018;8(2). 197-201. 10.5455/njppp.2018.8.0830218082017 [DOI] [Google Scholar]
- 66. Batham C, Yasobant S. A risk assessment study on work-related musculoskeletal disorders among dentists in Bhopal, India. Indian J Dent Res. 2016;27(3):236-241. 10.4103/0970-9290.186243 [DOI] [PubMed] [Google Scholar]
- 67. Bedi HS, Moon NJ, Bhatia V, Sidhu GK, Khan N. Evaluation of musculoskeletal disorders in dentists and application of DMAIC technique to improve the ergonomics at dental clinics and meta-analysis of literature. J Clin Diagn Res. 2015;9(6):ZC01-ZC03. 10.7860/JCDR/2015/14041.6126 [DOI] [PMC free article] [PubMed] [Google Scholar]
- 68. Chandralekha K, Joseph M, Joseph B. Work-related musculoskeletal disorders and quality of life among staff nurses in a tertiary care hospital of Bangalore. Indian J Occup Environ Med. 2022;26(3):178-182. 10.4103/ijoem.ijoem_25_22 [DOI] [PMC free article] [PubMed] [Google Scholar]
- 69. Anap D, Iyer C, Rao K. Work related musculoskeletal disorders among hospital nurses in rural Maharashtra, India: a multi centre survey. Int J Res Med Sci. 2013;1(2):101. 10.5455/2320-6012.ijrms20130513 [DOI] [Google Scholar]
- 70. Joseph B, Naveen R, Suguna A, Surekha A. Prevalence, pattern and factors associated with work-related musculoskeletal disorders (WRMD) among housekeeping workers in a private tertiary care hospital in Bangalore. J Health Manag. 2016;18(4):545-554. 10.1177/0972063416666151 [DOI] [Google Scholar]
- 71. Kumar S, Baliga M, Kumar V. Prevalence of work-related musculoskeletal complaints among dentists in India: a national cross-sectional survey. Indian J Dent Res. 2013;24(4):428-438. 10.4103/0970-9290.118387 [DOI] [PubMed] [Google Scholar]
- 72. Mahajan D, Gupta MK, Mantri N, et al. Musculoskeletal disorders among doctors and nursing officers: an occupational hazard of overstrained healthcare delivery system in western Rajasthan, India. BMC Musculoskelet Disord. 2023;24(1):349. 10.1186/s12891-023-06457-z [DOI] [PMC free article] [PubMed] [Google Scholar]
- 73. Majumdar D, Pal M, Majumdar D. Work-related musculoskeletal disorders in Indian nurses: a cross-sectional study. J Nov Physiother. 2014;4(03):1-7. 10.4172/2165-7025.1000207 [DOI] [Google Scholar]
- 74. Maulik S, Iqbal R, De A, Chandra AM. Evaluation of the working posture and prevalence of musculoskeletal symptoms among medical laboratory technicians. J Back Musculoskelet Rehabil. 2014;27(4):453-461. 10.3233/BMR-140466 [DOI] [PubMed] [Google Scholar]
- 75. Raithatha AS, Mishra DG. Musculoskeletal disorders and perceived work demands among female nurses at a tertiary care hospital in India. Int J Chronic Dis. 2016;2016:1-6. 10.1155/2016/5038381 [DOI] [PMC free article] [PubMed] [Google Scholar]
- 76. Rambabu T, Suneetha K. Prevalence of work related musculoskeletal disorders among physicians, surgeons and dentists: a comparative study. Ann Med Health Sci Res. 2014;4(4):578-582. 10.4103/2141-9248.139327 [DOI] [PMC free article] [PubMed] [Google Scholar]
- 77. Thacker H, Yasobant S, Viramgami A, Saha S. Prevalence and determinants of (work-related) musculoskeletal disorders among dentists—a cross sectional evaluative study. Indian J Dent Res. 2023;34(1):24-29. 10.4103/ijdr.ijdr_376_22 [DOI] [PubMed] [Google Scholar]
- 78. Yasobant S, Rajkumar P. Work-related musculoskeletal disorders among health care professionals: a cross-sectional assessment of risk factors in a tertiary hospital, India. Indian J Occup Environ Med. 2014;18(2):75-81. 10.4103/0019-5278.146896 [DOI] [PMC free article] [PubMed] [Google Scholar]
- 79. Moom RK, Sing LP, Moom N. Prevalence of musculoskeletal disorder among computer bank office employees in Punjab (India): a case study. Procedia Manuf. 2015;3:6624-6631. 10.1016/j.promfg.2015.11.002 [DOI] [Google Scholar]
- 80. Saleem M, Priya S, Govindarajan R, et al. A cross sectional study on work related musculoskeletal disorders among software professionals. Int J Commun Med Public Health. 2015;2(4):367-372. 10.18203/2394-6040.ijcmph20150941 [DOI] [Google Scholar]
- 81. Subbarayalu AV. Occupational health problems of call center workers in India: a cross sectional study focusing on gender differences. J Manag Sci Pract. 2013;1(2):63-70 [Google Scholar]
- 82. Sulaiman S, Parasuraman K, Ibrahim AA, Nuhu JM. Musculoskeletal disorders and associated disabilities among bank workers. Int J Res Med Sci. 2015;3(5):1153. 10.5455/2320-6012.ijrms20150523 [DOI] [Google Scholar]
- 83. Nafeesa MAC, Venugopal V, Anbu VP, et al. Perceived work-related psychosocial stress and musculoskeletal disorders complaints among call centre workers in India—a cross sectional study. MOJ Anat Physiol. 2018;5(2):80-85. 10.15406/mojap.2018.05.00168 [DOI] [Google Scholar]
- 84. Vinod S, Arun B. Prevalence of various work related musculoskeletal disorders in software professionals. Indian J Med Health Sci. 2015;2(1):9-13. 10.21088/ijmhs.2347.9981.2115.2 [DOI] [Google Scholar]
- 85. Vissamsetti H, Phani Madhavi KV, Madhavi BD. A cross sectional study among information technology professionals of Vishakhapattanam City to study the prevalence of musculoskeletal work related disorders. Perspect Med Res. 2022;10(3):27-38. 10.47799/pimr.1003.06 [DOI] [Google Scholar]
- 86. Ali AM, Alam MM, Sufyaan M, Ahmad I, Zarrin S. Prevalence of work-related musculoskeletal disorders among professional rickshaw drivers in Aligarh, Uttar Pradesh, India. Work. 2023;76(3):1239-1253. 10.3233/WOR-220621 [DOI] [PubMed] [Google Scholar]
- 87. Khan MR, Singh NK. Prevalence of musculoskeletal disorders among Indian railway sahayaks. Int J Occup Environ Health. 2018;24(1-2):27-37. 10.1080/10773525.2018.1507187 [DOI] [PMC free article] [PubMed] [Google Scholar]
- 88. Chowdhury Salian S, Boricha J, Yardi S. Identification of awkward postures that cause discomfort to liquid petroleum gas workers in Mumbai, India. Indian J Occup Environ Med. 2012;16(1):3-8. 10.4103/0019-5278.99679 [DOI] [PMC free article] [PubMed] [Google Scholar]
- 89. Salve P, Chokhandre P, Bansod D. Assessing musculoskeletal disorders among municipal waste loaders of Mumbai, India. Int J Occup Med Environ Health. 2017;30(6):875-886. 10.13075/ijomeh.1896.01049 [DOI] [PubMed] [Google Scholar]
- 90. Sarkar K, Dev S, Das T, Chakrabarty S, Gangopadhyay S. Examination of postures and frequency of musculoskeletal disorders among manual workers in Calcutta, India. Int J Occup Environ Health. 2016;22(2):151-158. 10.1080/10773525.2016.1189682 [DOI] [PMC free article] [PubMed] [Google Scholar]
- 91. Ahmad A, Alvi R. Musculoskeletal disorders and risk factors of workers in Indian mining industry: a cross-sectional study. Int J Percept Public Health. 2017;1(4):241-248 [Google Scholar]
- 92. Bandyopadhyay A, Dev S, Gangopadhyay S. A study on the prevalence of musculoskeletal disorders among the coalminers of eastern coalfields of India. Int J Occup Saf Health. 2012;2(2):34-37. 10.3126/ijosh.v2i2.6596 [DOI] [Google Scholar]
- 93. Krishna OB, Maiti J, Ray PK, Mandal S. Assessment of risk of musculoskeletal disorders among crane operators in a steel plant: a data mining-based analysis. Hum Factors Ergon Manuf Serv Ind. 2015;25(5):559-572. 10.1002/hfm.20575 [DOI] [Google Scholar]
- 94. Singh S, Chokhandre P. Assessing the impact of waste picking on musculoskeletal disorders among waste pickers in Mumbai, India: a cross-sectional study. BMJ Open. 2015;5(9):e008474. 10.1136/bmjopen-2015-008474 [DOI] [PMC free article] [PubMed] [Google Scholar]
- 95. Angeline GN, Bobby J. Work related musculoskeletal disorders among adolescent girls and young women employees of textile industries in Tamil Nadu, India—a comparative study. Int J Adolesc Med Health. 2017;30(6):20160116. 10.1515/ijamh-2016-0116 [DOI] [PubMed] [Google Scholar]
- 96. Durlov S, Chakrabarty S, Chatterjee A, et al. Prevalence of low back pain among handloom weavers in West Bengal, India. Int J Occup Environ Health. 2014;20(4):333-339. 10.1179/2049396714Y.0000000082 [DOI] [PMC free article] [PubMed] [Google Scholar]
- 97. Kolgiri S. Work related musculoskeletal disorders among power-loom industry women workers from Solapur City, Maharashtra, India. Int J Eng Technol Sci Res. 2018;5(3):1002-1008 [Google Scholar]
- 98. Heena N, Seema K, Pragya O. Prevalence of musculoskeletal disorders among handloom weavers of Uttarakhand: an ergonomic study. J Appl Nat Sci. 2015;7(1):102-105. 10.31018/jans.v7i1.571 [DOI] [Google Scholar]
- 99. Pal A, Dhara P. Work related musculoskeletal disorders and postural stress of the women cultivators engaged in uprooting job of rice cultivation. Indian J Occup Environ Med. 2018;22(3):163-169. 10.4103/ijoem.IJOEM_104_18 [DOI] [PMC free article] [PubMed] [Google Scholar]
- 100. Shankar S, Naveen Kumar R, Mohankumar P, Jayaraman S. Prevalence of work-related musculoskeletal injuries among south Indian hand screen-printing workers. Work (Reading, Mass). 2017;58(2):163-172. 10.3233/WOR-172612 [DOI] [PubMed] [Google Scholar]
- 101. Sarkar B, Kar S, Mohapatra I, Sarkar K. Descriptive epidemiology of occupational injuries among urban construction workers—an observation from eastern India. Int J Occup Saf Health. 2023;13(2):163-171. 10.3126/ijosh.v13i2.48712 [DOI] [Google Scholar]
- 102. Panat AV, Kulkarni DA, Ghooi R. Low back pain and other work-related musculoskeletal disorders and choice of treatment among farmers in a small village of the Maharashtra state in India: A self-reported preliminary study using a simple questionnaire. 2017. [Google Scholar]
- 103. Naz H, Kwatra S, Ojha P. Prevalence of musculoskeletal disorders among handloom weavers of Uttarakhand: an ergonomic study. J. Nat. Appl. Sci. 2015;7(1):102-105. 10.31018/jans.v7i1.571 [DOI] [Google Scholar]
Associated Data
This section collects any data citations, data availability statements, or supplementary materials included in this article.
Supplementary Materials
Data Availability Statement
The data for this study were extracted from published scientific literature. All data are presented in both the article and its Supplementary material.