Abstract
In this paper, fluorescent microarray images and various analysis techniques are described to improve the microarray data acquisition processes. Signal intensities produced by rarely expressed genes are initially correctly detected, but they are often lost in corrections for background, log or ratio. Our analyses indicate that a simple correlation between the mean and median signal intensities may be the best way to eliminate inaccurate microarray signals. Unlike traditional quality control methods, the low intensity signals are retained and inaccurate signals are eliminated in this mean and median correlation. With larger amounts of microarray data being generated, it becomes increasingly more difficult to analyze data on a visual basis. Our method allows for the automatic quantitative determination of accurate and reliable signals, which can then be used for normalization. We found that a mean to median correlation of 85% or higher not only retains more data than current methods, but the retained data is more accurate than traditional thresholds or common spot flagging algorithms. We have also found that by using pin microtapping and microvibrations, we can control spot quality independent from initial PCR volume.
INTRODUCTION
DNA microarray technology has opened the door for large-scale gene expression screening, functional analysis and genomic profiling (1). The flood of biological information produced by these experiments is anticipated to revolutionize genetic analysis (2). Microarray hybridization technology has been extensively tested and the measurement between two samples using fluorescence intensity ratios is particularly robust (3); however, more investigation is still needed to fully mine these data. For example, in microarray expression profiling, there is no magical absolute cut-off threshold for a meaningful fold value interpretation for low signals (4). At the same time, some report fold increases between 1.4 and 2 as being significant (5–7). With such diverging interpretations, better quality control of microarray signals is required for analysis of genes particularly at low expression levels.
The accuracy and precision (where accuracy is defined as the probable error of a measurement and precision is defined as the reproducibility of a measurement) of microarray data can be affected by DNA concentration, cross hybridization, spot typing, hybridization condition and image analysis (8–11). Because of these variations, automatic quality control is critical to differentiate accurate microarray spots from inaccurate spots. Without better quality control, the use of ratio to infer differential expression can be inefficient and erroneous (8,12) as it is known that the uncertainty associated with dividing two intensity values further increases overall errors (13). Furthermore, in order to accurately analyze the expression of rare transcripts it is imperative to increase the detection limit for signal intensities at lower levels by further developing more precise analysis techniques.
Here, we present a new approach to correctly identify accurate signals using a simple correlation between mean and median. This method is extremely simple, but it is effective and automatically eliminates the majority of ‘bad’ spots without visual inspection. Using this method, rare transcripts can be analyzed with high confidence and fall within a theoretical noise level. We tested our method by using identically labeled probe on seven replicate slides spotted with Xenopus laevis cDNA. By using the same sets of probes and DNA spots, we were able to systematically analyze different sources of variation within our protocol. Here, we will illustrate how the accuracy and precision of different analysis techniques can account for different interpretations of significant fold changes at all intensities and describe improved techniques utilized in quality control including imaging and graphing tools. Through the use of these techniques and a simple correlation between mean and median, it will allow us to systemically identify and compare accurate data for normalization or gene clustering.
MATERIALS AND METHODS
Fabrication of microarray slides and UV cross-linking
PCR amplification was done according to Hegde et al. (14) using standard 384-well plates in a 26 µl reaction volume. PCR product size and amount were verified using 1% agarose gel. PCR plates showing 80% percent yield or higher were purified by precipitating with 3 M sodium acetate in ethanol solution before washing with 70% ethanol. Finally, DNA was solubilized in 50% DMSO buffer and spotted with a robotic system onto Corning CMT-GAP slides using 32 Stealth Micro Spotting Pins (TeleChem International). Short pin microtappings and microvibrations were used to control spot size independent of initial PCR volume. The mechanism and specifics behind this procedure will be discussed elsewhere. Typical spots with DNA usually range from 85 to 120 µm and printed spots are visualized by free Cy 3-dCTP/dUTP or Cy5-dCTP/dUTP (14). After printing, the spots were briefly rehydrated over an 80°C water bath and then UV cross-linked according to the CMT-GAP slide protocol with a Stratalinker (Stratagene).
Probe preparation, hybridization and slide scanning
Total RNA used in the probes was extracted from X.laevis (blastula) whole embryos using a traditional guanidine thiocyanate method (15). Approximately 30–100 µg of total RNA was used in reverse transcription reactions with oligo(dT)20 using Superscript II enzyme (Gibco) in a total reaction volume of 30 µl. Also included in the mixture was Cy3-dUTP or Cy5-dUTP (Amersham) at 0.1 mM, dATP, dGTP and dCTP at 0.5 mM, and dTTP at 0.1 mM. The reaction mixture was incubated at 42°C for 2 h. The RNA was degraded by incubation with 1 µl of 1 M NaOH for 10 min at 65°C, then neutralized by 1 µl of 1 M HCl. The two fluorescent samples were combined and diluted to 500 µl with TE (pH 8). Microcon-30 spin column filters (Amicon) were used to remove the unincorporated dyes and free nucleotides. After three washing and drying cycles, the probes were resuspended in a solution of 0.3% SDS, 3.5× SSC and yeast tRNA at 0.6 µg/µl.
To reduce background, spotted slides were soaked for 45 min in a 400 ml solution of 5× SSC, 0.1% SDS and 1% BSA with shaking at 42°C. Then, the slides were washed five times with sterile water and once in isopropanol before drying in a tabletop centrifuge (Sorvall RT6000B) at 700 r.p.m. The cDNA probes were heated to 100°C for 1 min, applied to the glass slides, and sealed in a Corning hybridization chamber. After hybridization at 65°C for 20 h, the slides were washed for 5 min in each solution containing 2× SSC and 0.01% SDS, 1× SSC and 0.1× SSC.
Hybridized slides were scanned with the Axon Instruments GenePix 4000B scanner, which generates Tiff images of both the Cy3 and Cy5 channels. GenePix PMT voltage was set from 700 to 900 V depending upon the first sign of a saturated signal.
Data analysis
All analyses in this paper were obtained using simple spreadsheet software such as Microsoft Excel with some basic add-ins. In order to allow our algorithm to eliminate all ‘bad’ spots, no data points were eliminated by visual inspection from the initial GenePix image. All data produced by GenePix are treated as true signals. Histogram, spatial and contour graphs were used to analyze for systematic errors in the pins. The sensitivity of detection was checked using expression graphs. For expression levels, we prefer to use the Dudoit graph of log intensity ratio (log2 R/G) versus mean log intensity (![]() ) (16–18) over the more traditional log graph as the log2 G (green) versus log2 R (red) (8,19,20). For quick examination of GenePix signal (e.g. saturation, diameter, flags) we prefer Axum6 matrix graphs. We used SPSS as a preliminary analysis with a small data set to check published methods as Lowess fit for different pins (17). For quality control, however, we found the raw intensity to be the most useful.
) (16–18) over the more traditional log graph as the log2 G (green) versus log2 R (red) (8,19,20). For quick examination of GenePix signal (e.g. saturation, diameter, flags) we prefer Axum6 matrix graphs. We used SPSS as a preliminary analysis with a small data set to check published methods as Lowess fit for different pins (17). For quality control, however, we found the raw intensity to be the most useful.
Automated mean and median correlation. The correlation between the mean and median is calculated with the following statement in Microsoft Excel:
= IF (OR (IF (A2 > B2, B2/A2, A2/B2) < 0.9, IF(C2 > D2, D2/C2, C2/D2) < 0.9), ‘Bad’, ‘Good’)
where A2 and B2 represent the mean and median for the red signal and C2 and D2 represent the mean and median signal intensity for the green signal. This statement divides the smaller of the mean or median by the larger for both fluorescent channels in a spot and flags signal with >10% differences as ‘bad’. Then the ‘bad’ spots can be eliminated or hidden in Excel by sorting. We have tested the mean and median correlation on eight slides, four hybridized with cDNA probe prepared from the same source and four with various cDNA probes. Consistent results were produced in all cases. However, we will only focus on the results obtained from the four slides hybridized with cDNA probe prepared from the same RNA source for this paper. The Pearson coefficient and variance (ANOVA) were also calculated for quantitative analysis, but we found the data too complex for these algorithms and therefore used the raw intensity graph in most cases.
In cases where a background subtraction is performed or where more rarely expressed signals are desired, we suggest shifting the data by:
where n is the number of samples and x is the median – mean value.
Image analysis
We found the final fluorescent hybridization image to be useful for quick preliminary analysis of spot quality. Printed spots can be visualized after incubation in free Cy3-dCTP/dUTP or Cy5-dCTP/dUTP (14), or food coloring (21). Unincorporated dyes tend to easily bind to the glass in the absence of any solutions (e.g. formamide). Alternatively, a non-destructive fluorescent staining using SYBR green II (22) can also be used to visualize the spots on slides and DNA quality. The origination of background signals as well as spot inconsistencies such as donuts can be traced and understood by simply examining the hybridized images at different stages.
RESULTS
Spot variability
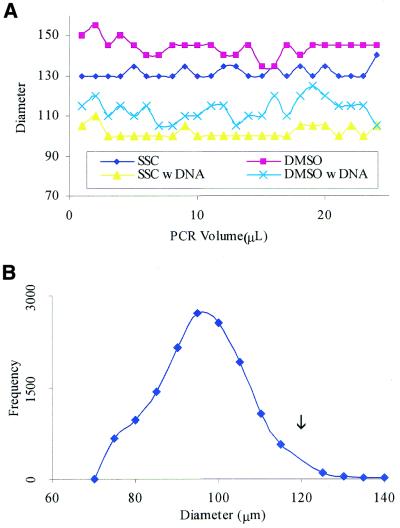
Microtapping effects on spot printing variability. During normal printing conditions, excessive PCR volume can be caught on the side of a pin. As a result, tapping the pins several times before printing (blotting) or decreasing the total PCR volume (23) is required to eliminate this effect. We found that if we vibrate the pin at a certain frequency as it is withdrawn from the plates containing the PCR products, the excess PCR volume on the pin is returned to the well. Figure 1A shows that spot sizes are then independent of the initial PCR volume. We do not see increasing or decreasing spot sizes with increasing PCR volume. In a simulation of actual printing without DNA, spots were printed in both 3× SSC and 50% DMSO with volumes increasing from 1 to 24 µl in 1 µl increments. Spots printed without DNA on Corning CMT-GAP slides in 3× SSC have an average diameter of 132 ± 2.9 µm (mean ± standard deviation) and spots printed in 50% DMSO have an average diameter of 144 ± 4.4 µm. When DNA is used during an actual printing session, the viscosity of the solution will increase and the average diameter of the spots will decrease as indicated in Figure 1A. DNA spots printed in 3× SSC have an average diameter of 101.9 ± 2.9 µm and DNA spots printed in 50% DMSO have an average diameter of 113.1 ± 5.5 µm. We also note that both the SSC and DMSO plot have shifted down with the addition of DNA suggesting that viscosity is an important parameter in determining spot size.
Figure 1.
Distribution of spot diameters. (A) The changes in spot diameter with increasing PCR volume. The x-axis represents the volume in the 384-well plate with SSC or DMSO and the y-axis represents the corresponding spot diameter. Notice that we do not see an increasing or decreasing trend with increasing volume. Also notice that with the addition of DNA, the spot size decreases by an average of 30.0 µm in SSC and 30.8 µm in DMSO. (B) The y-axis values represent the total number of spots with each respective diameter on the x-axis. The arrow indicates the diameter of the Telechem spotting pins at 120 µm. Directly after printing, the DNA tends to pull toward the center of each spot from both cohesion and surface tension resulting in a shift of the distribution to the left of the pin diameter.
Figure 1B shows a diameter distribution for 20 268 different DNA printed spots. In this data set, the majority of the spots have diameters which are <120 µm (the size of our pins). Through quick 1 µs micro-tapping, DNA can be expelled to the pin diameter. The advantage of multiple micro-tapping steps (repetitive tapping) over a set delay time is the production of a solid spot center. Unlike traditional spotting methods of one tapping step, micro-tapping steps do not allow for enough time for DNA to spread to the area outside of the pin diameter (if the delay time is short enough). Without this method for spot size control, the temperature and humidity may become major factors affecting spot size and quality (14).
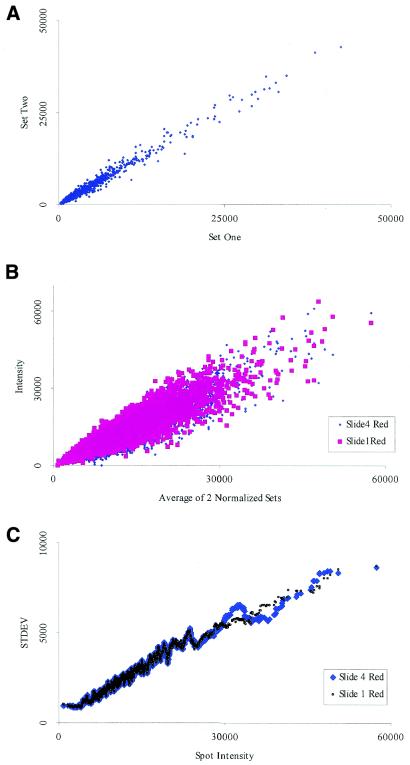
Although the micro-tapping method does not change the spot size dramatically with initial PCR volume, the spot size does change with the printing solutions (because of viscosity) for the same microtapping duration. Without DNA, spots printed under 3× SSC tend to be more consistent in diameter and the spot size distribution is found tightly around 132 µm. Spots printed under 50% DMSO tend to be larger (require shorter delay time) with the surface chemistry being more crucial. With DNA on Corning CMT-GAP slides, the surface tension tends to pull the DNA toward the center of the spot after printing and the Gaussian distribution is generally shifted to the left (Fig. 1B). For poly-lysine coated slides, the histogram tends to be more evenly distributed around the diameter of the pin (data not shown). Typically, when our test printing appears successful and our printing surface is clean, data from repeat experiments tend to superimpose on each other (Fig. 2B).
Figure 2.
Similarities within the same slide and between different slides. (A) A graph of two sets of signals produced from spots printed in duplicate on the same slide. Notice how the error envelope tends to be linear at lower signal intensities but begins to deviate somewhat at higher intensities. (B) Signal intensities produced from identical probe on two different slides after a regression normalization. Notice how the two data sets superimpose on each other. (C) An analysis of the data shown in (B) shows that low signals have a smaller standard deviation than higher signals.
Variations within slides and between replicated slides. In order to assess spot variations within slides, spots are printed in duplicate. As shown in Figure 2A, we find that the variability within the slide itself appears to be low. The accuracy envelope within the signal appears to be linear even at the higher intensity signals. A normalized plot from two different slides further confirms this finding. Using two of the four data sets from the error profile (discussed later), we created the expression graph comparing the changes between two different slides. As indicated in Figure 2B, the profiles of the two superimpose on each other. Variations between different slides are usually much larger (20), but we show here that it is possible to obtain data sets that can be superimposed.
Figure 2C demonstrates the standard deviation between two slides for a wide range of signal intensities. It is important to note that for each intensity measurement, the standard deviation is lower than the actual signal level and that genes producing lower signal intensities have low standard deviations. This consistent pattern shows that there is a defined error range at every measurement proportional to the signal intensity. These results suggest that as the accuracy of the experiment improves, we should be able to use the raw intensity graph directly for analysis rather than using the traditional ratio method.
Interpretation of data
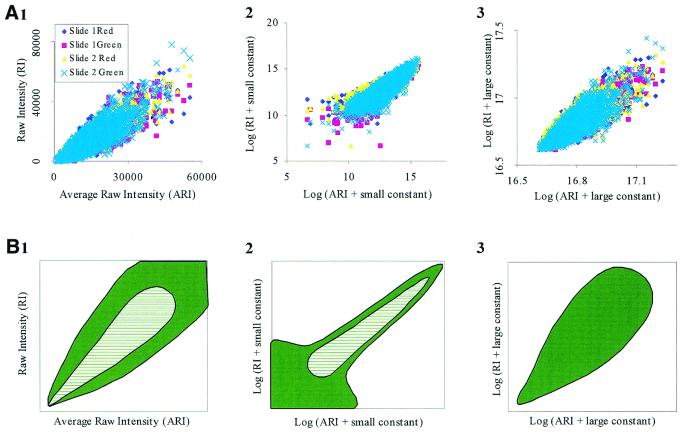
Error profile. Error envelopes are created to help interpret various graphs of microarray data. The need for an error envelope is evident because lines of equal probability distribution are usually curved rather than linear [or equal distance from some reference point as indicated by Newton et al. (8)]. Furthermore, it has been reported that a ‘magic’ fold difference does not exist for genes expressed at low levels (4). As a result, we decided to generate these error envelopes using four data sets. Using regression normalization (a linear trendline correction), we generated error envelopes to show fluctuations within our data (Fig. 3). The data is first filtered with a mean and median correlation of 93% as above before regression normalization. The x-axis is an average of the linear regression normalization and the y-axis is the actual signal for the four data sets.
Figure 3.
Error profile. To create the error profile, four different sets of data from two different slides were used. The x-axis indicates the average raw intensity (ARI) of the spots after a regression normalization of each data set along with a correlation filtering between mean and median intensity of 93%. (A) Four data sets under three different scales; raw intensity (RI) (1); log2 graph after the addition of a small constant (2); and log2 graph after the addition of a large constant (3). (B) A diagrammatic representation of the data presented in (A). Notice how the error profile changes with a logarithmic transformation. The error at lower signal intensity levels is amplified from a small logarithmic transformation (2). The normalization effect for data that has been logarithmically transformed is eliminated for higher shift values (3). The hatched area indicates where the majority (70%) of the data points lie. The solid area indicates where the remaining data points reside.
In an ideal environment, we would have only a linear trendline as the border of accuracy, but with the large amount of microarray data, correct interpretation of data becomes more complex. In our analysis, the error space initially starts as a 45° inverted rain drop (Fig. 3A). As the signal intensity increases, the accuracy envelope also enlarges, forming the bulge of the rain drop. Under ideal conditions, the error signal would be a linear transition composed of both the zero drift (a translation on the y-axis) and sensitivity drift (the slope), which can be both be corrected for with a simple regression equation (24). In theory, the noise envelope is usually limited by the precision of the measurement at lower intensity and by the accuracy of the measurement at higher intensity. Because the sensitivity of the microarray fluorescence signal is sufficiently high, spanning from 0 to 65 K in the Tiff image, the error profile is bounded solely by the accuracy measurements (25). As indicated in Figure 3A(1) (and Fig. 5B below), a linear range for the error was never observed. Simply put, the data recorded never approached the precision of the microarray detection system.
Figure 5.
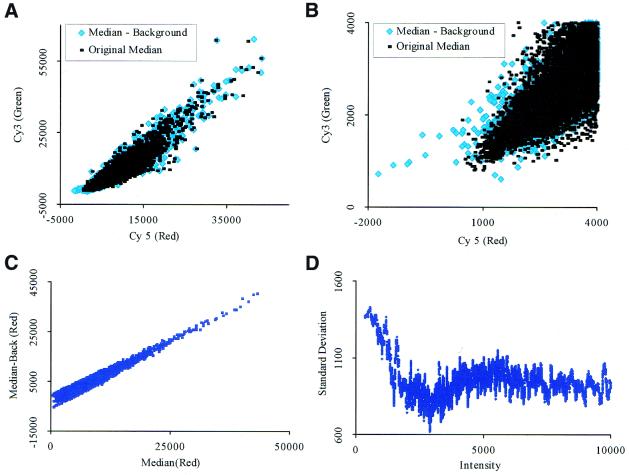
Mean and median signals with background correction. (A) A graph of both the original median signal and the median signal with background subtraction. (B) An enlargement of the signals at lower intensities with background subtraction. Notice the wider error envelope. (C) The GenePix background correction profile. (D) The background correction standard deviation has a stronger effect for lower signal intensities. This effect decreases as the signal intensities increase.
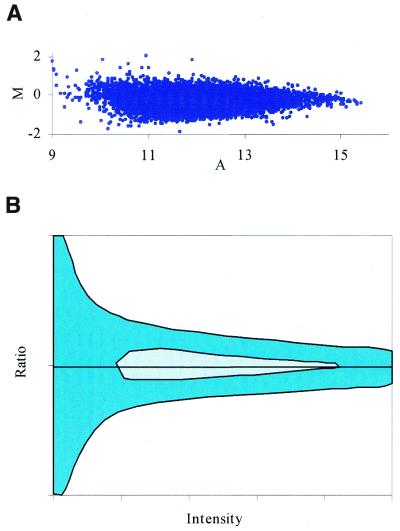
Logarithmic transformations of microarray data. Traditionally, researchers have used the logarithmic transformation to correct for the accuracy in an attempt to produce a more linear relationship among data. For the most part, logarithmic transformations tend to mask accuracy problems. For instance, depending upon the exact position along the log curve, the size of the error envelope changes. If the log of the data begins near zero, there will be scattering since the experiment is not accurate enough to record the change of extremely small signals on a log scale [Fig. 3A(2) and B(2)]. If the starting signal intensities are extremely high, the normalization of the log for accuracy disappears and the envelope produces a bulge for high intensities [Fig. 3B(3)]. Generally, we prefer to shift the data to produce a log graph starting at a value such as nine in order to reduce the amplification of small signal differences. This is because a large portion (∼70%) of the data falls into the lower end of the overall range of signal levels. At this level, the data are generally overcompensated and the error envelopes tend to taper toward the high intensity signal. This tapering can be seen by a Dudoit graph (see Fig. 7) and in many other microarray publications (4,17). To interpret a microarray data set for data quality, we visually inspect the width of the error envelope at both the middle intensities and at the low signal intensities on the raw data graph. Then, we can determine which transformation correctly identifies the most accurate signals.
Figure 7.
A Dudoit graph of typical microarray signals. (A) M represents the fold increase or decrease and A represents the reference signal intensity (control channel). These slides have been hybridized with identical probe. Notice how all of the signals fall within a 2-fold increase or decrease. For signals at higher intensities, the error envelope tends to taper off. (B) A diagrammatic representation of the Dudoit graph shown in (A). This ratio profile is a rotation of the graph shown in Figure 3B(2) about the origin. Notice how the ratio at the lower signal intensities is larger than that of the higher signal intensities. The hatched area indicates where the majority (70%) of the data points lie. The solid area indicates where the remaining data points reside.
Low signal accuracy
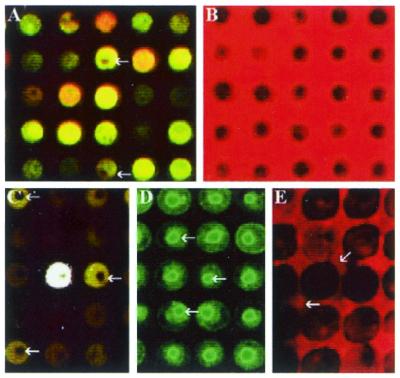
Analyzing the hybridization image. By visual inspections of a normal hybridized image (Fig. 4A), it is difficult to interpret the different signals and various errors produced on a microarray. Therefore, we have traced the hybridization process using imaging techniques to show that, contrary to traditional beliefs, low intensity signals may be accurate. Non-rehydrated slides (Fig. 4B–D) were used to study the hybridization processes since the variations within the slides are more prominent. Figure 4B shows a set of uniformly dark DNA spots before hybridization visualized by using unincorporated red dye staining. This image shows that the DNA fluorescent intensity may begin at a level below the background signal intensity.
Figure 4.
Images of various DNA spots. (A) A small set of typically labeled DNA spots. The arrow indicates a small unlabeled portion in the center of a spot. (B) DNA spots before the hybridization procedure. The DNA appears as a black color. (C) The arrows point to typical ‘donut’ spots. This is an area within the spot where there is no hybridization. (D) The penetration of the probe towards the center of the spots as shown by the arrows. (E) The diffusion of DNA from the spots into the hybridization solution.
The dark donut center (Fig. 4C) in a spot is a result of unhybridized DNA. From Figure 4B and C, we can predict that the dark ‘donut’ so often seen in microarray experiments may be the result of some type of crystallization complex that prevents penetration of the probe into the center of the spot. This is supported by Figure 4D which shows a brightly fluorescent center where a ‘donut’ was previously located. The only difference between Figure 4D and C is an intensive hybridization temperature (85°C). Furthermore, our experiences indicate that the donut cross-linking complex may decrease in size with increasing hybridization time.
DNA immobilization onto glass slides appears to be a complex process with excess DNA diffusing from the slide sometime during hybridization. The binding of DNA to the glass slides does not appear to be permanent as seen by horizontal ‘comet-tails’ in some publications, by the decrease in donut size with increasing hybridization time, and by a black smear of DNA shortly after hybridization (Fig. 4E). Furthermore, there is usually an abundant amount of DNA on the slide itself as in Figure 4B and D. Spot inconsistency is usually a result of incomplete hybridization. From our data, we would agree that a lower DNA concentration on a three-dimensional surface may be better for overall spot consistency as indicated by Stillman and Tonkinson (26,27). In short, the detection limit of microarray can be increased if a uniform layer of DNA can be deposited onto the glass surface. Furthermore, those low intensity signals, that are traditionally ignored, actually represent valid expression signals as long as a cDNA spot is present. This can be verified with an image such as the one shown in Figure 4B and D.
Graphical analysis of lower signal intensities. Rarely expressed genes have a low fluorescent intensity that can be easily distorted as indicated in the profile section (Figs 3B and 7B). Using identically labeled cDNA probe, we checked the GenePix background correction algorithm as it applies to our data. Figure 5A shows the original median signal along with the background corrected signal from GenePix. From a cursory glance, the two methods appear almost identical; however, upon careful examination, the background correction of GenePix has destroyed some low intensity signals. An enlargement of the genes at lower expression levels (Fig. 5B) indicates that the size of the noise envelope has increased with the correction. A graph of the actual signal with the corrected background signal is shown in Figure 5C. It should be noted that the lower expressed signals have a larger deviation range than the higher expressed signals. This is shown in Figure 5D where the standard deviation at the lower signal intensities is larger than that of the higher signal intensities. From this exercise, we conclude that in our hands the existing background correction in GenePix does not improve the quality of the signals, and sometimes introduces larger errors, particularly at the low level signals. As a result, we have decided to only use the median signal for our subsequent analyses in this paper.
Automated mean and median correlation
The use of a correlation between mean and median for quality control is a simple but effective way to analyze microarray data. The mean and median are essentially the same value unless spot shapes are irregular (i.e. donut shapes, unhybridized DNA within a spot, or inconsistent printing) and produce false signals. Since this correlation is applied to both red and green channels, it is unlikely that fortuitous events can produce the required signal to pass the simple algorithm.
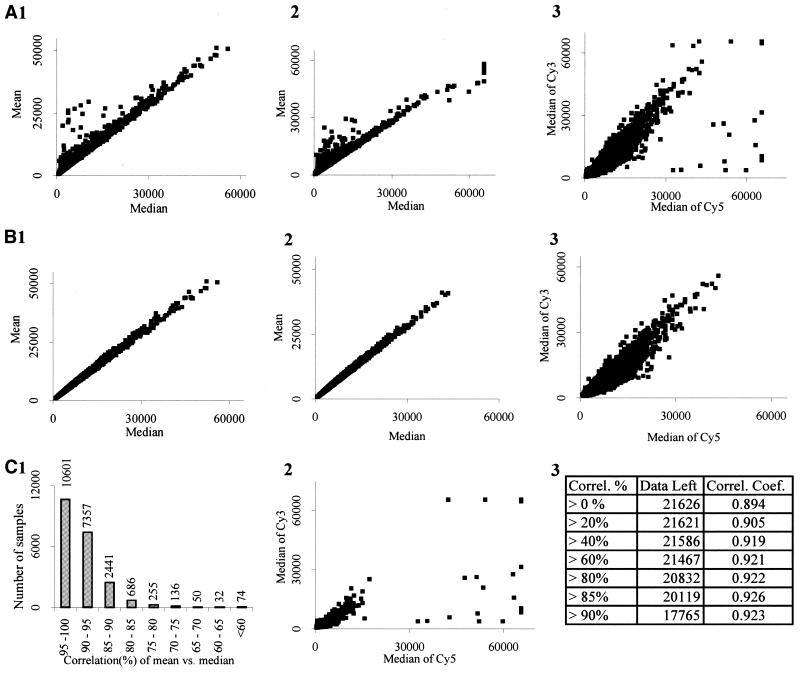
Figure 6A(1–3) indicates the typical expression profile for the mean and median along with the different fluorescent signals. Figure 6B(1–3) indicates the filtered graph after applying the mean and median correlation equation with the appropriate correlation percentage as described previously. As indicated by the histogram in Figure 6C(1), out of 21 626 total DNA spots (data points), over 17 000 sample points remain after a 90% correlation. On average, among four hybridization data sets, 82% of the spots are flagged ‘good’ by this method. The efficiency of a mean and median correlation performed on the data in Figure 6A(3) can be seen by the mask (85% correlation) in Figure 6C(2). (‘Good’ spots are masked and ‘bad’ spots are denoted by squares.) It is interesting to note that these methods increase the accuracy of the data as revealed by changes in the error profile [compare Fig. 6A(3) with B(3)]. Additionally, at a correlation of 85%, low expression signals and highly deviating strong signals [Fig. 6C(2)] are eliminated. Figure 6C(3) summarizes the data shown in Figure 6A(3) along with a short correlation coefficient. For example, at a correlation cut-off of 85%, there is a 0.926 correlation coefficient where a coefficient of 1.0 would be ideal.
Figure 6.
The mean and median correlation. (A) A graph of the unfiltered mean and median signals for the Cy3 channel (1) and the Cy5 channel (2). (3) The original unfiltered data set. Graphs of the data from (A) with a 90% correlation elimination are shown in [B(1–3)]. Compare the original unfiltered signal in [A(3)] with the filtered signal in [B(3)]. [C(1)] A histogram representing the number of spots present in 5% increments of correlation values. (2) At a mean and median correlation of 85%, most of the outlying and deviating spots are eliminated (these spots are shown on graph). (3) The percentage of data that is retained after each successive correlation elimination and the corresponding correlation coefficient. For example, at a correlation/similarity of >85%, 20 119 of 21 626 data points are retained with a correlation coefficient of 0.926.
This correlation method was found to be much superior to the GenePix flagging algorithm as indicated in Table 1. As shown in Figure 4B, unhybridized signals start out lower than the background signal. Many of these weak signals are traditionally eliminated because they do not have a substantially higher intensity than the background. On the other hand, using our mean and median correlation even at 93%, on average we retain over 80% of our low signal intensities that are otherwise eliminated by the GenePix algorithm. On average, 25% of the mean and median signals will be eliminated and flagged out by GenePix as ‘not found’. It is important to mention that Figure 6 has been generated from slide no. 3, which produced the lowest quality data set in Table 1. This data set has the most values eliminated at a correlation 93% (7810 data points). As indicated in Figure 6C(2), a relatively accurate set of data is generated with only a 85% correlation. More importantly, all the data points fall within a 2-fold increase or decrease (Fig. 7A). The corresponding error profile for the data presented in Figure 7A is shown in Figure 7B. These findings strongly suggest the reproducibility of our DNA microarray analysis between samples.
Table 1. Comparison between our mean and median correlation with traditional spot intensity thresholding methods.
| Slide | Total spots | Spots eliminated | Union of GenePix and mean–median | Data remaining (%) after correlation elimination | |
|---|---|---|---|---|---|
| GenePix filter | Mean – median | ||||
| 1 | 21 632 | 6786 | 3374 | 2608 | 84 |
| 2 | 21 632 | 13 601 | 2692 | 2142 | 88 |
| 3 | 21 632 | 8563 | 7810 | 5629 | 64 |
| 4 | 21 632 | 9389 | 6045 | 4084 | 72 |
Notice that the union of the two methods is different. It is important to note that slide no. 3 was used to generate Figure 6. We increased the correlation to 93% in an effort to generate similar spot elimination to the GenePix detection algorithm.
DISCUSSION
Since the early development of microarray technology, many improvements have been implemented. New surface chemistry and printing techniques have been developed that can now help generate highly accurate data sets. With the printing method and chemistry described in Materials and Methods, one can obtain data that are highly correlative between the mean and median signal intensities. The correlation between two sets of spots on a single slide is significantly high (Fig. 2A) and replication between slides can produce consistent results (Fig. 2B). Thus, we find it unnecessary to generate duplicated spots on the same slide to ensure the reproducibility of the data. Our analysis also suggests that background subtraction or correction as performed in the GenePix software is not needed under our protocol. Furthermore, the use of threshold cut-off values for weak signals is misleading and often results in errors since accurate low signals are often eliminated and inaccurate high signals are retained. We suggest that one of the simplest and most useful tools for obtaining quality data sets is to use the mean and median correlation method described here.
Genes that are rarely expressed produce weak signal intensities and are more vulnerable to fluctuations during normalization or background correction. As indicated above, methods that utilize either logarithmic transformations or ratios tend to decrease the accuracy of these types of genes by amplifying the noise level. This is also true with the GenePix background correction algorithm in our protocol, although sometimes it can improve signal quality. At the low intensities, the GenePix background correction has substantial effects (Fig. 5C). Therefore, we recommend that researchers interested in rarely expressed genes should track the noise envelope size by using identically labeled probe (both channels) as it progresses through the different background corrections and analysis algorithms to ensure that none of these procedures amplify the noise level.
Traditional microarray analysis utilizes some type of threshold to eliminate lower expression signals that are close to the background levels. However, from the production of several quality control images (Fig. 4), we have found that such an operation is unnecessary. Before the hybridization process, DNA spots actually start out much darker than the background intensity; therefore, if the signal is only slightly higher than the background level, it is likely to be actual data. Spots should only be eliminated if hybridization with unincorporated dyes indicates an absence of any DNA. This is because, as supported by our graph of the raw intensity values (Fig. 6A), a correct error envelope does exist for genes even at low expression levels. As seen by the superposition of all four independent data sets [Fig. 3A(1)], we do not observe any scattering of the signals near the background level. In fact, the genes at low expression levels near the background level always stay close to the background levels between repetitions (Fig. 2B).
We attribute problems with low intensity signals both to the nature of the log analysis and the ratio method, and not to the problems within the actual microarray data itself. As indicated in Figures 3A(2) and 7B, the log normalized transformation distorts both the low and high intensity signals. At the low intensity signals, the noise is larger and at the higher intensities, the noise envelope begins to taper off. The ratio then takes this distorted log data and further distorts the low intensity signals by dividing into an inaccurate log signal. In short, the problem with analyzing low signals is caused by the logarithmic transformation distorting the error envelope and the ratio amplifying the distortion by dividing two small signals.
As the number of DNA spots in microarray experiments drastically increases, it becomes difficult to visually inspect all of the microarray data produced in an experiment for accuracy. Our mean and median algorithm is a simple way to verify the quality of experimental microarray data. On average, by using a mean and median correlation of 90%, >82% of the total spots can be retained for analysis. By using a combination of brief pin microtapping, imaging techniques such as a wash with unincorporated nucleotides, and the mean and median algorithm, researchers can now easily eliminate spots of poor quality and retain correct signals that are close to the background level.
Future improvement
We believe designing imaging algorithms that can accurately detect low fluorescent signals within a spot can produce more reliable microarray data. Lower spot DNA concentrations and better surface chemistry will be essential in the forward progression of microarray technology. With these requirements satisfied, one will have more power to detect rarely expressed genes with ease.
Acknowledgments
ACKNOWLEDGEMENTS
The authors gratefully acknowledge Dr Susan Bryant, Dr Bruce Blumberg and Dr Joseph DeRisi for their assistance in manufacturing our robotic microarray spotter. We would also like to thank Rudy A. Limburg from the University of California, Irvine machine shop for his fabrication of various robotic parts. Finally, we thank Stuart Kim for introducing us to microarray technology and Naoto Ueno for providing a Xenopus arrayed cDNA library. This work was supported in part by the NIH through grants HD29507, GM54704 and HG00047-01.
REFERENCES
- 1.Schena M., Shalon,D., Davis,R.W. and Brown,P.O. (1995) Quantitative monitoring of gene expression patterns with a complementary DNA microarray. Science, 270, 467–470. [DOI] [PubMed] [Google Scholar]
- 2.Lander E.S. (1999) Array of hope. Nature Genet., 21, 3–4. [DOI] [PubMed] [Google Scholar]
- 3.Lucito R., West,J., Reiner,A., Alexander,J., Esposito,D., Mishra,B., Powers,S., Norton,L. and Wigler,M. (2000) Detecting gene copy number fluctuations in tumor cells by microarray analysis of genomic representations. Genome Res., 10, 1726–1736. [DOI] [PMC free article] [PubMed] [Google Scholar]
- 4.Tsien C.L., Libermann,T.A., Gu,X. and Kohane,I.S. (2001) On reporting fold differences. Pac. Symp. Biocomput., 496–507. [DOI] [PubMed] [Google Scholar]
- 5.Yue H., Eastman,P.S., Wang,B.B., Minor,J., Doctolero,M.H., Nuttall,R.L., Stack,R., Becker,J.W., Montgomery,J.R., Vainer,M. et al. (2001) An evaluation of the performance of cDNA microarrays for detecting changes in global mRNA expression. Nucleic Acids Res., 29, e41. [DOI] [PMC free article] [PubMed] [Google Scholar]
- 6.GEM Microarray Reproducibility Study (1999) Incyte Technical Survey. Incyte Pharmaceuticals, Inc., Palo Alto, CA.
- 7.Lee C.K., Klopp,R.G., Weindruch,R. and Prolla,T.A. (1999) Gene expression profile of aging and its retardation by caloric restriction. Science, 285, 1390–1393. [DOI] [PubMed] [Google Scholar]
- 8.Newton M.A., Kendziorski,C.M., Richmond,C.S., Blattner,F.R. and Tsui,K.W. (2001) On differential variability of expression ratios: improving statistical inference about gene expression changes from microarray data. J. Comput. Biol., 8, 37–52. [DOI] [PubMed] [Google Scholar]
- 9.Young R.A. (2000) Biomedical discovery with DNA arrays. Cell, 102, 9–15. [DOI] [PubMed] [Google Scholar]
- 10.Schuchhardt J., Beule,D., Malik,A., Wolski,E., Eichkhoff,H., Lehrach,H. and Herzel,H. (2000) Normalization strategies of cDNA microarrays. Nucleic Acids Res., 28, e47. [DOI] [PMC free article] [PubMed] [Google Scholar]
- 11.Lee M.L., Kuo,F.C., Whitmore,G.A. and Sklar,J. (2000) Importance of replication in microarray gene expression studies: statistical methods and evidence from repetitive cDNA hybridizations. Proc. Natl Acad. Sci. USA, 97, 9834–9839. [DOI] [PMC free article] [PubMed] [Google Scholar]
- 12.Yang M.C., Ruan,Q.G., Yang,J.J., Eckenrode,S., Wu,S., McIndoe,R.A. and She,J.X. (2001) A statistical procedure for flagging weak spots greatly improves normalization and ratio estimates in microarray experiments. Physiol. Genomics, 7, 45–53. [DOI] [PubMed] [Google Scholar]
- 13.Miles M.F. (2001) Microarrays: lost in a storm of data? Nature Rev. Neurosci., 2, 441–443. [DOI] [PubMed] [Google Scholar]
- 14.Hegde P., Qi,R., Abernathy,K., Gay,C., Dharap,S., Gaspard,R., Hughes,J.E., Snesrud,E., Lee,N. and Quackenbush,J. (2000) A concise guide to cDNA microarray analysis. Biotechniques, 29, 548–550, 552–544, 556. [DOI] [PubMed] [Google Scholar]
- 15.Ausubel F.M., Brent,R., Kingston,R.E., Moore,D.D., Seidman,J.G., Smith,J.A. and Struhl,K. (1999) Short Protocols in Molecular Biology. John Wiley and Sons, New York, NY.
- 16.Roberts C.J., Nelson,B., Marton,R., Stoughton,R., Meyer,M.R., Bennet,H.A., He,Y.D., Hai,H., Walker,W.L., Hughes,T.R. et al. (2000) Signaling and circuitry of multiple mapk pathways revealed by a matrix of global gene expression. Science, 287, 873–880. [DOI] [PubMed] [Google Scholar]
- 17.Dudoit S., Yang,Y.H., Callow,M.J. and Speed,T.P. (2000) Statistical methods for identifying differentially expressed genes in replicated cDNA microarray experiments. Technical report, Department of Statistics, Stanford University, #578.
- 18.Yang Y.H., Dudoit,S., Luu,P. and Speed,T.P. (2000) Normalization for cDNA microarray data. Technical report 589, Department of Statistics, University of California, Berkeley.
- 19.Taniguchi M., Miura,K., Iwao,H. and Yamanaka,S. (2001) Quantitative assessment of DNA microarrays—comparison with northern blot analyses. Genomics, 71, 34–39. [DOI] [PubMed] [Google Scholar]
- 20.Butte A.J., Ye,J., Niederfellerner,G., Rett,K., Haring,H.U., White,M.F. and Kohane,I.S. (2001) Determining significant fold differences in gene expression. Pac. Symp. Biocomput., 6–17. [DOI] [PubMed] [Google Scholar]
- 21.Byrne M., Macdonald,B. and Francki,M. (2001) Use of inexpensive dyes to calibrate and adjust your microarray printer. Biotechniques, 30, 748. [DOI] [PubMed] [Google Scholar]
- 22.Battaglia C., Salani,G., Consolandi,C., Bernardi,L.R. and De Bellis,G. (2000) Analysis of DNA microarrays by non-destructive fluorescent staining using SYBR green II. Biotechniques, 29, 78–81. [DOI] [PubMed] [Google Scholar]
- 23.Schena M. (2000) Microarray Biochip Technology. Eaton Publishing, Natick, MA.
- 24.Webster J. (1995) Medical Instrument: Application and Design. John Wiley & Sons, New York, NY.
- 25.Doebelin E.O. (1989) Measurement Systems: Application and Design. McGraw-Hill, Columbus, OH.
- 26.Stillman B.A. and Tonkinson,J.L. (2001) Expression microarray hybridization kinetics depend on length of the immobilized DNA but are independent of immobilization substrate. Anal. Biochem., 295, 149–157. [DOI] [PubMed] [Google Scholar]
- 27.Stillman B.A. and Tonkinson,J.L. (2000) FAST slides: a novel surface for microarrays. Biotechniques, 29, 630–635. [DOI] [PubMed] [Google Scholar]


