

ABSTRACT
Alterations in bile acid profile and pathways contribute to hepatic inflammation in cancer cachexia, a syndrome worsening the prognosis of cancer patients. As the gut microbiota impinges on host metabolism through bile acids, the current study aimed to explore the functional contribution of gut microbial dysbiosis to bile acid dysmetabolism and associated disorders in cancer cachexia. Using three mouse models of cancer cachexia (the C26, MC38 and HCT116 models), we evidenced a reduction in the hepatic levels of several secondary bile acids, mainly taurodeoxycholic (TDCA). This reduction in hepatic TDCA occurred before the appearance of cachexia. Longitudinal analysis of the gut microbiota pinpointed an ASV, identified as Xylanibacter rodentium, as a bacterium potentially involved in the reduced production of TDCA. Coherently, stable isotope-based experiments highlighted a robust decrease in the microbial 7α-dehydroxylation (7α-DH) activity with no changes in the bile salt hydrolase (BSH) activity in cachectic mice. This approach also highlighted a reduced microbial 7α-hydroxysteroid dehydrogenase (7α-HSDH) and 12α-hydroxysteroid dehydrogenase (12α-HSDH) activities in these mice. The contribution of the lower production of TDCA to cancer cachexia was explored in vitro and in vivo. In vitro, TDCA prevented myotube atrophy, whereas in vivo hepatic whole transcriptome analysis revealed that TDCA administration to cachectic mice improved the unfolded protein response and cholesterol homeostasis pathways. Coherently, TDCA administration reversed hepatic cholesterol accumulation in these mice. Altogether, this work highlights the contribution of the gut microbiota to bile acid dysmetabolism and the therapeutic interest of the secondary bile acid TDCA for hepatic cholesterol homeostasis in the context of cancer cachexia. Such discovery may prove instrumental in the understanding of other metabolic diseases characterized by microbial dysbiosis. More broadly, our work demonstrates the interest and relevance of microbial activity measurements using stable isotopes, an approach currently underused in the microbiome field.
KEYWORDS: Cancer cachexia, bile acids, gut microbiota, muscle atrophy, liver, Xylanibacter, cholesterol, 7-alpha-dehydroxylation activity, 7-alpha-hydroxysteroid dehydrogenase, 12-alpha-hydroxysteroid dehydrogenase, colorectal cancer
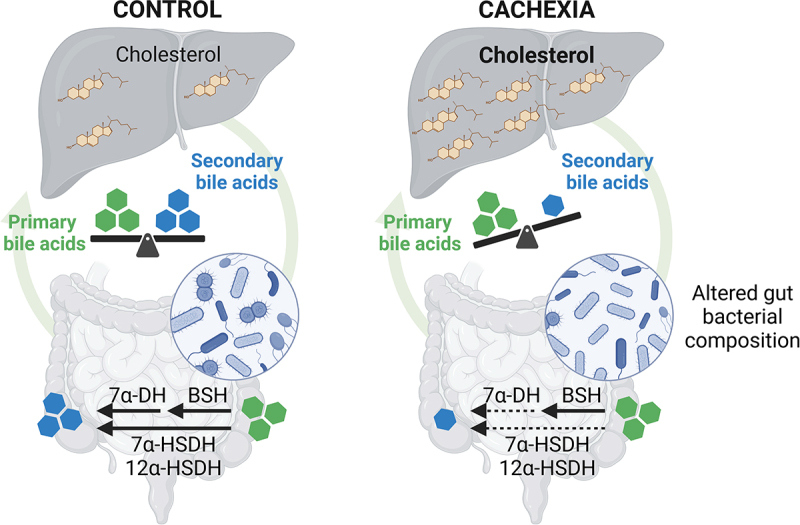
GRAPHICAL ABSTRACT
Introduction
The bile acid system is now recognized as a complex physiological system regulated at many levels and whose homeostasis needs to be preserved to avoid the development of pathological conditions.1,2 Primary bile acids are synthesized in the liver from cholesterol and are conjugated to taurine (mainly in mice) and glycine (mainly in humans). Conjugated primary bile acids are then secreted in the intestine, where they promote emulsification and absorption of dietary lipids and fat-soluble vitamins.3 In the intestine, there is a complex bi-directional interaction between bile acids and the gut microbiota. Bile acids shape the gut microbial composition due to their antimicrobial properties, and conversely, intestinal bacteria play a major role in the metabolism of bile acids.4,5 The first step of the microbial metabolism of bile acids is the hydrolysis of glycine- and taurine-conjugated bile acids into free bile acids, catalyzed by the bile salt hydrolases (BSHs).6 BSH activity is widely distributed within the bacterial kingdom.7,8 Then, free primary bile acids undergo bacterial metabolization into secondary bile acids, mainly through the 7α-dehydroxylation (7α-DH), occurring in the distal part of the gut. Unlike BSH activity, bacteria that carry out the 7α-DH are present at very low abundance but display a very high metabolic flux toward bile acids. The 7α-DH activity is limited to bacteria that possess the bai operon, composed of eight genes, including seven genes encoding enzymes and one gene encoding a transporter, mainly characterized in Clostridium scindens.9–11 Gut bacteria are also able to perform other bile acid metabolism reactions, including production of secondary allo-bile acids, oxidation to generate oxo-bile acids and subsequent reduction into epi-bile acids, and microbial conjugation with amino acids.12–17 Most of these bile acids are reabsorbed in the distal ileum to the portal vein and recycled to the liver to complete the enterohepatic cycle.3,18,19 A small proportion of bile acids can also escape the liver uptake and reach the systemic circulation to act on peripheral organs and tissues. Bile acids can play a role as powerful signaling molecules and exert diverse actions on host metabolism and immunity through bile acid-activated receptors, such as the Farnesoid X receptor (FXR) and Takeda G protein-coupled Receptor 5 (TGR5).2,20
One disease in which bile acids are of interest is cancer cachexia. Cancer cachexia is a multifactorial syndrome characterized by body weight loss, weakness, muscle atrophy, fat depletion, systemic inflammation, and hepatic metabolic alterations.21,22 These cachectic features arise from the pro-inflammatory mediators and catabolic factors generated by the tumor and the associated microenvironment.21,23,24 Additionally, molecular messengers, secreted by peripheral organs in response to the tumor presence, may also contribute to these metabolic and inflammatory alterations.25 One example of such a messenger is bile acids. In our previous work, we showed alterations in bile acid composition and pathways in the cachectic colon carcinoma 26 (C26) mouse model.26,27 These changes were intrinsically associated with cachexia and not only attributed to the tumoral presence. We also demonstrated a process termed as ‘inflammation-induced cholestasis’ in C26 cachectic mice, characterized by increased hepatic production of proinflammatory cytokines, inducing a strong reduction of transporters involved in bile formation and bile acid secretion, and leading to an accumulation of bile acids in the liver.28,29 To counteract this bile acid accumulation, the liver reacts by repressing bile acid synthesis and by enhancing alternative routes of basolateral bile acid efflux.30–33 Through experiments involving the administration of cholestyramine, a bile acid sequestrant used to reduce hepatic bile acid load, and tauroursodeoxycholic acid, we demonstrated that bile acid modulation impacts hepatic inflammation and muscle atrophy in C26 cachectic mice.26,27 In parallel, we and others have shown that the composition and function of the gut microbiota is altered in cancer cachexia.34–39 We therefore hypothesized that the microbial dysbiosis present in cancer cachexia may contribute to the altered bile acid profile.
To explore this hypothesis, we analyzed bile acid profile and pathways in several models of cancer cachexia. We characterized the alterations in the composition of the gut microbiota over time in the C26 cachectic mouse model. By performing functional assays, we discovered a reduction in the microbial functional capacity to convert primary bile acids into secondary bile acids in C26 mice. Finally, to establish the contribution of reduced secondary bile acids to the disease, we investigated in vitro and in vivo the impact of taurodeoxycholic acid (TDCA), the main secondary bile acid reduced in cachectic mice with relevance in humans.
Materials and methods
Cell culture
Murine colon carcinoma 26 cells (kindly provided by Dr. Mario Colombo, Fondazione IRCCS Istituto Nazionale Tumori, Italy) were maintained in DMEM high glucose medium supplemented with 10% fetal bovine serum (FBS), and 1% penicillin/streptomycin at 37°C with 5% CO2.
Murine MC38 colorectal cancer cells (kindly provided by Dr. Xiongbin Lu, Indiana University School of Medicine, USA) were maintained in DMEM high glucose medium supplemented with 10% FBS, 1% penicillin/streptomycin, 1 mm sodium pyruvate, and 2 mm L-glutamine at 37°C with 5% CO2.
Human HCT116 colorectal cancer cells (ATCC, Manassas, VA, USA; #CRL‐247) were cultured in McCoy’s medium supplemented with 10% fetal bovine serum (FBS), 1% penicillin/streptomycin, 1 mm sodium pyruvate, and 2 mm L-glutamine at 37°C with 5% CO2.
C2C12 murine myoblasts were cultured in growth medium containing high glucose Dulbecco’s Modified Eagle Medium (DMEM) supplemented with 10% FBS (Biowest, Central America), 1% nonessential amino acids, 100 IU/ml penicillin, 100 µg/ml streptomycin, and 4 mm L-glutamine (all supplied by Thermo Fisher, Belgium) at 37°C with 5% CO2. Once the C2C12 cells have reached 80–90% confluence, growth medium was replaced with differentiation medium containing DMEM high glucose, 2% horse serum (Thermo Scientific, New Zealand), 1% nonessential amino acids, 100 IU/ml penicillin, 100 µg/ml streptomycin, and 4 mm L-glutamine (all supplied by Thermo Fisher, Belgium). After 4 days of differentiation, the cells were treated for 48 h with TDCA (Sigma-Aldrich, USA) at 50 and 100 µM, and/or dexamethasone (Sigma-Aldrich, USA) at 1 µM, or INT-777 at 1 µM (Sanbio B.V., Netherlands). For myotube diameter quantification, images were captured using phase contrast microscopy (EVOS XL Core Imaging System, Thermo Fisher Scientific). The myotube diameter was quantified blindly with the image processing software ImageJ (U.S. National Institutes of Health, USA). Four pictures were taken of each culture dish and the experiments were performed in triplicates. For each picture, 10 myotubes were randomly selected and five measurements for each myotube were performed. Myotubes were defined by the presence of a minimum of 5 nuclei. For immunofluorescence visualization of myotubes, cell layers were fixed in ice‐cold paraformaldehyde 4%, permeabilized using Triton-X100 0.2% and incubated with a mouse anti-MyHC monoclonal antibody (MF 20, 1:20, Developmental Studies Hybridoma Bank) and donkey anti-mouse-IgG Alexa Fluor 594‐labeled secondary antibody (1:500, Invitrogen), as previously described.40
Mouse experiments
Male CD2F1 mice (7 weeks old, Charles River Laboratories, Italy) were kept in specific pathogen-free conditions and housed 2 to 3 mice per cage in individually ventilated cages with a 12 h light/dark cycle and fed an irradiated chow diet (AO4–10, Safe, France). The model used to study cancer cachexia is the well-established C26 model, characterized by body weight and fat mass loss as well as muscle atrophy.41 After one-week acclimatization, either a saline solution or C26 cells (1 × 10⁶ cells in 0.1 ml saline) were subcutaneously injected intrascapularly. Eight mice were randomly assigned in each group based on their body weight on the day of cell injection. Food intake and body weight were recorded on defined occurrences. When mice showed symptoms of cachexia, they were fasted from 7AM to 1PM, and tissue samples were harvested following anesthesia (isoflurane gas, Abbot, Belgium). Tissues were weighed and frozen in liquid nitrogen. All samples were stored at −80°C until further analyses.
The kinetic experiment has been previously described.26 It was composed of six groups of mice: sham-injected and euthanized 8 days after injection (CT-D8 group), receiving an injection of C26 cancer cells and euthanized 8 days after injection (C26-D8 group), sham-injected and euthanized 9 days after injection (CT-D9 group), receiving an injection of C26 cancer cells and euthanized 9 days after injection (C26-D9 group), sham-injected and euthanized 10 days after injection (CT-D10 group), receiving an injection of C26 cancer cells and euthanized 10 days after injection (C26-D10 group).
For the TDCA administration experiment, mice were randomly assigned in three experimental groups based on their body weight; sham-injected mice and daily intraperitoneally injected with the appropriate vehicle (CT group; n = 7), mice injected with C26 cancer cells and daily intraperitoneally injected with the appropriate vehicle (C26 group; n = 8), and mice injected with C26 cancer cells and daily intraperitoneally injected with 10 mg/kg of TDCA (C26-TDCA group; n = 8).42,43
For the MC38 experiment, 8-week-old male C57BL/6 mice (The Jackson Laboratory, Bar Harbor, ME, USA) were housed up to 5 per cage and randomized into one of the following conditions: subcutaneous injection of 1.0 × 10⁶ MC38 tumor cells in 200 µl sterile saline (MC38, n = 5) or an isovolumetric subcutaneous injection of vehicle (Control, n = 5) as previously described.44
For the HCT116 experiment, 8-week-old male NOD scid gamma (NSG) (NOD-scid/IL2Rgnull) immunodeficient mice (In Vivo Therapeutics Core Facility, Indiana University Simon Cancer Center, Indianapolis, IN, USA) were housed up to 5 per cage within a pathogen-free facility at Indiana University School of Medicine’s laboratory animal resource center. Animals were randomized into one of the following experimental conditions: subcutaneous injection of 3.0 × 10⁶ HCT116 tumor cells in 200 µl sterile saline (HCT116, n = 5) or an isovolumetric subcutaneous injection of vehicle (Control, n = 5), as previously described.45 Animals were weighed daily and then humanely euthanized under light isoflurane anesthesia and in a fed state 28 (MC38) or 29 (HCT116) days after tumor implantation. Following euthanasia, tumor, skeletal muscles, and liver tissues were harvested and weighed.
All the experiments performed in Belgium were approved by and performed in accordance with the guidelines of the local ethics committee from the UCLouvain, Belgium. Housing conditions were as specified by the Belgian Law of 29 May 2013, regarding the protection of laboratory animals. The animal experiments performed at IUSM were conducted with approval of the Institutional Animal Care and Use Committee at Indiana University School of Medicine and were in compliance with the National Institutes of Health Guidelines for Use and care of Laboratory Animals.
Tissue mRNA analysis
Total RNA was isolated from tissue by TriPure reagent (Roche, Basel, Switzerland). cDNA was prepared by reverse transcription of 1 μg total RNA using the Goscript RT Mix OligoDT kit (Promega, Leiden, The Netherlands). Real-time polymerase chain reactions (PCR) were performed with a StepOnePlus/QuantStudio Real-Time PCR System and software (Applied Biosystems, Den Ijssel, The Netherlands) or a CFX96 TouchTM instrument and software (Bio-Rad Laboratories, CA, USA) using SYBR Green (Applied Biosystems, Promega, Seraing, Belgium) for detection. All samples were run in duplicate in a single 96-well reaction plate, and data were analyzed according to the 2−ΔΔCT method. The purity of the amplified product was verified by analyzing the melt curve performed at the end of amplification. The ribosomal protein L6 (Rpl6) gene was used as housekeeping gene. The primer sequences for the targeted mouse genes are detailed in Supplementary Table 1.
Gut microbiota analysis
DNA extraction and total bacteria quantification
DNA was extracted from cecal samples following the protocol Q described by Costea et al.46 This protocol uses the QIAamp DNA Stool Mini Kit (Qiagen, Germany) and includes a bead-beating step. Treatment with RNAse A was performed (10 mg/ml, Thermo Fisher Scientific, USA). DNA concentration was determined, and purity (A260/A280) was checked using a NanoDrop 2000 (Thermo Fisher Scientific, USA).
Absolute quantification of the total bacterial load was performed by quantitative polymerase chain reaction (qPCR) using the primers Bacteria Universal P338F (ACTCCTACGGGAGGCAGCAG) and P518r (ATTACCGCGGCTGCTGG).47 Real-time PCR was performed with a QuantStudio3 (Applied Biosystems, The Netherlands) using SYBR Green (GoTaq® qPCR mix, Promega, USA) for detection. All samples (0.1ng/µl) were run in duplicate in a single 96-well reaction plate. Final concentrations were as follows: cDNA 2 µl/25 µl, primers 300 nM, and SyberGreen mix 1X (MeteorTaq DNA polymerase, dNTP, RT buffer, MgCl2 4 mm, SYBR® Green I, ROX passive reference, and stabilizers, as provided by the manufacturer). Thermocycling conditions were as follows: initiation step at 95°C 2 min; cycling stage at 95°C 30 s, 60°C 30 s, 72°C 30 s, 40 cycles; melt curve stage at 95°C 1 s, 65°C 20 s, increment of 0.1°C every 1 s until reaching 95°C. Threshold was manually adjusted to reach the linear range of the log-fluorescent curves and CT values were determined using the QuantStudio Software (Version 1.4.3, Applied Biosystems, The Netherlands). Absolute quantification was achieved through the inclusion of a standard curve (performed in duplicate) on each plate generated by diluting DNA from pure culture of L. acidophilus NCFM (five-fold serial dilution). Cell counts were determined by plating and expressed as “colony-forming unit” (CFU) before DNA isolation.
16S rRNA gene sequencing – data generation
Amplicon sequencing of the microbiome was done at the University of Minnesota Genomics Centre. Briefly, the V5-V6 region of the 16S rRNA gene was PCR-enriched using the primer pair V5F_Nextera (TCGTCGGCAGCGTCAGATGTGTATAAGAGACAGRGGATTAGATACCC) and V6R_Nextera (GTCTCGTGGGCTCGGAGATGTGTATAAGAGACAGCGACRRCCATGCANCACCT) in a 25 μl PCR reaction containing 5 μl of template DNA, 5 μl of 2X HotStar PCR master mix, 500 nM of final concentration of primers and 0.025 U/μl of HostStar Taq+ polymerase (QIAGEN). PCR-enrichment reactions were conducted as follows, an initial denaturation step at 95°C for 5 min followed by 25 cycles of denaturation (20 s at 98°C), annealing (15 s at 55°C), and elongation (1 min at 72°C), and a final elongation step (5 min at 72°C). Next, the PCR-enriched samples were diluted 1:100 in water for input into library tailing PCR. The PCR reaction was analogous to the one conducted for enrichment except with a KAPA HiFi Hot Start Polymerase concentration of 0.25 U/μl, while the cycling conditions used were as follows: initial denaturation at 95°C for 5 min followed by 10 cycles of denaturation (20 s at 98°C), annealing (15 s at 55°C), and elongation (1 min at 72°C), and a final elongation step (5 min at 72°C). The primers used for tailing are the following: F-indexing primer AATGATACGGCGACCACCGAGATCTACAC[i5]TCGTCGGCAGCGTC and R-indexing primer CAAGCAGAAGACGGCATACGAGAT[i7]GTCTCGTGG GCTCGG, where [i5] and [i7] refer to the index sequence codes used by Illumina. The resulting 10 μl indexing PCR reactions were normalized using a SequalPrep normalization plate according to the manufacturer’s instructions (Life Technologies). Twenty μl of each normalized sample was pooled into a trough, and a SpeedVac was used to concentrate the sample pool down to 100 μl. The pool was then cleaned using 1X AMPureXP beads and eluted in 25 μl of nuclease-free water. The final pool was quantitated by QUBIT (Life Technologies) and checked on a Bioanalyzer High-Sensitivity DNA Chip (Agilent Technologies) to ensure correct amplicon size. The final pool was then normalized to 2 nM, denatured with NaOH, diluted to 8 pM in Illumina’s HT1 buffer, spiked with 20% PhiX, and heat denatured at 96°C for 2 min immediately prior to loading. A MiSeq 600 cycle v3 kit was used to sequence the pool.
16S rRNA gene sequencing – bioinformatics
Subsequent bioinformatics analyses were performed in-house as previously described.36 Initial quality filtering of the reads was performed with the Illumina Software, yielding an average of 59 171 pass-filter reads per sample. Quality scores were visualized with the FastQC software (http://www.bioinformatics.babraham.ac.uk/publications.html.), and reads were trimmed to 220 bp (R1) and 200 bp (R2) with the FASTX-Toolkit (http://hannonlab.cshl.edu/fastx_toolkit/). Next, reads were merged with the merge-illumina-pairs application v1.4.2 (with p = 0.03, enforced Q30 check, perfect matching to primers which are removed by the software, and otherwise default settings including no ambiguous nucleotides allowed).48 The UPARSE pipeline implemented in USEARCH v1149 was used to further process the sequences. Amplicon sequencing variants (ASVs) were identified using UNOISE3.50 Such a method infers the biological sequences in the sample prior to the introduction of amplification and sequencing errors, and distinguishes sequence variants differing by as little as one nucleotide.51 The analysis allowed the identification of 1261 ASVs. ASVs were identified using the RDP database v18. Taxonomic prediction was performed using the nbc_tax function,52 an implementation of the RDP Naive Bayesian Classifier algorithm.53 Taxonomic identification of ASV of interest was refined using EZBioCloud (database version 2023.08.23,54) and cross-validated using blastn and the Prokaryota experimental tanoxonomic nt database. Alpha diversity indexes were calculated using QIIME55 on the rarefied ASV table. Rarefaction was performed using Mothur 1.32.156 by randomly selecting 28 000 sequences for all samples.
16S rRNA gene sequencing – biostatistics
Unrarefied data were filtered to select for a minimum abundance of 0.01% and a minimal prevalence of 35% in one group. Principal component analysis (PCA) was performed on CLR-transformed data57 using the pca function in the mixOmics R package58 followed by Permutational Multivariate Analysis of Variance (PERMANOVA) using the adonis function in the vegan R package.59 The PERMANOVA allowed to evaluate the explanatory power of each factor individually. The CLR transformation consists in a centered log ratio transformation and allows transforming compositional data into an Euclidian space. A pseudo-count equal to half the minimal value found in the dataset was applied prior the CLR transformation.60 Significantly impacted phyla, families, genera, and ASV were identified using a Mann–Whitney U-test in R since normality was not inspected for every phylum/family/genus/ASV. The p-value was adjusted to control for the false discovery rate (FDR) for multiple testing according to the Benjamini and Hochberg (BH) procedure.61 A q-value of <0.05 was considered significant. Venn diagrams were generated using a web-based tool (http://bioinformatics.psb.ugent.be/webtools/Venn/).
Bile acid metabolizing activities
Bile salt hydrolase activity was measured as described by Thomas et al.62 Briefly, frozen feces samples were weighed, homogenized in sterile phosphate buffer saline (PBS) and centrifuged. Proteins in the supernatant were precipitated by the addition of saturated ammonium sulfate, centrifuged, and the protein-containing pellet resuspended in sodium acetate buffer (50 mm, pH 4.7). Next, proteins (50 µg/reaction, in duplicate) were incubated with taurocholic acid-2,2,4,4-deuterium (d4-TCA, 400 µM final concentration, Sigma Aldrich) for 15 min at 37°C under agitation. The reaction was stopped by the addition of cold acetone.
The measurement of the 7α-dehydroxylation of bile acids by bacteria was performed on cecal contents from CT and C26 mice and on a specific cultured bacterial strain (Clostridium scindens, DSM 5676, DSMZ GmbH) as previously described.63 C. scindens was cultured in brain-heart infusion broth (BHI, 37.0 g/L) supplemented with yeast extract (5.0 g/L) and L-cysteine HCl (0.5 g/L) at pH 7.0, in an anaerobic chamber (Coy Laboratory Product) with a gas mix of 5% hydrogen and 95% nitrogen. To induce the bai operon and the 7α-dehydroxylating activity, C. scindens was grown in sterile BHI medium with 100 µM CA for 48 h. When the culture reached its stationary phase, the culture was centrifuged and then resuspended in 1 ml of fresh BHI. For bacteria from cecal contents, ceca were collected and transferred directly to an anaerobic chamber (Coy Laboratory Product) with a gas mix of 5% hydrogen and 95% nitrogen. From there, all steps were carried out under strict anaerobic conditions. Cecal contents were then collected, weighed, resuspended in sterile oxygen-free PBS, filtered (100 µm) and centrifuged. The bacterial pellet was suspended in 250 µl of fresh BHI. The fresh bacterial suspension and bacterial culture (60 µl, in triplicate) were then incubated with cholic acid-2,2,4,4-d4 (d4-CA, 100 µM final concentration, Toronto Research Chemicals) for 15 min (as well as 2 min, 2 h, and 23 h for bacterial culture) at 37°C under agitation to assess bile acid 7α-dehydroxylation. Incubation of BHI without bacteria in which d4-CA was added was used as control. The reaction was stopped by freezing in liquid nitrogen.
Bile acid quantification
Bile acid quantification was performed by LC-HRMS as previously described.64 Briefly, liver samples homogenized in ice-cold distilled water, or cecal contents from bile acid metabolizing activities experiments were placed in reaction tubes and proteins were allowed to precipitate using acetone containing deuterated internal standards. The samples were next centrifuged, the supernatant recovered and evaporated to dryness. The resulting residue was analyzed by LC-HRMS using an LTQ-Orbitrap XL coupled to an Accela HPLC system (ThermoFisher Scientific). Analyte separation was performed on an Ascentis Express C18 column (2.7 µm, 4.6 × 150 mm from Sigma-Aldrich) and a gradient of water and acetonitrile in the presence of formic acid (0.1%). Analytes were ionized using an electrospray ionization probe operated in negative mode. The instrument was calibrated before each analysis. Calibration curves were prepared using the same conditions. Data are expressed as pmol normalized by the amount of tissue. Bile acids detected using this method are listed in Supplementary Table 2.
Identification of additional bile acids
Epimerization intermediates d4-7-oxodeoxycholic acid (d4-7-oxoDCA) and d4-12-oxochenodeo-xycholic acid (d4-12-oxoCDCA) were identified through analysis by LC-MS/MS. Briefly, processed matrix isolated from CT mice used for 7α-dehydroxylation activity measurements (see above) were spiked with 20 pmol of unlabeled 7-oxoDCA or 12-oxoCDCA and subsequently analyzed using a Xevo TQ-S tandem quadrupole mass spectrometer coupled to an Acquity H-Class UPLC system (Waters). Analytes were separated using an Ascentis Express C18 column (2.7 µm, 4.6 × 150 mm from Sigma-Aldrich) and a gradient of water and acetonitrile in the presence of formic acid (0.1%). The mass spectrometer was equipped with an electrospray ionization probe used in positive mode. MRM transitions for 7-oxoDCA were 353.1 > 235.1 (Q) and 353.1 > 271.1 (q), for 12-oxoCDCA they were 407.2 > 353.2 (Q) and 407.2 > 371.2 (q), whereas they were 357.1 > 235.1 (Q) and 357.1 > 271.1 (q) for d4-7-oxoDCA, and 411.2 > 357.2 (Q) and 411.2 > 375.2 (q) for d4-12-oxoCDCA. Detection for d4-7-oxoDCA and d4-12-oxoCDCA were normalized to the signal of the internal standard d4-TCA.
Hepatic RNA sequencing
The quality and quantity of the RNA samples were evaluated using a 2100 Bioanalyzer System (Agilent Technologies, USA). All RIN values were greater than 7, supporting RNA integrity. RNA samples were sequenced after polyA selection using a 2 × 150 paired-end configuration on a NovaSeq 6000 instrument (Macrogen, the Netherlands). Raw sequence data were generated from Illumina TruSeq Stranded Total RNA library. Fastq files were processed using a standard RNAseq pipeline including Trimmomatic (v0.39)65 to remove low quality reads and HISAT2 (v2.2.1)66 to align reads to the mouse genome (GRCm38). Gene expression levels were evaluated using featureCounts from Subread (v2.0.3)67 and Mus_musculus.GRCm38.94.gtf. Differential expression analyses were performed with DESeq2 Bioconductor package v1.36.0.68 Gene set enrichment analysis (GSEA) was performed with clusterProfiler (v.3.14.3) Bioconductor package69 and Hallmark gene sets from Molecular Signature Database (msigdbr v.7.1.1).
Hepatic cholestol quantification
Cholesterol content was measured in the liver tissue after extraction with chloroform – methanol according to the Folch method.70 Briefly, 100 mg of liver was homogenized in 2 ml of chloroform: methanol (2:1). Lipids were extracted by addition of 40 µl NaCl 0.9%. The chloroform phase was evaporated under nitrogen flux and the dried residue was solubilized in isopropanol. Cholesterol concentration was measured using a kit coupling an enzymatic reaction and spectrophotometric detection of the final product (Diasys Diagnostic and System, Holzheim, Germany).
Statistical analyses
All data were checked for normality using the Shapiro-Wilk normality test. Outliers were identified in normally distributed data using the Grubbs’ test and removed. Normally distributed data were analyzed using a Student's t-test when comparing two groups, and one-way ANOVA followed by Dunnett’s pairwise comparison posttests with the C26 group as reference when comparing three groups. Data determined to be non-normal even after log-transformation were analyzed using a Mann-Whitney U test or Kruskal–Wallis test with Dunnett’s posttests. Body weight and food intake evolution in the TDCA administration experiment were analyzed using a two-way ANOVA with Tukey’s posttests. Correlation analyses were performed using Spearman correlations. Statistical analyses were carried out using GraphPad Prism 8.0 (GraphPad Software, San Diego, CA) and R. p < .05 was considered statistically significant.
Results
Alterations in bile acid profile and pathways in three mouse models of cancer cachexia
We previously showed alterations in hepatic bile acid profile and hepatic metabolism in the C26 cachectic mouse model.26,27 We therefore sought to assess the relevance of these findings in 2 other mouse models of cancer cachexia, the MC38 and HCT116 models.44,45 Both models are characterized by reduced body and muscle weights (Supplementary Figure S1). We found significant alterations in the hepatic bile acid profile marked by increased levels of primary bile acids, mainly driven by taurocholic acid (TCA) in C26 and MC38 mice, while these levels decreased in HCT116 mice as compared to their respective CT mice (Figure 1; Supplementary Figure S2). Interestingly, most secondary bile acids were significantly altered, including a significant decrease in TDCA in C26 and HCT116 mice, as well as a decrease in ω-muricholic acid (ω-MCA) in MC38 mice. While levels of tauro-ω-muricholic acid (Tω-MCA) decreased in C26 and MC38 mice, these levels were increased in HCT116 mice (Figure 1).
Figure 1.
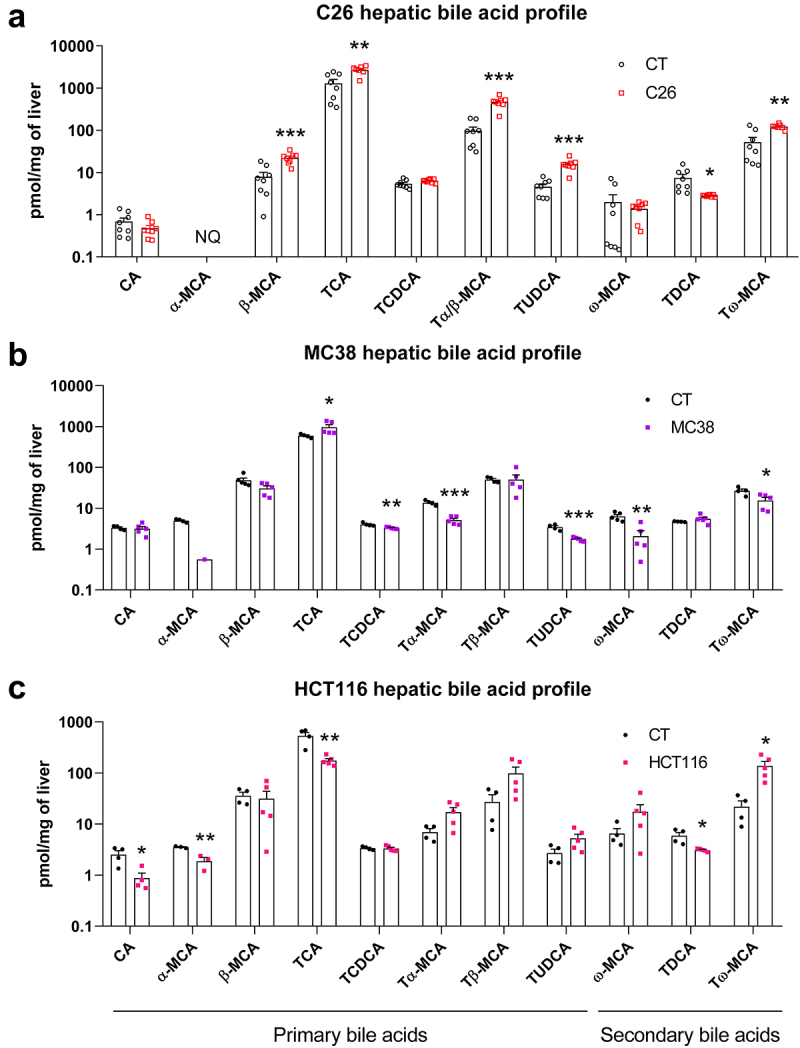
Hepatic bile acid profiling revealed alterations in bile acid composition in C26, MC38 and HCT116 cachectic mice as compared to their respective CT mice. n = 4–8 mice per group, data are presented as mean ± SEM, *p < 0.5, **p < .01 and ***p < .001 vs CT groups. NQ, not quantified. Panel a has been previously published in Thibaut et al, J Cachexia Sarcopenia Muscle 2021,26 these data points are therefore indicated with empty symbols.
A clear and consistent downregulation of genes involved in bile acid synthesis (Cytochrome P450 family 7 sub‐family A member 1 (Cyp7a1), Cytochrome P450 family 8 sub‐family B member 1 (Cyp8b1), Cytochrome P450 family 27 sub‐family A member 1 (Cyp27a1) and Cytochrome P450 family 7 sub‐family B member 1 (Cyp7b1)) was found in the 3 cachexia models, with the exception of Cyp7a1, which did not reach significance in MC38 mice (Figure 2a). Several genes involved in the hepatobiliary transport system were also affected (Figure 2b). The Na+/taurocholate transport protein (Ntcp), involved in hepatic bile acid uptake, was downregulated only in C26 mice. The Bile salt export pump (Bsep), implicated in bile acid hepatobiliary efflux, was downregulated in all cachectic models, while the Multidrug resistance‐associated protein 2 (Mrp2), also involved in bile acid hepatobiliary efflux, was significantly downregulated in C26 and MC38 mice. Coherently, the Organic solute transporter subunit beta (Ostb), a key player in the alternative bile acid efflux to the systemic circulation activated upon cholestasis, was significantly upregulated in C26 and MC38 mice, whereas this gene was downregulated in HCT116 mice.
Figure 2.
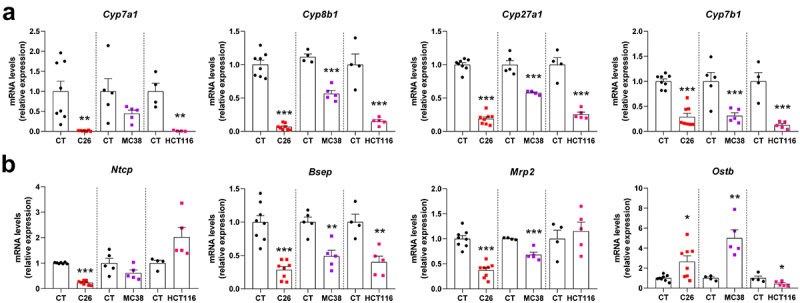
Hepatic gene expression levels in C26, MC38 and HCT116 cachectic mice as compared to their respective CT mice. Genes involved in bile acid synthesis (a) and hepatobiliary transport system (b). Cytochrome P450 family 7 sub‐family a member 1 (Cyp7a1), cytochrome P450 family 8 sub‐family B member 1 (Cyp8b1), cytochrome P450 family 27 sub‐family a member 1 (Cyp27a1) and cytochrome P450 family 7 sub‐family B member 1 (Cyp7b1), Na+/taurocholate transport protein (Ntcp), bile salt export pump (Bsep), multidrug resistance‐associated protein 2 (Mrp2), organic solute transporter subunit beta (Ostb). n = 4–8 mice per group, data are presented as mean ± SEM, *p < 0.05, **p < 0.01 and ***p < 0.001 vs CT groups.
Together, these data pointed out marked changes in bile acid pathways, mainly characterized by a global downregulation of the bile acid synthesis and the hepatobiliary transport, as well as a decrease in secondary bile acids, such as TDCA and muricholic acid derivatives (C6-hydroxylated bile acids). As our research question was the contribution of microbial dysbiosis to bile acid homeostasis and muricholic acid derivatives are predominant in mice but only marginally detected in humans,71–73 we selected TDCA as the focus of our downstream work.
Association between altered composition of the gut microbiota and reduced TDCA levels during the progression of cachexia in C26 mice
We then focused on which changes in the composition of the gut microbiota could be responsible for the decrease in secondary bile acids. In a previous experiment performed with the C26 model,26 we evaluated the time course of appearance of bile acid alterations and associated it with the onset of cachectic symptoms. In this experiment, we euthanized control and C26 mice (n = 8 mice per group) at 3 time points corresponding to different stages in the progression of cachexia: day 8 with no weight loss and no reduced food intake, day 9 with minor weight loss and first signs of anorexia (pre-cachexia) and day 10 with marked reduced body weight and food intake (cachexia) (Figure 3a,b). Interestingly, the hepatic levels of TDCA were decreased starting from day 8, highlighting the early nature of this alteration in the C26 cachectic mice (Figure 3b).
Figure 3.
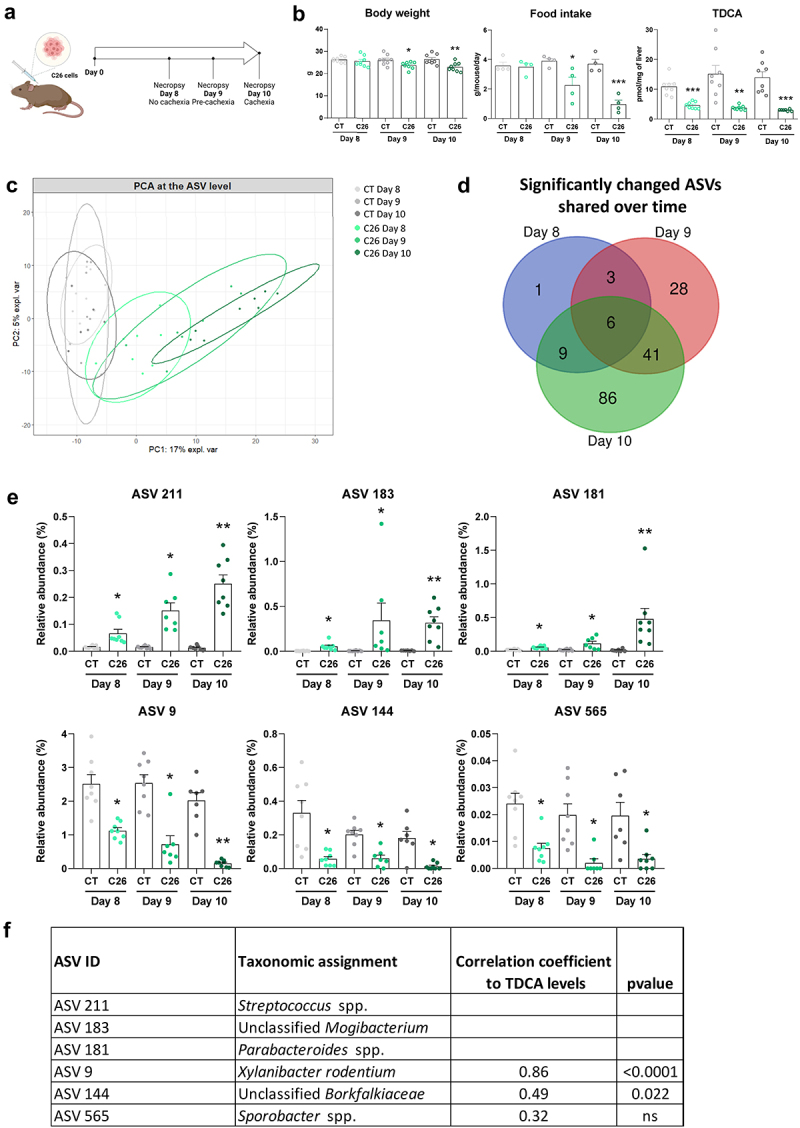
Gut microbiota composition (at the ASV level) according to the different stages in the progression of cachexia in cachectic C26 mice. (a) Experimental design. (b) Body weight, food intake evolution and hepatic TDCA levels at 8, 9 and 10 days after C26 cell injection (C26) or sham injection (CT). Data are presented as mean ± SEM, *p < 0.05, **p < 0.01, ***p < 0.001 vs CT groups. (c) Principal component analysis at the ASV level (PERMANOVA, R2 = 36%, p = 0.001). (d) Venn diagram generated from ASV significantly changed in the C26 groups on days 8, 9 and 10 (q-value <0.05), compared with their respective CT groups. (e) Relative abundance of the 6 ASVs that were significantly changed in the C26 groups on days 8, 9 and 10. Data are presented as mean ± SEM, * q < 0.05, **q < 0.01 vs CT groups. (f) Spearman correlations between the relative abundance of ASVs that were significantly changed in the C26 groups on days 8, 9 and 10, and their hepatic levels of TDCA (C26 groups). n = 7–8 mice per group. Panel B has been previously published in Thibaut et al, J Cachexia Sarcopenia Muscle 2021,26 these data points are therefore indicated with empty symbols.
Next, we analyzed the time course of appearance of microbial alterations in these mice. Caecal content weight was reduced before the onset of cachexia while total bacteria levels were increased at days 9 and 10 (Supplementary Figure S3A). Analysis of the alpha-diversity, reflecting the diversity within individuals, revealed a significant drop of indexes of richness (Chao1 and observed ASVs), evenness (Heip evenness and Simpson evenness) and richness and evenness (Shannon and Simpson) only at day 10 (Supplementary Figure S3B).
Our analyses focused mainly on the ASV level as many microbial bile acid metabolic activities are not shared at the family (and higher taxonomic) level.6,74 At the ASV level, a principal component analysis showed a progressive separation of the C26 groups over time, compared to the CT groups (PERMANOVA, R2 = 36%, p = 0.001) (Figure 3c). To identify ASVs potentially involved in the early decrease in the secondary bile acid TDCA, we selected all the ASVs that were significantly changed in the C26 groups on days 8, 9 and 10 (q-value <0.05), compared with their respective CT groups, namely 6 ASVs (Figure 3d, Supplementary Table 3). Among these ASVs, we identified ASV 211, ASV 183, and ASV 181 whose relative abundances increased progressively during the development of cachexia symptoms in C26 mice, respectively assigned to Streptococcus spp., unclassified Mogibacterium and Parabacteroides spp. (Figure 3e). Conversely, ASV 9, ASV 144 and ASV 565 displayed an early decrease in their relative abundance. These ASV correspond respectively to Prevotella rodentium (recently reclassified as Xylanibacter rodentium75), unclassified Borkfalkiaceae, and Sporobacter spp. ASV 9 (and ASV 144 to a lower extent) were positively correlated with TDCA levels, suggesting a potential involvement of these ASVs in the reduced TDCA levels (Figure 3f).
At the family level, a principal component analysis revealed a progressive separation of the C26 groups over time, compared to the CT groups (PERMANOVA, R2 = 65%, p = 0.001) (Figure 4a). The Clostridiales incertae sedis XIII, Streptococcaceae and Deferribacteraceae families were significantly increased in the C26 groups on days 8, 9, and 10, compared with their respective CT groups (Figure 4b,c, Supplementary Table 4). Interestingly, the family Prevotellaceae was reduced, in line with the reduction of ASV 9. Analyses at the phylum and genus levels were consistent with the observations made at the family level: the phylum Deferribacteres and the genera Streptococcus, Parabacteroides, and Mucispirillum were early and consistently increased in C26 mice while the genus Prevotella was decreased at days 8, 9 and 10 in C26 mice compared to their respective CT groups (Supplementary Table 4).
Figure 4.
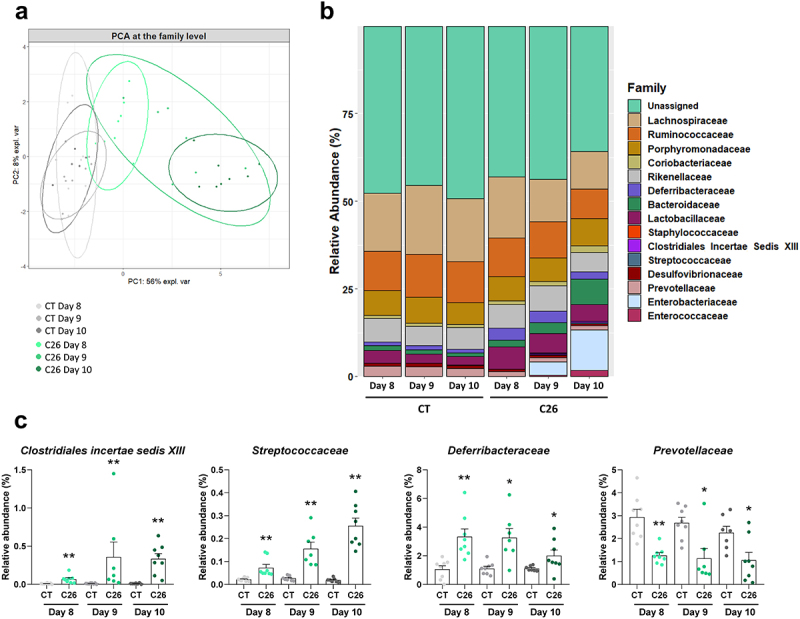
Gut microbiota composition (at the family level) according to the different stages in the progression of cachexia in cachectic C26 mice. (a) Principal component analysis at the family level (PERMANOVA, R2 = 65%, p = 0.001). (b) Barplots representing the relative abundance of families in sham-injected mice (CT groups) and mice receiving an injection of C26 cancer cells (C26 groups) on days 8, 9 and 10. (c) Relative abundance of families that were significantly changed in the C26 groups on days 8, 9 and 10. n = 7–8 mice per group, data are presented as mean ± SEM, *q < 0.05 and **q < 0.01 vs CT groups.
Overall, these data highlight that several taxa of the gut microbiota, including the ASV 9, ASV 144, and Prevotellaceae, are reduced early during the progression of cachexia in C26 mice and could potentially be responsible for the early reduction in hepatic TDCA levels.
Reduced microbial 7α-dehydroxylation activity in C26 mice
Next, we aimed to determine whether the alterations in the gut microbiota composition induce functional changes in microbial bile acid metabolism. We thus evaluated the bile acid metabolizing activities of gut bacteria in C26 mice. As deconjugation is considered an essential initial step in the metabolization of bile acids, we first analyzed the microbial functional capacity to deconjugate bile acids through the BSH activity. Proteins extracted from feces of C26 and CT mice were incubated with d4-TCA and the production of d4-CA was quantified. The BSH activity did not differ between CT and C26 mice (Figure 5a). As bacteria can also carry out amino acid conjugation through the BSH,16,17 we looked for microbially conjugated bile acids (MCBA) in samples arising from the incubation of fecal proteins with labeled TCA for up to 1 h, a timing previously shown to be adequate to detect such compounds.16 However, we found no trace of MCBA in these samples (data not shown). One explanation may be the fact that no exogenous amino acids were provided during the reaction.
Figure 5.
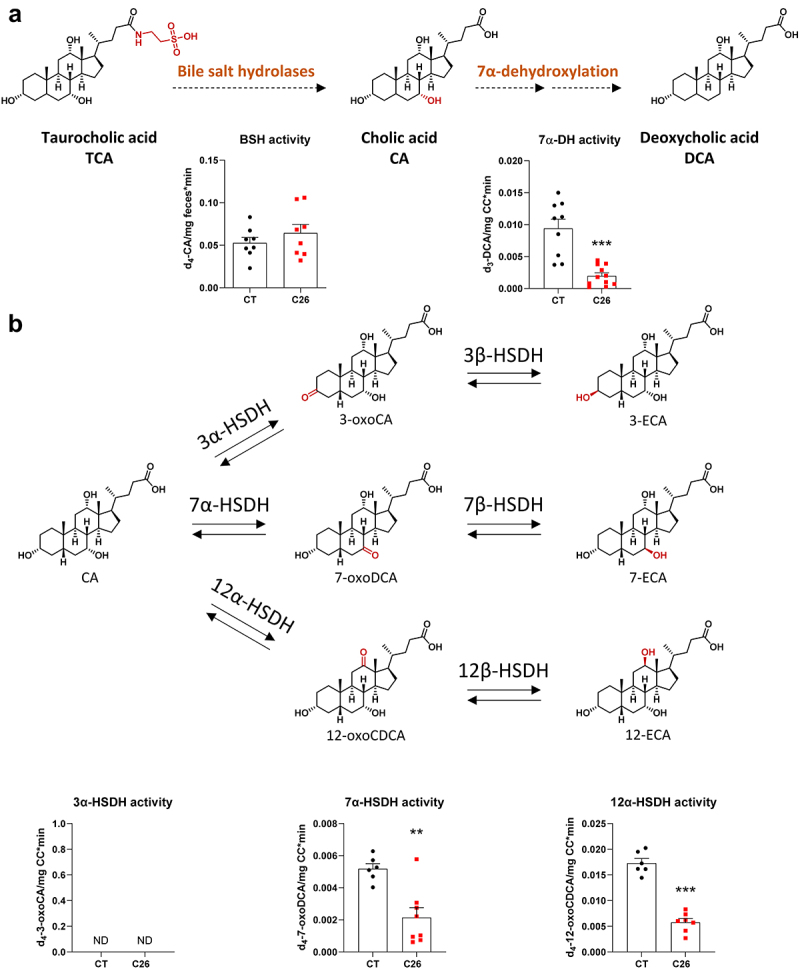
Reduced microbial 7α-dehydroxylation activity in cachectic C26 mice. (a) Deconjugation of d4-taurocholic acid (d4-TCA) by the fecal bile salt hydrolases into d4-cholic acid (d4-CA) (left), followed by the caecal 7α-dehydroxylation activity into deoxycholic acid (d3-DCA) (right) in sham-injected mice (CT) or mice injected with C26 cells (C26). (b) Detection of deuterated epimerization intermediates in caecal content of CT and C26 mice after incubation of d4-CA in anaerobic conditions at 37°C during 15 min. n = 6–12 mice per group, data are presented as mean ± SEM, **p < 0.01 and ***p < 0.001 vs CT group. HSDH, hydroxysteroid dehydrogenase. ECA, epicholic acid. ND, not detected.
To evaluate the 7α-DH activity, we prepared fresh cecal bacterial suspensions, incubated them in the presence of d4-CA in anaerobic conditions and quantified the production of d3-DCA. Of note, the loss of a deuterium on carbon 4 is due to the formation of 3-oxo-Δ4-CA as an intermediate in the 7α-dehydroxylation pathway of d4-CA.4 This experiment revealed a significant reduction in the 7α-DH activity in C26 mice (Figure 5a), demonstrating the reduced microbial functional capacity in C26 cachectic mice to metabolize the primary bile acid CA into the secondary bile acid DCA. These results were also confirmed in an independent in vivo experiment performed 6 months later (Supplementary Figure S4), further demonstrating the robustness of our findings.
Interestingly, while measuring the 7α-DH activity by LC-HRMS, we also detected several unidentified peaks that were present following d4-CA incubation with cecal bacterial suspensions. One peak was characterized by an m/z ratio of 411.3039 (hereafter named peak 411.3039), consistent with an isomer of d4-CA, whereas two peaks had a m/z ratio of 409.2883, corresponding to the m/z of dehydrogenated derivatives of d4-CA. To identify these peaks, we selected several standards, based on the m/z and the biochemical pathways potentially involved, and compared their relative retention times with the unidentified peaks in the same chromatographic system. When relative retention times and m/z ratio were similar, we aimed to confirm the identity of these peaks by spiking matrices from CT mice containing deuterated unidentified compounds with pure unlabeled standards. Subsequently, these spiked matrices were analyzed by LC-MS/MS. Using this technique, we successfully identified both peaks with an m/z ratio of 409.2883 in LC-HRMS as d4-7-oxoDCA and d4-12-oxoCDCA, two epimerization intermediates of d4-CA (Supplementary Figure S5). However, we could not identify peak 411.3039. The levels of d4-7-oxoDCA and d4-12-oxoCDCA were significantly decreased in C26 mice (Figure 5b), whereas d4-3-oxoCA was not detected. Interestingly, while the levels of peak 411.3039 were also significantly decreased in C26 mice (Supplementary Figure S6A), and though associated intermediates were detected, peak 411.3039 does not seem to be a 7- or 12-epimer of d4-CA, as its relative retention time (RRT = 0.805, compared to d4-CA) could not be matched with any of the tested standards (Supplementary Table 5). Moreover, d4-7-oxoDCA, d4-12-oxoCDCA and peak 411.3039, but not d4-3-oxoCA, were detected when the C. scindens culture was incubated with d4-CA (Supplementary Figures S6B and 7), in accordance with previous works reporting 7α-hydroxysteroid dehydrogenase (7α-HSDH) and 12α-hydroxysteroid dehydrogenase (12α-HSDH) activities in C. scindens strains.74,76 Intriguingly, only d4-7-oxoDCA and d4-12-oxoCDCA levels were affected over time, with levels increased after 2 and 15 min of incubation and then decreased after 2 and 23 h, while substrate levels were still sufficient, suggesting that peak 411.3039 is not an intermediate nor a product of d4-CA epimerization (Supplementary Figure S7). Of note, using LC-MS/MS, 3-oxoCA, 7-oxoDCA, and 12-oxoCDCA were not detected in the liver of C26 mice, nor were 3-ECA, 7-ECA, and 12-ECA.
TDCA protected mouse myotubes from atrophy
Next, we aimed to determine the potential contribution of this reduced microbial production of DCA to cancer cachexia. As we evidenced in the past that bile acid modulation was associated to changes in muscle atrophic state26,27 and TDCA levels were reduced early, before the occurrence of muscle weight loss, we speculated that reduced TDCA levels may contribute to muscle atrophy in the C26 model. To test this hypothesis, we incubated murine C2C12 myotubes with 50 µM of TDCA. TDCA increased myotube diameter after 48 h of treatment (Figure 6a). As TDCA is a potent agonist of TGR5, we wondered whether the TGR5 agonist INT-77720,77–79 could exert a similar effect. However, no change in myotube diameter was observed after 48 h of treatment with INT-777, suggesting that the pro-atrophic effect of TDCA is not mediated by TGR5 (Figure 6b). Then, we co-incubated C2C12 myotubes with 1 µM of dexamethasone, a pro-atrophying agent, and 50 or 100 µM of TDCA. As expected, dexamethasone reduced myotube diameter, an effect that was totally prevented by both doses of TDCA (Figure 6c,d, Supplementary Figure S8). Altogether, these results indicate that TDCA exerts a hypertrophic action, likely independent of TGR5, and prevents dexamethasone-induced atrophy in murine myotube cultures.
Figure 6.
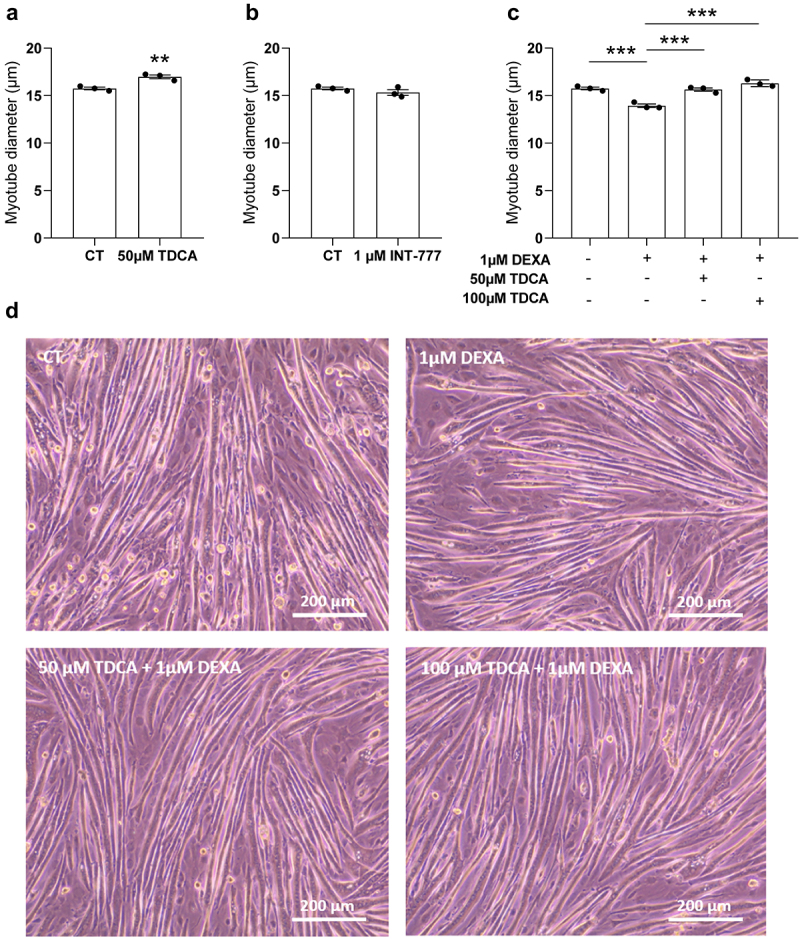
TDCA protected C2C12 myotubes against atrophy caused by dexamethasone. (a) Comparison of myotube diameter (µm) between the control myotubes (CT) and myotubes incubated with 50 µm of taurodeoxycholic acid (TDCA). (b) Comparison of myotube diameter between the CT myotubes and myotubes incubated with 1 µm of INT-777 (specific TGR5 agonist). (c) Comparison of myotube diameter between the 1 µm dexamethasone (DEXA) and vehicle-treated myotubes, myotubes incubated with 1 µM of DEXA and 50 µm of TDCA, and myotubes incubated with 1 µM of DEXA and 100 µm of TDCA. (d) Phase contrast microscopy pictures of myotubes treated with the vehicle (CT), treated with 1 µm DEXA, incubated with 1 µM of DEXA and 50 µm of TDCA, or incubated with 1 µM of DEXA and 100 µm of TDCA. Scale bar = 200 µm. Data are presented as mean ± SEM, representative of 3 independent experiments performed in triplicates (N = 3, n = 3). **p < 0.01, ***p < 0.001 vs CT or vs DEXA.
TDCA administration did not prevent muscle atrophy but reduced liver weight in C26 mice
Next, we investigated the effects of TDCA administration on cachectic features in vivo using the C26 mouse model. We compared sham-injected mice (CT), mice injected with C26 cells (C26) and mice injected with C26 cells and daily treated with TDCA (10 mg/kg i.p., C26-TDCA). TDCA administration did not affect body weight evolution and food intake evolution compared to C26 mice (Figure 7a). Treatment with TDCA had no effect on tumor weight, and no impact on muscle weight (gastrocnemius and tibialis anterior, Figure 7b). Interestingly, treatment with TDCA counteracted the increase in liver weight observed in C26 mice (Figure 7b), without inducing liver toxicity, as evidenced by the lack of increase in serum alanine aminotransferase (ALAT) levels (C26: 6.1 ± 1.0 IU/L; C26-TDCA: 4.3 ± 0.2 IU/L, p = 0.13). Taken together, the administration of TDCA had no impact on muscle atrophy but prevented liver weight increase in C26 mice.
Figure 7.
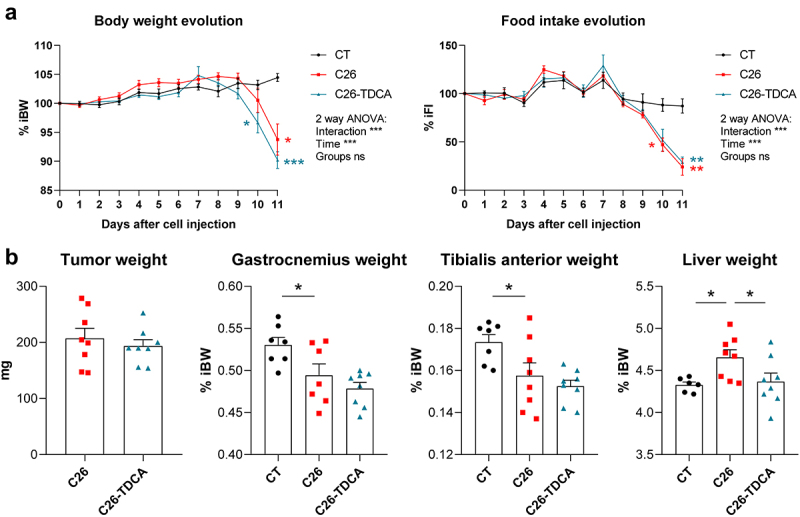
TDCA reduced liver weight in cachectic C26 mice. (a) Body weight and food intake evolution in sham-injected mice (CT), mice injected with C26 cells (C26), and mice injected with C26 cells and treated with 10 mg/kg/day of TDCA (C26-TDCA), expressed in % of initial body weight (% iBW) or % of initial food intake (% iFI). Two-way anova with Tukey’s posttests. (b) Tumor, gastrocnemius (GAS), tibialis anterior (TIB) and liver weights in CT, C26 and C26-TDCA mice. One-way Anova with Dunnett’s posttests, C26 group as the reference group. n = 7–8 mice per group, data are presented as mean ± SEM, *p < 0.05, **p < 0.01 and ***p < 0.001 vs C26 group.
TDCA administration improved hepatic cholesterol homeostasis in C26 mice
To understand the cause of the liver weight reduction induced by TDCA, a whole transcriptome analysis was performed on the liver of these mice. Univariate analyses highlighted 1696 upregulated genes and 1207 downregulated genes in C26 mice compared to CT mice (padj < 0.05, absolute log2(fold-change) > 1). A gene set enrichment analysis revealed a down‐regulation of genes involved in oxidative phosphorylation, fatty acid metabolism, bile acid metabolism, and xenobiotic metabolism (Figure 8Ai). Conversely, the main up‐regulated pathways were IL‐6/JAK/STAT‐3 signaling, epithelial mesenchymal transition, coagulation, complement, TNFα signaling via NFκB, inflammatory response, and unfolded protein response (UPR) (Figure 8Aiii). The same pathways were found to be similarly affected in a previous transcriptomics analysis.26 Treatment with TDCA significantly affected 533 genes (padj <0.05), with 48 genes induced (including Osbpl6) and 2 genes repressed with an absolute log2(fold-change) > 1 (Figure 8b, Supplementary Table 6). Compared to the impact of C26 inoculation, TDCA reinforced the downregulation of oxidative phosphorylation, fatty acid metabolism and xenobiotic metabolism (Figure 8Ai) while counteracting the changes in the UPR and cholesterol homeostasis pathways (Figure 8Aiii). TDCA-specific responses were also noted, such as a downregulation of the DNA repair and Myc targets pathways (Figure 8Aii). To confirm that TDCA impacts cholesterol homeostasis, we quantified hepatic cholesterol levels. Hepatic cholesterol levels tended to be increased in C26 mice and were reduced by the treatment with TDCA (Figure 8c).
Figure 8.
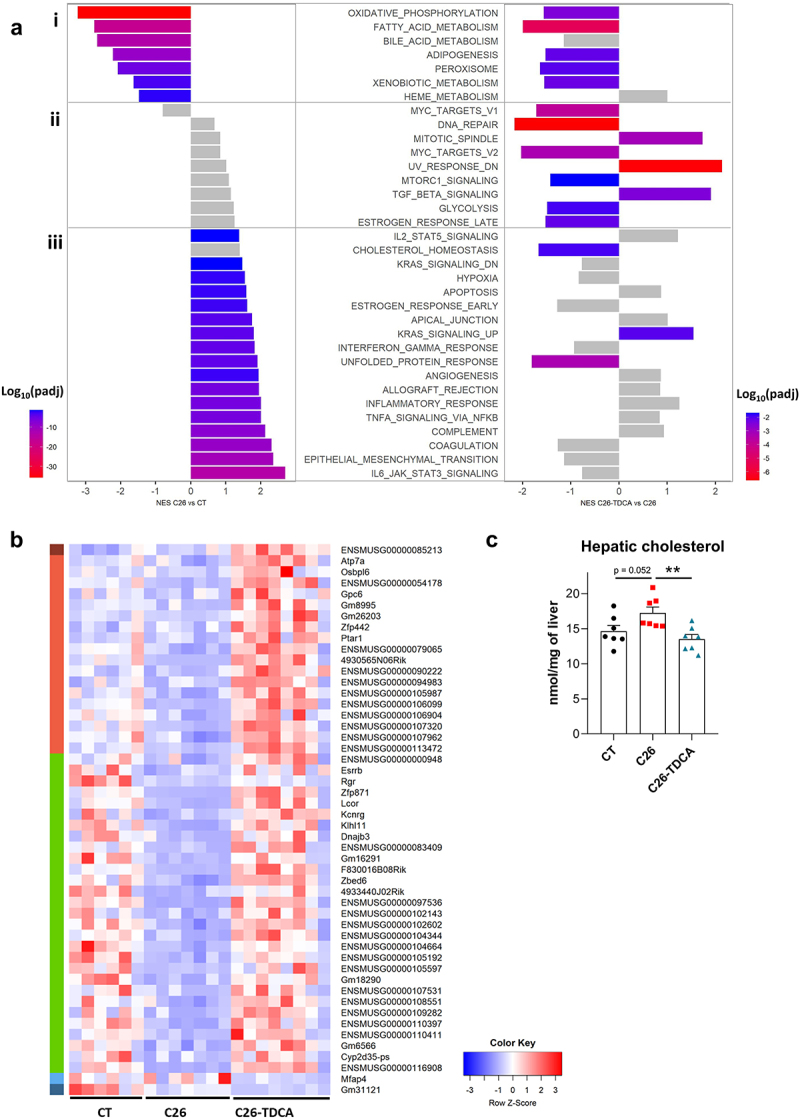
TDCA improved cholesterol homeostasis in cachectic C26 mice. (a) Significantly modified gene pathways between C26 and CT mice and between C26-TDCA and C26 mice using gene set enrichment analysis. (b) Heatmap of the 50 differentially regulated genes in C26-TDCA mice versus C26 mice (abs(L2FC) > 1, padj < 0.05). Among the 48 induced genes, 1 gene was induced (dark red cluster), 18 were not affected (light red cluster) and 29 were repressed (green cluster) in C26 mice compared to CT mice. 1 gene downregulated by TDCA was not affected in C26 mice (light blue cluster) while 1 gene downregulated by TDCA was also downregulated in C26 mice (dark blue cluster). (c) Hepatic cholesterol levels in CT, C26 and C26-TDCA mice. One-way anova with Dunnett’s posttests, C26 group as the reference group. n = 6–8 mice per group, data are presented as mean ± SEM, *p < 0.05, **p < 0.01 and ***p < 0.001 vs C26 group.
Discussion
This work highlights the functional role of the gut microbiota in metabolizing bile acids, which may act as signaling molecules impinging on hallmarks of cancer-associated cachexia. We first showed that alterations in the bile acid pathways, that we initially evidenced in the C26 model,26,27 were also found in two other mouse models of cancer cachexia, namely the MC38 and HCT116 models. Furthermore, in C26 mice, the reduction in TDCA levels was associated with changes in the gut microbiota, both features occurring before the appearance of cachectic symptoms. Coherently, we found a reduction in microbial 7α-DH activity in cachectic C26 mice. Finally, we established that daily administration of TDCA lowered cholesterol levels in the liver of C26 mice.
By comparing several cachectic models, we observed an increase in total hepatic bile acid levels, mainly due to an increase in TCA levels in C26 and MC38 mice, but not in HCT116 mice. The expression of genes involved in bile acid synthesis was consistently reduced in all models, excluding the hypothesis that the increase in total bile acids arises from an increased synthesis. Several signs of cholestasis, namely the accumulation of hepatic bile acids, the decreased expression of Ntcp and Mrp2, and the increased expression of Ostb, were observed in the C26 and MC38 models but not in the HCT116 model. In addition, we observed a reduction in secondary bile acids, namely TDCA in C26 and HCT116 mice, and ω-MCA and Tω-MCA in MC38 mice. The fact that the nature of these secondary bile acids is different could be due to differences in microbial alterations between cachectic models, which may arise from the different mouse genetic backgrounds used for these models. Together, these results put forward common and model-specific alterations in the bile acid profile and pathways upon cancer cachexia.
DCA is a secondary bile acid which arises from the microbial metabolism of CA and can be hydroxylated again at the C7 position into CA in murine hepatocytes through Cyp2a12.80 This reaction might also be catalyzed by Cyp2a22.80 As Cyp2a12 and Cyp2a22 are reduced in C26 mice,26 we excluded hepatic rehydroxylation as an explanation for the reduced hepatic TDCA levels and focused on microbial metabolism. By analyzing in parallel the alterations in the composition of the gut microbiota and TDCA levels in C26 mice overtime, we identified ASV 9 and ASV 144 as ASV potentially involved in the lowering of the TDCA levels. These ASVs correspond to Xylanibacter rodentium and unclassified Borkfalkiaceae respectively. Whether these bacterial species/family display a 7α-DH activity is unclear. This metabolic activity has been primarily observed in Clostridia species4,10,11,81 but may be more widespread.74 ASV 144 represents ~0.3% of the sequences in healthy mice. The Borkfalkiaceae family belongs to the Clostridia order and currently includes only uncultured genera which have not been functionally characterized.82,83 ASV 9 represents ~3% of the sequences in healthy mice, accounting for most of the Prevotellaceae members present in this ecosystem. X. rodentium is very close to Prevotella copri in terms of metabolic features (Pfam and CAZyme repertoires),75 but contrarily to P. copri, its impact on host has not been investigated so far. P. copri was reduced in lung cancer patients with cachexia compared to non-cachectic lung cancer patients and such reduction was correlated to lower plasma levels of a secondary bile acid, 3-oxoCA.37 Furthermore, Prevotella copri was reduced in patients with primary sclerosing cholangitis (PSC) and the administration of Prevotella copri to a mouse model of PSC improved cholestasis and liver fibrosis by enhancing the FXR-related signaling pathway.84 To explore the potential bile acid metabolizing activity of X. rodentium, we ran a functional characterization of the genome of this bacterium using JGI85 and BlastKOALA.86 Such approaches consistently predicted the presence of a BSH gene and the absence of bai-encoded genes. However, this result does not allow to fully exclude that X. rodentium carries out a 7α-DH activity. A false negative result may ensue from the heterogeneity in the orthologs being able to carry out this activity or the existence of divergent genes encoding the 7α-DH activity. Indeed, Extibacter muris, the first mouse isolate for which such 7α-DH activity was experimentally demonstrated,87 displays only two out of the seven bai-encoded genes using these in silico approaches. Similarly, Roseburia intestinalis, Bacteroides vulgatus, and Bifidobacterium adolescentis strains predicted to possess only four or five genes of the bai operon demonstrated a 7α-DH activity.74 Determining whether X. rodentium is involved in the reduction of TDCA levels in C26 cachectic mice will therefore deserve further experimental work. Metagenomics analyses would be a first step in this direction and would allow to increase the taxonomic resolution.
Because of (i) the lack of knowledge on the nature of bacteria carrying out the 7α-DH activity and (ii) the inducible nature of the bai operon,88 making the 7α-DH activity environmentally dependent and not predicable based solely on genetic content analyses, we next focused on implementing microbial activity measurements using stable isotopes, an emerging technique in the field of the microbiome. This approach revealed a decreased 7α-DH activity in the cecal content of C26 mice, with no change in BSH activity, and provides an explanation for the reduced levels of DCA, and consequently TDCA.
Interestingly, we also detected several unidentified compounds that appeared during the incubation of cecal samples with d4-CA and that were significantly reduced in C26 mice, two of which were identified as d4-7-oxoDCA and d4-12-oxoCDCA. The gut microbiota can carry out reactions other than 7α-dehydroxylation, such as epimerization, which further diversify the chemistry of secondary bile acids. CA can be dehydrogenated to form 3-oxoCA, 7-oxoDCA, and 12-oxoCDCA, and then rehydrogenated to form the epimers 3-ECA, 7-ECA, and 12-ECA,4 respectively (Figure 5b).13 However, one bacterial product of d4-CA remains unidentified. This molecule, named peak 411.3039, likely an isomer of d4-CA based on its m/z ratio, was decreased in C26 mice (Supplementary Figure S6A). Surprisingly, despite the detection of epimerization intermediates d4-7-oxoDCA and d4-12-oxoCDCA, peak 411.3039 was not identified as either d4-7-ECA nor d4-12-ECA. Moreover, it was also not identified as d4-3-ECA nor d4-allocholic acid, a flat isomer and microbial metabolite of d4-CA. Finally, measurements from the C. scindens culture suggested that peak 411.3039 is not an intermediate nor a product of d4-CA epimerization.
7α-HSDH and 12α-HSDH, whose activities are decreased in C26 mice, can also produce 7-oxoLCA and 12-oxoLCA. Bacteria that possess HSDHs capable of metabolizing oxo- and epi- bile acids are progressively being identified, with the 7α-HSDH appearing to be more widespread than the 12α-HSDH.13,74,76 These reactions do not specifically need to be carried out in a single bacterium and epimerization can be performed by co-cultured organisms.12 The ability of microbial HSDH-derived bile acids to activate host receptors has been partially uncovered while their role in host physiology begins to be explored. 7-oxoLCA is a FXR antagonist89 while 12-oxoLCA does not activate either FXR or VDR.90 12-oxoLCA has been shown to reduce body weight loss, intestinal damage and associated colonic IL17A+ group 3 innate immune cells in a mouse model of colitis.91 7-oxoLCA can also promote intestinal homeostasis by improving the gut barrier function and intestinal stemness.89 This last point is of particular interest in our context as C26 mice display altered gut barrier function and intestinal stemness.92 Future work will therefore aim to determine whether a reduced production of 7-oxoLCA and 12-oxoLCA by the gut microbiota, ensuing from a reduced microbial 7α-HSDH and 12α-HSDH activities, may contribute to the altered gut barrier function observed in this model.
The physiological role of the canonical secondary bile acids DCA and LCA has been more extensively explored. In patients with inflammatory bowel disease (IBD), the secondary bile acids LCA and DCA are often reduced and associations between decreased levels of secondary bile acids and gut dysbiosis have been reported.2 Furthermore, DCA downregulates inflammation and acts on glucose and energy homeostasis in several pathological contexts, including liver diseases, nonalcoholic steatohepatitis, type 2 diabetes and atherosclerosis.20,93 As TDCA levels were reduced in cachectic mice, we hypothesized that supplementation with TDCA may dampen host metabolism alterations and inflammation. In accordance with this hypothesis, incubation of murine myotubes with TDCA evidenced hypertrophic and anti-atrophic effects. We therefore wondered whether TDCA increases myotube diameter through TGR5 activation. Some studies suggested that the hypertrophic activity exerted on C2C12 myotube diameter by bile acids such as LCA or TUDCA occurred through TGR5 activation.94–96 In contrast, Abrigo and colleagues demonstrated that TGR5 activation by 25 or 50 µM of INT-777 induced atrophy in C2C12 myotubes.97 In our hands, treatment of C2C12 myotubes with 1 µM of INT-777 did not impact myotube diameter. This result suggests the implication of a TGR5-independent mechanism in the hypertrophic activity of TDCA on C2C12 myotubes.
Despite the hypertrophic and antiatrophic effects of TDCA in vitro, TDCA did not prevent muscle atrophy in C26 cachectic mice. One hypothesis explaining the difference between the in vitro and in vivo results is that the administration of TDCA exerts indirect systemic effects which counteract the local hypertrophic impact of TDCA on muscle metabolism. One such indirect systemic effect may be the regulation of the hypothalamic-pituitary-adrenal (HPA) axis by bile acids.98,99 Indeed, FXR and TGR5 are expressed in adrenal glands where they participate in the regulation of the production of glucocorticoids,98 which are known inducers of skeletal muscle atrophy.100 These elements lead us to speculate that TDCA administration may promote the activation of the HPA axis resulting in increased glucocorticoid production in vivo, an indirect proatrophic effect that would go against the direct antiatrophic effect of TDCA evidenced in vitro.
Bile acid and cholesterol metabolisms are closely linked. Biliary cholesterol secretion and catabolism of cholesterol to synthesize bile acids, under the control of FXR, are the two main pathways for cholesterol elimination from the organism.3,101 In C26 mice, both the hepatobiliary transport system and bile acid synthesis are reduced and may therefore explain the increased levels of hepatic cholesterol. TDCA administration to C26 mice improved cholesterol homeostasis and decreased hepatic cholesterol levels, but these improvements occurred independently of a change in the expression of the genes involved in the hepatobiliary transport system and bile acid synthesis. One of the key genes upregulated by TDCA and that may mediate this reduction in hepatic cholesterol is Osbpl6. Osbpl6, for Oxysterol Binding Protein Like 6, encodes the ORP6 protein whose overexpression enhances cholesterol trafficking and efflux in macrophages and hepatocytes.102 Intriguingly, Osbpl6 is a target of miR-33, an miR able to inhibit cholesterol export and induced upon ER stress.102–104 One may therefore speculate that by reducing the UPR and the associated ER stress, TDCA reduced miR-33 expression and thereby increased Osbpl6 and cholesterol export. Coherently, Abcb1a, another cholesterol efflux transporter whose expression is reduced by ER stress and miR-33,105 tended to be increased in C26 mice treated with TDCA (log2(fold-change) + 0.41, p = 0.012, padj = 0.15). Clinically, increased hepatic cholesterol may participate to the higher rate of insulin resistance and increased likelihood of new-onset diabetes among patients with a cancer diagnosis.106,107 As metabolic dysfunction in patients with cancer associates with increased recurrence and reduced overall survival,106 controlling hepatic cholesterol through secondary bile acids may yield therapeutic benefits.
In conclusion, our work highlights the functional role of the gut microbiota in the modulation of bile acid profile in cachectic mice (graphical abstract) and demonstrates the interest of the secondary bile acid TDCA, as a microbial cometabolite, in the hepatic disorders associated to cancer cachexia. Such results prompt the need for future preclinical and clinical trials investigating the breadth and translational value of our findings. We believe that this study uncovers a mechanistic link between the gut microbiota and host metabolism in cancer cachexia, and therefore constitutes a key step forward in the understanding of the inter-organ communication in this deadly disease. More broadly, our work may contribute to the better understanding of the impact of the gut microbiota on cholesterol metabolism in health and disease.
Supplementary Material
Acknowledgments
We thank Stéphanie Delieux and Bouazza Es Saadi for their skilled technical assistance and Dr Adeline Dolly, Dr Sarah Pötgens, and Dr Camille Lefevre their help during mouse experiments. We are grateful to Dr Isabelle Leclercq for granting us access to an anaerobic chamber. The MASSMET platform is acknowledged for the access to LC-MS/MS and LC-HRMS instruments. We also thank Dr Caroline Bouzin, Marine Olivier, Amélie Flandin and the IREC Imaging Platform (2IP) for assistance with histological analyses.
Funding Statement
This work was supported by the Fonds de la Recherche Scientifique – FNRS (F.R.S.-FNRS) and the Funds Suzanne Duchesne, Serge Rousseau and Docteur Jean Gérard, managed by the King Baudouin Foundation, as well as by the Walloon Region in the context of the funding of the strategic axis FRFS-WELBIO [40009849]. LBB is a Collen-Francqui Research Professor and grateful for the support of the Francqui Fondation. LBB is also the recipient of subsidies from the FSR [Action de Recherche Concertée (ARC) LIPOCAN, 19-24.096] and the Fonds Wetenschappelijk Onderzoek - Vlaanderen (FWO) and the Fonds de la Recherche Scientifique FNRS under EOS Project [No. 40007505]. MMT and JG are Postdoctoral Research Fellows and EP is a PhD Research Fellow from the F.R.S.-FNRS. AB is supported by the V Foundation for Cancer Research [V2017-021] and the American Cancer Society [Research Scholar Grant 132013-RSG-18-010-01-CCG]. The funders had no role in study design, data collection and analysis, interpretation of the results, decision to publish or preparation of the manuscript.
Disclosure statement
No potential conflict of interest was reported by the author(s).
Author contributions
Conception and design of the work: LBB and MMT. Data collection: MMT, MR, EP, JH, FP, AB and LBB. Data analysis and interpretation: MMT, MR, NMD, GGM, LBB. Acquisition of funding: NMD, GGM, LBB. Drafting the article: MMT, MR, and LBB. Setup of the 7α-DH activity: JG. Transcriptomics analyses: AL. Critical revision of the article: all. Final approval of the version to be published: all.
Data availability statement
Raw RNAseq sequencing data can be found on GEO (GEO ID GSE265876). Raw 16S rRNA gene sequences can be found in the SRA database (project ID: PRJNA1077894). The remaining data supporting the findings of this study are available within the article and its supplementary materials.
Supplementary material
Supplemental data for this article can be accessed online at https://doi.org/10.1080/19490976.2025.2449586
References
- 1.de Aguiar Vallim TQ, Tarling EJ, Edwards PA.. Pleiotropic roles of bile acids in metabolism. Cell Metab. 2013;17(5):657–26. doi: 10.1016/j.cmet.2013.03.013. [DOI] [PMC free article] [PubMed] [Google Scholar]
- 2.Thibaut MM, Bindels LB. Crosstalk between bile acid-activated receptors and microbiome in entero-hepatic inflammation. Trends Mol Med. 2022;28(3):223-236. https://pubmed.ncbi.nlm.nih.gov/35074252/ [DOI] [PubMed] [Google Scholar]
- 3.Chávez-Talavera O, Tailleux A, Lefebvre P, Staels B. Bile acid control of metabolism and inflammation in obesity, type 2 diabetes, dyslipidemia, and nonalcoholic fatty liver disease. Gastroenterology. 2017;152(7):1679–1694. e3. doi: 10.1053/j.gastro.2017.01.055. [DOI] [PubMed] [Google Scholar]
- 4.Guzior DV, Quinn RA. Review: microbial transformations of human bile acids. Microbiome. 2021;9(1):140. doi: 10.1186/s40168-021-01101-1. [DOI] [PMC free article] [PubMed] [Google Scholar]
- 5.Collins SL, Stine JG, Bisanz JE, Okafor CD, Patterson AD. Bile acids and the gut microbiota: metabolic interactions and impacts on disease. Nat Rev Microbiol. 2023;21(4):236–247. doi: 10.1038/s41579-022-00805-x. [DOI] [PubMed] [Google Scholar]
- 6.Ridlon JM, Gaskins HR. Another renaissance for bile acid gastrointestinal microbiology. Nat Rev Gastroenterol Hepatol. 2024;21(5):348–364. doi: 10.1038/s41575-024-00896-2. [DOI] [PMC free article] [PubMed] [Google Scholar]
- 7.Jones BV, Begley M, Hill C, Gahan CGM, Marchesi JR. Functional and comparative metagenomic analysis of bile salt hydrolase activity in the human gut microbiome. Proc Natl Acad Sci USA. 2008;105(36):13580–13585. doi: 10.1073/pnas.0804437105. [DOI] [PMC free article] [PubMed] [Google Scholar]
- 8.Song Z, Cai Y, Lao X, Wang X, Lin X, Cui Y, Kalavagunta PK, Liao J, Jin L, Shang J, et al. Taxonomic profiling and populational patterns of bacterial bile salt hydrolase (BSH) genes based on worldwide human gut microbiome. Microbiome. 2019;7(1):9. doi: 10.1186/s40168-019-0628-3. [DOI] [PMC free article] [PubMed] [Google Scholar]
- 9.White BA, Lipsky WRL, Fricke RJ, Hylemon PB. Bile acid induction specificity of 7α-dehydroxylase activity in an intestinal eubacterium species. Steroids. 1980;35(1):103–109. doi: 10.1016/0039-128X(80)90115-4. [DOI] [PubMed] [Google Scholar]
- 10.Funabashi M, Grove TL, Wang M, Varma Y, McFadden ME, Brown LC, Guo C, Higginbottom S, Almo SC, Fischbach MA, et al. A metabolic pathway for bile acid dehydroxylation by the gut microbiome. Nature. 2020;582(7813):566–570. doi: 10.1038/s41586-020-2396-4. [DOI] [PMC free article] [PubMed] [Google Scholar]
- 11.Ridlon JM, Hylemon PB. Identification and characterization of two bile acid coenzyme a transferases from Clostridium scindens, a bile acid 7α-dehydroxylating intestinal bacterium. J Lipid Res. 2012;53(1):66–76. doi: 10.1194/jlr.M020313. [DOI] [PMC free article] [PubMed] [Google Scholar]
- 12.Hirano S, Masuda N. Epimerization of the 7-hydroxy group of bile acids by the combination of two kinds of microorganisms with 7 alpha- and 7 beta-hydroxysteroid dehydrogenase activity, respectively. J Lipid Res. 1981;22(7):1060–1068. doi: 10.1016/S0022-2275(20)40663-7. [DOI] [PubMed] [Google Scholar]
- 13.Doden HL, Wolf PG, Gaskins HR, Anantharaman K, Alves JMP, Ridlon JM. Completion of the gut microbial epi-bile acid pathway. Gut Microbes. 2021;13(1):1–20. doi: 10.1080/19490976.2021.1907271. [DOI] [PMC free article] [PubMed] [Google Scholar]
- 14.Lee JW, Cowley ES, Wolf PG, Doden HL, Murai T, Caicedo KYO, Ly LK, Sun F, Takei H, Nittono H, et al. Formation of secondary allo-bile acids by novel enzymes from gut firmicutes. Gut Microbes. 2022;14(1):2132903. doi: 10.1080/19490976.2022.2132903. [DOI] [PMC free article] [PubMed] [Google Scholar]
- 15.Quinn RA, Melnik AV, Vrbanac A, Fu T, Patras KA, Christy MP, Bodai Z, Belda-Ferre P, Tripathi A, Chung LK, et al. Global chemical effects of the microbiome include new bile-acid conjugations. Nature. 2020;579(7797):123–129. doi: 10.1038/s41586-020-2047-9. [DOI] [PMC free article] [PubMed] [Google Scholar]
- 16.Guzior DV, Okros M, Shivel M, Armwald B, Bridges C, Fu Y, Martin C, Schilmiller AL, Miller WM, Ziegler KM, et al. Bile salt hydrolase acyltransferase activity expands bile acid diversity. Nature. 2024;626(8000):852–858. doi: 10.1038/s41586-024-07017-8. [DOI] [PubMed] [Google Scholar]
- 17.Rimal B, Collins SL, Tanes CE, Rocha ER, Granda MA, Solanki S, Hoque NJ, Gentry EC, Koo I, Reilly ER, et al. Bile salt hydrolase catalyses formation of amine-conjugated bile acids. Nature. 2024;626(8000):859–863. doi: 10.1038/s41586-023-06990-w. [DOI] [PMC free article] [PubMed] [Google Scholar]
- 18.Wahlström A, Sayin S, Marschall H-U, Bäckhed F. Intestinal crosstalk between bile acids and microbiota and its impact on host metabolism. Cell Metab. 2016;24(1):41–50. doi: 10.1016/j.cmet.2016.05.005. [DOI] [PubMed] [Google Scholar]
- 19.Simbrunner B, Trauner M, Reiberger T. Review article: therapeutic aspects of bile acid signalling in the gut-liver axis. Aliment Pharmacol Ther. 2021;54(10):1243–1262. doi: 10.1111/apt.16602. [DOI] [PMC free article] [PubMed] [Google Scholar]
- 20.Perino A, Demagny H, Velazquez-Villegas L, Schoonjans K. Molecular physiology of bile acid signaling in health, disease, and aging. Physiol Rev. 2021;101(2):683–731. doi: 10.1152/physrev.00049.2019. [DOI] [PubMed] [Google Scholar]
- 21.Rohm M, Zeigerer A, Machado J, Herzig S. Energy metabolism in cachexia. EMBO Rep. 2019;20(4):e47258. doi: 10.15252/embr.201847258. [DOI] [PMC free article] [PubMed] [Google Scholar]
- 22.Argilés JM, López-Soriano FJ, Stemmler B, Busquets S. Cancer-associated cachexia — understanding the tumour macroenvironment and microenvironment to improve management. Nat Rev Clin Oncol. 2023;20(4):250–264. doi: 10.1038/s41571-023-00734-5. [DOI] [PubMed] [Google Scholar]
- 23.Argiles JM, Stemmler B, López-Soriano FJ, Busquets S. Inter-tissue communication in cancer cachexia. Nat Rev Endocrinol. 2018;15(1):9–20. doi: 10.1038/s41574-018-0123-0. [DOI] [PubMed] [Google Scholar]
- 24.Swanton C, Bernard E, Abbosh C, André F, Auwerx J, Balmain A, Bar-Sagi D, Bernards R, Bullman S, DeGregori J, et al. Embracing cancer complexity: hallmarks of systemic disease. Cell. 2024;187(7):1589–1616. doi: 10.1016/j.cell.2024.02.009. [DOI] [PubMed] [Google Scholar]
- 25.Pryce BR, Wang DJ, Zimmers TA, Ostrowski MC, Guttridge DC. Cancer cachexia: involvement of an expanding macroenvironment. Cancer Cell. 2023;41(3):581–584. doi: 10.1016/j.ccell.2023.02.007. [DOI] [PMC free article] [PubMed] [Google Scholar]
- 26.Thibaut MM, Sboarina M, Roumain M, Pötgens SA, Neyrinck AM, Destrée F, Gillard J, Leclercq IA, Dachy G, Demoulin J-B, et al. Inflammation-induced cholestasis in cancer cachexia. J Cachexia Sarcopenia Muscle. 2021;12(1):70–90. doi: 10.1002/jcsm.12652. [DOI] [PMC free article] [PubMed] [Google Scholar]
- 27.Thibaut MM, Gillard J, Dolly A, Roumain M, Leclercq IA, Delzenne NM, Muccioli GG, Bindels LB. Bile acid dysregulation is intrinsically related to cachexia in tumor-bearing mice. Cancers (Basel). 2021;13(24):6389. doi: 10.3390/cancers13246389. [DOI] [PMC free article] [PubMed] [Google Scholar]
- 28.Trauner M, Fickert P, Stauber RE. Inflammation-induced cholestasis. J Gastroenterol Hepatol. 1999;14(10):946–959. doi: 10.1046/j.1440-1746.1999.01982.x. [DOI] [PubMed] [Google Scholar]
- 29.Kosters A, Karpen SJ. The role of inflammation in cholestasis: clinical and basic aspects. Semin Liver Dis. 2010;30(2):186–194. doi: 10.1055/s-0030-1253227. [DOI] [PMC free article] [PubMed] [Google Scholar]
- 30.Moseley RH. Sepsis and cholestasis. Clin Liver Dis. 2004;8(1):83–94. doi: 10.1016/S1089-3261(03)00134-X. [DOI] [PubMed] [Google Scholar]
- 31.Mulder J, Karpen, SJ, Tietge, UJ, Kuipers, F et al. Nuclear receptors: mediators and modifiers of inflammation-induced cholestasis. Front Biosci (Landmark Ed), 2009;14(14):2599–2630. doi: 10.2741/3400. https://pubmed.ncbi.nlm.nih.gov/19273222/ [DOI] [PMC free article] [PubMed] [Google Scholar]
- 32.Wagner M, Zollner G, Trauner M. Nuclear receptor regulation of the adaptive response of bile acid transporters in cholestasis. Semin Liver Dis. 2010;30(2):160–177. doi: 10.1055/s-0030-1253225. [DOI] [PubMed] [Google Scholar]
- 33.Bolder U, Ton-Nu HT, Schteingart CD, Frick E, Hofmann AF. Hepatocyte transport of bile acids and organic anions in endotoxemic rats: impaired uptake and secretion. Gastroenterology. 1997;112(1):214–225. doi: 10.1016/S0016-5085(97)70238-5. [DOI] [PubMed] [Google Scholar]
- 34.Bindels LB, Beck R, Schakman O, Martin JC, De Backer F, Sohet FM, Dewulf EM, Pachikian BD, Neyrinck AM, Thissen J-P, et al. Restoring specific lactobacilli levels decreases inflammation and muscle atrophy markers in an acute leukemia mouse model. PLOS ONE. 2012;7(6):e37971. doi: 10.1371/journal.pone.0037971. [DOI] [PMC free article] [PubMed] [Google Scholar]
- 35.Bindels LB, Neyrinck AM, Claus SP, Le Roy CI, Grangette C, Pot B, Martinez I, Walter J, Cani PD, Delzenne NM, et al. Synbiotic approach restores intestinal homeostasis and prolongs survival in leukaemic mice with cachexia. ISME J. 2016;10(6):1456. doi: 10.1038/ismej.2015.209. [DOI] [PMC free article] [PubMed] [Google Scholar]
- 36.Pötgens SA, Thibaut MM, Joudiou N, Sboarina M, Neyrinck AM, Cani PD, Claus SP, Delzenne NM, Bindels LB. Multi-compartment metabolomics and metagenomics reveal major hepatic and intestinal disturbances in cancer cachectic mice. J Cachexia Sarcopenia Muscle. 2021;12(2):456–475. doi: 10.1002/jcsm.12684. [DOI] [PMC free article] [PubMed] [Google Scholar]
- 37.Ni Y, Lohinai Z, Heshiki Y, Dome B, Moldvay J, Dulka E, Galffy G, Berta J, Weiss GJ, Sommer MOA, et al. Distinct composition and metabolic functions of human gut microbiota are associated with cachexia in lung cancer patients. ISME J. 2021;15(11):3207–3220. doi: 10.1038/s41396-021-00998-8. [DOI] [PMC free article] [PubMed] [Google Scholar]
- 38.Ubachs J, Ziemons J, Soons Z, Aarnoutse R, van Dijk DPJ, Penders J, van Helvoort A, Smidt ML, Kruitwagen RFPM, Baade‐Corpelijn L, et al. Gut microbiota and short-chain fatty acid alterations in cachectic cancer patients. J Cachexia Sarcopenia Muscle. 2021;12(6):2007–2021. doi: 10.1002/jcsm.12804. [DOI] [PMC free article] [PubMed] [Google Scholar]
- 39.Ziemons J, Smidt ML, Damink SO, Rensen SS. Gut microbiota and metabolic aspects of cancer cachexia. Best pract res Clin Endocrinol Metab. Best Pract Res Clin Endocrinol Metab. 2021;35(3):101508. doi: 10.1016/j.beem.2021.101508. [DOI] [PubMed] [Google Scholar]
- 40.Bonetto A, Andersson DC, Waning DL. Assessment of muscle mass and strength in mice. Bonekey Rep. 2015;4:732. doi: 10.1038/bonekey.2015.101. [DOI] [PMC free article] [PubMed] [Google Scholar]
- 41.Bonetto A, Rupert JE, Barreto R, Zimmers TA. The colon-26 carcinoma tumor-bearing mouse as a model for the study of cancer cachexia. J Visualized Experiments: JoVE. 2016;2016(117). doi: 10.3791/54893-v. [DOI] [PMC free article] [PubMed] [Google Scholar]
- 42.Quante M, Iske J, Uehara H, Minami K, Nian Y, Maenosono R, Matsunaga T, Liu Y, Azuma H, Perkins D, et al. Taurodeoxycholic acid and valine reverse obesity-associated augmented alloimmune responses and prolong allograft survival. Am J Transpl. 2022;22(2):402–413. doi: 10.1111/ajt.16856. [DOI] [PMC free article] [PubMed] [Google Scholar]
- 43.Choi HJ, Yun J-W, Kim Y-H, Kwon E, Hyon M-K, Kim JY, Che J-H, Ho Kim W, Seong S-Y, Kang B-C, et al. Evaluation of acute and subacute toxicity of sodium taurodeoxycholate in rats. Drug Chem Toxicol. 2021;44(3):268–276. doi: 10.1080/01480545.2019.1609493. [DOI] [PubMed] [Google Scholar]
- 44.Huot JR, Pin F, Essex AL, Bonetto A. MC38 tumors induce musculoskeletal defects in colorectal cancer. IJMS. 2021;22(3):1486. doi: 10.3390/ijms22031486. [DOI] [PMC free article] [PubMed] [Google Scholar]
- 45.Huot JR, Novinger LJ, Pin F, Bonetto A. HCT116 colorectal liver metastases exacerbate muscle wasting in a mouse model for the study of colorectal cancer cachexia. Dis Model Mech. 2020;13(1). doi: 10.1242/dmm.043166. [DOI] [PMC free article] [PubMed] [Google Scholar]
- 46.Costea PI, Zeller G, Sunagawa S, Pelletier E, Alberti A, Levenez F, Tramontano M, Driessen M, Hercog R, Jung F-E, et al. Towards standards for human fecal sample processing in metagenomic studies. Nat Biotechnol. 2017;35(11):1069–1076. doi: 10.1038/nbt.3960. [DOI] [PubMed] [Google Scholar]
- 47.Ovreås L, Forney L, Daae FL, Torsvik V. Distribution of bacterioplankton in meromictic Lake Saelenvannet, as determined by denaturing gradient gel electrophoresis of pcr-amplified gene fragments coding for 16S rRNA. Appl Environ Microbiol. 1997;63(9):3367–3373. doi: 10.1128/aem.63.9.3367-3373.1997. [DOI] [PMC free article] [PubMed] [Google Scholar]
- 48.Eren AM, Vineis JH, Morrison HG, Sogin ML. A filtering method to generate high quality short reads using illumina paired-end technology. PLOS ONE. 2013;8(6):e66643. doi: 10.1371/journal.pone.0066643. [DOI] [PMC free article] [PubMed] [Google Scholar]
- 49.Edgar RC. UPARSE: highly accurate OTU sequences from microbial amplicon reads. Nat Methods. 2013;10(10):996–998. doi: 10.1038/nmeth.2604. [DOI] [PubMed] [Google Scholar]
- 50.Edgar R. UNOISE2: improved error-correction for illumina 16S and ITS amplicon sequencing. 2016. bioRxiv.https://www.biorxiv.org/content/10.1101/081257v1 [Google Scholar]
- 51.Callahan BJ, McMurdie PJ, Holmes SP. Exact sequence variants should replace operational taxonomic units in marker-gene data analysis. ISME J. 2017;11(12):2639–2643. doi: 10.1038/ismej.2017.119. [DOI] [PMC free article] [PubMed] [Google Scholar]
- 52.Edgar RC. Accuracy of taxonomy prediction for 16S rRNA and fungal ITS sequences. PeerJ. 2018;6:p. e4652. doi: 10.7717/peerj.4652. [DOI] [PMC free article] [PubMed] [Google Scholar]
- 53.Wang Q, Garrity GM, Tiedje JM, Cole JR. Naive bayesian Classifier for rapid assignment of rRNA sequences into the New bacterial taxonomy. Appl Environ Microbiol. 2007;73(16):5261–5267. doi: 10.1128/AEM.00062-07. [DOI] [PMC free article] [PubMed] [Google Scholar]
- 54.Yoon SH, Ha S-M, Kwon S, Lim J, Kim Y, Seo H, Chun J. Introducing EzBioCloud: a taxonomically united database of 16S rRNA gene sequences and whole-genome assemblies. Int J Syst Evol Microbiol. 2017;67(5):1613–1617. doi: 10.1099/ijsem.0.001755. [DOI] [PMC free article] [PubMed] [Google Scholar]
- 55.Caporaso JG, Kuczynski J, Stombaugh J, Bittinger K, Bushman FD, Costello EK, Fierer N, Peña AG, Goodrich JK, Gordon JI, et al. QIIME allows analysis of high-throughput community sequencing data. Nat Methods. 2010;7(5):335–336. doi: 10.1038/nmeth.f.303. [DOI] [PMC free article] [PubMed] [Google Scholar]
- 56.Schloss PD, Westcott SL, Ryabin T, Hall JR, Hartmann M, Hollister EB, Lesniewski RA, Oakley BB, Parks DH, Robinson CJ, et al. Introducing mothur: open-source, platform-independent, community-supported software for describing and comparing microbial communities. Appl Environ Microbiol. 2009;75(23):7537–7541. doi: 10.1128/AEM.01541-09. [DOI] [PMC free article] [PubMed] [Google Scholar]
- 57.Gloor GB, Macklaim JM, Pawlowsky-Glahn V, Egozcue JJ. Microbiome datasets are compositional: and this is not optional. Front Microbiol. 2017;8:2224. doi: 10.3389/fmicb.2017.02224. [DOI] [PMC free article] [PubMed] [Google Scholar]
- 58.Rohart F, Gautier B, Singh A, Lê Cao K-A. mixOmics: an R package for ‘omics feature selection and multiple data integration. PLOS Comput Biol. 2017;13(11):e1005752. doi: 10.1371/journal.pcbi.1005752. [DOI] [PMC free article] [PubMed] [Google Scholar]
- 59.Oksanen J, Simpson, G, Blanchet, F, Kindt R, Legendre P, Minchin P, O’Hara R, Solymos P, Stevens M, Szoecs E, et al. _vegan: Community Ecology Package_. R package version 2.6-6.1, 2024. <https://CRAN.R-project.org/package=vegan> [Google Scholar]
- 60.Mallick H, Rahnavard A, McIver LJ, Ma S, Zhang Y, Nguyen LH, Tickle TL, Weingart G, Ren B, Schwager EH, et al. Multivariable association discovery in population-scale meta-omics studies. PLOS Comput Biol. 2021;17(11):e1009442. doi: 10.1371/journal.pcbi.1009442. [DOI] [PMC free article] [PubMed] [Google Scholar]
- 61.Benjamini Y, Hochberg Y. Controlling the false discovery rate - a practical and powerful approach to multiple testing. J R Statist Soc Ser B. 1995;57(1):289–300. doi: 10.1111/j.2517-6161.1995.tb02031.x. [DOI] [Google Scholar]
- 62.Thomas LA, King A, French GL, Murphy GM, Dowling RH. Cholylglycine hydrolase and 7α-dehydroxylase. Clin Chim Acta. 1997;268(1–2):61–72. doi: 10.1016/S0009-8981(97)00169-1. [DOI] [PubMed] [Google Scholar]
- 63.Gillard J, Roumain, M, Picalausa, C, Thibaut, MM, Clerbaux, LA, Tailleux, A, Staels, B, Muccioli, GG, Bindels, LB, Leclercq, IA. A gut microbiota-independent mechanism shapes the bile acid pool in mice with MASH. JHEP Reports; 2024. [DOI] [PMC free article] [PubMed] [Google Scholar]
- 64.Guillemot-Legris O, Mutemberezi V, Cani PD, Muccioli GG. Obesity is associated with changes in oxysterol metabolism and levels in mice liver, hypothalamus, adipose tissue and plasma. Sci Rep. 2016;6(1):19694. doi: 10.1038/srep19694. [DOI] [PMC free article] [PubMed] [Google Scholar]
- 65.Bolger AM, Lohse M, Usadel B. Trimmomatic: a flexible trimmer for Illumina sequence data. Bioinformatics. 2014;30(15):2114–2120. doi: 10.1093/bioinformatics/btu170. [DOI] [PMC free article] [PubMed] [Google Scholar]
- 66.Kim D, Langmead B, Salzberg SL. HISAT: a fast spliced aligner with low memory requirements. Nat Methods. 2015;12(4):357–360. doi: 10.1038/nmeth.3317. [DOI] [PMC free article] [PubMed] [Google Scholar]
- 67.Liao Y, Smyth GK, Shi W. featureCounts: an efficient general purpose program for assigning sequence reads to genomic features. Bioinformatics. 2014;30(7):923–930. doi: 10.1093/bioinformatics/btt656. [DOI] [PubMed] [Google Scholar]
- 68.Love MI, Huber W, Anders S. Moderated estimation of fold change and dispersion for rna-seq data with DESeq2. Genome Biol. 2014;15(12):550. doi: 10.1186/s13059-014-0550-8. [DOI] [PMC free article] [PubMed] [Google Scholar]
- 69.Yu G, Wang L-G, Han Y, He Q-Y. clusterProfiler: an R package for comparing biological themes among gene clusters. Omics. 2012;16(5):284–287. doi: 10.1089/omi.2011.0118. [DOI] [PMC free article] [PubMed] [Google Scholar]
- 70.Folch J, Lees M, Stanley GHS. A simple method for the isolation and purification of total lipides from animal tissues. J Biol Chem. 1957;226(1):497–509. doi: 10.1016/S0021-9258(18)64849-5. [DOI] [PubMed] [Google Scholar]
- 71.García-Cañaveras JC, Donato MT, Castell JV, Lahoz A. Targeted profiling of circulating and hepatic bile acids in human, mouse, and rat using a UPLC-MRM-MS-validated method. J Lipid Res. 2012;53(10):2231–2241. doi: 10.1194/jlr.D028803. [DOI] [PMC free article] [PubMed] [Google Scholar]
- 72.Strandvik B, Wahlén E, Wikström SA. The urinary bile acid excretion in healthy premature and full-term infants during the neonatal period. Scand J Clin Lab Invest. 1994;54(1):1–10. doi: 10.3109/00365519409086503. [DOI] [PubMed] [Google Scholar]
- 73.Shoda J, Tanaka N, Osuga T, Matsuura K, Miyazaki H. Altered bile acid metabolism in liver disease: concurrent occurrence of C-1 and C-6 hydroxylated bile acid metabolites and their preferential excretion into urine. J Lipid Res. 1990;31(2):249–259. doi: 10.1016/S0022-2275(20)43210-9. [DOI] [PubMed] [Google Scholar]
- 74.Lucas LN, Barrett K, Kerby RL, Zhang Q, Cattaneo LE, Stevenson D, Rey FE, Amador-Noguez D. Dominant bacterial phyla from the human Gut show widespread ability to transform and conjugate bile acids. mSystems. 2021;6(4):e0080521. doi: 10.1128/msystems.00805-21. [DOI] [PubMed] [Google Scholar]
- 75.Hitch TCA, Bisdorf K, Afrizal A, Riedel T, Overmann J, Strowig T, Clavel T. A taxonomic note on the genus prevotella: description of four novel genera and emended description of the genera hallella and Xylanibacter. Syst Appl Microbiol. 2022;45(6):126354. doi: 10.1016/j.syapm.2022.126354. [DOI] [PubMed] [Google Scholar]
- 76.Doden H, Sallam LA, Devendran S, Ly L, Doden G, Daniel SL, Alves JMP, Ridlon JM. Metabolism of oxo-bile acids and characterization of recombinant 12α-hydroxysteroid dehydrogenases from bile acid 7α-dehydroxylating human gut bacteria. Appl Environ Microbiol. 2018;84(10):84(10. doi: 10.1128/AEM.00235-18. [DOI] [PMC free article] [PubMed] [Google Scholar]
- 77.Perino A, Velázquez-Villegas LA, Bresciani N, Sun Y, Huang Q, Fénelon VS, Castellanos-Jankiewicz A, Zizzari P, Bruschetta G, Jin S, et al. Central anorexigenic actions of bile acids are mediated by TGR5. Nat Metab. 2021;3(5):595–603. doi: 10.1038/s42255-021-00398-4. [DOI] [PMC free article] [PubMed] [Google Scholar]
- 78.Pellicciari R, Gioiello A, Macchiarulo A, Thomas C, Rosatelli E, Natalini B, Sardella R, Pruzanski M, Roda A, Pastorini E, et al. Discovery of 6α-ethyl-23(S)-methylcholic acid (S -EMCA, INT-777) as a potent and selective agonist for the TGR5 receptor, a novel target for diabesity. J Med Chem. 2009;52(24):7958–7961. doi: 10.1021/jm901390p. [DOI] [PubMed] [Google Scholar]
- 79.Thomas C, Gioiello A, Noriega L, Strehle A, Oury J, Rizzo G, Macchiarulo A, Yamamoto H, Mataki C, Pruzanski M, et al. TGR5-mediated bile acid sensing controls glucose homeostasis. Cell Metab. 2009;10(3):167–177. doi: 10.1016/j.cmet.2009.08.001. [DOI] [PMC free article] [PubMed] [Google Scholar]
- 80.Honda A, Miyazaki T, Iwamoto J, Hirayama T, Morishita Y, Monma T, Ueda H, Mizuno S, Sugiyama F, Takahashi S, et al. Regulation of bile acid metabolism in mouse models with hydrophobic bile acid composition. J Lipid Res. 2020;61(1):54–69. doi: 10.1194/jlr.RA119000395. [DOI] [PMC free article] [PubMed] [Google Scholar]
- 81.Narushima S, Itoh K, Miyamoto Y, Park S-H, Nagata K, Kuruma K, Uchida K. Deoxycholic acid formation in gnotobiotic mice associated with human intestinal bacteria. Lipids. 2006;41(9):835–843. doi: 10.1007/s11745-006-5038-1. [DOI] [PubMed] [Google Scholar]
- 82.Hildebrand F, Pallen MJ, Bork P. Towards standardisation of naming novel prokaryotic taxa in the age of high-throughput microbiology. Gut. 2020;69(7):1358.1–1359. doi: 10.1136/gutjnl-2019-319045. [DOI] [PMC free article] [PubMed] [Google Scholar]
- 83.Gilroy R, Ravi A, Getino M, Pursley I, Horton DL, Alikhan N-F, Baker D, Gharbi K, Hall N, Watson M, et al. Extensive microbial diversity within the chicken gut microbiome revealed by metagenomics and culture. PeerJ. 2021;9:e10941. doi: 10.7717/peerj.10941. [DOI] [PMC free article] [PubMed] [Google Scholar]
- 84.Jiang B, Yuan G, Wu J, Wu Q, Li L, Jiang P. Prevotella copri ameliorates cholestasis and liver fibrosis in primary sclerosing cholangitis by enhancing the FXR signalling pathway. Biochim Biophys Acta Mol Basis Dis. 2022;1868(3):166320. doi: 10.1016/j.bbadis.2021.166320. [DOI] [PubMed] [Google Scholar]
- 85.Chen IMA, Chu K, Palaniappan K, Ratner A, Huang J, Huntemann M, Hajek P, Ritter S, Webb C, Wu D, et al. The IMG/M data management and analysis system v.7: content updates and new features. Nucleic Acids Res. 2023;51(D1):D723–D732. doi: 10.1093/nar/gkac976. [DOI] [PMC free article] [PubMed] [Google Scholar]
- 86.Kanehisa M, Sato Y, Morishima K. BlastKOALA and GhostKOALA: KEGG tools for functional characterization of genome and metagenome sequences. J Mol Biol. 2016;428(4):726–731. doi: 10.1016/j.jmb.2015.11.006. [DOI] [PubMed] [Google Scholar]
- 87.Streidl T, Karkossa I, Segura Muñoz RR, Eberl C, Zaufel A, Plagge J, Schmaltz R, Schubert K, Basic M, Schneider KM, et al. The gut bacterium Extibacter muris produces secondary bile acids and influences liver physiology in gnotobiotic mice. Gut Microbes. 2021;13(1):1–21. doi: 10.1080/19490976.2020.1854008. [DOI] [PMC free article] [PubMed] [Google Scholar]
- 88.Ridlon JM, Harris SC, Bhowmik S, Kang D-J, Hylemon PB. Consequences of bile salt biotransformations by intestinal bacteria. Gut Microbes. 2016;7(1):22–39. doi: 10.1080/19490976.2015.1127483. [DOI] [PMC free article] [PubMed] [Google Scholar]
- 89.Li T, Ding N, Guo H, Hua R, Lin Z, Tian H, Yu Y, Fan D, Yuan Z, Gonzalez FJ, et al. A gut microbiota-bile acid axis promotes intestinal homeostasis upon aspirin-mediated damage. Cell Host & Microbe. 2024;32(2):191–208.e9. doi: 10.1016/j.chom.2023.12.015. [DOI] [PMC free article] [PubMed] [Google Scholar]
- 90.Makishima M, Lu TT, Xie W, Whitfield GK, Domoto H, Evans RM, Haussler MR, Mangelsdorf DJ. Vitamin D receptor as an intestinal bile acid sensor. Science. 2002;296(5571):1313–1316. doi: 10.1126/science.1070477. [DOI] [PubMed] [Google Scholar]
- 91.Li N, Ma P, Li Y, Shang X, Nan X, Shi L, Han X, Liu J, Hong Y, Li Q, et al. Gut microbiota-derived 12-ketolithocholic acid suppresses the IL-17A secretion from colonic group 3 innate lymphoid cells to prevent the acute exacerbation of ulcerative colitis. Gut Microbes. 2023;15(2):2290315. doi: 10.1080/19490976.2023.2290315. [DOI] [PMC free article] [PubMed] [Google Scholar]
- 92.Bindels LB, Neyrinck AM, Loumaye A, Catry E, Walgrave H, Cherbuy C, Leclercq S, Van Hul M, Plovier H, Pachikian B, et al. Increased gut permeability in cancer cachexia: mechanisms and clinical relevance. Oncotarget. 2018;9(26):18224–18238. doi: 10.18632/oncotarget.24804. [DOI] [PMC free article] [PubMed] [Google Scholar]
- 93.Gillard J, Leclercq IA. Biological tuners to reshape the bile acid pool for therapeutic purposes in non-alcoholic fatty liver disease. Clin Sci (Lond). 2023;137(1):65–85. doi: 10.1042/CS20220697. [DOI] [PMC free article] [PubMed] [Google Scholar]
- 94.Chen H, Ma J, Ma X. Administration of tauroursodeoxycholic acid attenuates dexamethasone-induced skeletal muscle atrophy. Biochem Biophys Res Commun. 2021;570:96–102. doi: 10.1016/j.bbrc.2021.06.102. [DOI] [PubMed] [Google Scholar]
- 95.Tamai Y, Eguchi A, Shigefuku R, Kitamura H, Tempaku M, Sugimoto R, Kobayashi Y, Iwasa M, Takei Y, Nakagawa H, et al. Association of lithocholic acid with skeletal muscle hypertrophy through TGR5-IGF-1 and skeletal muscle mass in cultured mouse myotubes, chronic liver disease rats and humans. Elife. 2022;11:11. doi: 10.7554/eLife.80638. [DOI] [PMC free article] [PubMed] [Google Scholar]
- 96.Sun L, Li F, Tan W, Zhao W, Li Y, Zhu X, Gao P, Shu G, Wang S, Jiang Q, et al. Lithocholic acid promotes skeletal muscle regeneration through the TGR5 receptor. Acta Biochim Biophys Sin (Shanghai). 2023;55(1):51–61. doi: 10.3724/abbs.2022201. [DOI] [PMC free article] [PubMed] [Google Scholar]
- 97.Abrigo J, Gonzalez F, Aguirre F, Tacchi F, Gonzalez A, Meza MP, Simon F, Cabrera D, Arrese M, Karpen S, et al. Cholic acid and deoxycholic acid induce skeletal muscle atrophy through a mechanism dependent on TGR5 receptor. J Cell Physiol. 2021;236(1):260–272. doi: 10.1002/jcp.29839. [DOI] [PubMed] [Google Scholar]
- 98.Theiler-Schwetz V, Zaufel A, Schlager H, Obermayer-Pietsch B, Fickert P, Zollner G. Bile acids and glucocorticoid metabolism in health and disease. Biochim Biophys Acta Mol Basis Dis. 2019;1865(1):243–251. doi: 10.1016/j.bbadis.2018.08.001. [DOI] [PubMed] [Google Scholar]
- 99.Peeters B, Boonen, E, Langouche, L, Van den Berghe, G. The HPA axis response to critical illness: new study results with diagnostic and therapeutic implications. Vol. 408. Mol Cell Endocrinol; 2015. p. 235–240. [DOI] [PubMed] [Google Scholar]
- 100.Waddell DS, Baehr LM, van den Brandt J, Johnsen SA, Reichardt HM, Furlow JD, Bodine SC. The glucocorticoid receptor and FOXO1 synergistically activate the skeletal muscle atrophy-associated MuRF1 gene. Am J Physiol Endocrinol Metab. 2008;295(4):E785–97. doi: 10.1152/ajpendo.00646.2007. [DOI] [PMC free article] [PubMed] [Google Scholar]
- 101.Groen AK, Bloks VW, Verkade H, Kuipers F. Cross-talk between liver and intestine in control of cholesterol and energy homeostasis. Mol Aspects Med. 2014;37:77–88. doi: 10.1016/j.mam.2014.02.001. [DOI] [PubMed] [Google Scholar]
- 102.Ouimet M, Hennessy EJ, van Solingen C, Koelwyn GJ, Hussein MA, Ramkhelawon B, Rayner KJ, Temel RE, Perisic L, Hedin U, et al. miRNA targeting of oxysterol-binding protein-like 6 regulates cholesterol trafficking and Efflux. Arterioscler Thromb Vasc Biol. 2016;36(5):942–951. doi: 10.1161/ATVBAHA.116.307282. [DOI] [PMC free article] [PubMed] [Google Scholar]
- 103.Gerin I, Clerbaux L-A, Haumont O, Lanthier N, Das AK, Burant CF, Leclercq IA, MacDougald OA, Bommer GT. Expression of miR-33 from an SREBP2 intron inhibits cholesterol export and fatty acid oxidation. J Biol Chem. 2010;285(44):33652–33661. doi: 10.1074/jbc.M110.152090. [DOI] [PMC free article] [PubMed] [Google Scholar]
- 104.Sun Y, Zhang D, Liu X, Li X, Liu F, Yu Y, Jia S, Zhou Y, Zhao Y. Endoplasmic reticulum stress affects lipid metabolism in atherosclerosis via CHOP activation and over-expression of miR-33. Cell Physiol Biochem. 2018;48(5):1995–2010. doi: 10.1159/000492522. [DOI] [PubMed] [Google Scholar]
- 105.Röhrl C, Eigner K, Winter K, Korbelius M, Obrowsky S, Kratky D, Kovacs WJ, Stangl H. Endoplasmic reticulum stress impairs cholesterol efflux and synthesis in hepatic cells. J Lipid Res. 2014;55(1):94–103. doi: 10.1194/jlr.M043299. [DOI] [PMC free article] [PubMed] [Google Scholar]
- 106.Màrmol JM, Carlsson M, Raun SH, Grand MK, Sørensen J, Lang Lehrskov L, Richter EA, Norgaard O, Sylow L. Insulin resistance in patients with cancer: a systematic review and meta-analysis. Acta Oncol. 2023;62(4):364–371. doi: 10.1080/0284186X.2023.2197124. [DOI] [PubMed] [Google Scholar]
- 107.Sylow L, Grand MK, von Heymann A, Persson F, Siersma V, Kriegbaum M, Lykkegaard Andersen C, Johansen C. Incidence of new-onset type 2 diabetes after cancer: a Danish cohort study. Diabetes Care. 2022;45(6):e105–e106. doi: 10.2337/dc22-0232. [DOI] [PubMed] [Google Scholar]
Associated Data
This section collects any data citations, data availability statements, or supplementary materials included in this article.
Supplementary Materials
Data Availability Statement
Raw RNAseq sequencing data can be found on GEO (GEO ID GSE265876). Raw 16S rRNA gene sequences can be found in the SRA database (project ID: PRJNA1077894). The remaining data supporting the findings of this study are available within the article and its supplementary materials.