Abstract
In multicellular organisms, constituent cells depend on extracellular signals for growth, proliferation, and survival. When cells are withdrawn from growth factors, they undergo apoptosis. Expression of constitutively active forms of the serine/threonine kinase Akt/PKB can prevent apoptosis upon growth factor withdrawal. Akt-mediated survival depends in part on the maintenance of glucose metabolism, suggesting that reduced glucose utilization contributes to growth factor withdrawal-induced death. However, it is unclear how restricting access to extracellular glucose alone would lead to the metabolic collapse observed after growth factor withdrawal. We report herein that growth factor withdrawal results in the loss of surface transporters for not only glucose but also amino acids, low-density lipoprotein, and iron. This coordinated decline in transporters and receptors for extracellular molecules creates a catabolic state characterized by atrophy and a decline in the mitochondrial membrane potential. Activated forms of Akt maintained these transporters on the cell surface in the absence of growth factor through an mTOR-dependent mechanism. The mTOR inhibitor rapamycin diminished Akt-mediated increases in cell size, mitochondrial membrane potential, and cell survival. These results suggest that growth factors control cellular growth and survival by regulating cellular access to extracellular nutrients in part by modulating the activity of Akt and mTOR.
INTRODUCTION
Dependence on extracellular growth factors is one mechanism by which multicellular organisms regulate the growth and survival of their constituent cells (Raff, 1992, 1996; Conlon and Raff, 1999). When growth factors are withdrawn, cells undergo programmed cell death. Mitochondria play a central role in this form of apoptosis. Altered mitochondrial permeability leads to the release of proapoptotic factors such as cytochrome c, apoptosis-inducing factor, and Smac/Diablo into the cytosol where they participate in cellular destruction (Matsuyama and Reed, 2000; Talapatra and Thompson, 2001). The mechanism by which these apoptotic mediators are released is controversial. However, mitochondrial metabolism is linked to cytosolic metabolism and the decline in glucose uptake and glycolysis that occurs upon growth factor withdrawal may negatively impact mitochondrial homeostasis (Plas and Thompson, 2002). A decline in mitochondrial membrane potential (Δψm) accompanies growth factor withdrawal (Vander Heiden et al., 1999), and this change may reflect an increased susceptibility to further disruptions in mitochondrial physiology.
Neoplastic cells, in contrast, do not initiate the apoptotic cascade upon growth factor withdrawal, but continue to increase their mass and divide. PI3 kinase (PI3K) lies downstream of many growth factor receptors, and genes in this signal transduction pathway are involved in a variety of human cancers (Blume-Jensen and Hunter, 2001). The phosphatase PTEN negatively regulates signaling through the PI3K pathway and is deleted in multiple human cancers, including glioblastomas and prostatic and ovarian carcinomas (Mills et al., 2001) and can promote tumor progression in animal models (Kwabi-Addo et al., 2001). Activating mutations or gene amplification of the Akt kinase have been described in a handful of human tumors, and Akt is hyperactive in PTEN-deficient cells (Mills et al., 2001). Recent reports have shown that inhibitors of the downstream effects of Akt slow growth in PTEN-deficient tumors (Aoki et al., 2001; Neshat et al., 2001; Podsypanina et al., 2001). Akt has been shown to phosphorylate and inactivate several proapoptotic mediators such as BAD, caspase 9, and the Forkhead transcription factors (Datta et al., 1999; Testa and Bellacosa, 2001). However, the prosurvival function of activated Akt is dependent in part on its stimulatory effect on glucose metabolism because Akt-mediated cellular survival is decreased in medium containing limiting levels of glucose (Gottlob et al., 2001; Plas et al., 2001). Akt directly regulates glycolysis by increasing surface expression of glucose transporters, stimulating the mitochondrial association of hexokinase, and by phosphorylating PFK2 thereby increasing the production of fructose 2,6-bisphosphate, a key allosteric regulator of glycolysis (Kandel and Hay, 1999; Gottlob et al., 2001).
Despite the negative effects of growth factor depletion on glucose metabolism (Whetton et al., 1984; Kan et al., 1994; Garland and Halestrap, 1997; Rathmell et al., 2000; Plas et al., 2001; Vander Heiden et al., 2001) and the correlation between Akt-mediated survival and glucose availability (Gottlob et al., 2001; Plas et al., 2001), it is not clear how disruption of glucose metabolism alone could sufficiently perturb cellular physiology to initiate apoptosis. For example, amino acid oxidation can support mitochondrial metabolism in the absence of glucose, and lymphocytes readily use glutamine for energy production (Brand et al., 1986; Bental and Deutsch, 1993). Our results show that growth factors promote cellular uptake of not only glucose but also of multiple extracellular molecules required for metabolic homeostasis and cell growth. On growth factor withdrawal, cellular access to amino acids, cholesterol in the form of low-density lipoprotein (LDL) particles, and iron-bound transferrin decreased due to the down-regulation of the relevant transporters and receptors. Consistent with its role in growth factor signaling, the expression of activated Akt mitigated the decrease in surface levels of these proteins. The protective effect of activated Akt on surface expression of nutrient transporters and receptors was sensitive to rapamycin, a specific inhibitor of the downstream kinase mTOR. The connection between access to nutrients and cellular atrophy and survival is supported by the observation that rapamycin not only affected expression of transporters and receptors but also decreased the size, survival, and mitochondrial membrane potential of cells expressing activated Akt during growth factor withdrawal. Taken together, these results suggest that growth factors control cellular growth and survival by regulating nutrient uptake from the extracellular milieu.
MATERIALS AND METHODS
Materials
Doxycycline and carbonyl cyanide m-chlorophenyl-hydrazone (CCCP) were obtained from Sigma-Aldrich (St. Louis, MO), and rapamycin was purchased from Calbiochem (San Diego, CA). Antibodies were purchased from the following companies: Glut1 (RDI Diagnostics, Flanders, NJ); actin and anti-goat horseradish peroxidase (Santa Cruz Biotechnology, Santa Cruz, CA); anti-rabbit horseradish peroxidase conjugate (Cell Signaling Technology, Beverly, MA); and 4F2hc, lysosomal-associated membrane protein-1 (LAMP-1), and transferrin receptor (BD PharMingen, San Diego, CA). Tetramethylrhodamine ethyl ester (TMRE), DiI-LDL, propidium iodide, Hoechst 33342, and 4,6-diamidino-2-phenylindole were from Molecular Probes (Eugene, OR). The tritiated amino acid mixture was from Amersham Biosciences (Piscataway, NJ). The bicinchoninic acid protein assay kit (Pierce Chemical, Rockford, IL) was used to determine total protein in cell lysates.
Cell Culture
FL5.12 cells were maintained in RPMI supplemented with 10% fetal calf serum (FCS), 10% WEHI conditioned medium, 10 mM HEPES, 55 μM β-mercaptoethanol, antibiotics, and l-glutamine. All experiments were conducted in media containing 500 pg/ml recombinant interleukin-3 (IL3) (BD PharMingen). Bcl-xL was stably expressed where indicated. Myristoylated Akt (myrAkt) is composed of murine Akt-1 with the src myristoylation sequence fused to the N terminus and a C-terminal hemagglutinin (HA)-tag. MyrAkt expression was rendered doxycycline inducible by using the pRevTRE system (CLONTECH, Palo Alto, CA). MyrAkt expression was induced by overnight treatment with 1 μg/ml doxycycline. Bcl-xL levels were matched in control cells and in cells also expressing myrAkt. The E40K murine Akt-1 mutant (Malstrom et al., 2001) was kindly provided by Dr. P. Tsichlis (Kimmel Cancer Center, Thomas Jefferson University, Philadelphia, PA) and cloned into the EF6 vector (Invitrogen, Carlsbad, CA).
Western Blotting
Cells were washed with phosphate-buffered saline (PBS) and lysed in radioimmunoprecipitation assay buffer containing protease inhibitors (Complete; Roche Applied Science, Indianapolis, IN). After a 10-min incubation on ice, lysates were spun at 14,000 rpm at 4°C and the insoluble pellet discarded. Equivalent amounts of total cell protein (10 μg) was loaded onto 8% Tris-glycine SDS-PAGE gels (Invitrogen). Proteins were transferred to nitrocellulose, and membranes were blocked with BLOTTO (5% nonfat dry milk and 0.1% Tween 20 in PBS) and incubated with the indicated antibodies before probing with enhanced chemiluminescence reagent (Amersham Biosciences).
Flow Cytometry and Measurement of Cell Size
To examine mitochondrial membrane potential, TMRE was added to cells in media to a final concentration of 20 nM and incubated for 30 min at 37°C. CCCP was added to duplicate tubes to a final concentration of 50 μM to collapse Δψm and thus determine background staining. Cell viability and size were analyzed using FACSCalibur or LSR cytometer (BD Biosciences). Propidium iodide (PI, 10 μg/ml; Molecular Probes) was added to cells in media before flow cytometry to determine cell viability. Cells were maintained continuously in culture media to avoid artifactual changes in cell size. For cell cycle analysis, cells were incubated in media containing 10 μg/ml Hoechst 33342 (Molecular Probes) and 10 μg/ml PI for 30 min at 37°C and analyzed on the LSR cytometer. Staining for surface transferrin receptor was performed on live cells maintained on ice in PBS containing 2% FCS and 0.05% NaN3.
Fluorescence Microscopy
FL5.12 cells were fixed for 10 min in 1% paraformaldehyde in PBS. Cells were washed with wash buffer (2% FCS and 0.03% saponin in PBS) then incubated sequentially with primary and secondary antibodies for 30 min at room temperature in wash buffer containing 0.3% saponin. DiI-LDL staining was performed on 5 × 10⁵ live cells washed once with binding buffer (20 mM HEPES, 140 mM NaCl, 2 mM CaCl2, 1 mg/ml d-glucose, and 10 mM KCl, pH 7.5) and resuspended in 100 μl of binding buffer. Two microliters of DiI-LDL were added and cells were incubated for 1 h on ice then washed twice with ice-cold buffer and fixed in 1% paraformaldehyde PBS. Cells were evaluated on an E800 fluorescence microscope (Nikon, Tokyo, Japan) equipped with a charge-coupled device camera and images stored using the MetaMorph software package (Universal Imaging, West Chester, PA).
Amino Acid Uptake Assays
The amino acid uptake protocol of Iiboshi et al. (1999) was adapted for use in FL5.12 cells. FL5.12 cells expressing Bcl-xL and myrAkt as indicated were incubated with or without IL3 and rapamycin for 24 h, washed with PBS, resuspended in uptake buffer (5.4 mM KCl, 140 mM NaCl, 1.8 mM CaCl2, 0.8 mM MgSO4, 5 mM d-glucose, 25 mM HEPES, and 25 mM Tris, pH 7.5), and incubated at 37°C for 5 min to deplete the cells of amino acids. One million cells were added to the top layer of 0.7-ml microfuge tubes containing 25 μl of 8% (wt/vol) sucrose and 20% perchloric acid (bottom layer), 150 μl of bromododecane (middle layer), and 50 μl of uptake buffer containing 1 μCi of 3H-amino acid mixture containing 15 different amino acids (top layer). After 2 min at room temperature, cells were pelleted for 1 min at 14,000 rpm in a microcentrifuge. Tubes were frozen in a dry ice/acetone bath and cut with dog nail clippers just above the sucrose layer to recover the labeled cells. Twenty-five microliters of 10% Triton X-100 and scintillation cocktail were added and the cell-associated 3H determined. Background was determined by adding an excess of cold amino acids to the assay.
RESULTS
Glut1 Levels and Δψm Decline upon IL3 Withdrawal
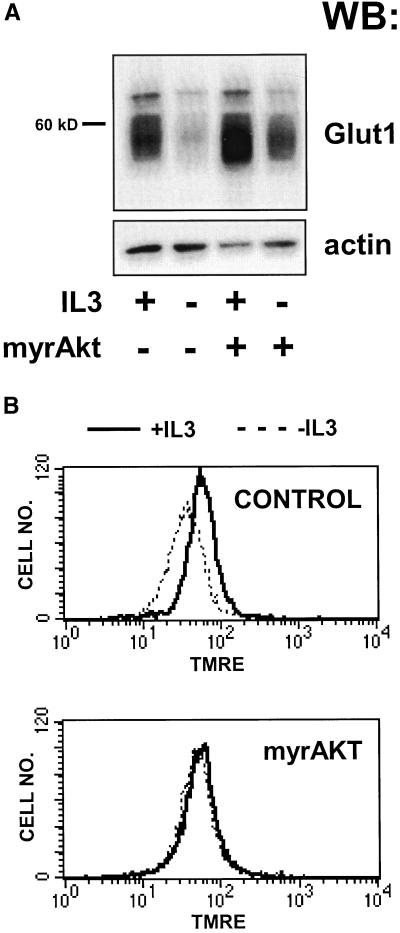
Previous reports have shown that the level of mRNA for Glut1, the principle glucose transporter in a variety of bone marrow-derived cells, decreases upon growth factor withdrawal from growth factor-dependent cell lines or upon neglect of primary T cells (Whetton et al., 1984; Rathmell et al., 2000). This decrease was accompanied by a reduction in mitochondrial membrane potential. These changes were not reversed by antiapoptotic members of the Bcl-2 family, but were prevented by constitutively active Akt (Garland and Halestrap, 1997; Plas et al., 2001). To investigate further the physiological significance of the decline in Glut1 mRNA, we measured Glut1 protein levels in the IL3-dependent cell line FL5.12 before and after growth factor withdrawal. Bcl-xL–expressing cells were used in these and in subsequent experiments to avoid the confounding effects of cell death after IL3 withdrawal. Although Bcl-xL prevents growth factor withdrawal-induced cell death, Bcl-xL–protected cells still atrophy and show changes in glucose metabolism similar to those observed in wild-type FL5.12 cells upon IL3 withdrawal (Plas et al., 2001; our unpublished data). Cells expressing Bcl-xL were withdrawn from IL3 for 24 h and Glut1 protein levels measured by Western blotting. A decline in Glut1 protein as a proportion of total cellular protein was observed upon IL3 withdrawal (Figure 1A). In contrast, Glut1 protein levels were maintained in FL5.12 cells coexpressing myrAkt and Bcl-xL relative to control cells in the absence of IL3 (Figure 1A). Changes in glucose metabolism may impact mitochondrial homeostasis. To determine whether myrAkt expression can support mitochondrial metabolism in the absence of growth factor, we measured the mitochondrial membrane potential by using TMRE. After 24 h of IL3 withdrawal, Δψm dropped in cells expressing Bcl-xL, but not in cells coexpressing myrAkt (Figure 1B).
Figure 1.
Activated Akt can partially prevent the decrease in Glut1 protein levels and mitochondrial membrane potential observed upon IL3 withdrawal. (A) Control FL5.12 cells expressing Bcl-xL alone or cells also expressing myrAkt were maintained in or withdrawn from IL3 for 24 h, lysed, and equivalent amounts of total protein were examined by Western blot for Glut1 and actin protein levels. (B) Cells were prepared as in A but were stained with the potentiometric dye TMRE to evaluate the mitochondrial membrane potential. Dissipation of the mitochondrial proton gradient with CCCP resulted in background levels of fluorescence (our unpublished data).
The ability of myrAkt to promote cellular survival is partially dependent on the presence of extracellular glucose, and a model in which glucose metabolism controls cellular commitment to apoptosis has been proposed (Vander Heiden et al., 2001). A significant problem with placing glucose in a critical regulatory position for growth factor withdrawal-induced cell death is that cells are able to oxidize alternate carbon sources to fuel mitochondrial metabolism. For example, the oxidation of amino acids can support mitochondrial metabolism, and should limit cellular reliance on autodigestion for energy production when glucose is limited. As both cellular atrophy and loss of Δψm accompany growth factor withdrawal, we evaluated the ability of growth factor withdrawn cells to take up extracellular amino acids.
Amino Acid Transport Declines upon IL3 Withdrawal
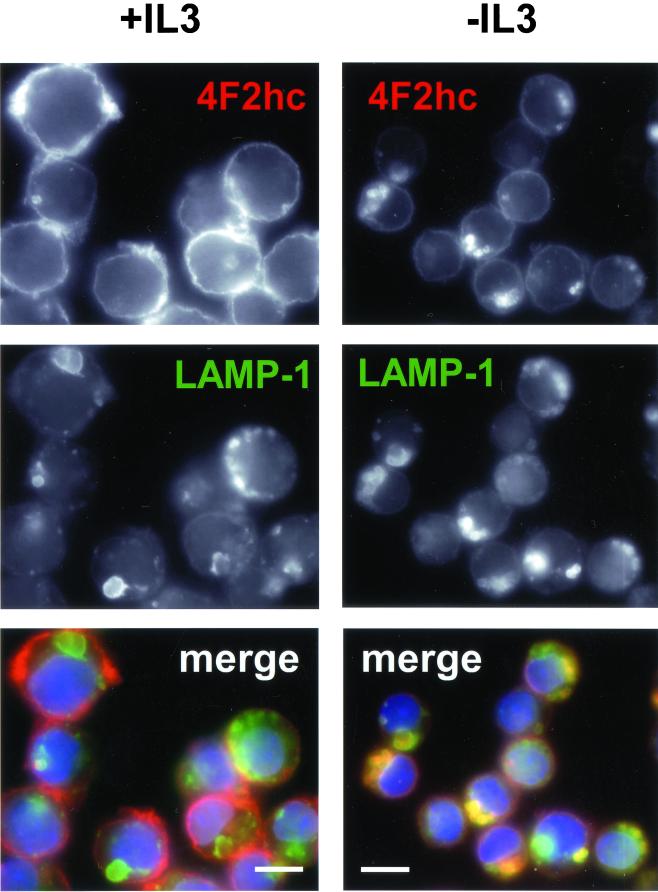
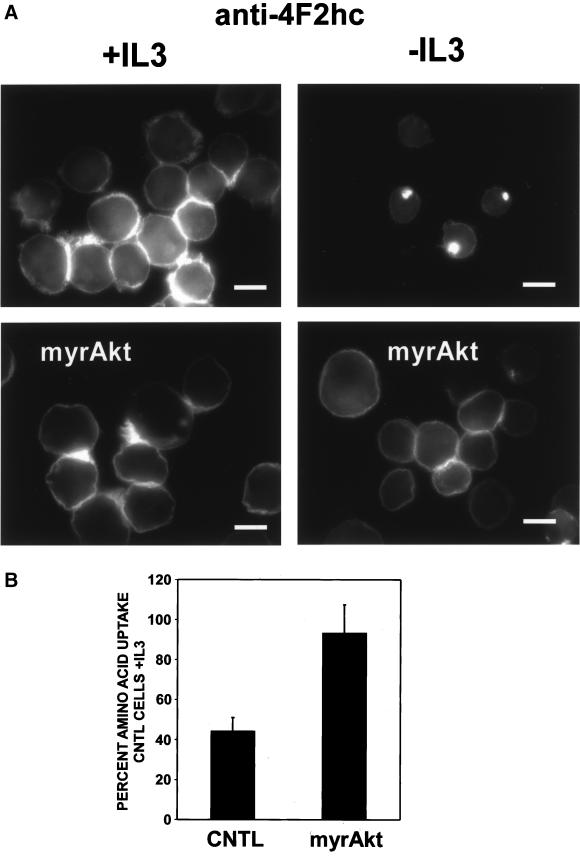
Mammalian amino acid transporters are largely defined based on their transport properties and few have been molecularly cloned (Palacin et al., 1998). One protein associated with amino acid transport that has been cloned is the 4F2 heavy chain (4F2hc). Also known as CD98, this protein was originally described as an early marker for T-cell activation and for tumor cells and has been shown to have transforming properties in some systems (Palacin et al., 1998; Deves and Boyd, 2000). 4F2hc exists as a heterodimer complexed with a variety of light chains and is thought to act as a chaperone that directs the light chains to the cell surface where they function as amino acid transporters. We evaluated FL5.12 cells for surface expression of the 4F2hc protein in the presence and absence of IL3 by immunofluorescence. In the presence of IL3, anti-4F2hc antibodies stained primarily the cell surface as reflected by the bright rim of fluorescence around the cells (Figure 2). Cell surface proteins are thought to be degraded primarily in the lysosome. In the presence of IL3, very little 4F2hc was found in lysosomes as determined by costaining with antibodies to the lysosomal membrane protein LAMP-1. However, after 24 h of IL3 withdrawal, surface staining for 4F2hc decreased and bright, focal intracellular staining was observed. This staining pattern reflects the targeting of 4F2hc to lysosomes as these 4F2hc-containing structures also stained with antibodies to LAMP-1. In contrast, expression of myrAkt completely prevented the appearance of the focal intracellular 4F2hc staining pattern upon IL3 withdrawal and surface staining seemed to be minimally altered by growth factor withdrawal (Figure 3A). To directly evaluate the ability to acquire extracellular amino acids, we measured cellular uptake of tritiated amino acids. After 24 h of growth factor withdrawal, we observed a 50% decline in the ability of control cells to take up the amino acid mixture (Figure 3B). Amino acid uptake in IL3-deprived myrAkt-expressing cells was equal to that observed in control cells maintained in IL3. Thus, myrAkt expression supports both 4F2hc surface expression and amino acid uptake in the absence of IL3.
Figure 2.
4F2hc is down-regulated and trafficked to lysosomes upon growth factor withdrawal. Bcl-xL–expressing FL5.12 cells were maintained in the presence or absence of IL3 for 24 h and processed for immunofluorescence. In the overlay, 4F2hc staining is shown in red, LAMP-1 staining in green, and 4,6-diamidino-2-phenylindole staining of nuclear DNA in blue. The white bar represents 10 μM.
Figure 3.
MyrAkt maintains surface levels of 4F2hc and amino acid transport in the absence of IL3. (A) Control FL5.12 cells expressing Bcl-xL or cells also expressing myrAkt were evaluated for 4F2hc staining after 24 h in the presence or absence of IL3. The white bar represents 10 μM. (B) Control FL5.12 cells expressing Bcl-xL (CNTL) or cells also expressing myrAkt were withdrawn from IL3 for 24 h and evaluated for their ability to take up a mixture of 15 tritiated amino acids as described in MATERIALS AND METHODS. Values are normalized to the uptake in control cells with IL3. The results of four independent experiments are shown, error bars reflect SEM.
Growth Factors Control Cellular Access to Extracellular Cholesterol
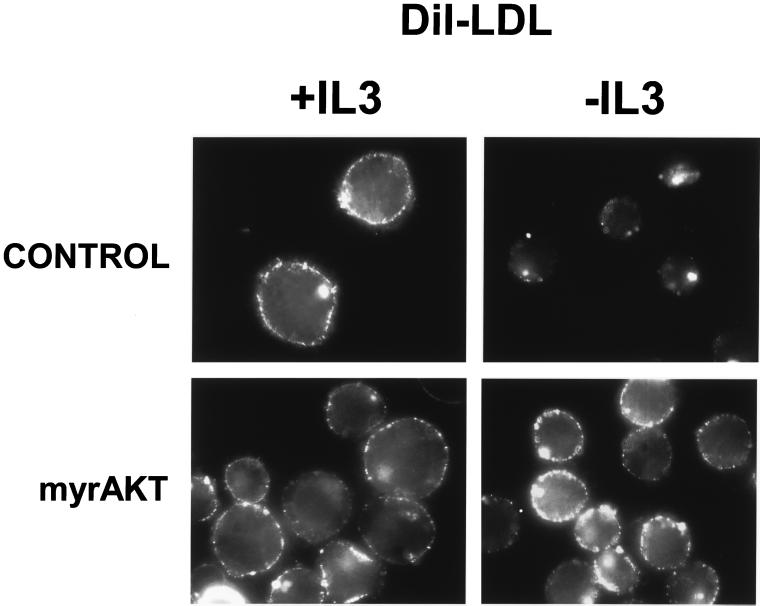
Cholesterol is an important component of cellular membranes and its incorporation impacts membrane fluidity as well as cell signaling through lipid rafts (Simons and Ikonen, 2000). Although cells are able to synthesize cholesterol, mammalian cells also obtain cholesterol from the circulation in the form of LDL particles. Because cholesterol is required for cell growth and is acquired in part from the extracellular medium, we determined whether LDL receptor surface expression was also dependent on growth factors. Cells were incubated on ice with DiI-labeled human LDL and surface binding evaluated by fluorescence microscopy. In the presence of IL3, punctate surface staining was observed (Figure 4). If cells were shifted to 37°C before fixation, this LDL was endocytosed and eventually colocalized with lysosomes (our unpublished data). In contrast, cells withdrawn from IL3 for 24 h showed diminished levels of DiI-LDL surface binding. Because expression of activated Akt maintained glucose and amino acid transporter expression in the absence of growth factor, we evaluated whether myrAkt expression would affect LDL receptor expression. No change in DiI-LDL surface binding was observed after 24 h of IL3 withdrawal in myrAkt-expressing cells (Figure 4). These observations suggest that growth factors regulate LDL receptor surface expression and that Akt plays a role in this signaling pathway.
Figure 4.
LDL receptor expression decreases with IL3 withdrawal but is maintained by myrAkt. Control Bcl-xL–expressing cells or cells also expressing myrAkt were maintained in the presence or absence of IL3 for 24 h. Cells were incubated with DiI-labeled human LDL for 1 h on ice, washed, fixed in paraformaldehyde, and examined by fluorescence microscopy. Three independent experiments were performed.
Growth Factors Control Cellular Iron Uptake
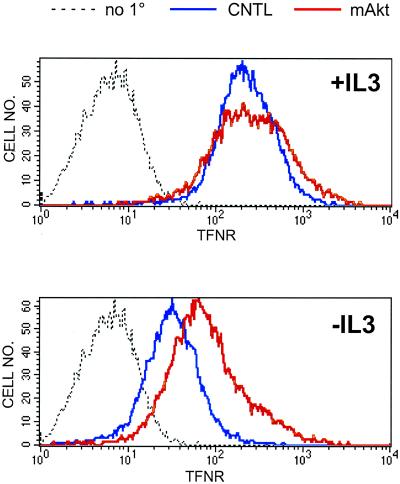
Iron is a required cofactor for a variety of cellular enzymes, including cytochrome oxidase and ribonucleotide reductase, and cellular iron deficiency results in damage to and loss of function in mitochondria (Sussman, 1992; Walter et al., 2001). Iron bound to transferrin is taken up by cells via receptor-mediated endocytosis. A correlation has been observed in some cell types between proliferation rate and surface level of transferrin receptor and the transferrin receptor (CD71) is up-regulated in lymphocytes upon activation (Aisen et al., 2001). We determined whether surface levels of the transferrin receptor were sensitive to the presence of growth factors in the media. In the presence of IL3, high surface levels of transferrin receptor were observed by FACS analysis (Figure 5) and by immunofluorescence (our unpublished data). After 24 h of IL3 withdrawal, surface levels of transferrin receptor significantly declined. Consistent with the observations reported above for other proteins involved in the acquisition of growth-promoting molecules, cells expressing myrAkt maintained higher levels of transferrin receptor on the cell surface in the absence of IL3 than control cells (Figure 5). These results indicate that transferrin receptor surface expression is regulated by IL3 and that myrAkt can support growth factor-independent transferrin receptor expression.
Figure 5.
Transferrin receptor surface expression is regulated by IL3 and Akt. Control Bcl-xL-expressing cells (CNTL) or cells also expressing myrAkt were maintained in the presence or absence of IL3 for 24 h and analyzed by FACS for transferrin receptor (TFNR) surface expression. As a negative control, Bcl-xL cells were stained with secondary only (no 1°). The same negative control plot is shown in both panels. Three independent experiments were performed.
Akt E40K Also Supports Nutrient Transporter Expression in Absence of Growth Factor
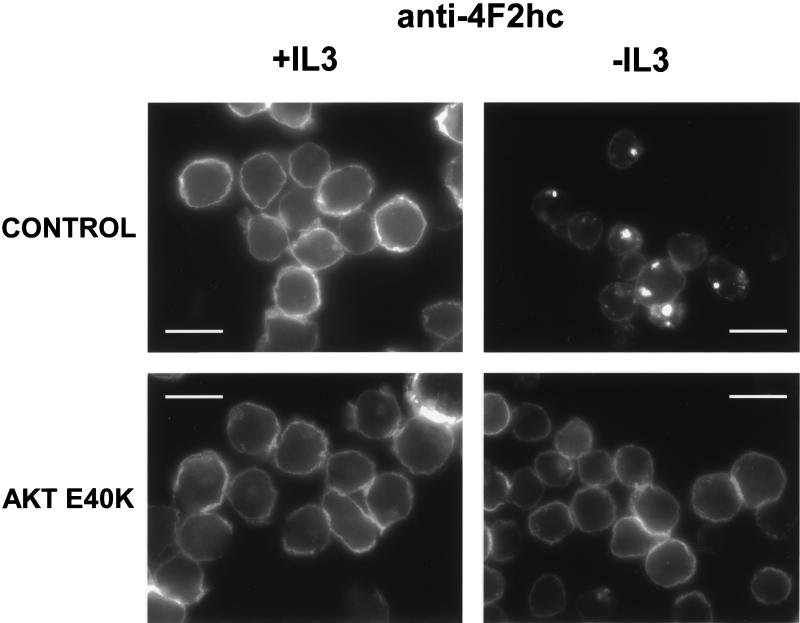
To determine whether the ability to affect nutrient transporter trafficking was restricted to myristoylated forms of Akt, we evaluated a second activated Akt construct. The expression of Akt containing the E40K mutation in the pleckstrin homology domain results in enhanced association with the plasma membrane and an increase in kinase activity (Aoki et al., 1998). When Akt E40K was expressed in FL5.12 cells, both growth factor withdrawal-induced apoptosis and atrophy were dramatically decreased similar to results obtained in cells expressing myrAkt. At 24 h after IL3 withdrawal, vector control cells were 21 ± 1% viable by PI exclusion, whereas E40K-expressing cells remained highly viable (62 ± 2%). In addition, the G1 population of E40K-expressing cells was larger than vector control cells both in the presence and absence of IL3 by forward light scatter (our unpublished data). To determine whether the increased cell survival and decreased atrophy observed in E40K-expressing cells correlated with the maintenance of cell surface nutrient transporters, we evaluated the 4F2hc staining in these cells. Similar to results obtained in myrAkt-expressing cells, expression of Akt E40K prevented the trafficking of 4F2hc to lysosomes upon IL3 withdrawal and maintained the protein on the cell surface (Figure 6). Thus, alternate activated forms of Akt are capable of affecting nutrient transporter trafficking, and this function of Akt does not require the src myristoylation sequence.
Figure 6.
Akt E40K maintains surface expression of 4F2hc in the absence of IL3. FL5.12 cells expressing the EF6 vector or cells expressing Akt E40K were evaluated for 4F2hc staining after 14 h in the presence or absence of IL3. The white bar represents 10 μM.
Rapamycin Reverses Effects of myrAkt
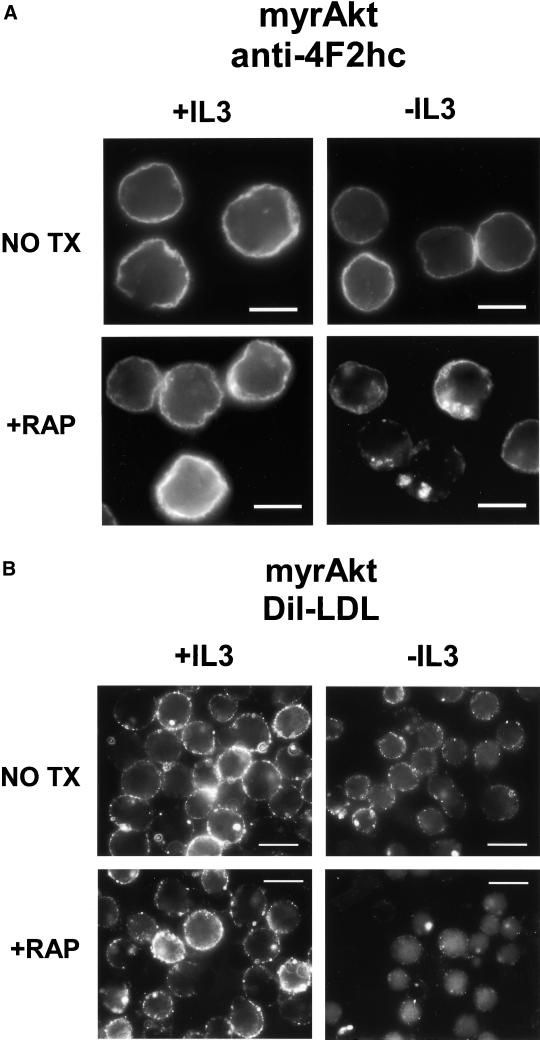
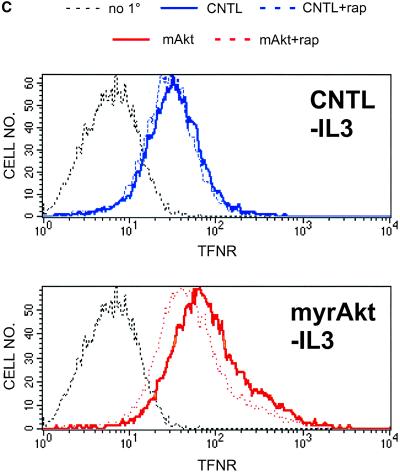
The nutrient response pathway in yeast is regulated by the TOR kinase (Schmelzle and Hall, 2000; Raught et al., 2001). To determine whether the mammalian homolog mTOR is required for Akt-dependent regulation of nutrient transport, we tested the effects of the mTOR inhibitor rapamycin on the ability of myrAkt to preserve amino acid uptake in the absence of growth factor. Simultaneous growth factor withdrawal and rapamycin treatment of myrAkt-expressing cells resulted in relocalization of 4F2hc to LAMP-1–positive intracellular structures as observed in IL3-withdrawn control cells (Figure 7A; our unpublished data). Rapamycin had no effect on 4F2hc localization in control cells in the presence or absence of IL3 (our unpublished data). We next determined whether the effect of myrAkt on LDL binding was also sensitive to rapamycin treatment. As was observed for myrAkt-supported access to amino acids, treatment of IL3-deprived myrAkt-expressing cells with 20 nM rapamycin resulted in a decline in DiI-LDL binding (Figure 7B). Finally, the effect of rapamycin on Akt-mediated increases in transferrin receptor expression was evaluated. Rapamycin treatment decreased transferrin receptor surface expression in the absence of IL3 in myrAkt cells but had no effect on the level of transferrin receptor in IL3-deprived control cells (Figure 7C). These results suggest that Akt-mediated increases in transporter and receptor surface expression in the absence of IL3 are dependent on mTOR activity.
Figure 7.
Effects of myrAkt on 4F2hc, LDL receptor, and transferrin receptor surface expression are suppressed by rapamycin. (A) MyrAkt-expressing cells were treated with 20 nM rapamycin (RAP) and maintained in the presence or absence of IL3 for 24 h before fixation and staining for 4F2hc. The white bar represents 10 μM. (B) MyrAkt expressing cells were prepared as in A but incubated with DiI-LDL on ice for 1 h before fixation. The white bar represents 10 μM. (C) Control cells (CNTL) expressing Bcl-xL or cells also expressing myrAkt were withdrawn from IL3 for 24 h in the presence or absence of 20 nM rapamycin (rap) as indicated and evaluated by FACS for surface expression of the transferrin receptor. The same negative control plot is shown in both panels.
Loss of Nutrient Transporter Expression Impacts Δψm and Cellular Survival
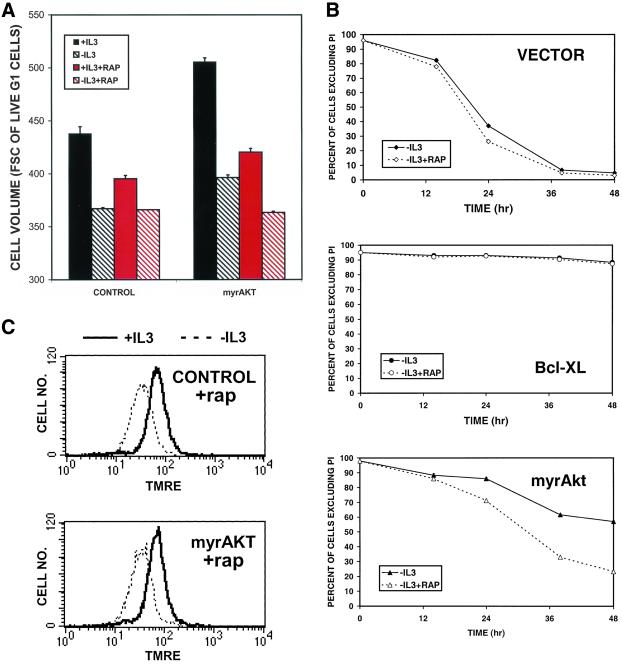
If the ability to maintain cellular access to extracellular molecules is an important component of Akt-mediated increases in cell size and survival after growth factor withdrawal then rapamycin should compromise the protective effects of myrAkt expression on these parameters. We first examined whether the effects of myrAkt on cell size are rapamycin sensitive by using flow cytometry. After 24 h of the indicated treatment, cells were stained with the cell-permeant DNA dye Hoechst 33342 and propidium iodide. Analysis was restricted to propidium iodide-negative cells with a 2N DNA content to avoid the confounding effects of cell death and cell cycle on cell size. As shown in Figure 8A, myrAkt-expressing cells are larger than control cells both in the presence and absence of growth factor. However, treatment of myrAkt-expressing cells with rapamycin reduced the size of these cells to that of controls. In contrast, rapamycin decreased the size of control cells in the presence but not in the absence of IL3, consistent with the expected level of Akt activation under these conditions. We next determined whether rapamycin diminished the antiapoptotic effect of myrAkt. When FL5.12 cells expressing myrAkt were withdrawn from IL3, apoptosis was delayed relative to vector control cells (Figure 8B). However, when IL3 withdrawal was performed in the presence of rapamycin, the survival of myrAkt-expressing cells was reduced. Rapamycin had little effect on the survival of control cells and no effect on the survival of Bcl-xL–expressing cells in the absence of IL3, consistent with the expected lack of Akt activity in these cells. Finally, we examined whether rapamycin affected the ability of Akt to maintain Δψm. When myrAkt cells were simultaneously treated with rapamycin and withdrawn from IL3, the protective effect of myrAkt on Δψm (Figure 1B) was eliminated (Figure 8C).
Figure 8.
Rapamycin interferes with the positive effects of myrAkt on cell size, survival, and mitochondrial membrane potential. (A) Control Bcl-xL–expressing cells or cells also expressing myrAkt were maintained in the presence or absence of IL3 and 20 nM rapamycin as indicated for 24 h, stained with PI and Hoechst 33342, and evaluated by FACS sorting. Cell size analysis was restricted to PI-negative cells with a 2N DNA content. Cell volume measured in arbitrary units of forward angle light scatter is presented. One of three similar experiments is shown, error bars represent the SD of triplicate samples. (B) Vector control FL5.12 cells or cells expressing Bcl-xL or myrAkt were maintained in the presence or absence of IL3 and 20 nM rapamycin (rap) as indicated and their viability measured by PI exclusion at the indicated time points. One of three similar experiments is shown; error bars reflect the SD of triplicate samples. (C) Control Bcl-xL–expressing cells or cells also expressing myrAkt were treated with 20 nm rapamycin (rap) and maintained in the presence or absence of IL3 for 24 h and stained with TMRE to evaluate the mitochondrial membrane potential. Treatment with CCCP reduced fluorescence to background levels (our unpublished data).
DISCUSSION
Our data suggest that growth factors regulate cellular growth and survival by modulating the ability to take up a range of extracellular molecules, including glucose, amino acids, cholesterol, and iron. The loss of transporters for each of these molecules would have important consequences for cellular homeostasis, and their coordinated down-regulation would present an almost insurmountable hurdle to continued cell growth. Loss of amino acid transport along with the decrease in glucose uptake would result in a shortage of bioenergetic metabolites, forcing the cell to break down its constituent macromolecules to sustain bioenergetics. Cholesterol is an important component of cellular membranes. Although cells are capable of synthesizing cholesterol, loss of access to external sources would decrease the available supply and increase the energy drain on the cell as it is forced to synthesize all the cholesterol required. Decreased iron uptake would have important consequences for the activity of enzymes such as ribonucleotide reductase, which turns over rapidly and requires a continuous supply of iron to maintain its activity (Cazzola et al., 1990). In addition, cellular iron deficiency results in oxidative damage and loss of function in mitochondria, and treatment of cells with iron chelators decreases the activity of tricarbolic acid cycle enzymes, increases the NAD/NADH ratio, decreases oxygen consumption, and increases lactate production, indicating that iron plays a critical role in metabolic homeostasis (Oexle et al., 1999; Walter et al., 2001).
The Akt kinase is a component of the growth factor signal transduction cascade regulating cell growth and survival. The kinase activity of mTOR may be modulated by Akt activity (Scott et al., 1998; Sekulic et al., 2000), and several studies suggest that the transforming effects of Akt involve stimulation of mTOR (Aoki et al., 2001; Neshat et al., 2001; Podsypanina et al., 2001). Our studies indicate that Akt-mediated increases in cell size and survival result from increased surface expression of nutrient transporters. Furthermore, the ability of Akt activity to increase cell size, cell survival, and surface expression of nutrient transporters depends on the activity of mTOR. The TOR kinase is highly conserved from yeast to humans, and parallels can be drawn between the functions of yeast and mammalian TOR. In yeast, TOR coordinates the cellular response to extracellular nutrient levels and allows yeast cells to respond adaptively to changes in the extracellular environment by modulating nutrient transporter expression (Schmidt et al., 1998; Beck et al., 1999). Our results raise the possibility that in mammalian cells, mTOR functions in the growth factor signal transduction pathway to maintain cellular access to extracellular nutrients. Rapamycin treatment in yeast produces a response equivalent to starvation (Schmelzle and Hall, 2000; Raught et al., 2001), and it may be that growth factor withdrawal induces a similar state of pseudostarvation in part by limiting mTOR activity. The data presented herein show that mTOR regulates the trafficking of nutrient transporters in myrAkt-expressing cells. Consistent with the low toxicity of rapamycin in normal cells (Mills et al., 2001; Neshat et al., 2001), rapamycin had limited effects on control cells growing in the presence of IL3. Growth factor signaling probably supports nutrient transporter expression through multiple, redundant pathways and only the mTOR pathway would be rapamycin sensitive. In contrast, activated Akt seems to increase transporter expression solely through an mTOR-dependent pathway as rapamycin treatment ablates the effects of Akt on transporter surface expression. These results are also consistent with the observations that, although the maintenance of muscle mass is not dependent on the Akt, the activities of Akt and mTOR are critical for load-induced hypertrophy and recovery of mass after atrophy (Bodine et al., 2001).
If access to extracellular molecules is an important mechanism of growth factor control over cell survival and proliferation then it follows that cancer cells have developed mechanisms to supply themselves with these molecules in spite of the lack of growth factor support. It is well established that tumors and cell lines have enhanced rates of glucose uptake. Tumor cells are also avid consumers of amino acids and take up nitrogen from host proteins as well as from the diet (Medina, 2001). In fact, overexpression of 4F2hc in 3T3 cells results in transformation and renders the cells tumorigenic in nude mice (Hara et al., 1999, 2000). Rapidly growing and dividing cells must constantly make new membrane, and inhibition of cholesterol synthesis by chemical inhibitors of 3-hydroxy-3-methylglutaryl-CoA reductase can cause apoptosis in ∼50% of tumor cell lines tested, whereas normal human fibroblast lines remain unaffected (Dimitroulakos et al., 2001). Interfering antibodies to the transferrin receptor can arrest tumor cell growth at the G1/S interface, and iron chelators have shown some efficacy as antineoplastic agents (Cazzola et al., 1990). Furthermore, we have shown that when cells are growth factor withdrawn and Akt-mediated elevated transporter expression is prevented by rapamycin treatment, cell survival and Δψm decline, suggesting that nutrient acquisition has a regulatory role in cellular apoptosis. Rapamycin treatment decreases colony formation by myrPI3K and myrAkt transformed fibroblasts and has been shown to have activity against PTEN-deficient tumors (Hidalgo and Rowinsky, 2000; Aoki et al., 2001; Neshat et al., 2001; Podsypanina et al., 2001). Our results further support the evaluation of rapamycin and its analogs as cancer therapy agents in cells with an activated PI3K signaling pathway.
Growth factor withdrawal is known to decrease the rate of protein synthesis, a process that consumes a large fraction of cellular energy. An alternate explanation for decreased nutrient uptake during IL3 withdrawal is that cellular demand for nutrients is reduced due to arrested translation and decreased ATP utilization. This could account for the observed decline in amino acid and glucose uptake upon growth factor withdrawal, but not for the decline in the mitochondrial potential. A decrease in the rate of translation and a commensurate decline in ATP consumption should result in an increase rather than a decrease in the mitochondrial membrane potential. The fact that Δψm declines in the face of reduced energy demand suggests that cells are unable to meet even this lower energy requirement. The cellular atrophy observed upon growth factor withdrawal is also consistent with a catabolic state in which cells degrade their constituent proteins for energy due to a negative cellular energy balance.
The observed decrease in nutrient transporter protein expression after growth factor withdrawal also does not result solely from a decrease in protein translation. When IL3 is withdrawn from control cells or from rapamycin-treated, myrAkt-expressing cells, the 4F2hc staining pattern changes from a surface to a lysosomal pattern. Loss of this protein due to the interruption of its translation would be reflected as decreased surface staining rather than a shift to a lysosomal localization. Our data suggest that these nutrient transporter proteins are actively targeted for lysosomal degradation upon IL3 withdrawal and that preventing transporter down-regulation may be an important step in tumorigenesis. Several recent reviews have highlighted the possible involvement of proteins regulating endocytosis in some human cancers (Floyd and De Camilli, 1998; Di Fiore and Gill, 1999). It will be interesting to determine whether the antiproliferative effects of rapamycin on PTEN-deficient tumor cells results from a decrease in mTOR-dependent surface expression of nutrient transporters, thereby limiting cellular access to extracellular nutrients.
ACKNOWLEDGMENTS
We thank Drs. Phil Tsichlis and Tung Chan for providing the E40K mutant and the members of the Thompson laboratory for intellectual input and technical advice and for comments on the manuscript. A.L.E. was supported by a fellowship from the Helen Hay Whitney Foundation.
Footnotes
DOI: 10.1091/mbc.01–12–0584.
REFERENCES
- Aisen P, Enns C, Wessling-Resnick M. Chemistry and biology of eukaryotic iron metabolism. Int J Biochem Cell Biol. 2001;33:940–959. doi: 10.1016/s1357-2725(01)00063-2. [DOI] [PubMed] [Google Scholar]
- Aoki M, Batista O, Bellacosa A, Tsichlis P, Vogt PK. The akt kinase: molecular determinants of oncogenicity. Proc Natl Acad Sci USA. 1998;95:14950–14955. doi: 10.1073/pnas.95.25.14950. [DOI] [PMC free article] [PubMed] [Google Scholar]
- Aoki M, Blazek E, Vogt PK. A role of the kinase mTOR in cellular transformation induced by the oncoproteins P3k and Akt. Proc Natl Acad Sci USA. 2001;98:136–141. doi: 10.1073/pnas.011528498. [DOI] [PMC free article] [PubMed] [Google Scholar]
- Beck T, Schmidt A, Hall MN. Starvation induces vacuolar targeting and degradation of the tryptophan permease in yeast. J Cell Biol. 1999;146:1227–1238. doi: 10.1083/jcb.146.6.1227. [DOI] [PMC free article] [PubMed] [Google Scholar]
- Bental M, Deutsch C. Metabolic changes in activated T cells: an NMR study of human peripheral blood lymphocytes. Magn Reson Med. 1993;29:317–326. doi: 10.1002/mrm.1910290307. [DOI] [PubMed] [Google Scholar]
- Blume-Jensen P, Hunter T. Oncogenic kinase signaling. Nature. 2001;411:355–365. doi: 10.1038/35077225. [DOI] [PubMed] [Google Scholar]
- Bodine SC, et al. Akt/mTOR pathway is a crucial regulator of skeletal muscle hypertrophy and can prevent muscle atrophy in vivo. Nat Cell Biol. 2001;3:1014–1019. doi: 10.1038/ncb1101-1014. [DOI] [PubMed] [Google Scholar]
- Brand K, Leibold W, Luppa P, Schoerner C, Schulz A. Metabolic alterations associated with proliferation of mitogen-activated lymphocytes and of lymphoblastoid cell lines: evaluation of glucose and glutamine metabolism. Immunobiology. 1986;173:23–34. doi: 10.1016/S0171-2985(86)80086-9. [DOI] [PubMed] [Google Scholar]
- Cazzola M, Bergamaschi G, Dezza L, Arosio P. Manipulations of cellular iron metabolism for modulating normal and malignant cell proliferation: achievements and prospects. Blood. 1990;75:1903–1919. [PubMed] [Google Scholar]
- Conlon I, Raff M. Size control in animal development. Cell. 1999;96:234–244. doi: 10.1016/s0092-8674(00)80563-2. [DOI] [PubMed] [Google Scholar]
- Datta SR, Brunet A, Greenberg ME. Cellular survival: a play in three Akts. Genes Dev. 1999;13:2905–2927. doi: 10.1101/gad.13.22.2905. [DOI] [PubMed] [Google Scholar]
- Deves R, Boyd CA. Surface antigen CD98(4F2): not a single membrane protein, but a family of proteins with multiple functions. J Membr Biol. 2000;173:165–177. doi: 10.1007/s002320001017. [DOI] [PubMed] [Google Scholar]
- Di Fiore PP, Gill GN. Endocytosis and mitogenic signaling. Curr Opin Cell Biol. 1999;11:483–488. doi: 10.1016/s0955-0674(99)80069-6. [DOI] [PubMed] [Google Scholar]
- Dimitroulakos J, Ye LY, Benzaquen M, Moore MJ, Kamel-Reid S, Freedman MH, Yeger H, Penn LZ. Differential sensitivity of various pediatric cancers and squamous cell carcinomas to lovastatin-induced apoptosis: therapeutic implications. Clin Cancer Res. 2001;7:158–167. [PubMed] [Google Scholar]
- Floyd S, De Camilli P. Endocytosis proteins and cancer: a potential link? Trends Cell Biol. 1998;8:299–301. doi: 10.1016/s0962-8924(98)01316-6. [DOI] [PubMed] [Google Scholar]
- Garland JM, Halestrap A. Energy metabolism during apoptosis. Bcl-2 promotes survival in hematopoietic cells induced to apoptose by growth factor withdrawal by stabilizing a form of metabolic arrest. J Biol Chem. 1997;272:4680–4688. doi: 10.1074/jbc.272.8.4680. [DOI] [PubMed] [Google Scholar]
- Gottlob K, Majewski N, Kennedy S, Kandel E, Robey RB, Hay N. Inhibition of early apoptotic events by Akt/PKB is dependent on the first committed step of glycolysis and mitochondrial hexokinase. Genes Dev. 2001;15:1406–1418. doi: 10.1101/gad.889901. [DOI] [PMC free article] [PubMed] [Google Scholar]
- Hara K, Kudoh H, Enomoto T, Hashimoto Y, Masuko T. Malignant transformation of NIH3T3 cells by overexpression of early lymphocyte activation antigen CD98. Biochem Biophys Res Commun. 1999;262:720–725. doi: 10.1006/bbrc.1999.1051. [DOI] [PubMed] [Google Scholar]
- Hara K, Kudoh H, Enomoto T, Hashimoto Y, Masuko T. Enhanced tumorigenicity caused by truncation of the extracellular domain of GP125/CD98 heavy chain. Oncogene. 2000;19:6209–6215. doi: 10.1038/sj.onc.1204019. [DOI] [PubMed] [Google Scholar]
- Hidalgo M, Rowinsky EK. The rapamycin-sensitive signal transduction pathway as a target for cancer therapy. Oncogene. 2000;19:6680–6686. doi: 10.1038/sj.onc.1204091. [DOI] [PubMed] [Google Scholar]
- Iiboshi Y, Papst PJ, Kawasome H, Hosoi H, Abraham RT, Houghton PJ, Terada N. Amino acid-dependent control of p70(s6k). Involvement of tRNA aminoacylation in the regulation. J Biol Chem. 1999;274:1092–1099. doi: 10.1074/jbc.274.2.1092. [DOI] [PubMed] [Google Scholar]
- Kan O, Baldwin SA, Whetton AD. Apoptosis is regulated by the rate of glucose transport in an interleukin 3 dependent cell line. J Exp Med. 1994;180:917–923. doi: 10.1084/jem.180.3.917. [DOI] [PMC free article] [PubMed] [Google Scholar]
- Kandel ES, Hay N. The regulation and activities of the multifunctional serine/threonine kinase Akt/PKB. Exp Cell Res. 1999;253:210–229. doi: 10.1006/excr.1999.4690. [DOI] [PubMed] [Google Scholar]
- Kwabi-Addo B, Giri D, Schmidt K, Podsypanina K, Parsons R, Greenberg N, Ittmann M. Haploinsufficiency of the Pten tumor suppressor gene promotes prostate cancer progression. Proc Natl Acad Sci USA. 2001;98:11563–11568. doi: 10.1073/pnas.201167798. [DOI] [PMC free article] [PubMed] [Google Scholar]
- Malstrom S, Tili E, Kappes D, Ceci JD, Tsichlis PN. Tumor induction by an Lck-MyrAkt transgene is delayed by mechanisms controlling the size of the thymus. Proc Natl Acad Sci USA. 2001;98:14967–14972. doi: 10.1073/pnas.231467698. [DOI] [PMC free article] [PubMed] [Google Scholar]
- Matsuyama S, Reed JC. Mitochondria-dependent apoptosis and cellular pH regulation. Cell Death Differ. 2000;7:1155–1165. doi: 10.1038/sj.cdd.4400779. [DOI] [PubMed] [Google Scholar]
- Medina MA. Glutamine and cancer. J Nutr. 2001;131:2539S–2542S. doi: 10.1093/jn/131.9.2539S. ; discussion 2550S–2561S. [DOI] [PubMed] [Google Scholar]
- Mills GB, Lu Y, Kohn EC. Linking molecular therapeutics to molecular diagnostics: inhibition of the FRAP/RAFT/TOR component of the PI3K pathway preferentially blocks PTEN mutant cells in vitro and in vivo. Proc Natl Acad Sci USA. 2001;98:10031–10033. doi: 10.1073/pnas.191379498. [DOI] [PMC free article] [PubMed] [Google Scholar]
- Neshat MS, Mellinghoff IK, Tran C, Stiles B, Thomas G, Petersen R, Frost P, Gibbons JJ, Wu H, Sawyers CL. Enhanced sensitivity of PTEN-deficient tumors to inhibition of FRAP/mTOR. Proc Natl Acad Sci USA. 2001;98:10314–10319. doi: 10.1073/pnas.171076798. [DOI] [PMC free article] [PubMed] [Google Scholar]
- Oexle H, Gnaiger E, Weiss G. Iron-dependent changes in cellular energy metabolism: influence on citric acid cycle and oxidative phosphorylation. Biochim Biophys Acta. 1999;1413:99–107. doi: 10.1016/s0005-2728(99)00088-2. [DOI] [PubMed] [Google Scholar]
- Palacin M, Estevez R, Bertran J, Zorzano A. Molecular biology of mammalian plasma membrane amino acid transporters. Physiol Rev. 1998;78:969–1054. doi: 10.1152/physrev.1998.78.4.969. [DOI] [PubMed] [Google Scholar]
- Plas DR, Talapatra S, Edinger AL, Rathmell JC, Thompson CB. Akt, and Bcl-xL promote growth factor-independent survival through distinct effects on mitochondrial physiology. J Biol Chem. 2001;276:12041–12048. doi: 10.1074/jbc.M010551200. [DOI] [PubMed] [Google Scholar]
- Plas DR, Thompson CB. Cell metabolism in the regulation of programmed cell death. Trends Endocrinol Metab. 2002;13:75–78. doi: 10.1016/s1043-2760(01)00528-8. [DOI] [PubMed] [Google Scholar]
- Podsypanina K, et al. An inhibitor of mTOR reduces neoplasia and normalizes p70/S6 kinase activity in Pten+/− mice. Proc Natl Acad Sci USA. 2001;98:10320–10325. doi: 10.1073/pnas.171060098. [DOI] [PMC free article] [PubMed] [Google Scholar]
- Raff M. Social controls on cell survival and death. Nature. 1992;356:397–400. doi: 10.1038/356397a0. [DOI] [PubMed] [Google Scholar]
- Raff MC. Size control: the regulation of cell numbers in animal development. Cell. 1996;86:173–175. doi: 10.1016/s0092-8674(00)80087-2. [DOI] [PubMed] [Google Scholar]
- Rathmell JC, Vander Heiden MG, Harris MH, Frauwirth KA, Thompson CB. In the absence of extrinsic signals, nutrient utilization by lymphocytes is insufficient to maintain either cell size or viability. Mol Cell. 2000;6:683–692. doi: 10.1016/s1097-2765(00)00066-6. [DOI] [PubMed] [Google Scholar]
- Raught B, Gingras AC, Sonenberg N. The target of rapamycin (TOR) proteins. Proc Natl Acad Sci USA. 2001;98:7037–7044. doi: 10.1073/pnas.121145898. [DOI] [PMC free article] [PubMed] [Google Scholar]
- Schmelzle T, Hall MN. TOR, a central controller of cell growth. Cell. 2000;103:253–262. doi: 10.1016/s0092-8674(00)00117-3. [DOI] [PubMed] [Google Scholar]
- Schmidt A, Beck T, Koller A, Kunz J, Hall MN. The TOR nutrient signaling pathway phosphorylates NPR1 and inhibits turnover of the tryptophan permease. EMBO J. 1998;17:6924–6931. doi: 10.1093/emboj/17.23.6924. [DOI] [PMC free article] [PubMed] [Google Scholar]
- Scott PH, Brunn GJ, Kohn AD, Roth RA, Lawrence JC., Jr Evidence of insulin-stimulated phosphorylation and activation of the mammalian target of rapamycin mediated by a protein kinase B signaling pathway. Proc Natl Acad Sci USA. 1998;95:7772–7777. doi: 10.1073/pnas.95.13.7772. [DOI] [PMC free article] [PubMed] [Google Scholar]
- Sekulic A, Hudson CC, Homme JL, Yin P, Otterness DM, Karnitz LM, Abraham RT. A direct linkage between the phosphoinositide 3-kinase-AKT signaling pathway and the mammalian target of rapamycin in mitogen-stimulated and transformed cells. Cancer Res. 2000;60:3504–3513. [PubMed] [Google Scholar]
- Simons K, Ikonen E. How cells handle cholesterol. Science. 2000;290:1721–1726. doi: 10.1126/science.290.5497.1721. [DOI] [PubMed] [Google Scholar]
- Sussman HH. Iron in cancer. Pathobiology. 1992;60:2–9. doi: 10.1159/000163690. [DOI] [PubMed] [Google Scholar]
- Talapatra S, Thompson CB. Growth factor signaling in cell survival: implications for cancer treatment. J Pharmacol Exp Ther. 2001;298:873–878. [PubMed] [Google Scholar]
- Testa JR, Bellacosa A. AKT plays a central role in tumorigenesis. Proc Natl Acad Sci USA. 2001;98:10983–10985. doi: 10.1073/pnas.211430998. [DOI] [PMC free article] [PubMed] [Google Scholar]
- Vander Heiden MG, Chandel NS, Schumacker PT, Thompson CB. Bcl-XL prevents cell death following growth factor withdrawal by facilitating mitochondrial ATP/ADP exchange. Mol Cell. 1999;3:159–167. doi: 10.1016/s1097-2765(00)80307-x. [DOI] [PubMed] [Google Scholar]
- Vander Heiden MG, Plas DR, Rathmell JC, Fox CJ, Harris MH, Thompson CB. Growth factors can influence cell growth and survival through effects on glucose metabolism. Mol Cell Biol. 2001;21:5899–5912. doi: 10.1128/MCB.21.17.5899-5912.2001. [DOI] [PMC free article] [PubMed] [Google Scholar]
- Walter PB, Knutson MD, Paler-Martinez A, Lee S, Xu Y, Viteri FE, Ames BN. Proc. Natl Acad Sci USA. 2001;99:2264–2269. doi: 10.1073/pnas.261708798. [DOI] [PMC free article] [PubMed] [Google Scholar]
- Whetton AD, Bazill GW, Dexter TM. Hemopoietic cell growth factor mediates cell survival via its action on glucose transport. EMBO J. 1984;3:409–413. doi: 10.1002/j.1460-2075.1984.tb01821.x. [DOI] [PMC free article] [PubMed] [Google Scholar]


