

Abstract
In organisms ranging from vertebrates to plants, major components of centromeres are rapidly evolving repeat sequences, such as tandem repeats (TRs) and transposable elements (TEs), which harbour centromere-specific histone H3 (CENH3)1,2. Complete centromere structures recently determined in human and Arabidopsis suggest frequent integration and purging of retrotransposons within the TR regions of centromeres3–5. Despite the high impact of ‘centrophilic’ retrotransposons on the paradox of rapid centromere evolution, the mechanisms involved in centromere targeting remain poorly understood in any organism. Here we show that both Ty3 and Ty1 long terminal repeat retrotransposons rapidly turnover within the centromeric TRs of Arabidopsis species. We demonstrate that the Ty1/Copia element Tal1 (Transposon of Arabidopsis lyrata 1) integrates de novo into regions occupied by CENH3 in Arabidopsis thaliana, and that ectopic expansion of the CENH3 region results in spread of Tal1 integration regions. The integration spectra of chimeric TEs reveal the key structural variations responsible for contrasting chromatin-targeting specificities to centromeres versus gene-rich regions, which have recurrently converted during the evolution of these TEs. Our findings show the impact of centromeric chromatin on TE-mediated rapid centromere evolution, with relevance across eukaryotic genomes.
Subject terms: Epigenomics, Evolutionary biology, Centromeres, Transposition
An Arabidopsis long terminal repeat retrotransposon integrates de novo into regions occupied by centromere-specific histone variant, showing the impact of centromeric chromatin on transposable element-mediated rapid centromere evolution, with relevance across eukaryotic genomes.
Main
Despite the essential and conserved functions of centromeres for chromosome transmission, they are structurally diverse and evolve rapidly, which is termed the ‘centromere paradox’1–7. Rapid centromere evolution is associated with extremely frequent turnover of tandem repeats (TRs) and transposable elements (TEs)3–5,7,8. Single monomers of the centromeric TRs are typically between 100 and 200 base pairs (bp) in length, which are capable of loading one nucleosome with the centromere-specific histone H3 (CENH3) (also known as CENP-A (centromere protein A))9–11. A notable feature of centromeric TEs is that they contain heterochromatic marks, such as cytosine methylation (mC) and methylation of histone H3 lysine 9 (H3K9me)11, which generate regions of reduced accessibility and repressed transcription. The centromeric TEs and associated constitutive heterochromatin significantly affect centromere functions and chromosome behaviours9–13.
Centromeric TEs have been extensively studied at the level of sequence variation and evolution5,14–18. However, understanding of centromeric TE dynamics is still limited at the mechanistic level, mainly because mobile copies have not been isolated for most centromeric TEs. Here we characterize the behaviour and evolution of mobile centromeric TEs, which has revealed the impact of CENH3 chromatin on guiding integration, with implications for the dynamics and evolution of TEs and centromeres.
LTR elements in A. lyrata centromeres
Whereas the model plant A. thaliana is predominantly an inbreeding species, its sister species Arabidopsis lyrata is an outcrosser, the genome of which is predicted to harbour a larger number of active TEs5,19–22. Consistently, assembly of complete centromere structures of two natural accessions of A. lyrata revealed that their centromeric TR regions contain a higher proportion of integrations of the Ty3 class of long terminal repeat (LTR) elements called ATHILA compared to those in A. thaliana5 (Fig. 1a). The ATHILA copies in A. lyrata genome tend to be younger than those of A. thaliana (Fig. 1b), consistent with the idea that outcrossing A. lyrata genome contains more active TEs. In addition to ATHILA, we found that A. lyrata centromeric TR regions contain hundreds of insertions of Ty1/Copia class LTR elements called ALE23,24 (Fig. 1 and Extended Data Fig. 1a). As is the case for ATHILA3,5, ALE is abundant in the TR regions (Fig. 1d and Extended Data Fig. 1a). The centromeric TR regions contain a greater density of ATHILA and ALE in A. lyrata than in A. thaliana, with the contrast being most evident for ALE, which is completely absent from the TR regions of A. thaliana (Fig. 1a). Centrophilic ALEs are prevalent in other related genera (Supplementary Discussion 1 and Extended Data Fig. 2), suggesting that they are ancestral or recurrently evolving.
Fig. 1. LTR elements in A. lyrata centromeres.
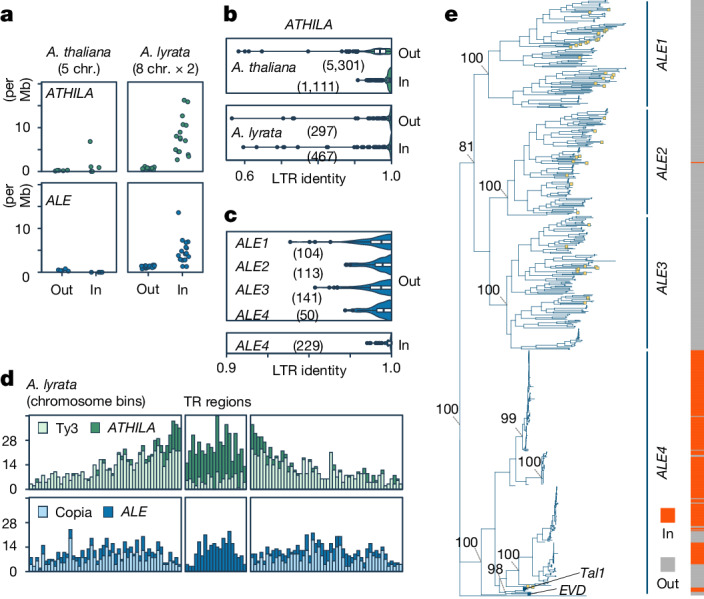
a, ATHILA and ALE density shown as the number of intact insertions per Mb inside (In) and outside (Out) the TRs associated with centromeres. Each circle represents one chromosome (chr.) from the A. thaliana (Columbia strain) or A. lyrata (two strains) genome including the centromeres3,5. b, Distribution of LTR sequence identities of ATHILA elements in A. lyrata and A. thaliana. In and Out copies are separately characterized. Data for 66 A. thaliana accessions5 are used (Methods). c, Distribution of LTR sequence identities of the ALE branches. In b and c, centre lines represent median values, box borders correspond to the first and third quartiles (interquartile range), whiskers are extended up to the largest value no further than 1.5× interquartile range, outliers are shown as black dots and the numbers of elements are shown within the parenthesis. d, The number of intact Ty1/Copia, ALE, Ty3 and ATHILA insertions in the TR and surrounding areas. The TRs were split into 20 bins of varying size, depending on their length. The mean size of these bins was used for 50 upstream and downstream bins to count insertions. e, Phylogeny of intact ALE elements based on the concatenated integrase (PF00665) and reverse transcriptase (PF07727) core domains in A. lyrata and A. thaliana (yellow boxes), rooted with the Ty1 element (M18706.1) from Saccharomyces cerevisiae (bottom). The four main branches are indicated, and the relationship of each element (In/Out) to the TRs (the numbers are shown in Supplementary Table 1). Bootstrap support of key nodes and the position of Tal1 and EVD are shown. In this figure, A. lyrata genomes of NT1 from Siberia and MN47 from North America were used. A Circos plot in Extended Data Fig. 1a shows TE distribution along A. lyrata MN47 chromosomes.
Extended Data Fig. 1. Arabidopsis lyrata centromeres contain abundant LTR retrotransposons.

a, Circos plot showing TE distribution along A. lyrata MN47 chromosomes. Orange blocks in outermost ribbon depict centromere-associated TR positions5. In all inner ribbons, Ty1/Copia and Ty3 elements are shown with blue and green respectively, with darker shadings indicating insertions within the TRs. The second and seventh ribbon moving inwards show counts of intact Ty1/Copia and Ty3 elements, computed separately for inside and outside of the TR regions using a bin width of ~600 kbp. All other ribbons show individual elements of the four main ALE branches (based on Fig. 1e) and of ATHILA5. b, Levels of pairwise sequence similarity between and within ALE branches with a 60% and 80% identity threshold. ALE4 show high proportion of the sequence similarity within the group. c, ALE phylogenetic tree as in Fig. 1d. Additional adjacent strips (C1-4) show the centromeric Clusters 1-4 in previous publication27 that correspond to ALE4. d, As the ALE tree but showing phylogeny of intact ATHILA based on their full-length sequence. The tree was rooted with the Ty3 element (M34549.1) from S. cerevisiae. For both trees, bootstrap support of key nodes and known/consensus elements are indicated.
Extended Data Fig. 2. Phylogenetic analyses of ALE-like sequences from three species related to Arabidopsis.

The phylogenetic relationships of RT core domain sequences were represented by NJ trees. Number of sequences from each species was shown after species name in parenthesis. Red circles show copies flanking TR regions of each species. Also included are Arabidopsis COPIA sequences, such as consensus sequences of four A. lyrata centrophilic ALE4 copies (green diamonds; C1-427), related A. thaliana copies (blue diamonds), and a few other A. thaliana COPIA copies (black circles). An arrow indicates the position of EVD. Scale bars are shown beside the top of each tree. Centrophilic and centrophobic clusters are seen in each species. As is the case in Arabidopsis ALE copies, terminal branches in centrophilic clusters tend to be shorter than those in centrophobic clusters.
Phylogenetic analysis separated ALE elements within A. lyrata genomes into four main branches (Fig. 1e). These four ALE clusters differ in regard to localization within the centromere-associated TR regions (Fig. 1e and Extended Data Fig. 1a), and we termed the most centrophilic branch ALE4. Most ALE4 elements (229 of 279) are located within the TR regions, whereas ALE1, ALE2 and ALE3 are localized almost exclusively outside the TR regions (Fig. 1e, right, and Extended Data Fig. 1a). Compared to the ALE1–ALE3 elements, ALE4 elements within the TR regions have higher within-element LTR identity (Fig. 1c), and shorter terminal branches on the phylogenetic tree (Fig. 1e), suggesting recent integration. The lack of older ALE4 insertions within the TR region suggests efficient removal of the elements, as has been proposed for centromeric ATHILA elements5, or recent expansion of the ALE4 clade. Taken together, we observe parallels in the dynamics of ALE4 and ATHILA, two deeply divergent LTR retrotransposon lineages, both of which are suggested to frequently integrate into the TR regions and purged from there efficiently.
Neo-insertion of Tal1 into centromeres
One of the centromeric ALE4 copies in A. lyrata is Tal1, which is closely related to A. thaliana COPIA93/EVADE (EVD) (Fig. 1e), sharing 81.3% (1,172 of 1,442) identity along their coding amino acid sequences25–27. EVD has been shown to preferentially integrate into gene-rich regions of A. thaliana genome26–28. We have previously induced de novo Tal1 integrations within the A. thaliana genome, and observed that the integrations are enriched in regions flanking the 178 bp TR sequences (CEN178)27. However, it remains unknown which genomic features dictate the specific integration.
Using the recently determined Col-CEN reference genome (https://github.com/schatzlab/Col-CEN), which includes complete centromere sequences3, we profiled de novo integrations of Tal1. We adapted the technique of Transposable Element Display29 for high-throughput sequencing (TEd-seq), enabling the detection of somatic neo-insertions of Tal1 in the order of 10,000–100,000 events per sample. In all five chromosomes, Tal1 integrations were confined to the centromeric TR regions (Fig. 2a,b and Extended Data Fig. 3a). Notably, the regions of Tal1 integrations were strongly associated with CENH3 enrichment (Fig. 2a,b and Extended Data Fig. 3a). In A. thaliana, CENH3 is confined to the TR regions, but it does not evenly occupy the entire repeat array3 (Fig. 2a). That is most clearly seen in the centromere TR arrays of chromosome 4 (CEN4). In CEN4, CENH3 mainly occupies the left half (short-arm side) of the TR clusters, and we observe that Tal1 preferentially integrates into the CENH3-occupied array (Fig. 2a). In all five centromeres, the CENH3 signal shows a gradient of intensity within the TR regions, and the frequency of Tal1 integration is significantly correlated with the CENH3 signal (r = 0.67) (Fig. 2a,c). These results are consistent with Tal1 integration being targeted to chromatin enriched in CENH3.
Fig. 2. De novo Tal1 integrations are confined to the TR regions occupied by CENH3.
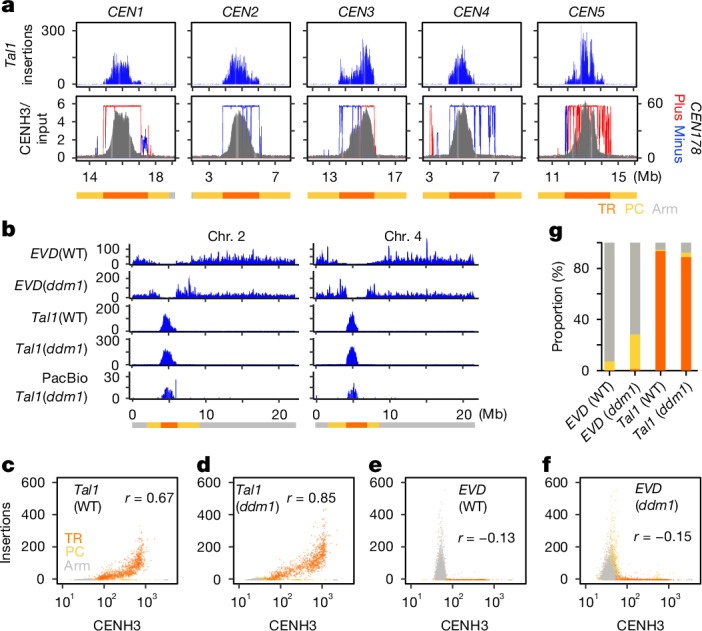
a, Top, distribution of somatic neo-insertions of Tal after introduction of a Tal1 transgene into A. thaliana. Bottom, CENH3 (ChIP/input) (grey) and CEN178 per 10 kb for forward (red) or reverse (blue) strand orientations3. Each of these values were counted in adjacent 10 kb intervals. TR (orange), pericentromeric (PC, yellow) and chromosomal arm (Arm, grey) regions are indicated by different colours at the bottom. b, Somatic neo-insertions of EVD and Tal1 in wild-type and ddm1 backgrounds. The integrations were counted in 10 kb intervals and shown by sliding windows of size 9 and step 1. Tal1 (wild type), Tal1 (ddm1) and EVD (wild type) show neo-insertions of respective TEs in the transgenic A. thaliana lines, whereas EVD (ddm1) show neo-insertions of endogenous EVD in the ddm1 mutant plants without the transgene27. Results of chromosomes two and four are shown, and the results of all five chromosomes are shown in Extended Data Fig. 3a. Detection of Tal1 integration by PacBio-seq are also shown in the bottom. c–f, Scatter plots comparing CENH3 enrichment and Tal1 (c,d) or EVD (e,f) integration frequencies in wild-type (WT) (c,e) or ddm1 (d,f) backgrounds. Each dot represents values in a single 10 kb interval. The Pearson correlation coefficient (r) is shown in each panel. g, Summary of integration specificities of EVD and Tal1 into TR, pericentromeric and arm regions in wild-type and ddm1 backgrounds. Proportion of integrations in each of these regions are shown. Results of extra lines are shown in Extended Data Fig. 3b.
Extended Data Fig. 3. De novo integration of Tal1 in the central regions of the TR clusters, which are CENH3 occupied.

a, Distributions of somatic neo-insertions of EVD and Tal1 in the five chromosomes of A. thaliana. The format is as shown in Fig. 2b. b, As shown in Fig. 2g. Results of an additional independent line for each genotype are shown.
As Tal1 is structurally similar to ATCOPIA93/EVD (ref. 25), we also examined somatic neo-insertions of EVD using the TEd-seq method. We observed that EVD preferentially integrated into the gene-rich chromosome arm regions, but not into the pericentromeric or centromeric regions (Fig. 2b,e and Extended Data Fig. 3a), where heterochromatin marks, such as H3K9me, are enriched in wild type. We examined EVD transpositions in the ddm1 (decrease in DNA methylation) mutant background, where heterochromatin marks, such as H3K9me and mC are lost from centromeric and pericentromeric regions30–36. In the ddm1 mutant background, the genomic regions of EVD integration were expanded to include the pericentromeric regions, compared to those in wild type (Fig. 2b,e–g and Extended Data Fig. 3a). However, even in ddm1, EVD retrotransposition into the centromeric core TRs was not detected (Fig. 2b,e–g and Extended Data Fig. 3a,b). These features of EVD integration are consistent with a previous report28, and stand in contrast to Tal1, which integrates into the core of centromere (Fig. 2 and Extended Data Fig. 3).
We next investigated Tal1 integration in a ddm1 mutant background to test the role of heterochromatic marks. The TR regions covered by CENH3 have relatively low heterochromatic marks, such as H3K9me and methyl-C in non-CpG contexts (mCH, where H = A, T or C), compared to the flanking pericentromeric heterochromatin3. In ddm1, despite the loss of heterochromatic marks in centromeric and pericentromeric regions, the distribution of Tal1 integration measured by TEd-seq was overall similar to that in the wild-type background (Fig. 2b–d,g and Extended Data Fig. 3). We also performed whole-genome sequencing using PacBio long-read technology to map de novo Tal1 integrations and found similar integration spectra (Fig. 2b and Extended Data Fig. 3a). Together, these results are consistent with Tal1 possessing a key centrophilic adaptation, in contrast to the closely related EVD element.
CENH3 defines region of Tal1 integration
As regions of Tal1 integration match closely to the regions occupied by CENH3, we examined the effects of change in CENH3 distribution on retrotransposition. To modify CENH3 distribution, we overexpressed this protein in the wild-type Col-0 background under the constitutively active promoter RPS5a (ref. 37). In the lines with CENH3 overexpression (hereafter referred to as CENH3-OX), the amount of chromatin-bound CENH3 increased (Fig. 3a and Extended Data Fig. 4a), and the CENH3-occupied parts of TRs significantly expanded in all five chromosomes (Fig. 3b,c and Extended Data Fig. 4b). Although CENH3 covers only part of the TR regions in non-transgenic (NT) Col-0 plants, CENH3 covers the entire TR regions in the CENH3-OX lines (Fig. 3b–d and Extended Data Fig. 4b,c). In addition, whereas wild-type CENH3 distribution shows a gradient of enrichment, with a peak towards the centre of the TR arrays, the arrays appear fully CENH3 occupied in CENH3-OX, consistent with saturated deposition (Fig. 3c,d and Extended Data Fig. 4b,c). In CENH3-OX, mCHG levels in the TR regions and pericentromeric regions decreased (Fig. 3e,f), probably because CENH3 does not have H3K9, and H3K9me is required to maintain DNA mCHG (refs. 38–40). Levels of mCHG in the TR regions were decreased in CENH3-OX to the level one order of magnitude lower than the maximum level seen in the non-transgenic controls, further supporting the interpretation that TR regions become saturated with CENH3-loaded nucleosomes in the CENH3-OX lines (Fig. 3e,f).
Fig. 3. Spread of CENH3 deposition induces mirrored expansion of Tal1 integration.
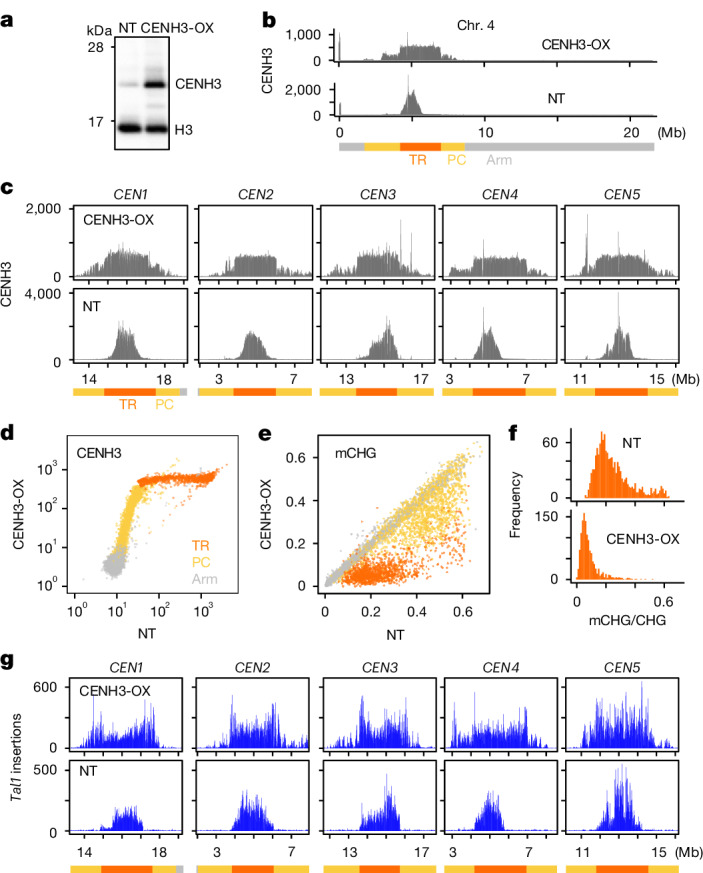
a, Western blot analyses of purified nuclei from non-transgenic (NT) line and transgenic line overexpressing CENH3 (CENH3-OX). Antibody against CENH3, which is weakly cross-reactive with H3 (anti-CENH3 C-terminal antibody) is used (validation shown in Supplementary Fig. 1a,b). Biological replicates of the same conditions and with extra anti-H4 antibody and extra independent transgenic lines are shown in Extended Data Fig. 4a and Supplementary Figs. 3 and 4 (n = 6 in total). b,c, Overexpression of CENH3 induces expansion of genomic regions covered by CENH3. b, Entire chromosome. c, Centromeric regions. Antibody recognizing CENH3 but not H3 (anti-HTR12 (CENH3 N-terminal) antibody) is used (validation in Supplementary Fig. 1a,b). ChIP–seq profiles of CENH3 (normalized by million total mapped reads and counted in 10 kb intervals) are shown for NT and CENH3-OX line. CENH3 profiles in other independent transgenic lines are shown in Extended Data Fig. 4b,c. d, Genome-wide comparison of CENH3 levels between wild type and the CENH3-OX backgrounds. Each dot represents a single 10 kb region, with different colours for TR, pericentromere and arm regions. e, DNA mCHG level of the CENH-OX line compared to parental NT line. f, Histogram of mCHG level in centromeric TR regions shown for 10 kb units. g, Distribution of Tal1 integrations compared between sibling plants with and without the CENH3-OX transgene, both in the ddm1 mutant background. Results of F2 plants in DDM1 wild-type and the ddm1 mutant backgrounds for two independent CENH3-OX families and F1 plants are shown in Extended Data Fig. 5.
Extended Data Fig. 4. CENH3 occupancy in CENH3 overexpression lines.

a, Biological replicates of Western blot analysis in Fig. 3a. While Fig. 3a uses antibody recognizing CENH3 and H3 (CENH3 Cter), the results here use additional anti-H4 antibody. The line shown in Fig. 3 is CENH3-OX-1, and other independent transgenic lines, OX-2 and −3, were also examined here with the control non-transgenic (NT) line. OX-1 and OX-2 uses overexpression promoter, while OX-3 uses native promoter. Positions of molecular weight markers (28, 17, and 10 kDa) are shown in the left. Uncropped images of this panel and Fig. 3a are in Supplementary Figs. 4 and 3, respectively, with additional biological replicates. b, As in Fig. 3c, with additional CENH3-OX lines. c, As in Fig. 3d. OX-1 and OX-2 lines show saturation of CENH3 signals in the TR regions and increase of the signal in the PC regions. In OX-3, the increase was attenuated in the PC regions and periphery of the TR regions, while the effect is robust in the internal parts of the TR regions.
We next examined the effects of CENH3 overexpression on the integration of Tal1, using progeny from crosses between the transgenic lines expressing Tal1 and CENH3-OX. In the CENH3-OX background, Tal1 integration was found across the entire TR regions (Fig. 3g and Extended Data Fig. 5). Expanded Tal1 integration was clearly observed in CEN4, where the spread of Tal1 integration into the right half of the TR cluster parallels the spread of CENH3 signal to the entire TR regions in CENH3-OX (Fig. 3g and Extended Data Fig. 5). In both ddm1 and wild-type backgrounds of CENH3-OX lines, Tal1 integration spreads into the entire TR regions, which mirrors the change in CENH3 distribution. A subset of the CENH3-OX lines also shows Tal1 integration outside the TR regions (Fig. 3g and Extended Data Fig. 5), which parallels the expansion of CENH3 into pericentromeric regions (Fig. 3b–d and Extended Data Fig. 4b,c). Together, these results directly demonstrate that Tal1 is targeted to CENH3 chromatin in vivo (further discussion in Supplementary Discussion 2).
Extended Data Fig. 5. Tal1 integrations in F2 and F1 progenies from crosses between lines over-expressing CENH3 and Tal1.

a, Distribution of Tal1 integrations compared between sibling plants with and without the CENH3-OX transgene. Results of sibling plants in DDM1 wild-type and the ddm1 mutant backgrounds are shown for two F2 families. b, Tal1 neo-insertion in F1 plants between different CENH3-OX lines and Tal1 are examined for reciprocal crosses. The format as in Fig. 3f, with only CEN4 region shown.
Genetic basis for the integration bias
Tal1 is targeted to CENH3 chromatin, whereas EVD is targeted to the gene-rich chromosome arm regions (Fig. 2). To explore the genetic basis within the Tal1 and EVD sequences for their different integration preferences, we generated chimeric constructs and examined their integration spectra genome wide (Fig. 4). We tested regions containing the conserved domain of integrase (IN1), in addition to the more diverse C-terminal region (IN2) (Supplementary Fig. 2a), as examples are known that integrases define target site specificities41–44. Chimeric constructs carrying IN2 from Tal1 within a EVD backbone (EVD_IN2_T) were found to specifically integrate into the centromere TR arrays (Fig. 4a and Extended Data Fig. 6). Conversely, chimeric constructs with IN2 region from EVD in a Tal1 backbone (Tal1_IN2_E) integrated into the chromosome arm regions (Fig. 4a and Extended Data Fig. 6). Analogous chimeric constructs of IN1 regions did not induce changes in element integration specificities (Fig. 4a and Extended Data Fig. 6). These results demonstrate that the C-terminal region of integrase is responsible for the strong integration preferences of Tal1 and EVD into the centromeres versus the chromosome arms, respectively.
Fig. 4. Mapping of integrase regions that define the centrophilic versus centrophobic integrations.
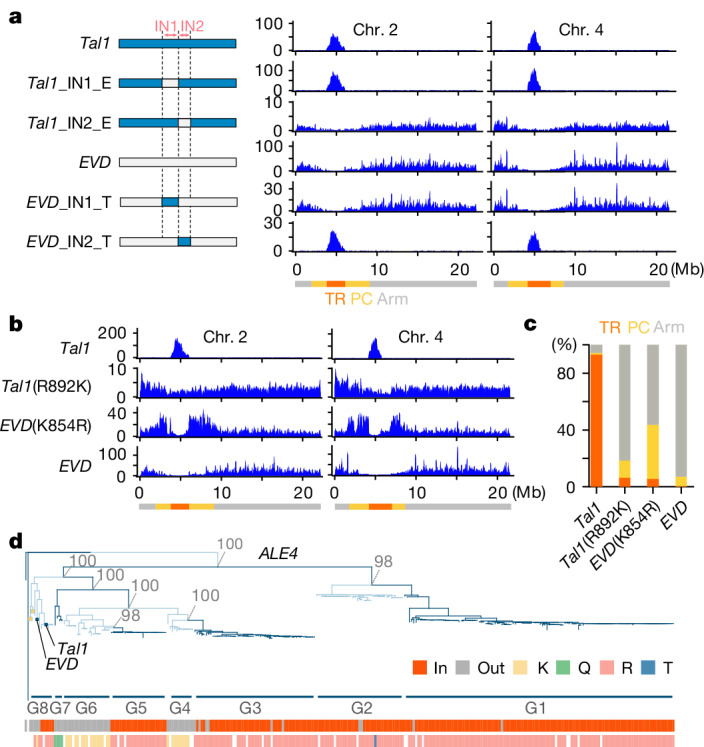
a, De novo somatic insertions of each chimeric TE examined by TEd-seq. Structure of each chimeric TE is shown schematically in the left. IN1 and IN2 correspond to conserved domains of integrase and its C-terminal regions, respectively (Supplementary Fig. 2). Blue and grey indicate the sequence of Tal1 and EVD, respectively. Integration spectra of chromosomes 2 and 4 are shown; the results of all five chromosomes, and also further transgenic lines are shown in Extended Data Fig. 6a,b. b, R/K substitutions in Tal1 or EVD integrase IN2 region changes integration specificities. Positions of the substitutions are shown in Extended Data Fig. 5b. Results of chromosomes 2 and 4 for one transgenic line for each genotype are shown. Results in the all five chromosomes and also chromosome 4 of multiple independent transgenic lines are shown in Extended Data Fig. 7. c, Summary of proportions of integration frequency of EVD, Tal1 and their K/R substitution constructs into TR, pericentromere and arm regions. d, The phylogeny within the ALE4 clade. Groups G1–8 are shown in alternating dark and light blue shading. The bottom strips show the relationship to the TR position (in/out), and the amino acid polymorphisms R, K and others. Blank positions reflect copies difficult to align. Sequence similarity levels between G1–8 are shown in Extended Data Fig. 8c, whereas their copy numbers with the in/out locations are shown in Supplementary Table 2.
Extended Data Fig. 6. Mapping of integrase regions that define the centrophilic versus centrophobic integrations of Tal1 and EVD.

The materials and format are as shown in Fig. 4a. a, Results of all five chromosomes. b, Results of multiple independent transgenic lines. Results of chromosome 4 are shown.
We further inspected the IN2 regions of Tal1 and EVD to identify causal polymorphisms that may dictate integration preference. Among the structural variations within the IN2 region examined (Supplementary Fig. 2b), an R/K non-synonymous polymorphism has a strong effect on the target site specificity (Fig. 4b,c and Extended Data Fig. 7). R892K substitution in the coding region of Tal1 converts its integration specificity to that of EVD (Tal1 (R892K) in Fig. 4b,c and Extended Data Fig. 7). Compared to the replacement of the entire IN2 region (Tal1_IN2_E in Fig. 4a), however, low but significant integrations into the centromeric TR regions were still detected in Tal1 (R892K), suggesting that extra variation within the IN2 region may contribute to target site preference. Conversely, the K854R substitution of EVD significantly changes integration specificity from that seen with either EVD or Tal1 (Fig. 4b,c and Extended Data Fig. 7). Specifically, highest EVD (K854R) integration rates were observed in the pericentromeric regions, with low levels of integration into the centromeric TRs. Thus, single R/K substitution within the C-terminal of integrase has a strong impact on retrotransposon integration specificities, and governs the contrasting centrophilic versus centrophobic integration specificities of Tal1 and EVD. The switches between the contrasting target specificities are also suggested by the phylogenetic analysis shown below.
Extended Data Fig. 7. R/K substitutions in Tal1 or EVD integrase IN2 region changes integration specificities.

The materials and format are as shown in Fig. 4b,c. a, As in Fig. 4b. Results of all five chromosomes are shown. b, c, As in Fig. 4b,c. Results of two biological replicates are shown.
Evolution of the integration bias
Analogous K/R substitutions are also observed among ALE4 copies other than Tal1 and EVD. On the basis of phylogenetic relationships and the levels of sequence similarity, we subdivided ALE4 into eight groups, G1–G8 (Fig. 4d and Extended Data Fig. 8). The centrophilic Tal1 and centrophobic EVD both belong to G8. Among the other groups, G3–G6 members share high level of similarities in the overall sequence (Fig. 4d and Extended Data Fig. 8c); however, G4 and G6 are exclusively centrophobic, whereas G3 and G5 are nearly always localized inside the A. lyrata centromeric TR regions (Fig. 4d). The centrophobic G4 and G6 members have longer terminal branches on the phylogenetic tree compared to centrophilic G3 or G5 (Fig. 4d). Notably, the centrophobic distribution of G4 and G6 and centrophilic distribution of G3 and G5 (and also G1 and G2) are strongly associated with the R/K substitution (Fig. 4d bottom and Extended Data Fig. 8d), which govern the contrasting integration specificities of Tal1 and EVD within G8. Thus, the drastic changes in the integration spectra induced by K/R substitutions in Ta11 and EVD (Fig. 4b,c), are reflected by recurrent evolutionary conversions of this site, which is associated with centrophilic versus centrophobic properties (there is further discussion about their conserved mode of integration in Supplementary Discussion 3 and Extended Data Figs. 9 and 10).
Extended Data Fig. 8. ALE4 phylogenetic trees.

a, Same tree as in Fig. 4e based on the concatenated integrase (PF00665) and reverse transcriptase (PF07727) core domains. b, Tree generated by using the near complete length of the integrase gene. The longest open reading frame of every element the sequence between the first amino acid of the integrase core domain (PF00665) and immediately upstream of the first amino acid of the reverse transcriptase core domain (PF07727) is used. The G1-8 classification of the ALE4 elements based on the ‘a’ tree are colour-coded in the ‘b’ tree to show that the branching pattern is consistent between the two trees (e.g. G1/G2 and G3-6 clustering). Bootstrap support of key nodes and the position of Tal1 and EVD are shown. c, Levels of pairwise sequence similarity between and within G1-8 groups that exceed the 80% (top) and 70% (bottom) identity thresholds. G1-G2 and G3-6 share high levels of sequence similarity. d, Proportion of ALE4 elements inside and outside the centromeric TRs that contain the R or K amino acid polymorphism. A small number contain Q. Blank parts reflect copies difficult to align.
Extended Data Fig. 9. Tal1 and EVD show similar local integration bias.

a, Schematic representation of the structure of retrotransposon integration sites. The integration site of the copia is shown by grey triangle; and the two strands of recipient genomic DNA are also shown by grey. As is the other copia elements, double strand break formation during transposon integration generates target site duplication (TSD) of five nucleotides. The central position of the TSD is counted as zero for estimating the integration site bias with keeping the symmetry. b, Nucleotide composition of −5 ~ +5 positions. The results are based on 108,545 of EVD integrations (bottom) and 23,228 of Tal1 integrations outside the TR regions in the CENH3-OX line (top) are shown. c, The biases shown in the panel b are compared between EVD and Tal1. In the panels pA, pT, pC, or pG, each dot represents the proportion of each nucleotide at −5 ~ + 5 sites. The numbers are indicated for positions with strong bias, such as +4 and +2 of pA. It is also noted that the bias is detectable at symmetrical positions of pA-pT and pC-pG combinations.
Extended Data Fig. 10. Local integration bias in ALE1/2/3/4.

As in Extended Data Fig. 9, integration bias of the ALE copies present in the MN47 genome were estimated and compared to that of Tal1 neo-insertions. Number of each of ALE copies examined are shown in parenthesis. Pearson correlation coefficient (r) is shown for each graph. Integration bias of Tal1 is conserved among ALE4 (top). It is also conserved to ALE1, but they differ in ALE2 and ALE3. The results suggest that local integration specificity evolves independent of the transitions of centrophilic/centrophobic properties.
Discussion
We characterized control of the de novo targeting of the centrophilic LTR retrotransposon Tal1. Although centromeric retroelements are commonly observed across eukaryotes, the mechanistic characterization of their integration preference remains incomplete in any organism. Notably, however, it was recently shown that a K to R amino acid substitution in the HIV-1 integrase C-terminal domain causes this retrovirus to integrate into the centromeres, instead of genic regions45,46. Our results showed that analogous reversible and recurrent K/R substitutions within ALE4 integrase C-terminal domains control evolution of centrophilic versus centrophobic integration preferences (there is further discussion about the C-terminal domain of integrases in Supplementary Discussion 4). In addition, expansion of the TR regions occupied by CENH3 results in a mirrored expansion of Tal1 integration, consistent with centromeric chromatin dictating Tal1 integration. Mechanistically, it will be interesting to investigate how the centrophilic properties of Tal1 are related to convergent adaptations in ATHILA and other centrophilic TEs3,5.
Despite the large variation in the size of centromeric TRs in natural accessions of A. thaliana, the regions covered by CENH3 remains nearly constant, suggesting underlying homeostatic mechanisms5. This homeostasis seems to depend on CENH3 expression level, as the CENH3-OX lines show the spreading of regions occupied by CENH3. Although CENH3 localization shows a gradient of accumulation in wild-type centromeres, CENH3-OX lines instead show a plateau of CENH3 accumulation, which parallels loss of heterochromatic marks. The CENH3-OX lines are viable and fertile, as is the case for a variety of Arabidopsis mutants of the chromatin components and modifiers11,13,40,47–49. Further genetic studies of the interplay among chromatin proteins, TRs and centrophilic TEs will provide mechanistic understanding of chromosome and centromere evolution conserved across eukaryotes.
Methods
Plant materials and growth conditions
The A. thaliana Columbia-0 (Col-0) accession of wild type and the ddm1-1 mutant30 were used throughout. The seeds were germinated on a plate of 0.5× or 1× Murashige and Skoog medium. After keeping in dark at 4 °C for 2–3 days, the plants were grown at 22 °C under long-day conditions of 16 h of light and 8 h of dark. Plant samples were harvested directly from the plate or transferred to soil for genetics.
TEd-seq library construction
A detailed protocol for TEd-seq50 can be found at https://www.protocols.io/view/ted-seq-c7seznbe. Before preparation of the TEd-seq library, 30 µM of custom oligonucleotide adaptor was prepared as follows: 90 µl of 100 µM P7_adapter_up (5′-GTGACTGGAGTTCAGACGTGTGCTCTTCCGATC*T-3′, *phosphorothioate bond), 90 µl of 100 µM P7_adapter_bottom (5′-pGATCGGAAGAGCATC**−3′, p denotes phosphorylation, **dideoxy-C), 30 µl of T4 ligase buffer and 90 µl of H2O were mixed. The mixture was heated at 95 °C for 2 min and cooled to 25 °C over 45 min. The TEd-seq library was prepared as follows. In most samples (see Supplementary Table 3 for details), genomic DNA was extracted from roughly 30 10-day-old seedlings using Nucleon Phytopure DNA extraction kit (GE Healthcare). Next. 500 ng of genomic DNA was suspended in 100 µl of TE buffer and sheared into the length of 250–500 bp using Bioruptor Pico (Diagenode) for three cycles of 30 s on/30 s off. The sheared DNA was cleaned up using 0.9× SPRIselect (Beckman Coulter), resuspended in 25 µl of 0.1× TE buffer and subsequently END-repaired, A-tailed and ligated to custom oligonucleotide adaptors using NEBNext Ultra II DNA Library Prep Kit for Illumina (NEB) with the reaction scale by half. Adaptor-ligated DNA was size selected using 0.13× SPRIselect for first and second bead addition, and eluted in 15 µl of 10 mM Tris-HCl pH 8.0. Then, nested PCR was performed to enrich fragments containing the terminal sequence of specific TE. For the first PCR, 7.5 µl of purified adaptor ligated DNA, 2.5 µl of adaptor specific primer, 2.5 µl of TE specific primer, 12.5 µl of NEBNext Ultra II Q5 Master Mix were mixed and PCR amplified with the following condition: 98 °C for 30 s, 20 cycles of (98 °C for 10 s, 61 °C for 75 s), 61 °C for 5 min. The primer sequences used in first PCR are shown in Supplementary Table 4. The first PCR product was cleaned up using 0.9× SPRIselect and eluted in 15 µl of 0.1× TE. The purified first PCR product was diluted ten times with 0.1× TE and used as a template in second PCR. In the second PCR, P7_primers with index and P5_TE_primers with index shown in Supplementary Table 4 were used for dual indexing. Then, 2.5 µl of first PCR product, 6.25 µl of NEBNext Ultra II Q5 Master Mix, 1.25 µl of P7_primer with index, 1.25 µl of P5_TE_primer with index, 1.25 µl of H2O were mixed and amplified under the following conditions: 98 °C for 30 s, two cycles of 98 °C for 10 s, 61 °C for 75 s, eight cycles of 98 °C 10 s, 72 °C for 75 s, 72 °C for 5 min. The second PCR product was cleaned up with 0.9× SPRIselect and diluted in 15 µl of 0.1× TE. The final library product should contain 41 and 61 bp of the 5′ LTR terminal sequences of Tal1 and Evade, respectively. Sequencing was performed at Macrogen Japan Corp., using the Illumina Hiseq X platform or Novaseq X with a read length of 151 bp. The detailed experimental conditions for library preparation are shown in Supplementary Table 3.
TEd-seq analysis
Source code for the TEd-seq analysis can be accessed at (https://github.com/LeanQ/TED_seq_Tsukahara_2024). Briefly, TEd-seq fastq files were mapped to the 5′ terminal sequence of TE (1–144 bp of Evade or 1–105 bp of Tal1 shown in the file of ‘target_TE_sequence_extremity.fa’) using Bowtie2 (v.2.5.3)51 with the parameter ‘--local --very-sensitive’. Pair-end reads in which only one mate mapped over 5′ terminal sequence of TE were extracted using Picard tools (v.2.27.5) (https://broadinstitute.github.io/picard/) with the function of ‘FilterSamReads’ and then extracted discordantly mapped reads. Those reads were then mapped to Col-CEN_v1.2 reference genome using Bowtie2 with the parameter ‘--local --very-sensitive’, and the mapped data was converted to BAM files using SAMtools (v.1.9) to generate ‘clip_disc-local.sorted.bam’ files. To detect de novo somatic insertions of TEs, clip_disc-local.sorted.bam files were converted to bedfiles using BEDTools (v.2.31.1)52 with the ‘bamtobed’ function. The sequence reads that contain de novo insertion site should be soft-clipped reads, in which the terminal sequence of TE is soft-clipped. Within the soft-clipped reads, the start position of alignment to the reference, which is the flanking nucleotide of soft-clipped region was regarded as an insertion site. The reads mapped within the upstream 1 kilobase (kb) and downstream 1 kb of the regions that are annotated as Evade (AT5TE20395) and its related copy (AT1TE41580) (shown in the file of ‘targeted_TE_sequences.bed’) were removed using the ‘intersect’ function of BEDTools, as they are not de novo insertions. The reads mapped to 1–30 kb of chromosome 2 were also removed as they were systematically found in all samples, including wild-type controls, and therefore do not correspond to bona fide de novo insertions. To obtain genome-wide integration landscapes, the number of insertion sites without duplicates were counted in non-overlapping 10 kilobase pair (kbp) windows genome wide using the ‘coverage’ function of BEDTools. The number of insertion sites were plotted using the packages of ggplot2 (v.3.4.4)53, readr (v.2.1.5)54 and dplyr (v.1.1.4)55 in R software (v.4.3.2)56.
DNA extraction for PacBio sequencing
Genomic DNA was extracted from 2 g of aerial parts of 25-day-old Tal1 transgenic plants (ddm1 mutant background), which were put in dark place for 2 days before sampling. Genomic DNA was extracted by the method of Carlson lysis buffer containing cetyl trimethyl ammonium bromide (CTAB)57 using Genomic-tip (Qiagen) in the following conditions. The frozen plant tissue was ground with a mortar and a pestle with liquid nitrogen into fine powder, and put it into Carlson lysis buffer (100 mM Tris-HCl pH 9.5, 20 mM EDTA, 1.4 M NaCl, 1% PEG 6000, 2% CTAB, 0.1% b-mercaptoethanol) heated at 74 °C in advance and incubated at 74 °C for 20 min inverting every 5 min. After incubation, when the sample was cooled down to room temperature, 20 ml of chloroform:isoamyalcohol (24:1) was added and mixed until homogenized and centrifuged at 3,000 rpm for 10 min. Then 20 ml of chloroform:isoamyalcohol (24:1) was added to the supernatant and mixed until homogenized. The sample was centrifuged at 3,000 rpm for 1 min and 20 ml of 2-propanol was added, mixed and incubated at 4 °C overnight. The sample was centrifuged at 3,500 rpm for 30 min and the supernatant was discarded. Next, 70% ethanol was added and centrifuged at 3,500 rpm for 10 min and the supernatant was discarded completely. The pellet was suspended with 1 ml of TE buffer on ice and 9 ml of Buffer G2 was added and mixed. Then, 18 µl of 100 mg ml−1 RNase A was added to the tube and incubated at 37 °C for 30 min. Next, 90 µl of proteinase K (Qiagen) was added to the sample and incubated for 50 °C for 1 h. After centrifugation at 10,000g, the supernatant was purified with Genomic-tip_100/G (Qiagen) following the manufacturer’s protocol. Then, 0.7× volume of 2-propanol was added to the eluted DNA, inverted several times and centrifuged at 10,000g for 20 min. Next, 70% ethanol was added to the pellet and centrifuged at 10,000g for 20 min. The pellet was dissolved in 100 µl of TE buffer. Extracted DNA was quantified with Qubit double-stranded DNA High Sensitivity Assay kit (Thermo Fisher Scientific) and Nanodrop 2000 (Thermo Fisher Scientific).
Library preparation and analysis of PacBio sequencing
Extracted DNA was sheared with g-tube (Covaris). The SMRT library was prepared by SMRTbell express template prep kit (Pacific Bioscience) and the libraries were size selected (greater than 30 kb) using BluePippin system (Saga Science). The libraries were sequenced by PacBio Sequel (Pacific Bioscience) using Binding Kit v.3.0 and Sequencing Kit v.3.0 with the continuous long-read sequencing mode. One SMRT cell (Sequel SMRT Cell 1 M v.3 LR) was used for each library and ran for 20 h. The SMRT sequencing data was generated at a coverage of 101×, N50 of 30,210 bp and a mean read length of 16,298 bp. The longest subreads were extracted from the sequencing data (682,486 subreads). The extracted subreads were mapped to 484 bp of the LTR sequence of Tal1 (1,024 reads). The reads with less than 200 nucleotides (nt) of mapped region were removed from the analysis. The rest of the reads were mapped to Col-CEN reference genome3 (ASM2311539v1 (GCA_023115395.1)) and 917 reads were mapped. Minimap2 (v.2.15-r905) was used for the mapping with the parameter ‘-c -x map-pb’. Among the 917 of mapped reads of Tal1(ddm1), the reads that had more than 3,560 bp (the length of 20 copies of CEN178) of the genomic sequence flanking Tal1 were extracted. Many Tal1 insertions are often detected in each PacBio read, but for the analyses here, we used only the best Tal1 insertion match from each read. The number of Tal1-inserted site per 100 kbp of genomic sequence were counted.
Construction of CENH3 overexpression line
CENH3 overexpression line was generated as follows. For CENH3-OX-1, 2 and 4, CENH3 (At1g01370) coding region including intron was amplified from genomic DNA of wild-type Col-0. The amplified CENH3 fragment was introduced into XmaI/BamHI-digested pPLV01-pRPS5a vector that was generated by inserting pRPS5a promoter sequence in the HpaI site of pPLV01 vector58. For CENH3-OX-3, upstream region and coding region of CENH3 was amplified from genomic DNA of wild-type Col-0 and was introduced into XhoI/BamHI-digested pPLV01 vector. The primers used for the constructions are shown in Supplementary Table 4. The amplified CENH3 fragment and the digested vector were assembled using NEBuilder HiFi assembly Master Mix (NEB). The assembled product was introduced into the Escherichia coli DH5a strain by the heat shock method. The extracted plasmid was introduced into Agrobacterium tumefaciens GV3101::pMP90 by electroporation. The agrobacterium with transgene was introduced into Arabidopsis wild-type Col-0 by the floral dip method59. Transgenic T1 plants were selected in the Murashige and Skoog medium with 50 µg ml−1 of Basta. Plants with a homozygous transgene were selected in T2 plants. T2 or T3 plants were used for chromatin immunoprecipitation with sequencing (ChIP–seq).
Western blotting
Here, 0.5 g of 2-week-old seedlings from non-transgenic line (wild-type Col-0) or CENH3 overexpressing lines were ground into fine powder with liquid nitrogen, and nuclei were isolated by the method described previously60. Proteins were separated by 15% SDS–PAGE and then transferred to a polyvinyl difluoride (Cytiva) membrane using Trans-Blot SD Semi-Dry Cell (Bio-Rad). Primary antibodies against H3 (0.2 µg ml−1; Abcam, ab1791), CENH3 C-terminal (0.2 µg ml−1; affinity-purified rabbit polyclonal antibody against the peptide CRKDFELARRLGGKGRPW), HTR12 (CENH3 N-terminal) (0.25 µg ml−1; affinity-purified rabbit polyclonal antibody against the peptide RTKHRVTRSQPRNQTDAC) and H4 (0.24 µg ml−1; affinity-purified rabbit polyclonal antibody against the peptide CKRQGRTLYGFGG), and peroxidase-linked secondary antibody against rabbit IgG (1:10,000 dilution; Cytiva, NA934) were used for western blotting. Signals were developed using Western BLoT Quant Horse Radish Peroxidase Substrate (Takara) and detected using iBright Imaging System (Thermo Fisher Scientific).
Expression and purification of recombinant Arabidopsis H3 and CENH3
The DNA fragment encoding AtCENH3 was inserted into the pET-15b vector (Novagen), in which the tobacco etch virus protease recognition site was introduced instead of removal of the thrombin recognition site. The expression and purification of A. thaliana H3.1 and CENH3 proteins were performed as described previously61. Purified recombinant AtH3 and AtCENH3 proteins (50 ng each) were used for the validation of antibodies used in this study.
CENH3 ChIP–seq
Here, 0.4–0.5 g of 2-week-old whole seedlings were frozen with liquid nitrogen, ground into fine powder with motor and pestle and lysed with fixing buffer (PBS with 1% formaldehyde, 0.3% Triton X-100, 1 mM Pefabloc SC (Roche) and cOmplete EDTA-free Protease Inhibitor Cocktail (Roche)). The suspension was rotated at room temperature for 10 min for crosslinking. Then 0.2 M of glycine was added for quenching and rotated for 5 min at room temperature. The sample was centrifuged at 5,000g, 4 °C for 5 min, the pellet was washed once with PBS and it was resuspended with low-salt ChIP buffer without Triton X-100 (50 mM HEPES-KOH, 150 mM NaCl, 1 mM EDTA, 0.1% sodium deoxycholate, 0.1% SDS) to make the volume 900 µl. The sample was divided equally into three tubes, and sheared into 200–600 bp sizes using the Picoruptor sonication device (Diagenode) with 12 cycles of 30 s on/30 s off. The sonicated samples were centrifuged at 20,000g at 4 °C for 10 min, and Triton X-100 was added to the supernatant (final concentration: 1%). The sonicated chromatin was incubated with 0.5 µg of anti-HTR12 (CENH3 N-terminal) antibody62 overnight at 4 °C, and then incubated with Dynabeads Protein G (Veritas) at 4 °C for 2 h. The incubated beads were washed once with 1 ml of low-salt ChIP buffer (50 mM HEPES-KOH, 150 mM NaCl, 1 mM EDTA, 1% Triton X-100, 0.1% sodium deoxycholate, 0.1% SDS), twice with 1 ml of high-salt ChIP buffer (50 mM HEPES-KOH, 500 mM NaCl, 1 mM EDTA, 1% Triton X-100, 0.1% sodium deoxycholate, 0.1% SDS), once with 1 ml of LiCl buffer (10 mM Tris-HCl, pH 7.8, 1 mM EDTA, 0.25 M LiCl, 1% IGEPAL CA-630, 1% sodium deoxycholate) and once with 1 ml of TE buffer (10 mM Tris-HCl, pH 7.8, 1 mM EDTA), while rotating for 10 min at 4 °C each time. DNA was eluted in 100 µl of elution buffer (10 mM Tris-HCl, pH 7.8, 0.3 M NaCl, 5 mM EDTA, 0.5% SDS), incubated overnight at 65 °C and then purified with the Monarch PCR & DNA Cleanup kit (New England Biolabs). The DNA was quantified with the Qubit dsDNA High Sensitivity Assay kit (Thermo Fisher Scientific), and 1–2 ng of DNA was used for preparing library with ThruPLEX DNA-seq kit (Clontech). The libraries were sequenced using HiSeq X Ten sequencer (Illumina) or Novaseq X plus sequencer at Macrogen Japan Corp.
ChIP–seq analysis
ChIP–seq data was processed as previously described63 with some modifications. The fastq file of ChIP–seq data was quality filtered using Trimmomatic (v.0.39)64 and mapped to Col-CEN_v1.2 reference genome. Mapping was conducted with Bowtie2 (v.2.4.4)51 with no option. The mapped data was converted to BAM files using SAMtools (v.1.6)65 and converted to BED files using BEDTools (v.2.26.0)52. The number of reads overlapped with 10 kb bin of chromosomes were counted using coverage function of BEDTools to make bedgraph files. Signals were plotted in units of reads per million mapped reads using ggplot2 (v.3.4.4)53 package in R software (v.4.3.2)56. Reads that aligned to the chloroplast or the mitochondrial genome were not included in normalization. In Figs. 2c–f and 3d, a few (less than seven in each panel) dots are out of the ranges shown. The range of TR region around each centromere follow previous analyses3. The range of pericentromeric (PC) region surrounding each centromeric TR is defined as continuous 10 kb block with average mCHG > 0.25.
DNA methylation profiling by ONT
DNA methylation profiling of genomes including the centromeric TR regions has been performed as described previously3. Three weeks old seeding were ground in liquid nitrogen and the DNA was extracted using NucleoBond HMW DNA kit (MACHEREY-NAGEL) as per the manufacturer’s instructions. A sequencing library was prepared using LSK-110 ligation kit, and sequenced using two MinION R9 flowcells. Methylation calling was performed as previously reported66 with the modification that R9 reads were filtered for length and accuracy using Filtlong (v.0.2.0) (--min_mean_q 90, --min_length 5,000) and methylation prediction for the CG, CHG and CHH contexts were called using DeepSignal-plant (v.1.6.1) using the model: model.dp2.CNN.arabnrice2-1_120m_R9.4plus_tem.bn13_sn16.both_bilstm.epoch6.ckpt.
Constructions of chimeric retrotransposons
To generate each construct of chimeric retrotransposons, DNA fragments were amplified by PCR using the plasmid Tal1_pRI909 (ref. 27) or EVADE_pRI909 as templates. To obtain Evade_pRI909 that contains a full length of EVADE (AT5TE20395, 5,329 bp), the 5′ half and 3′ half of AT5TE20395 were amplified by nested PCR from A. thaliana Col-0 genome using primers with the sites of restriction enzyme as shown in Supplementary Table 4. Second PCR products were digested with restriction enzymes: PstI and EcoRI for the 5′ half fragment, and EcoRI and BamHI for the 3′ half fragment. Both fragments and pRI909 binary vector (Takara) digested by PstI and BamHI were ligated with Mighty Mix (Takara). The plasmids and primers used in the construction of the chimeric retrotransposons are shown in Supplementary Table 4. PCR-amplified fragments and HpaI-linearized pPLV02 vector or pPLV03 (ref. 58) vector were separated by electrophoresis. The gel bands were extracted and purified by QIAquick Gel Extraction Kit (Qiagen) or Fastgene Gel/PCR Extraction Kit (Fastgene). Purified DNA fragments were assembled into a pPLV02 or pPLV03 vector using NEBuilder HiFi DNA assembly (New England Biolabs) and cloned in E. coli. Transgenic lines were generated by Agrobacterium-mediated gene transfer as described previously27. To confirm the activation of the introduced TE, the presence of extrachromosomal circular DNA of the TE in the transgenic plants was examined by PCR67. The primers and conditions used for the PCR are shown in Supplementary Table 4.
Analysis of nucleotide sequence bias around integration sites of EVD and Tal1
To examine local integration bias of EVD and Tal1, the region around integration site of each TE was extracted as follows. TE sequence in Read1 of TEd-seq reads (61 bp of 5′ terminals sequence for EVD or 41 bp of 5′ terminal sequence for Tal1) were trimmed with Cutadapt 4.4 (ref. 68) with the parameter ‘-gGCCCACTCTCTTGTAGTACATATCCAATACTAGGCCTTTCTTATTTGAGTCTTGATCAATA-m 30’ for Evade and ‘-gATGTACGGATGGGTGCTTCACTCTTCGTTTCTTGATCAATA-m 30’ for Tal1. The trimmed reads were mapped to the Col-CEN_v1.2 reference genome using Bowtie2 (v.2.5.1) with the parameter ‘--local --very-sensitive’, and the mapped data was converted to BAM files using SAMtools (v.1.17). The central position of 5 bp target site duplication shown in Extended Data Fig. 9 was regarded as position zero. Next, 11 bp of integration site (−5 to +5 nucleotides from the centre of target site duplication) was extracted from Col-CEN_v1.2 using the ‘getfasta’ function of BEDTools (v.2.31.0). The number and the ratio of each nucleotide at each position in the 11 bp of integrated region were calculated.
Annotation of Arabidopsis LTR elements
TEs were identified for the NT1 and MN47 natural accessions of A. lyrata and for the Col-CEN reference genome of A. thaliana using the the Extensive De novo TE Annotator pipeline (v.2.0.1)69 with parameters --anno 1 and --sensitive 1, and the Repbase70 Arabidopsis-specific TE library (athrep.ref) as --curatedlib. Intact Ty1/Copia (110 in Col-CEN, 699 in NT1 and 800 in MN47) and Ty3 (96, 830 and 1,029) LTR retrotransposons were further classified into lineages using TEsorter 1.3 (-db rexdb-plant -nolib)71. For all analysis, we removed elements that did not have consistent superfamily classification between Extensive De novo TE Annotator and TEsorter (for example, an element needed to be classified as Ty3 by both pipelines). Following this approach, we retrieved 55, 393 and 295 ALE in Col-CEN, NT1 and MN47, respectively, and 49, 340 and 287 ATHILA.
Phylogenetic analysis and characterization of ALE and ATHILA
For the phylogenetic analysis, we further kept the subset of ALE (47, 368, 276) and ATHILA (11, 112, 71) that contained in correct order the hidden Markov models of all five genes (gag, protease, integrase, reverse transcriptase and RNaseH) according to TEsorter. For ATHILA, we also kept elements that contained only the gag and protease genes (35, 207, 205), because they represent a non-autonomous deletion derivative that is found in high numbers in A. thaliana and A. lyrata5. For ALE, we aligned the concatenated integrase and reverse transcriptase hidden Markov model domains retrieved from TEsorter for ALE with MAFFT (v.7.453, --globalpair --maxiterate 1,000)72. For ATHILA, we aligned the full-length DNA sequences with MAFFT (v.7.453, --retree 2 --maxiterate 50), so that elements that lacked the integrase, reverse transcriptase and RNaseH could be included in the tree. We used FastTree (v.2.1.11)73 with default parameters to generate maximum-likelihood trees.
The age of LTR retrotransposons was estimated using the sequence divergence between the two LTRs of an intact element. A pairwise alignment was produced for each pair of LTR sequences using MUSCLE (v.3.8.1551)74. We used the recent dataset of ATHILA based on the annotation of 66 A. thaliana accessions5. To identify the R/K polymorphism in the ALE4 branch, we looked for open reading frames with getorf from the EMBOSS:6.6.0.0 (ref. 75) using the internal region of every element. As in the phylogenetic analysis, we only surveyed elements that included all five genes. We focused on the longest open reading frame to examine and catalogue the R or K presence at the C-terminal end of the integrase gene with a custom R script. Downstream analyses were performed and plotted in R language and environment56, using packages included in Tidyverse collection (v.2.0.0)76, circlize (v.0.4.15)77 and ggtree (v.3.10.0)78.
Characterization of ALE4-like elements in other species
Sequences related to EVD and Tal1 were retrieved from Barbarea vulgaris (GCA_963667165.1), Eutrema japonicum (GCA_030161315.1 and GCA_030161335.1)79 and Raphanus sativus (GCF_000801105.2)80. The reverse transcriptase core domain region from A. thaliana COPIA20 was used to query the homology search by tBLASTn. Sequences with values less than 1 × 10−50 (for B. vulgaris and R. sativus) or 1 × 10−80 (for E. japonicum) were retrieved from genomic sequence assembly for analyses. Sequences including both 10 kb regions from the BLAST hit regions were obtained from genome assemblies to check presence of satellite sequences. The reverse transcription core domain regions were aligned for constructing phylogenetic trees. Aligned sequences were checked manually to delete sequences with more than 100 bp ambiguous or missing sites. Phylogenetic trees for reverse transcription regions were constructed by the neighbour-joining method with p-distances. EVD, AT1TE54585 (COPIA93) and AT2TE13385 (COPIA20) from A. thaliana and consensus sequences from clusters 1 to 4 of copia93/20 sequences from A. lyrata with other A. thaliana COPIA families (COPIA92, COPIA67, COPIA5, COPIA49, COPIA33, COPIA69, COPIA63, COPIA45 and COPIA35) were also included. All phylogenetic analyses were done by MEGA v.7.0 (ref. 81).
Reporting summary
Further information on research design is available in the Nature Portfolio Reporting Summary linked to this article.
Online content
Any methods, additional references, Nature Portfolio reporting summaries, source data, extended data, supplementary information, acknowledgements, peer review information; details of author contributions and competing interests; and statements of data and code availability are available at 10.1038/s41586-024-08319-7.
Supplementary information
This file contains Supplementary Discussion 1–4, Figs. 1–5 and Tables 1 and 2.
Experimental conditions for TEd-seq.
Plasmids and primers used for PCR.
Acknowledgements
We thank T. Sasaki for helpful advice and providing pPLV01-pRPS5a vector, A. Terui for technical assistance, and NASC/ABRC for distributing the seeds. The computations were partially performed on the NIG (National Institute of Genetics) supercomputer at NIG, Japan. This work was supported by grants from Human Frontier Science Program (HFSP) (RGP0025/2021) to I.H. and T.K., BBSRC (BB/V003984/1) to I.H., Japan Science and Technology Agency (JST) CREST (JPMJCR15O1) to T.K., PREST (JPMJPR20K3) to A.O., Japan Society for the Promotion of Science (JSPS) (22KJ0502 to S. Tsukahara, 22H04925 to A.T., 21K06284 to A.K., 21H04977 and 23H00365 to T.K.), Royal Society awards (UF160222, RF/ERE/221032, URF/R/221024, RGF/R1/180006, RGF/EA/201030 and RF/ERE/210069) to A.B. and Centre National de la Recherche Scientifique (IRP SYNERTE) to L.Q.
Extended data figures and tables
Author contributions
A.B. and E.P.-R. designed and performed the analysis shown in Figs. 1 and 4d and Extended Data Figs. 1 and 8. For the other parts, S. Tsukahara, S.Y., B.L., A.N., M.N., A.O., A.T. and S.I. designed and performed the experiments and analysed the data. A.E. and S.O. analysed the data. H.I., S. Tominaga, J. and K.K. performed the experiments. Z.L., K.N. and F.B. provided the antibodies. A.K., L.Q., I.H. and T.K. conceived the project and analysed the data. S. Tsukahara and T.K. wrote the manuscript with incorporating opinions of the other authors.
Peer review
Peer review information
Nature thanks the anonymous reviewers for their contribution to the peer review of this work. Peer reviewer reports are available.
Data availability
The TEd-seq data and ChIP–seq data have been deposited at National Center for Biotechnology Information Gene Expression Omnibus database with accession numbers GSE263224 and GSE263225, respectively. The accession number of the Tal1 sequence is LC713258 ((DDBJ), (NCBI)). The PacBio data have been deposited with links to BioProject accession number PRJDB18115 in the DDBJ BioProject database. Uncropped images of western blot analyses are provided as Supplementary Figs. 3–5. Data files used for generating results in Figs. 1 and 4d and Extended Data Fig. 8 are available at Zenodo (10.5281/zenodo.12627139)82.
Code availability
Source code for the TEd-seq analysis is available at GitHub (https://github.com/LeanQ/TED_seq_Tsukahara_2024). Code used for generating results in Figs. 1 and 4d and Extended Data Fig. 8 are available at Zenodo (10.5281/zenodo.12627139)82.
Competing interests
The authors declare no competing interests.
Footnotes
Publisher’s note Springer Nature remains neutral with regard to jurisdictional claims in published maps and institutional affiliations.
Contributor Information
Sayuri Tsukahara, Email: stsukaha@g.ecc.u-tokyo.ac.jp.
Alexandros Bousios, Email: ab35@sussex.ac.uk.
Tetsuji Kakutani, Email: tkak@bs.s.u-tokyo.ac.jp.
Extended data
is available for this paper at 10.1038/s41586-024-08319-7.
Supplementary information
The online version contains supplementary material available at 10.1038/s41586-024-08319-7.
References
- 1.Henikoff, S., Ahmad, K. & Malik, H. S. The centromere paradox: stable inheritance with rapidly evolving DNA. Science293, 1098–1102 (2001). [DOI] [PubMed] [Google Scholar]
- 2.Malik, H. S. & Henikoff, S. Major evolutionary transitions in centromere complexity. Cell138, 1067–1082 (2009). [DOI] [PubMed] [Google Scholar]
- 3.Naish, M. et al. The genetic and epigenetic landscape of the Arabidopsis centromeres. Science374, eabi7489 (2021). [DOI] [PMC free article] [PubMed] [Google Scholar]
- 4.Altemose, N. et al. Complete genomic and epigenetic maps of human centromeres. Science376, eabl4178 (2022). [DOI] [PMC free article] [PubMed] [Google Scholar]
- 5.Wlodzimierz, P. et al. Cycles of satellite and transposon evolution in Arabidopsis centromeres. Nature618, 557–565 (2023). [DOI] [PubMed] [Google Scholar]
- 6.Ekwall, K. Epigenetic control of centromere behavior. Annu. Rev. Genet.41, 63–81 (2007). [DOI] [PubMed] [Google Scholar]
- 7.Yan, A. & Yu, H. New insights into centromeres from Arabidopsis Col-CEN assembly. Trends Genet.38, 416–418 (2022). [DOI] [PubMed] [Google Scholar]
- 8.Courret, C. et al. Rapid turnover of centromeric DNA reveals signatures of genetic conflict in Drosophila. Preprint at bioRxiv10.1101/2023.08.22.554357 (2023).
- 9.Ohzeki, J., Larionov, V., Earnshaw, W. C. & Masumoto, H. De novo formation and epigenetic maintenance of centromere chromatin. Curr. Opin. Cell Biol.58, 15–25 (2019). [DOI] [PMC free article] [PubMed] [Google Scholar]
- 10.Talbert, P. & Henikoff, S. Centromere drive: chromatin conflict in meiosis. Curr. Opin. Genet. Dev.77, 102005 (2022). [DOI] [PubMed] [Google Scholar]
- 11.Fukagawa, T. & Kakutani, T. Transgenerational epigenetic control of constitutive heterochromatin, transposons, and centromeres. Curr. Opin. Genet. Dev.78, 102021 (2023). [DOI] [PubMed] [Google Scholar]
- 12.Dudka, D. & Lampson, M. A. Centromere drive: model systems and experimental progress. Chromosome Res.30, 187–203 (2022). [DOI] [PMC free article] [PubMed] [Google Scholar]
- 13.Shimada, A. et al. Retrotransposon addiction promotes centromere function via epigenetically activated small RNAs. Nat. Plants10, 1304–1316 (2024). [DOI] [PMC free article] [PubMed]
- 14.Nagaki, K. et al. Structure, divergence, and distribution of the CRR centromeric retrotransposon family in rice. Mol. Biol. Evol.22, 845–855 (2005). [DOI] [PubMed] [Google Scholar]
- 15.Wolfgruber, T. K. et al. Maize centromere structure and evolution: sequence analysis of centromeres 2 and 5 reveals dynamic Loci shaped primarily by retrotransposons. PLoS Genet.5, e1000743 (2009). [DOI] [PMC free article] [PubMed] [Google Scholar]
- 16.Wu, J. et al. Comparative analysis of complete orthologous centromeres from two subspecies of rice reveals rapid variation of centromere organization and structure. Plant J.60, 805–819 (2009). [DOI] [PubMed] [Google Scholar]
- 17.Sharma, A. & Presting, G. G. Centromeric retrotransposon lineages predate the maize/rice divergence and differ in abundance and activity. Mol. Genet. Genomics279, 133–147 (2008). [DOI] [PubMed] [Google Scholar]
- 18.Sharma, A. & Presting, G. G. Evolution of centromeric retrotransposons in grasses. Genome Biol. Evol.6, 1335–1352 (2014). [DOI] [PMC free article] [PubMed] [Google Scholar]
- 19.Hickey, D. A. Selfish DNA: a sexually-transmitted nuclear parasite. Genetics101, 519–531 (1982). [DOI] [PMC free article] [PubMed] [Google Scholar]
- 20.Arkhipova, I. & Meselson, M. Deleterious transposable elements and the extinction of asexuals. Bioessays27, 76–85 (2005). [DOI] [PubMed] [Google Scholar]
- 21.Hu, T. T. et al. The Arabidopsis lyrata genome sequence and the basis of rapid genome size change. Nat. Genet.43, 476–481 (2011). [DOI] [PMC free article] [PubMed] [Google Scholar]
- 22.Burns, R. et al. Gradual evolution of allopolyploidy in Arabidopsis suecica. Nat. Ecol. Evol.5, 1367–1381 (2021). [DOI] [PMC free article] [PubMed] [Google Scholar]
- 23.Wicker, T. & Keller, B. Genome-wide comparative analysis of copia retrotransposons in Triticeae, rice, and Arabidopsis reveals conserved ancient evolutionary lineages and distinct dynamics of individual copia families. Genome Res.17, 1072–1081 (2007). [DOI] [PMC free article] [PubMed] [Google Scholar]
- 24.Neumann, P., Novák, P., Hoštáková, N. & Macas, J. Systematic survey of plant LTR-retrotransposons elucidates phylogenetic relationships of their polyprotein domains and provides a reference for element classification. Mob. DNA10, 1 (2019). [DOI] [PMC free article] [PubMed] [Google Scholar]
- 25.Tsukahara, S. et al. Bursts of retrotransposition reproduced in Arabidopsis. Nature461, 423–426 (2009). [DOI] [PubMed] [Google Scholar]
- 26.Mirouze, M. et al. Selective epigenetic control of retrotransposition in Arabidopsis. Nature461, 427–430 (2009). [DOI] [PubMed] [Google Scholar]
- 27.Tsukahara, S. et al. Centromere-targeted de novo integrations of an LTR retrotransposon of Arabidopsis lyrata. Genes Dev.26, 705–713 (2012). [DOI] [PMC free article] [PubMed] [Google Scholar]
- 28.Quadrana, L. et al. Transposition favors the generation of large effect mutations that may facilitate rapid adaption. Nat. Commun.10, 3421 (2019). [DOI] [PMC free article] [PubMed] [Google Scholar]
- 29.Casa, A. M. et al. The MITE family heartbreaker (Hbr): molecular markers in maize. Proc. Natl Acad. Sci. USA97, 10083–10089 (2000). [DOI] [PMC free article] [PubMed] [Google Scholar]
- 30.Vongs, A., Kakutani, T., Martienssen, R. A. & Richards, E. J. Arabidopsis thaliana DNA methylation mutants. Science260, 1926–1928 (1993). [DOI] [PubMed] [Google Scholar]
- 31.Jeddeloh, J. A., Stokes, T. L. & Richards, E. J. Maintenance of genomic methylation requires a SWI2/SNF2-like protein. Nat. Genet.22, 94–97 (1999). [DOI] [PubMed] [Google Scholar]
- 32.Gendrel, A.-V., Lippman, Z., Yordan, C., Colot, V. & Martienssen, R. A. Dependence of heterochromatic histone H3 methylation patterns on the Arabidopsis gene DDM1. Science297, 1871–1873 (2002). [DOI] [PubMed] [Google Scholar]
- 33.Soppe, W. J. J. et al. DNA methylation controls histone H3 lysine 9 methylation and heterochromatin assembly in Arabidopsis. EMBO J.21, 6549–6559 (2002). [DOI] [PMC free article] [PubMed] [Google Scholar]
- 34.Zemach, A. et al. The Arabidopsis nucleosome remodeler DDM1 allows DNA methyltransferases to access H1-containing heterochromatin. Cell153, 193–205 (2013). [DOI] [PMC free article] [PubMed] [Google Scholar]
- 35.Osakabe, A. et al. The chromatin remodeler DDM1 prevents transposon mobility through deposition of histone variant H2A.W. Nat. Cell Biol.23, 391–400 (2021). [DOI] [PubMed] [Google Scholar]
- 36.Lee, S. C. et al. Chromatin remodeling of histone H3 variants by DDM1 underlies epigenetic inheritance of DNA methylation. Cell186, 4100–4116.e15 (2023). [DOI] [PMC free article] [PubMed] [Google Scholar]
- 37.Maruyama, D. et al. Independent control by each female gamete prevents the attraction of multiple pollen tubes. Dev. Cell25, 317–323 (2013). [DOI] [PubMed] [Google Scholar]
- 38.Jackson, J. P., Lindroth, A. M., Cao, X. & Jacobsen, S. E. Control of CpNpG DNA methylation by the KRYPTONITE histone H3 methyltransferase. Nature416, 556–560 (2002). [DOI] [PubMed] [Google Scholar]
- 39.Malagnac, F., Bartee, L. & Bender, J. An Arabidopsis SET domain protein required for maintenance but not establishment of DNA methylation. EMBO J.21, 6842–6852 (2002). [DOI] [PMC free article] [PubMed] [Google Scholar]
- 40.To, T. K. & Kakutani, T. Crosstalk among pathways to generate DNA methylome. Curr. Opin. Plant Biol.68, 102248 (2022). [DOI] [PubMed] [Google Scholar]
- 41.Bushman, F. D. Targeting survival: integration site selection by retroviruses and LTR-retrotransposons. Cell115, 135–138 (2003). [DOI] [PubMed] [Google Scholar]
- 42.Gao, X., Hou, Y., Ebina, H., Levin, H. L. & Voytas, D. F. Chromodomains direct integration of retrotransposons to heterochromatin. Genome Res.18, 359–369 (2008). [DOI] [PMC free article] [PubMed] [Google Scholar]
- 43.Sultana, T., Zamborlini, A., Cristofari, G. & Lesage, P. Integration site selection by retroviruses and transposable elements in eukaryotes. Nat. Rev. Genet.18, 292–308 (2017). [DOI] [PubMed] [Google Scholar]
- 44.Maertens, G. N., Engelman, A. N. & Cherepanov, P. Structure and function of retroviral integrase. Nat. Rev. Microbiol.20, 20–34 (2022). [DOI] [PMC free article] [PubMed] [Google Scholar]
- 45.Winans, S. et al. A point mutation in HIV-1 integrase redirects proviral integration into centromeric repeats. Nat. Commun.13, 1474 (2022). [DOI] [PMC free article] [PubMed] [Google Scholar]
- 46.Marquis, K. A. et al. The HIV-1 capsid-targeted inhibitor GSK878 alters selection of target sites for HIV DNA integration. AIDS Res. Hum. Retroviruses10.1089/AID.2022.0161 (2023). [DOI] [PMC free article] [PubMed]
- 47.Wendte, J. M. & Schmitz, R. J. Specifications of targeting heterochromatin modifications in plants. Mol. Plant11, 381–387 (2018). [DOI] [PubMed] [Google Scholar]
- 48.Jiang, D. & Berger, F. Variation is important: warranting chromatin function and dynamics by histone variants. Curr. Opin. Plant Biol.75, 102408 (2023). [DOI] [PubMed] [Google Scholar]
- 49.Marimuthu, M. P. A. et al. Epigenetically mismatched parental centromeres trigger genome elimination in hybrids. Sci. Adv.7, eabk1151 (2021). [DOI] [PMC free article] [PubMed] [Google Scholar]
- 50.Vendrell-Mir, P., Leduque, B. & Quadrana, L. Ultra-sensitive detection of transposon insertions across multiple families by transposable element display sequencing. Preprint at bioRxiv10.1101/2024.08.21.608910 (2024).
- 51.Langmead, B. & Salzberg, S. L. Fast gapped-read alignment with Bowtie 2. Nat. Methods9, 357–359 (2012). [DOI] [PMC free article] [PubMed] [Google Scholar]
- 52.Quinlan, A. R. & Hall, I. M. BEDTools: a flexible suite of utilities for comparing genomic features. Bioinformatics26, 841–842 (2010). [DOI] [PMC free article] [PubMed] [Google Scholar]
- 53.Wickham, H. Ggplot2: Elegant Graphics for Data Analysis (Springer, 2016).
- 54.Wickham, H., Hester, J. & Bryan, J. readr: Read rectangular text data. R package version 2.1.5 (2024).
- 55.Wickham, H., François, R., Henry, L., Müller, K. & Vaughan, D. dplyr: A grammar of data manipulation. R package version 1.1.4 (2024).
- 56.R Core Team. R: A Language and Environment for Statistical Computing (R Foundation for Statistical Computing, 2023).
- 57.Murray, M. G. & Thompson, W. F. Rapid isolation of high molecular weight plant DNA. Nucleic Acids Res.8, 4321–4325 (1980). [DOI] [PMC free article] [PubMed] [Google Scholar]
- 58.De Rybel, B. et al. A versatile set of ligation-independent cloning vectors for functional studies in plants. Plant Physiol.156, 1292–1299 (2011). [DOI] [PMC free article] [PubMed] [Google Scholar]
- 59.Clough, S. J. & Bent, A. F. Floral dip: a simplified method for Agrobacterium-mediated transformation of Arabidopsis thaliana. Plant J.16, 735–743 (1998). [DOI] [PubMed] [Google Scholar]
- 60.Lorković, Z. J. et al. Compartmentalization of DNA damage response between heterochromatin and euchromatin is mediated by distinct H2A histone variants. Curr. Biol.27, 1192–1199 (2017). [DOI] [PubMed] [Google Scholar]
- 61.Osakabe, A. et al. Histone H2A variants confer specific properties to nucleosomes and impact on chromatin accessibility. Nucleic Acids Res.46, 7675–7685 (2018). [DOI] [PMC free article] [PubMed] [Google Scholar]
- 62.Talbert, P. B., Masuelli, R., Tyagi, A. P., Comai, L. & Henikoff, S. Centromeric localization and adaptive evolution of an Arabidopsis histone H3 variant. Plant Cell14, 1053–1066 (2002). [DOI] [PMC free article] [PubMed] [Google Scholar]
- 63.Inagaki, S., Takahashi, M., Takashima, K., Oya, S. & Kakutani, T. Chromatin-based mechanisms to coordinate convergent overlapping transcription. Nat. Plants7, 295–302 (2021). [DOI] [PubMed] [Google Scholar]
- 64.Bolger, A. M., Lohse, M. & Usadel, B. Trimmomatic: a flexible trimmer for Illumina sequence data. Bioinformatics30, 2114–2120 (2014). [DOI] [PMC free article] [PubMed] [Google Scholar]
- 65.Li, H. et al. The Sequence Alignment/Map format and SAMtools. Bioinformatics25, 2078–2079 (2009). [DOI] [PMC free article] [PubMed] [Google Scholar]
- 66.Fernandes, J. B. et al. Structural variation and DNA methylation shape the centromere-proximal meiotic crossover landscape in Arabidopsis. Genome Biol.25, 30 (2024). [DOI] [PMC free article] [PubMed] [Google Scholar]
- 67.Reinders, J., Mirouze, M., Nicolet, J. & Paszkowski, J. Parent-of-origin control of transgenerational retrotransposon proliferation in Arabidopsis. EMBO Rep.14, 823–828 (2013). [DOI] [PMC free article] [PubMed] [Google Scholar]
- 68.Martin, M. Cutadapt removes adapter sequences from high-throughput sequencing reads. EMBnet J.17, 10 (2011). [Google Scholar]
- 69.Ou, S. et al. Benchmarking transposable element annotation methods for creation of a streamlined, comprehensive pipeline. Genome Biol.20, 275 (2019). [DOI] [PMC free article] [PubMed] [Google Scholar]
- 70.Bao, W., Kojima, K. K. & Kohany, O. Repbase Update, a database of repetitive elements in eukaryotic genomes. Mob. DNA6, 11 (2015). [DOI] [PMC free article] [PubMed] [Google Scholar]
- 71.Zhang, R.-G. et al. TEsorter: an accurate and fast method to classify LTR-retrotransposons in plant genomes. Hortic. Res.9, uhac017 (2022). [DOI] [PMC free article] [PubMed] [Google Scholar]
- 72.Katoh, K. & Standley, D. M. MAFFT multiple sequence alignment software version 7: improvements in performance and usability. Mol. Biol. Evol.30, 772–780 (2013). [DOI] [PMC free article] [PubMed] [Google Scholar]
- 73.Liu, K., Linder, C. R. & Warnow, T. RAxML and FastTree: comparing two methods for large-scale maximum likelihood phylogeny estimation. PLoS ONE6, e27731 (2011). [DOI] [PMC free article] [PubMed] [Google Scholar]
- 74.Edgar, R. C. MUSCLE: a multiple sequence alignment method with reduced time and space complexity. BMC Bioinformatics 5, 113 (2004). [DOI] [PMC free article] [PubMed] [Google Scholar]
- 75.Rice, P., Longden, I. & Bleasby, A. EMBOSS: the European molecular biology open software suite. Trends Genet.16, 276–277 (2000). [DOI] [PubMed] [Google Scholar]
- 76.Wickham, H. et al. Welcome to the tidyverse. J. Open Source Softw.4, 1686 (2019). [Google Scholar]
- 77.Gu, Z., Gu, L., Eils, R., Schlesner, M. & Brors, B. circlize implements and enhances circular visualization in R. Bioinformatics30, 2811–2812 (2014). [DOI] [PubMed] [Google Scholar]
- 78.Yu, G., Smith, D. K., Zhu, H., Guan, Y. & Lam, T. T. GGTREE: an R package for visualization and annotation of phylogenetic trees with their covariates and other associated data. Methods Ecol. Evol.8, 28–36 (2017). [Google Scholar]
- 79.Tanaka, H. et al. Haplotype-resolved chromosomal-level assembly of wasabi (Eutrema japonicum) genome. Sci. Data10, 441 (2023). [DOI] [PMC free article] [PubMed] [Google Scholar]
- 80.Yu, H.-J., Baek, S., Lee, Y.-J., Cho, A. & Mun, J.-H. The radish genome database (RadishGD): an integrated information resource for radish genomics. Database2019, baz009 (2019). [DOI] [PMC free article] [PubMed] [Google Scholar]
- 81.Kumar, S., Stecher, G. & Tamura, K. MEGA7: Molecular Evolutionary Genetics Analysis version 7.0 for bigger datasets. Mol. Biol. Evol.33, 1870–1874 (2016). [DOI] [PMC free article] [PubMed] [Google Scholar]
- 82.Bousios, A. & Perez-Roman, E. BousiosLab/Centrophilic retrotransposons in Arabidopsis. Zenodo10.5281/zenodo.12627139 (2024).
Associated Data
This section collects any data citations, data availability statements, or supplementary materials included in this article.
Supplementary Materials
This file contains Supplementary Discussion 1–4, Figs. 1–5 and Tables 1 and 2.
Experimental conditions for TEd-seq.
Plasmids and primers used for PCR.
Data Availability Statement
The TEd-seq data and ChIP–seq data have been deposited at National Center for Biotechnology Information Gene Expression Omnibus database with accession numbers GSE263224 and GSE263225, respectively. The accession number of the Tal1 sequence is LC713258 ((DDBJ), (NCBI)). The PacBio data have been deposited with links to BioProject accession number PRJDB18115 in the DDBJ BioProject database. Uncropped images of western blot analyses are provided as Supplementary Figs. 3–5. Data files used for generating results in Figs. 1 and 4d and Extended Data Fig. 8 are available at Zenodo (10.5281/zenodo.12627139)82.
Source code for the TEd-seq analysis is available at GitHub (https://github.com/LeanQ/TED_seq_Tsukahara_2024). Code used for generating results in Figs. 1 and 4d and Extended Data Fig. 8 are available at Zenodo (10.5281/zenodo.12627139)82.