Abstract
Regulation of the turnover of triglycerides in adipose tissue requires the continuous provision of 3-glycerophosphate, which may be supplied by the metabolism of glucose or by glyceroneogenesis, the de novo synthesis of 3-glycerophosphate from sources other than hexoses or glycerol. The importance of glyceroneogenesis in adipose tissue was assessed in mice by specifically eliminating the expression of the cytosolic form of phosphoenolpyruvate carboxykinase (PEPCK-C), an enzyme that plays a pivotal role in the pathway. To accomplish this, we mutated the binding site for the peroxisome proliferator-activated receptor γ (PPARγ) called the peroxisome proliferator-activated receptor element (PPARE), in the 5′ flanking region of the PEPCK-C gene in the mouse by homologous recombination. The mutation abolished expression of the gene in white adipose tissue and considerably reduced its expression in brown adipose tissue, whereas the level of PEPCK-C mRNA in liver and kidney remained normal. Epididymal white adipose tissue from these mice had a reduced triglyceride deposition, with 25% of the animals displaying lipodystrophy. There was also a greatly reduced level of lipid accumulation in brown adipose tissue. A strong correlation between the hepatic content of triglycerides and the size of the epididymal fat pad in PPARE−/− mice suggests that hepatic triglyceride synthesis predominantly utilizes free fatty acids derived from the adipose tissue. Unlike other models, PPARE−/− mice with lipodystrophy did not exhibit the lipodystrophy-associated features of diabetes and displayed only moderate hyperglycemia. These studies establish the importance of the PPARE site for PEPCK-C gene expression in adipose tissue and the role of PEPCK-C in the regulation of glyceroneogenesis, a pathway critical for maintaining the deposition of triglycerides in adipose tissue.
Triglycerides are continually broken down in adipose tissue via lipolysis and resynthesized even during fasting by a process that requires glycerol-3-phosphate as the source of glyceride-glycerol (1). Because adipose tissue lacks glycerol kinase (2), the free glycerol produced by lipolysis cannot be used to support triglyceride synthesis. Instead, free fatty acids (FFA) are reesterified to triglycerides by using the glycerol-3-phosphate provided by the metabolism of glucose or synthesized from pyruvate via glyceroneogenesis at times when the supply of glucose is limited (3). Glyceroneogenesis is an abbreviated version of gluconeogenesis in which glycerol-3-phosphate is produced from substrates such as pyruvate, lactate, or alanine (4, 5). The activity of this pathway is increased by fasting (3), by eating diets devoid of carbohydrate (6), and by a variety of hormonal conditions and is repressed by insulin and glucocorticoids (7–10). More recent studies have shown that glyceroneogenesis also occurs at significant rates in the livers in both rat (11) and humans (12) during fasting. To date, the physiological significance of this pathway has not been elucidated.
Glyceroneogenesis, like gluconeogenesis, is regulated by the activity of phosphoenolpyruvate carboxykinase (PEPCK-C); this enzyme catalyzes the rate-limiting step in both pathways (13). The activity of PEPCK-C is controlled by the rate of transcription of its gene, which readily changes in response to various hormonal and nutritional conditions (14). We have taken a genetic approach to modify the expression of the PEPCK-C gene, to assess its role in glyceroneogenesis, and to elucidate the physiological significance of this pathway in vivo. Because PEPCK-C plays roles in other metabolic pathways, it has not been possible to study its role in glyceroneogenesis in mice that harbor a null mutation of the gene, as these mice do not survive beyond 2 to 3 days after birth (15). To circumvent this difficulty, we generated a tissue-specific knockout of the gene by mutating the binding site for the peroxisome proliferator-activated receptor γ (PPARγ), called the peroxisome proliferator-activated receptor element (PPARE), in the 5′ flanking region of the PEPCK-C gene. This site has been shown to be exclusively required for adipose tissue expression of the gene in transgenic mice (16). We report that the mutation caused a selective ablation of PEPCK-C expression in adipose tissue of homozygous mutant mice, which led to a reduced size and fat content of adipose tissue. These results establish the physiological role of glyceroneogenesis to maintain fat homeostasis in adipose tissue.
Methods
Generation of PPARE−/− Mice.
A 6-kb PEPCK-C genomic clone was isolated from a 129Sv/J library (Stratagene) by using the rat PEPCK-C gene as probe. The isolated clone contained sequences from 3.5 kb upstream of the transcription start site to 2.5 kb downstream. A targeting vector was constructed essentially as described by Zou et al. (17) (Fig. 1a), in which the PPARE site in the PEPCK-C gene promoter was replaced by the neomycin resistance gene (neor) driven by the phosphoglycerate kinase promoter. The neor gene was flanked by loxP sites to allow for its subsequent removal by cre-mediated recombination. A negative selectable marker, the diphtheria toxin A chain, was inserted at the 3′ end of the vector to provide for enrichment of correctly targeted clones.
Figure 1.
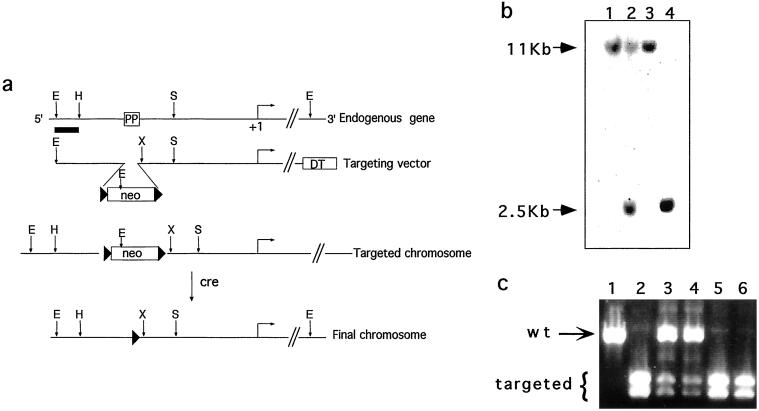
Disruption of the PPARE element in the PEPCK-C gene. (a) The structures of the endogenous PEPCK gene, targeting vector, and the mutated chromosomes. The position of the PPARγ binding site in the 5′ flanking region of the gene is indicated (PP), and the horizontal arrow indicates the transcription start site (+1 bp). Restriction sites: E, EcoRI; H, HincII; X, XhoI; S, SmaI. Black triangles, loxP sites; neo, neomycin resistance gene; DT, diphtheria toxin-A chain gene. (b) Southern blot of EcoRI-digested genomic DNA from wild-type embryonic stem cells (lanes 1 and 3), targeted embryonic stem cells (lane 2), and homozygous mice (lane 4) hybridized to the probe indicated in a (as a thick line). The wild-type allele (11 kb) and targeted allele (2.5 kb) are indicated. (c) PCR products of genomic DNA using primers that span the PPARE site as specified in Methods. The products were digested with XhoI and separated by agarose gel electrophoresis. The wild-type allele (804 bp) and the doublet of the targeted allele (409 and 395 bp) are indicated.
The targeting vector was linearized by NotI digestion and electroporated (25 μg) into E14 embryonic stem cells. The cells were grown in the presence of G418, and correctly targeted clones were identified by Southern blot hybridization of genomic DNA, digested with EcoRI, with a 5′ genomic probe or a mouse 3′ cDNA probe containing sequences that reside outside the targeting vector. Correctly targeted clones were injected into C57BL/6 blastocysts to produce chimeras, which were crossed with C57BL/6 females to obtain germ-line transmission of the mutant chromosome. To delete the neor gene from the targeted locus in vivo, heterozygous mice were crossed with transgenic mice harboring the cre recombinase gene driven by a cytomegalovirus minimal promoter that is active during early zygote development (18). The resulting offspring were genotyped by PCR by using primers spanning the PPARE in the PEPCK-C 5′ flanking region: 5′-AGCCACTTCTTCTGTACC and 3′-GTAAGCTTTGTTCTGACAGG. The PCR product was digested with XhoI to identify those carrying the mutant allele. These homozygous mice are designated PPARE−/− mice.
RNA Analysis.
Total RNA from 18-h fasted mice, 10–18 weeks old, was extracted by using Ultraspec reagent (Biotecx Laboratories, Houston) and separated by using formaldehyde-containing agarose gels. Northern blot analysis was performed as described by Sambrook et al. (19) by using Nytran (Schleicher & Schuell) membranes. The membranes were hybridized with a rat PEPCK-C cDNA probe (20), a mouse 18S ribosomal RNA genomic fragment (21), and an uncoupling protein 1 (UCP-1) cDNA probe (22) labeled with [32P]dCTP by using random hexamer primers (Roche Molecular Biochemicals). The signals were quantified by using a phosphorimager (Fuji).
Reverse transcriptase–PCR analysis of RNA was performed by using random hexamer primers (Amersham Pharmacia) with Maloney-murine leukemia virus–reverse transcriptase (GIBCO/BRL) in the presence of RNasin (Promega). PEPCK-C mRNA was amplified by using primers to exon nine and ten (5′-CTTGTCTACGAAGCTCTCAG and 3′-CGTCCGAACATCCACT). β-actin RNA was amplified by using primers 5′-CAGCTTCTTTGCAGCTCCTT and 3′-TCACCCACATAGGAGTCCTT.
FFA Release from Adipose Tissue Incubated in Vitro.
Two pieces of the thin distal parts of epididymal fat pads weighing 30–100 mg each (depending on the size of the tissue) from 18-h fasted mice, 10–18 weeks old, were incubated at 37°C in 1 ml of Krebs Ringer bicarbonate buffer, pH 7.4, containing 3% BSA (fatty acid free) in the presence or absence of 25 mM pyruvate. The level of FFA was measured by using the calorimetric assay described by Laurell and Tibbling (23) and by Regouw et al. (24).
Histology.
Brown and white adipose tissues from 18-h fasted mice were fixed in 4% formalin and subsequently embedded in paraffin. Sections of 5-μm thickness were stained with hematoxylin and eosin for microscopic examination.
Biochemical Assays.
The concentration of serum β-hydroxybutyrate was measured by using a kit from Sigma, whereas the levels of insulin were determined by RIA (DiaSorin, Italy). The concentration of serum triglycerides was measured by using a Unimate 7 Kit (Roche Diagnostics), whereas the levels of triglycerides in tissues were determined by using the same kit after homogenizing the tissue in Krebs Ringer bicarbonate buffer, pH 7.4, containing 3% BSA. The concentration of glucose in blood was measured by using the Glucometer Elite Kit (Bayer, Wuppertal, Germany).
Results
Generation of an Adipose Tissue-Specific Knockout of PEPCK-C.
To generate an adipose tissue-specific knockout of expression of the PEPCK-C gene, we mutated the adipose tissue-specific PPARγ regulatory element (PPARE) that is positioned between −1,010 and −995 bp upstream of the transcription start site. We generated a targeting vector in which 50 bp that include the PPARγ binding site were replaced with the neomycin resistance gene flanked by two loxP sites (Fig. 1). After electroporation into embryonic stem cells, we identified, by using Southern blot hybridization, two clones of 800 screened in which the vector had undergone homologous recombination at the PEPCK-C locus (Fig. 1b). These clones were injected into blastocysts, and the resulting chimeric mice were bred with C57BL/6 female mice to produce heterozygous germ-line founders (Fig. 1b). To remove the neo cassette, heterozygous mice were crossed with mice harboring a cre recombinase transgene that is expressed very early during development (18). From this cross, we identified, by PCR, mice in which the neo cassette had been deleted, leaving a single 34-bp loxP site in place of PPARE (Fig. 1c).
Effect of the PPARE Deletion on PEPCK-C Expression.
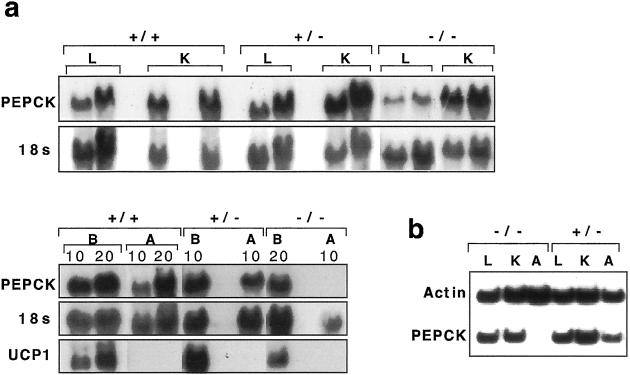
Northern blot hybridization showed that PPARE−/− mice had no detectable mRNA for PEPCK-C in white adipose tissue (WAT, which refers to epididymal fat pads, unless specified otherwise) and a marked decrease in brown adipose tissue (BAT) as compared with PPARE+/+ or PPARE+/− mice (Fig. 2a). In contrast, the levels of PEPCK-C mRNA in the liver and kidney of PPARE−/− were unaffected, based on Northern analysis (Fig. 2a). These findings were confirmed by reverse transcriptase–PCR analysis (Fig. 2b).
Figure 2.
The expression of PEPCK-C mRNA in wild-type and mutant mice. (a) Northern blot analysis of 15 and 30 μg total RNA from liver (L), kidney (K), and 10 or 20 μg (as indicated above) of brown adipose tissue (B) and white adipose tissue (A) PPARE+/+ (+/+), PPARE+/− (+/−), and PPARE−/− (−/−) mice. The blot was sequentially hybridized to a PEPCK-C cDNA probe, an 18S ribosomal RNA genomic fragment, and a UCP-1 cDNA probe and is representative of five independent experiments. (b) Reverse transcriptase–PCR was performed by using primers for PEPCK-C and β-actin as indicated in Methods. The RNA tested were from Liver (L), Kidney (K), and WAT (A) from PPARE−/− (−/−) and PPARE+/− (+/−) mice.
The expression of PEPCK-C in BAT in the absence of the PPARE site is intriguing. Devine et al. (16) reported that a mutation of the PPARE within the context of a transgene that included 2 kb of the PEPCK-C gene promoter resulted in no expression of the transgene in both WAT and BAT. It may be that sequences not included in the transgene partially compensated at the endogenous locus for the absence of the PPARγ site. The complete ablation of PEPCK-C gene expression in WAT of PPARE−/− mice, on the other hand, establishes the essential role of PPARE for PEPCK-C expression in that tissue.
Metabolic Consequences of the PPARE Deletion.
The PPARE−/− mice were viable and fertile but exhibited an overall reduction in the weight of WAT (270 ± 70 mg) compared with tissues from PPARE+/− mice (500 ± 160 mg) and tissues from PPARE+/+ (390 ± 60), as shown in Table 1. However, there was considerable individual variation in the reduced fat mass in tissues from PPARE−/− mice from animals whose values overlapped with PPARE+/− mice to those with barely detectable adipose tissue. In 4 of 15 PPARE−/− mice, the epididymal WAT weighed 18 ± 10 mg and perirenal, retroperitoneal, and s.c. abdominal fat was absent or barely detectable, mimicking lipodystrophy (25). BAT in PPARE−/− mice was considerably less affected, even in those animals exhibiting lipodystrophy of WAT (Table 1).
Table 1.
The body and adipose tissue weights of PPARE−/− and littermate control mice
| Weights | Genotype
|
|||
|---|---|---|---|---|
| +/+ | +/− | −/− | −/−* | |
| Body (g) | 26 ± 1 (4) | 27 ± 1 (10) | 26 ± 1 (11) | 24 ± 2 (4) |
| Epididymal fat pads (g) | 0.39 ± 0.06 (4) | 0.5 ± 0.16 (10) | 0.27 ± 0.07 (15) | 0.018 ± 0.01 (4) |
| Intrascapular BAT (mg) | 40 ± 7 (4) | 55 ± 6 (11) | 50 ± 4 (14) | 37 (2) |
Genotype: PPARE+/+ (+/+), PPARE+/− (+/−), PPARE−/− (−/−), and PPARE−/− with lipodystrophy (−/−
). ± indicates the SEM calculated. In parentheses is the number of mice used. All animals were fasted 18 h. Statistical significance of the difference between the WAT weight of PPARE+/− (+/−) and PPARE−/− (−/−), P < 0.05.
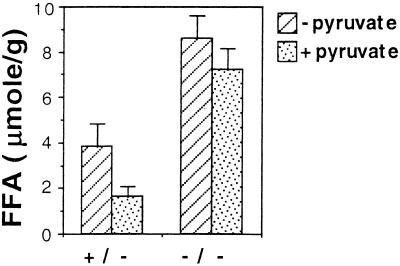
To determine the effect of an ablation in expression of the gene for PEPCK-C on glyceroneogenesis, we assessed the ability of pyruvate to inhibit the release of FFA from epididymal fat pads incubated in vitro. Inhibition of FFA release by pyruvate could result either by inhibiting lipolysis or by enhancing the synthesis of glycerol-3-phospate via glyceroneogenesis. In the latter case, this assay indirectly measures glyceride-glycerol synthesis from pyruvate. The reduction in FFA release did not result from an inhibition of lipolysis, as the rate of glycerol release was not affected. The amount of glycerol released from epididymal fat pads in the absence of pyruvate was taken as 100%, and in the presence of pyruvate it amounted to 86% ± 12.5 using tissues from PPARE+/− mice (three mice) and to 94% ± 11.4 using tissues from PPARE−/− mice (four mice). In contrast, the rate of release of FFA was inhibited by pyruvate (Fig. 3) only in epididymal adipose tissues from PPARE+/− mice, as had been shown (3). In PPARE−/− fat pads, however, there was an elevated rate of FFA release in the absence of pyruvate, and this elevated rate was not inhibited by the addition of pyruvate (Fig. 3). Thus, glyceroneogenesis is greatly inhibited in the absence of PEPCK-C. It is likely that the ablation of glyceroneogenesis in WAT, and therefore the inhibition of triglyceride synthesis, is responsible for the reduced weight of the epididymal fat pads. Because of the small size of the epididymal adipose tissue, this experiment could not be performed with PPARE−/− mice with lipodystrophy.
Figure 3.
Effect of pyruvate on the release of FFA in vitro from adipose tissue. Two pieces (30–100 mg) from the distal thin part of epididymal fat pads from PPARE+/− (+/−; three mice) and PPARE−/− (−/−; four mice) mice after an 18-h fasting were incubated in vitro with (dotted bars) or without (hatched bars) 25 mM pyruvate. FFA levels (per gram of adipose tissue) in the incubation medium were measured after a 3-h incubation at 37°C.
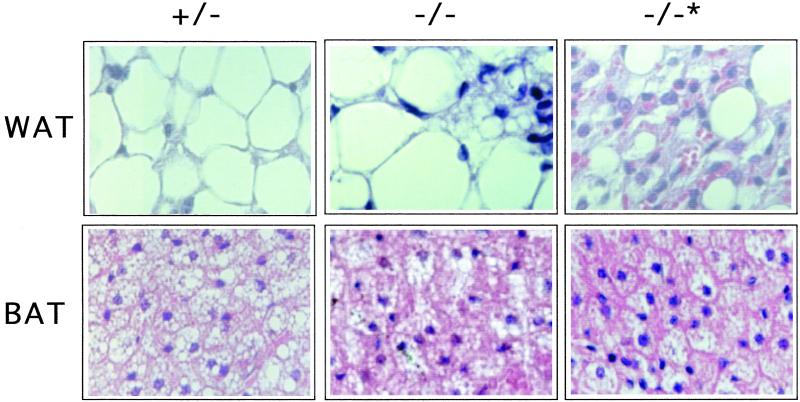
On histological examination, we observed that WAT from PPARE+/− mice contained large cells with a single, large fat vacuole and an asymmetrically positioned nucleus (Fig. 4). In contrast, WAT from PPARE−/− mice with lipodystrophy had much smaller cells, and the single fat vacuole was replaced by smaller vacuoles embedded in more prominent cytoplasm (Fig. 4). As a result, the density of cells was increased ≈3-fold compared with that in PPARE+/− mice. WAT in PPARE−/− mice without lipodystrophy exhibited islets of lipodystrophy-like small cells dispersed among a majority of normal large fat cells (Fig. 4). Thus, the changes observed in the histological appearance of WAT in PPARE−/− animals, like the reduction in the size of WAT, varied considerably among homozygous mutant animals. This spectrum of phenotypes may reflect the heterogeneous genetic background of the mice.
Figure 4.
The effect of the PPARE deletion on adipose tissue. Histological sections of WAT and BAT from PPARE+/− (+/−), PPARE−/− (−/−), and PPARE−/− with lipodystrophy (−/−*) were stained with hematoxylin and eosin.
BAT in PPARE+/− mice was composed of typical polygonal cells, a central nucleus, and numerous well defined vacuoles within the cytoplasm (Fig. 4). Regardless of the degree of WAT lipodystrophy, BAT from PPARE−/− mice showed a marked reduction in the number and size of fat vacuoles and a corresponding increase in the volume of cytoplasm. Lipodystrophy was not evident in BAT from PPARE−/− mice, and these animals had normal levels of UCP-1 mRNA, which is specifically expressed in BAT (26) (Fig. 2a).
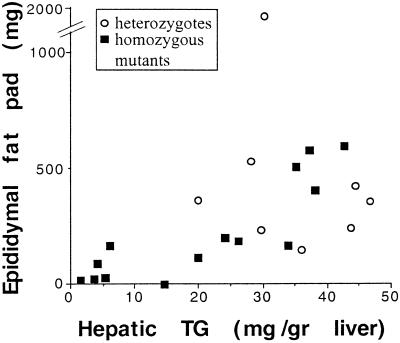
The fat depletion of abdominal WAT noted in PPARE−/− mice with lipodystrophy differs from other models for lipodystrophy in the mouse (25, 27, 28). First, the mutants have normal levels of circulating insulin and glucose and only display moderate hyperglycemia after overnight fasting (137 ± 20 mg/dl compared with 101 ± 8 mg/dl in PPARE+/− mice and 89 ± 10 in PPARE+/+ mice) (Table 2). Second, the mutants have normal levels of circulating triglycerides, and the levels of ketone bodies, although lower in PPARE−/− mice as compared with control animals, markedly increased in response to fasting (Table 2) in proportion to the weight of the WAT (Table 1). Finally, the weight of the epididymal fat pads in the PPARE−/− mice correlated with the content of hepatic triglycerides (Fig. 5), i.e., the smaller the WAT weight, the lower the liver TG content. Consistent with the absence of overt fatty liver in these mice, this correlation strongly suggests that the adipose tissue-derived FFA contribute significantly to the synthesis of hepatic triglycerides.
Table 2.
Biochemical analysis of PPARE−/− and littermate control mice
| Metabolites | Genotype
|
|||
|---|---|---|---|---|
| +/+ | +/− | −/− | −/−* | |
| βHB | ||||
| Fed (mM) | 0.4 ± 0.07 (4) | 0.14 ± 0.03 (7) | 0.18 ± 0.03 (16) | 0.09 ± 0.04 (3) |
| Fasted (mM) | 1.2 ± 0.23 (4) | 1.1 ± 0.1 (7) | 1.06 ± 0.13 (16) | 0.36 ± 0.2 (3) |
| TG | ||||
| Fed (mg/dl) | 106 ± 16 (4) | 90.8 ± 10 (8) | 84.8 ± 4 (18) | 73 ± 8 (3) |
| Fasted (mg/dl) | 98 ± 15 (4) | 89 ± 10 (9) | 66.8 ± 4.6 (18) | 80 (2) |
| Insulin fed (ng/ml) | 0.96 ± 0.22 (4) | 1.37 ± 0.71 (3) | 1.16 ± 0.29 (9) | 1.5 ± 0.4 (3) |
| Glucose fasted (mg/dl) | 89 ± 10 (4) | 101 ± 8 (11) | 93 ± 6 (18) | 137 ± 20 (4) |
| FFA | ||||
| Fed (mM) | ND | 0.67 ± 0.3 (6) | 0.86 ± 0.2 (10) | 0.87 ± 0.3 (3) |
| Fasted (mM) | ND | 0.7 ± 0.3 (6) | 0.7 ± 0.1 (10) | 0.56 ± 0.1 (3) |
Serum and whole blood analysis as described in Methods. Genotype: PPARE+/+ (+/+), PPARE+/− (+/−), PPARE−/− (−/−), and PPARE−/− with lipodystrophy (−/−
). ± indicates the SEM calculated. In parentheses is the number of mice used. βHB, β-hydroxybutyrate; TG, triglycerides; ND, not determined.
Figure 5.
Correlation between liver triglyceride content and the weight of epididymal fat pads. Liver triglyceride content is plotted against the corresponding weights of both epididymal fat pads from the same mouse fasted for 18 h.
Discussion
The generation of genetically modified mice that have selectively ablated expression of PEPCK-C in adipose tissue was critical for our assessment of the role of PEPCK-C in glyceroneogenesis and the determination of the physiological significance of this pathway in vivo. The deletion of the adipose tissue-specific enhancer, PPARE, resulted in the selective ablation of PEPCK-C gene expression in WAT and a markedly reduced level in BAT.
Ablation of PEPCK-C gene expression in WAT led to variable degrees of fat depletion, from scattered islets of fat-depleted cells to an extreme loss of fat in all cells, resulting in barely detectable abdominal fat, mimicking lipodystrophy. The partial loss of PEPCK-C expression in BAT reduced the fat content of cells, but less dramatically than in WAT. It is thus clear that PEPCK-C is required to maintain triglyceride homeostasis in adipose tissue, through its role in providing the glyceride-glycerol for FFA reesterification. (The glucose-derived synthesis of glyceride-glycerol is limited to the feeding state as it is insulin dependent, but may be responsible for the residual fat detected even in tissues mimicking lipodystrophy). Furthermore, the fat tissue mass is determined by the balance between fat deposition and lipolysis. With diminished triglyceride synthesis, the tissue would gradually exhaust its fat stores. The correlation between the size of the epididymal fat pads and the triglyceride content of the liver in PPARE−/− mice demonstrates that WAT-derived FFA significantly contribute to the synthesis of hepatic triglycerides.
The importance of glyceroneogenesis can also be inferred from the behavior of mice with a WAT-specific deletion in the gene for GLUT-4, encoding a glucose transporter (30). These mice have a normal pattern of growth and a normal WAT mass despite a marked impairment of insulin-stimulated glucose uptake by isolated adipocytes. On the other hand, they are insulin resistant and develop glucose intolerance and hyperinsulinemia. The ability of these mice to maintain normal levels of triglycerides in their WAT can be readily explained by glyceroneogenesis maintaining the levels of triglyceride in the tissue. In addition, the glucose-derived synthesis of glyceride-glycerol is insulin dependent, and unlike glyceroneogenesis it normally functions only during feeding and not during a fasting state. In contrast, the PPARE−/− mice, devoid of the more versatile glyceroneogenesis, displayed a spectrum of adipose tissue phenotypes from moderate reduction of fat to lipodystrophy (Fig. 4).
Several animal models with lipodystrophy have been described recently. In one model, BAT was specifically ablated by using a transgene encoding the diphtheria toxin-A chain gene driven by the BAT-specific UCP-1 promoter (31). The ablation of BAT led to excessive triglyceride deposition in WAT, along with severe hyperinsulinemia, hyperglycemia, and hypertriglyceridemia, all of which were resistant to administered leptin (32). Other models in which both BAT and WAT were ablated in transgenic mice (33–35) led to the same spectrum of metabolic perturbations. Lipodystrophy accompanied by fatty liver dystrophy has also been observed in fld mice that harbor mutations in a novel nuclear protein (36, 37), as well as in normal mice fed conjugated linoleic acid (29). In each of these models, elements of noninsulin-dependent diabetes (NIDDM) were observed. Thus, under-accumulation of triglycerides in adipose tissue, not just over-accumulation as in obesity syndromes, is associated with NIDDM. However, in obesity-related NIDDM, there is an overproduction of ketone bodies in response to fasting, whereas this is characteristically absent in lipodystrophy (34).
None of the NIDDM-like metabolic features associated with other models of lipodystrophy was found in the lipodystrophic PPARE−/− mice. Furthermore, there was an elevation in the levels of ketone bodies after fasting. Because other mouse models for lipodystrophy involve the disruption of one or more regulatory proteins, it may well be that the NIDDM was caused by changes in multiple pathways under their control. In contrast, in PPARE−/− mice, the mutation affects one of the targets of the regulatory proteins that functions to control the triglyceride content of fat through the regulation of glyceroneogenesis. Thus, the phenotype can be directly attributed to the absence of a single enzyme.
Acknowledgments
We are grateful to John Levorse for performing the blastocyst injections, Dr. Leslie P. Kozak for the UCP-1 cDNA, Dr. Ehud Ziv for determination of circulating insulin, and Dr. Oded Meyuhas for many fruitful discussions. This research was supported by U.S.–Israel Binational Science Foundation Grants 1999346 and 9600117, Israel Science Foundation Grant 540197-19, and by National Institutes of Health Grants DK22541 and DK58620.
Abbreviations
- PEPCK-C
the cytosolic form of phosphoenolpyruvate carboxykinase
- PPARE
peroxisome proliferator-activated receptor element
- PPARγ
peroxisome proliferator-activated receptor γ
- FFA
free fatty acids
- WAT
white adipose tissue
- BAT
brown adipose tissue
- NIDDM
noninsulin-dependent diabetes
References
- 1.Vaughan M J. J Biol Chem. 1962;237:3354–3358. [PubMed] [Google Scholar]
- 2.Lin E C. Annu Rev Biochem. 1977;46:765–795. doi: 10.1146/annurev.bi.46.070177.004001. [DOI] [PubMed] [Google Scholar]
- 3.Reshef L, Ballard F J, Hanson R W. J Biol Chem. 1970;245:5779–5785. [PubMed] [Google Scholar]
- 4.Ballard F J, Hanson R W, Leveille G A. J Biol Chem. 1967;242:2746–2750. [PubMed] [Google Scholar]
- 5.Reshef L, Niv J, Shapiro B. J Lipid Res. 1967;8:688–691. [PubMed] [Google Scholar]
- 6.Botion L M, Kettelhut I C, Migliorini R H. Horm Met Res. 1995;27:310–313. doi: 10.1055/s-2007-979967. [DOI] [PubMed] [Google Scholar]
- 7.Reshef L, Ballard F J, Hanson R W. J Biol Chem. 1969;244:5577–5581. [PubMed] [Google Scholar]
- 8.Reshef L, Hanson R W, Ballard J F. J Biol Chem. 1969;244:1994–2001. [PubMed] [Google Scholar]
- 9.Gorin E, Tal-Or Z, Shafrir E. Eur J Biochem. 1969;8:370–375. doi: 10.1111/j.1432-1033.1969.tb00537.x. [DOI] [PubMed] [Google Scholar]
- 10.Reshef L, Hanson R W. Biochem J. 1972;127:809–818. doi: 10.1042/bj1270809. [DOI] [PMC free article] [PubMed] [Google Scholar]
- 11.Botion L M, Brito M N, Brito N A, Brito S R C, Kettelhut I C, Migliorini R H. Metabolism. 1998;47:1217–1221. doi: 10.1016/s0026-0495(98)90326-2. [DOI] [PubMed] [Google Scholar]
- 12.Kalhan S C, Mahajan S, Burkett E, Reshef L, Hanson R W. J Biol Chem. 2001;276:12928–12931. doi: 10.1074/jbc.M006186200. [DOI] [PubMed] [Google Scholar]
- 13.Hanson R W, Patel Y M. Adv Enzymol Relat Mol Biol. 1994;69:203–281. doi: 10.1002/9780470123157.ch6. [DOI] [PubMed] [Google Scholar]
- 14.Hanson R W, Reshef L. Annu Rev Biochem. 1997;66:581–611. doi: 10.1146/annurev.biochem.66.1.581. [DOI] [PubMed] [Google Scholar]
- 15.She P, Shiota M, Shelton K D, Chalkley R, Postic C, Magnuson M A. Mol Cell Biol. 2000;20:6508–6517. doi: 10.1128/mcb.20.17.6508-6517.2000. [DOI] [PMC free article] [PubMed] [Google Scholar]
- 16.Devine J H, Eubank D W, Clouthier D E, Tontonoz P, Spiegelman B M, Hammer R E, Beale E G. J Biol Chem. 1999;274:13604–13612. doi: 10.1074/jbc.274.19.13604. [DOI] [PubMed] [Google Scholar]
- 17.Zou Y-R, Muller W, Gu H, Rajewsky K. Curr Biol. 1994;4:1099–1103. doi: 10.1016/s0960-9822(00)00248-7. [DOI] [PubMed] [Google Scholar]
- 18.Schwenk F, Baron U, Rajewsky K. Nucleic Acids Res. 1995;23:5080–5081. doi: 10.1093/nar/23.24.5080. [DOI] [PMC free article] [PubMed] [Google Scholar]
- 19.Sambrook J, Fritsch E F, Maniatis T. Molecular Cloning: A Laboratory Manual. Plainview, NY: Cold Spring Harbor Lab. Press; 1989. [Google Scholar]
- 20.Yoo-Warren H, Monahan J E, Short J, Short H, Bruzel A, Wynshaw-Boris A, Meisner H M, Samols D, Hanson R W. Proc Natl Acad Sci USA. 1983;80:3656–3660. doi: 10.1073/pnas.80.12.3656. [DOI] [PMC free article] [PubMed] [Google Scholar]
- 21.Bowman L H, Rabin B, Schlessinger D. Nucleic Acids Res. 1981;9:4951–4966. doi: 10.1093/nar/9.19.4951. [DOI] [PMC free article] [PubMed] [Google Scholar]
- 22.Jacobsson A, Stadler U, Glotzer M A, Kozak L P. J Biol Chem. 1985;260:16250–16254. [PubMed] [Google Scholar]
- 23.Laurell S, Tibbling G. Clin Chim Acta. 1967;16:57–62. doi: 10.1016/0009-8981(67)90269-0. [DOI] [PubMed] [Google Scholar]
- 24.Regouw B J, Cornelissen P J, Helder R A, Spijkers J B, Weeber Y M. Clin Chim Acta. 1971;31:187–195. doi: 10.1016/0009-8981(71)90377-9. [DOI] [PubMed] [Google Scholar]
- 25.Reue K, Peterfy M. Atheroscler Rep. 2000;2:390–396. doi: 10.1007/s11883-000-0077-1. [DOI] [PubMed] [Google Scholar]
- 26.Klaus S, Casteilla L, Bouillaud F, Ricquier D. Int J Biochem. 1991;9:791–801. doi: 10.1016/0020-711x(91)90062-r. [DOI] [PubMed] [Google Scholar]
- 27.Garg A. Am J Med. 2000;108:143–152. doi: 10.1016/s0002-9343(99)00414-3. [DOI] [PubMed] [Google Scholar]
- 28.Reitman M L, Arioglu E, Gavrilova O, Taylor S I. Trends Endocrinol Metab. 2000;11:410–416. doi: 10.1016/s1043-2760(00)00309-x. [DOI] [PubMed] [Google Scholar]
- 29.Tsuboyama-Kasaoka N, Takahashi M, Tanemura K, Kim H J, Tange T, Okuyama H, Kasai M, Ikemoto S, Ezaki O. Diabetes. 2000;49:1534–1542. doi: 10.2337/diabetes.49.9.1534. [DOI] [PubMed] [Google Scholar]
- 30.Abel E D, Peroni O, Kim J K, Kim Y B, Boss O, Hadro E, Minnemann T S, Shulamn G I, Kahn B B. Nature (London) 2001;409:729–733. doi: 10.1038/35055575. [DOI] [PubMed] [Google Scholar]
- 31.Lowell B B, Susulic V S, Hamann A, Lawitts J A, Himms-Hagen J, Boyer B B, Kozak L P, Flier J S. Nature (London) 1993;366:740–742. doi: 10.1038/366740a0. [DOI] [PubMed] [Google Scholar]
- 32.Mantzoros C S, Frederich R C, Qu D, Lowell B B, Maratos-Flier E, Flier J S. Diabetes. 1998;47:230–238. doi: 10.2337/diab.47.2.230. [DOI] [PubMed] [Google Scholar]
- 33.Ross S R, Graves R A, Spiegelman B M. Genes Dev. 1993;7:1318–1324. doi: 10.1101/gad.7.7b.1318. [DOI] [PubMed] [Google Scholar]
- 34.Moitra J, Mason M M, Olive M, Krylov D, Gavrilova O, Marcus-Samuels B, Feigenbaum L, Lee E, Aoyama T, Eckhaus M, et al. Genes Dev. 1998;12:3168–3681. doi: 10.1101/gad.12.20.3168. [DOI] [PMC free article] [PubMed] [Google Scholar]
- 35.Shimomura I, Hammer R E, Richardson J A, Ikemoto S, Bashmakov Y, Goldstein J L, Brown M S. Genes Dev. 1998;12:3182–3194. doi: 10.1101/gad.12.20.3182. [DOI] [PMC free article] [PubMed] [Google Scholar]
- 36.P'eterfy M, Phan J, Xu P, Reue K. Nat Genet. 2001;27:121–124. doi: 10.1038/83685. [DOI] [PubMed] [Google Scholar]
- 37.Reue K, Xu P, Wang X-P, Slavin B G. J Lipid Res. 2000;41:1067–1076. [PubMed] [Google Scholar]


