Abstract
The reactive oxygen-generating enzyme Nox1 transforms NIH 3T3 cells, rendering them highly tumorigenic and, as shown herein, also increases tumorigenicity of DU-145 prostate epithelial cells. Although Nox1 modestly stimulates cell division in both fibroblasts and epithelial cells, an increased mitogenic rate alone did not account fully for the marked tumorigenicity. Herein, we show that Nox1 is a potent trigger of the angiogenic switch, increasing the vascularity of tumors and inducing molecular markers of angiogenesis. Vascular endothelial growth factor (VEGF) mRNA becomes markedly up-regulated by Nox1 both in cultured cells and in tumors, and VEGF receptors (VEGFR1 and VEGFR2) are highly induced in vascular cells in Nox1-expressing tumors. Matrix metalloproteinase activity, another marker of the angiogenic switch, also is induced by Nox1. Nox1 induction of VEGF is eliminated by coexpression of catalase, indicating that hydrogen peroxide signals part of the switch to the angiogenic phenotype.
Reactive oxygen species (ROS; superoxide, hydrogen peroxide, and their metabolites) are conventionally thought of as cytotoxic and mutagenic, and in high levels they induce an oxidative stress response (1, 2). However, recent evidence implicates lower levels of ROS as an intracellular mediator of growth, apoptosis, and senescence (2–6). For example, growth factors including platelet-derived growth factor and epidermal growth factor stimulate H2O2 generation through a pathway involving PI 3-kinase and Rac, and elimination of H2O2 with antioxidants prevents growth stimulation by these growth factors (4, 7–10).
Reactive oxygen may play a role in neoplastic growth, because a variety of cell lines derived from human cancers demonstrate significantly elevated H2O2 (6). NIH 3T3 cells transformed with constitutively active Ras show elevated ROS, and antioxidants such as N-acetyl cysteine reduce the abnormally rapid DNA synthesis in these cells (11, 12). Antioxidants enhance antitumor activity of conventional chemotherapeutic agents in rodents through unknown mechanisms (11). Tumor cells may be inherently more resistant to oxidative stress than normal cells, or oxidative stress may provide a selective advantage in tumor growth.
Nox1 (Mox1 in an earlier terminology), a recently identified (1) homolog of gp91phox, the catalytic subunit of the phagocyte superoxide-generating NADPH-oxidase, constitutively produces both superoxide and H2O2 when overexpressed in fibroblasts. Moreover, expression of Nox1 in these cells induces malignant transformation, rendering them highly tumorigenic in athymic mice (1). Decreased expression of endogenous Nox1 decreases proliferation of vascular smooth muscle, implicating Nox1 in normal cell growth. NIH 3T3 cells that stably express Nox1 exhibit modestly increased growth rates, but increased growth alone may be insufficient to account for the marked tumorigenicity of these cells. Coexpression of catalase along with Nox1 reverses the growth phenotype, rendering these cells poorly tumorigenic and indicating that one of the signaling species generated by Nox1 is H2O2 (13).
Microscopic dormant tumors are thought to occur relatively frequently, but few progress to form active tumors. Angiogenesis, the process by which tissues recruit and develop new blood vessels, is needed for tumors to grow beyond 1–2 mm in diameter (14). Progression to a growing tumor is characterized by induction in the tumor tissue of angiogenic factors, particularly vascular endothelial growth factor (VEGF) and matrix metalloproteinases (MMPs), and VEGF receptors (VEGFR) in the growing endothelial cells. The conversion to the angiogenic phenotype in previously dormant tumors is known as the “angiogenic switch”. Because Nox1 causes aggressive growth of tumors in vivo that cannot be readily explained based on mitogenic rates alone, we tested the hypothesis that ROS produced by Nox1 triggers the angiogenic switch, permitting vascularization and rapid expansion of the tumor.
Materials and Methods
Cell Lines.
NEF2 is a vector-control line developed from NIH 3T3 cells. YA28 and YA26 NIH 3T3 lines stably express Nox1 and are highly tumorigenic in nude mice (1). ZC-5 is a derivative of YA28 which coexpresses catalase along with Nox1; YA28/Z3 is a control Nox1-expresing line containing the empty catalase vector (13). DU-145 cells (American Type Culture Collection catalog no. HTB-81) were cultured in RPMI medium 1640 supplemented with 5% (vol/vol) FBS. Transfection with Nox1 was performed as described for NIH 3T3 cells (1). Stable transfectants were cloned by dilution and culture in 96-well plates with selection for 5–7 passages. Fifteen clones were subcultured and tested for Nox1 mRNA by Northern blotting. Fourteen of these clones showed significant expression of Nox1. All experiments were repeated with at least three individual clones showing high Nox1 expression.
Cell Proliferation.
Cells were grown in 12 wells of a 96-well plate by adding 1.75 × 10³ cells in media with 10% (vol/vol) FBS. At 12 h, 1 μCi (1 Ci = 37 GBq) of [3H]thymidine was added to each well of the first plate, and at indicated times, plates were harvested on the Tomtec Cell Harvester (Tomtec, Orange, CT) to a filtermat. Filtermats were dried and counted on the Microlux Beta Counter. Data were averaged and plotted vs. time.
Real-Time Reverse Transcription (RT)-PCR.
Two-step quantitative RT-PCR was performed on cDNA generated by using the MultiScribe Reverse Transcriptase from the TaqMan Reverse Transcription System and the SYBR Green PCR Master Mix (Perkin–Elmer). Primers used were: actin (220 bp), forward, AAA GAC CTG TAC GCC AAC ACA GTG CTG TCT GG and reverse, CGT CAT ACT CCT GCT TGC TGA TCC ACA TCT GC Nox1; Nox1 (506 bp), forward, ATA TTT TGG AAT TGC AGA TGA ACA and reverse, ATA TTG AGG AAG AGA CGG TAG TTT; VEGF (320bp), forward, TGCTGTCTTGGGTGCATTGG and reverse, GCATAATCTGCATGGTGATGTTGG. Reactions were performed in MicroAmp Optical 96-well Reaction Plate (Perkin–Elmer). Thirty-five PCR cycles were performed under standard conditions with an annealing temperature of 60°C. Quantification was determined by the cycle number where exponential amplification began (threshold value), and values were averaged from the values obtained from the triplicate repeats. β-actin mRNA was used as a reference message to normalize the initial content of total cDNA. VEGF and Nox1 expression was calculated as the relative expression ratio of either VEGF or Nox1 threshold cycle to that of β-actin. All reactions were carried out in duplicate and threshold cycles were averaged.
Tumor Microvessel Density.
Prostate cancer xenografts were fixed in formalin and processed according to standard methods. Sections were stained with smooth-muscle anti-actin antibody, and the number of vessels in several 200× fields were quantified according to a single blind protocol, as described (15, 16).
In Vivo Tumorigenesis.
One million cells were injected s.c. into 4- to 5-week-old male athymic mice (Charles River Breeding Laboratories) in the presence of a small quantity of trypan blue to mark the inoculation site. Tumors were excised after 1 month, fixed in formalin, and subjected to histologic analysis and in situ hybridization (ISH).
ISH.
ISH was performed on 4-mm sections of formalin-fixed, paraffin-embedded tissue. Details of ISH have been reported (17, 18). Slides were processed through xylene and graded alcohols: 0.2 M HCl/Tris⋅EDTA with 3 μg/ml proteinase K/0.2% glycine/4% (wt/vol) paraformaldehyde in PBS, pH 7.4/0.1 M triethanolamine containing 1/200 (vol/vol) acetic anhydride/2× SSC. Slides were hybridized overnight at 50°C with 35S-labeled riboprobes in the following mixture: 0.3 M NaCl/0.01 M Tris, pH 7.6/5 mM EDTA/0.02% (wt/vol) Ficoll/0.02% (wt/vol) polyvinylpyrollidone/0.02% (wt/vol) BSA fraction V/50% (wt/vol) formamide/10% (vol/vol) dextran sulfate/0.1 mg/ml yeast tRNA/0.01 M DTT. Posthybridization washes included 2× SSC/50% (wt/vol) formamide/10 mM DTT at 50°C/4× SSC/10 mM Tris/1 mM EDTA with 20 μg/ml ribonuclease at 37°C/2× SSC/50% (wt/vol) formamide/10 mM EDTA at 65°C/2× SSC. Slides were dehydrated through graded alcohols containing 0.3 M ammonium acetate, dried, coated with Kodak NTB 2 emulsion, and stored in the dark at 4°C for 2 weeks. The emulsion was developed with Kodak D19 developer, and the slides were counterstained with hematoxylin. 35S-labeled single-stranded antisense and sense RNA probes for mouse VPF/VEGF mRNA and the mouse VPF/VEGF receptors VEGFR-1 and VEGFR-2 mRNAs have been described (17, 18). Histone H3 ISH was performed on paraffin-fixed blocks (19).
Northern Blot Analysis.
Poly(A)+ mRNA was isolated from cells by using Oligotex Direct mRNA kit (Qiagen, Chatsworth, CA). Northern blot analysis was performed by using a murine VEGF probe 32P-labeled by random priming (20). Triplicate experiments were performed.
MMP Bioassay.
Cells were grown to ≈75% confluence in DMEM with 5% (vol/vol) FCS. After washing with PBS, media were replaced with Cellgro Serumless media (Mediatech, Herndon, VA) and incubated at 37°C in 10% CO2 for 24 h (20). Substrate gel electrophoresis (zymography) was conducted according to Herron et al. (21) with modifications (20). The gels were stained with 0.5% Coomassie blue R-250 in acetic acid:isopropyl alcohol:H2O (1:3:6) and destained in H2O. Densitometry of destained areas was quantified with a Datascopy GS Plus scanner connected to a Macintosh II computer with MACIMAGE software (Xerox Imaging Systems, Palo Alto, CA).
Measurement of H2O2.
Confluent cells in 100-mm dishes (≈5–6 × 10⁶ cells) were washed with 6 ml Hanks' balanced salt solution (HBSS) and released by using 0.25% trypsin (wt/vol)/1 mM EDTA followed by the addition of 5% (vol/vol) FBS in HBSS. After pelleting, cells were resuspended in 5% (vol/vol) FBS in HBSS and counted. Dichlorofluorescein diacetate (DCFDA) was added to a final concentration of 2 μM and incubated for 1 h in the dark at room temperature. Dichlorofluorescein (DCF) fluorescence was determined by using 0.5 × 10⁶ cells per 3 ml 5% (vol/vol) FBS in HBSS with a FACScalibur from Becton Dickinson (excitation wavelength, 488 nm; emission wavelength, 515–545 nm).
Results
Nox1 Converts Tumors from Dormant to Aggressive Growth.
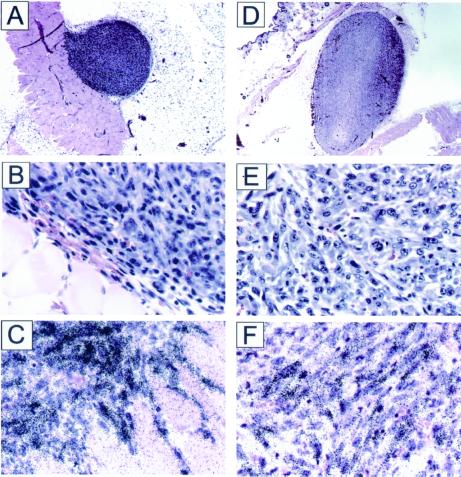
When Nox1-expressing NIH 3T3 cells were injected into athymic mice, large tumors were seen within 2–3 weeks, as reported (1, 13), whereas no tumors were obvious with vector-control cells. However, coinjection of a dye that permitted careful examination of the injection site revealed small dormant tumors, ≈1 mm in diameter. To our knowledge, microscopic tumor formation by nontransformed NIH 3T3 cells has not been reported, but such tumors would be exceedingly difficult to detect without microscopic examination of the injection site. Tumors from both Nox1-expressing cells and control cells showed high expression of S-phase-specific (22, 23) histone H3, a marker of mitotically active cells (Fig. 1). Thus, although control NIH 3T3 derived tumors are highly proliferative, they remain microscopic in size, possibly because of apoptosis balancing growth. The finding of mitotic activity in a poorly angiogenic dormant tumor is similar to the observation of Holmgren et al. (24), who noted high proliferation in dormant Lewis lung carcinomas of angiostatin-treated mice. Therefore, Nox1 permits previously dormant tumors to grow aggressively and to achieve large size. Histologic examination (Fig. 1) revealed that the tumors from control cells are vascularized only at the periphery, and no blood vessels were seen at the interior of the tumor. However, tumors from Nox1-expressing cells are highly vascularized throughout the tumor, indicating that Nox1 triggers the angiogenic switch.
Figure 1.
Histologic and ISH studies of NEF2 and YA28 tumors. (A and D) Low-power (10×) views of NEF2 and YA28 tumors, respectively. (B and E) Higher-power views of NEF2 and YA28 tumors, respectively. Note the diffuse vascularity as indicated by the presence of red blood cells throughout YA28 in E, but the concentration of vessels at the periphery of NEF2 in B. (C and F) Histone H3 ISH (NEF2 and YA28, respectively).
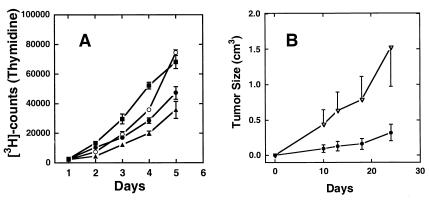
Similar results are seen with DU-145 cells, an epithelial line derived from a human prostate tumor. Expression of Nox1 resulted in a modest increase in cell growth in culture (Fig. 2A) similar to what was seen previously for NIH 3T3 cells (1). DU-145 cells typically produce slow-growing tumors when injected into athymic mice, as in Fig. 2B, ●. However, expression of Nox1 resulted in a marked increase (≈5-fold) in the rate of tumor growth (Fig. 2B, ▿). Immunohistochemical examination of the control and Nox1 Du-145 tumors showed an increase in vascularity, with an average of 25.5 and 41.5 vessels per high-power field (four random fields evaluated) in the control and Nox1 tumors, respectively.
Figure 2.
Prostate cell proliferation and tumor growth are enhanced by Nox1. (A) Thymidine uptake in parental DU-145 human prostate cancer cells (▴) was compared with that in DU-145 cells transfected with empty vector (●) and two separate Nox1-expressing cell lines (Nox3, ○; and Nox6, ■). Points represent the average ± SD of six wells. (B) In each group, six athymic mice were implanted s.c. with 106 vector-control DU-145 cells (●) or Nox1-expressing DU-145 cells (▵). Tumor volumes were determined by bi-dimensional measurement, and average tumor volume was plotted vs. time.
Nox1 Up-Regulates Expression of VEGF and Its Receptors.
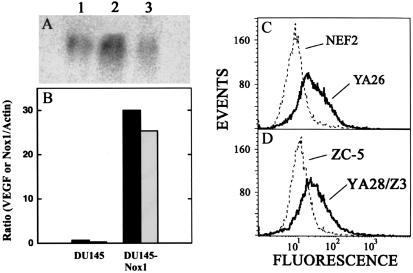
Dominant oncogenes such as V12Ras induce the angiogenic switch in part through induction of VEGF (20, 25). Nox1 expression led to an ≈4-fold induction of VEGF mRNA by Northern blot analysis in NIH 3T3 cells (Fig. 3A) and a striking (≈30-fold) increase in VEGF levels in DU-145 cells (Fig. 3B) by quantitative PCR. Expression of Nox1 led to an ≈10-fold increase in H2O2 levels in NIH 3T3 cells (Ref. 13 and Fig. 3C) and a similar increase in DU-145 cells (data not shown). Stable coexpression of catalase in Nox1-expressing NIH 3T3 cells decreased the steady-state intracellular concentration of H2O2 by several-fold (Fig. 3D). Catalase coexpression, which markedly diminishes the tumorigenicity of Nox1-expressing cells (13), resulted in reversion of Nox1-associated VEGF expression to near-control levels (Fig. 3A). Thus, H2O2 generated by Nox1 mediates the induction of VEGF.
Figure 3.
Nox1 induces VEGF expression dependent upon H2O2. (A) Northern blot analysis of Nox1 induction of VEGF mRNA and reversal by catalase. Lane 1, NEF2 (vector-control) cells; lane 2, Nox1-expressing YA28 cells; lane 3, YA28 cells coexpressing catalase (ZC-5 cells; 10 μg of total RNA per lane). (B) Nox1 mRNA (white bars) and VEGF mRNA levels (black bars) were quantified by real-time quantitative PCR in parental DU-145 cells (DU-145) and in Nox1-expressing DU-145 cells (DU-145-Nox1). Data shown are representative of three experiments and are expressed as the ratio to β-actin mRNA. (C) DCF fluorescence was monitored by flow cytometry in vector-control (NEF2) cells and in Nox1-expressing (YA26) cells. (D) As in C, monitoring Nox1-epressing YA26 cells coexpressing catalase (ZC-5) or the same cells transfected with vector alone (YA28/Z3).
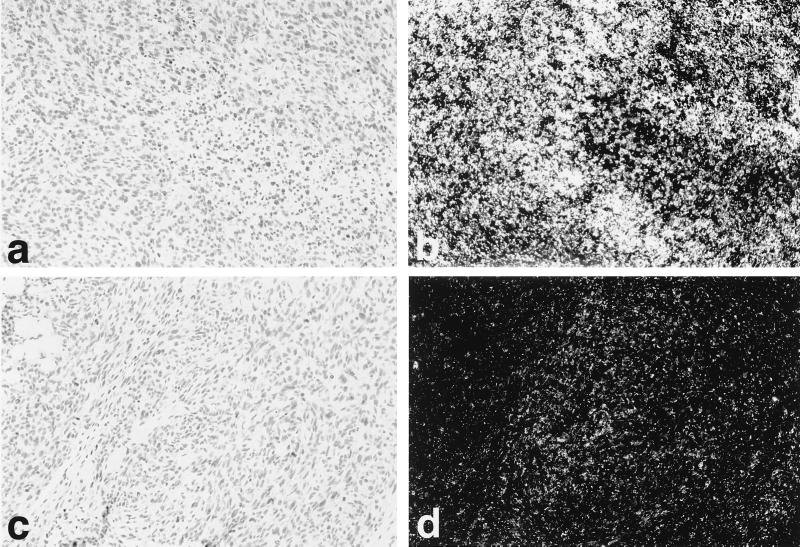
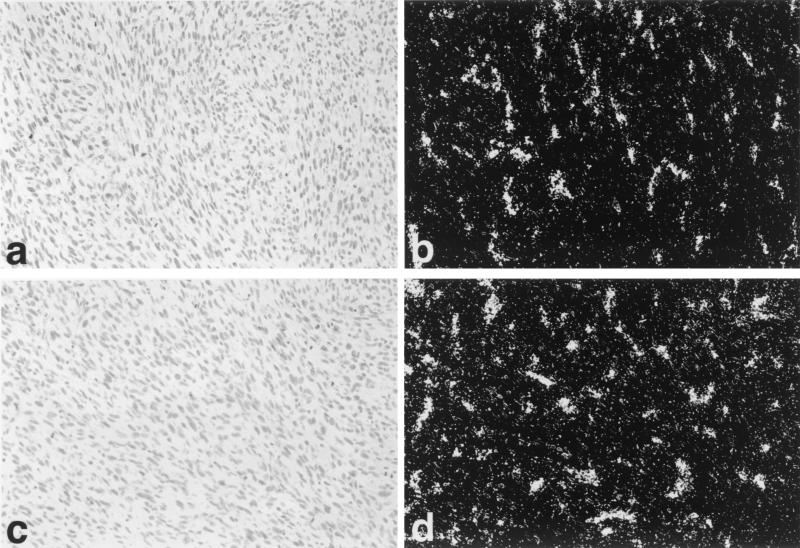
To determine VEGF and VEGFR expression in tumors, ISH was carried out for VEGF (Fig. 4), VEGFR1, and VEGFR2 (Fig. 5). High-level expression of VEGF, VEGFR1, and VEGFR2 was seen in YA28 tumors, with VEGF expression localized to the tumor tissue itself, and VEGFR1 and VEGFR2 (Fig. 5 b and d, respectively) localized in a pattern characteristic of newly growing blood vessels. Little hybridization with any probe was observed in control tumors.
Figure 4.
Regulation of VEGF expression by Nox1 in vivo. Use of in situ high-level expression of VEGF mRNA is seen in YA28 tumors (a and b), whereas minimal expression of VEGF is seen in NEF2 (control) tumors (c and d). (a and c) Brightfield photomicrographs. (b and d) Darkfield photomicrographs.
Figure 5.
Regulation of VEGFR1 and VEGFR2 expression by Nox1 in vivo. ISH reveals high-level expression of flt-1 (VEGFR1) (a and b) and kdr (VEGFR2) (c and d) mRNAs by endothelial cells in blood vessels in YA28 tumors. (a and c) Brightfield photomicrographs. (b and d) Darkfield photomicrographs.
Nox1 Regulates MMP Bioactivity.
Dominant oncogenes also induce MMP bioactivity as part of the angiogenic switch (19, 20, 25, 26). MMPs are required for invasive and malignant growth, and high levels of MMP expression contribute to neoplastic progression (20, 25, 27, 28). Zymographic analysis was carried out by using conditioned media from vector-control and Nox1-transformed cells. Nox1 expression induces gelatinolytic activity, which is predominantly MMP-9 indicated by migration at 92 kDa (Fig. 6). Catalase coexpression failed to revert Nox1-induced bioactivity of MMP, indicating that although MMP is regulated by Nox1, the regulation differs from that of VEGF.
Figure 6.
Effect of Nox1 expression on MMP bioactivity. The first group of three lanes represents triplicate samples of conditioned media from NEF2 (vector-control) cells; the second group of three lanes represents conditioned media from Nox1-expressing NIH 3T3 cells (YA28); and the third group of three lanes represents conditioned media from NIH 3T3 cells overexpressing both Nox1 and catalase (ZEO5). The bands at 92 kDa indicate gelatinolysis induced by MMP-9.
Discussion
Recent evidence implicates ROS in mitogenic signaling by growth factors and oncogenes (7, 12, 29, 30). In addition, the presence of oxygen-derived free radicals contributes to tumor resistance to chemotherapy, and combination therapy using both antioxidants and chemotherapeutic agents is being investigated (11). The mechanism of ROS generation in malignant cells is not understood fully but may involve induction of ROS-generating enzymes (e.g., Nox1), byproducts of oxidative metabolism (as is seen in the generation of melanin by melanocytes), or de novo synthesis of ROS through defective respiration (often seen in cancer cells; refs. 6 and 31).
The Nox1 gene transforms NIH 3T3 cells, rendering them capable of forming well vascularized tumors, whereas the parent cells form microscopic dormant tumors that are poorly vascularized. Similarly, Nox1 expression converts DU-145 epithelial cells from weak to strong tumorigenic potential, with a corresponding increase in tumor vascularity, pointing to the generality of the angiogenic effect of Nox1. The molecular mechanism by which Nox1 causes this dramatic increase in tumorigenicity and angiogenesis involves the induction of VEGF and MMP, proangiogenic mediators that are important for tumor growth and invasion (21, 23, 25, 26, 29, 30). Nox1 increased both the synthesis of VEGF mRNA and the bioactivity of MMP-9 to levels similar to those seen in Ras-transformed angiosarcoma cells (20). Even in the absence of vascularization, the small dormant tumors arising from control NIH 3T3 cells are characteristic of the expression of histone H3, a marker of active cell proliferation (18). Growth in these dormant tumors is likely to be counterbalanced by loss of cells through apoptotic cell death. Vascularization may not only provide the tumor with nutrients and oxygen, but it probably also delivers regulatory factors that prevent apoptotic cell death, thus allowing tumor expansion, as noted (15, 32, 33).
The present studies also demonstrate that Nox1 signals angiogenic and tumorigenic effects in part through H2O2. Introduction of catalase reversed Nox1 induction of VEGF but did not affect the induction of MMP-9, suggesting either that MMP activation is linked to a different Nox1-generated signal (perhaps superoxide), or that it has a lower threshold for induction by H2O2 (34), which may remain somewhat elevated in Nox1 cells after coexpression of catalase (13). In preliminary studies, we found that Nox1 activates several pathways that have previously been implicated in growth and angiogenesis, including NFκ-B-dependent transcription and the ERK1/2 pathway (D. R. Ritsick, unpublished work). Our findings suggest that in proliferating cells expressing Nox1, pharmacologic inhibition of Nox1 activity and/or pharmacological lowering of cellular H2O2 levels may lead to decreased in vivo proliferation and increased chemosensitivity to therapeutic agents.
Acknowledgments
This work was supported by the American Skin Association and National Institute of Arthritis and Musculoskeletal and Skin Diseases Grant AR47901 (to J.L.A.), Emory Skin Disease Research Core Center Grant P30, National Institutes of Health Grants AR42687 and AR02030 (to J.L.A.), National Institutes of Health Grant CA84138 (to J.D.L.), Department of Defense Grant BC995541 (to J.P.), and Research Scientist Development Award (to J.P.) and Department of Defense Grant DAMD 17-00-1-0080 (to J.P., R.S.A., and J.D.L.). M.M. is supported by Grant 83821 from the American Cancer Society.
Abbreviations
- ROS
reactive oxygen species
- VEGF
vascular endothelial growth factor
- VEGFR
VEGF receptor
- MMP
matrix metalloproteinase
- ISH
in situ hybridization
References
- 1.Suh Y-A, Arnold R S, Lassegue B, Shi J, Xu X, Sorescu D, Chung A B, Griendling K K, Lambeth J D. Nature (London) 1999;401:79–82. doi: 10.1038/43459. [DOI] [PubMed] [Google Scholar]
- 2.Pentland A P, Morrison A R, Jacobs S C, Hruza L L, Hebert J S, Packer L. J Biol Chem. 1992;267:15578–15584. [PubMed] [Google Scholar]
- 3.Nakahara H, Kanno T, Inai Y, Utsumi K, Hiramatsu M, Mori A, Packer L. Free Radical Biol Med. 1998;24:85–92. doi: 10.1016/s0891-5849(97)00164-0. [DOI] [PubMed] [Google Scholar]
- 4.Esposito L A, Melov S, Panov A, Cottrell B A, Wallace D C. Proc Natl Acad Sci USA. 1999;96:4820–4825. doi: 10.1073/pnas.96.9.4820. [DOI] [PMC free article] [PubMed] [Google Scholar]
- 5.Dang C V, Semenza G L. Trends Biochem Sci. 1999;24:68–72. doi: 10.1016/s0968-0004(98)01344-9. [DOI] [PubMed] [Google Scholar]
- 6.Szatrowski T P, Nathan C F. Cancer Res. 1991;51:794–798. [PubMed] [Google Scholar]
- 7.Lee A C, Fenster B E, Ito H, Takeda K, Bae N S, Hirai T, Yu Z X, Ferrans V J, Howard B H, Finkel T. J Biol Chem. 1999;274:7936–7940. doi: 10.1074/jbc.274.12.7936. [DOI] [PubMed] [Google Scholar]
- 8.Zhu J, Woods D, McMahon M, Bishop J M. Genes Dev. 1998;12:2997–3007. doi: 10.1101/gad.12.19.2997. [DOI] [PMC free article] [PubMed] [Google Scholar]
- 9.Yeh L H, Park Y J, Hansalia R J, Ahmed I S, Deshpande S S, Goldschmidt-Clermont P J, Irani K, Alevriadou B R. Am J Physiol. 1999;276:C838–C847. doi: 10.1152/ajpcell.1999.276.4.C838. [DOI] [PubMed] [Google Scholar]
- 10.Freeman J L, Abo A, Lambeth J D. J Biol Chem. 1996;271:19794–19801. doi: 10.1074/jbc.271.33.19794. [DOI] [PubMed] [Google Scholar]
- 11.Chinery R, Brockman J A, Peeler M O, Shyr Y, Beauchamp R D, Coffey R J. Nat Med. 1997;3:1233–1241. doi: 10.1038/nm1197-1233. [DOI] [PubMed] [Google Scholar]
- 12.Irani K, Xia Y, Zweier J L, Sollott S J, Der C J, Fearon E R, Sundaresan M, Finkel T, Goldschmidt-Clermont P J. Science. 1997;275:1649–1652. doi: 10.1126/science.275.5306.1649. [DOI] [PubMed] [Google Scholar]
- 13.Arnold R S, Shi J, Murad E, Whalen A, Sun C Q, Parnathysarathy S, Petros J A, Lambeth J D. Proc Natl Acad Sci USA. 2001;98:5550–5555. doi: 10.1073/pnas.101505898. . (First Published May 1, 2001; 10.1073/pnas.101505898) [DOI] [PMC free article] [PubMed] [Google Scholar]
- 14.Folkman J. N Engl J Med. 1971;285:1182–1186. doi: 10.1056/NEJM197111182852108. [DOI] [PubMed] [Google Scholar]
- 15.Arbiser J L, Raab G, Rohan R M, Paul S, Hirschi K, Flynn E, Price E R, Fisher D E, Cohen C, Klagsbrun M. Am J Pathol. 1999;155:723–729. doi: 10.1016/S0002-9440(10)65171-1. [DOI] [PMC free article] [PubMed] [Google Scholar]
- 16.Arbiser J L, Flynn E, Barnhill R L. J Am Acad Dermatol. 1998;38:950–954. doi: 10.1016/s0190-9622(98)70158-6. [DOI] [PubMed] [Google Scholar]
- 17.McLaughlin E R, Brown L F, Weiss S W, Mulliken J B, Perez-Atayde A, Arbiser J L. J Invest Dermatol. 2000;114:1209–1210. doi: 10.1046/j.1523-1747.2000.00005-3.x. [DOI] [PubMed] [Google Scholar]
- 18.Arbiser J L, Larsson H, Claesson-Welsh L, Bai X, LaMontagne K, Weiss S W, Soker S, Flynn E, Brown L F. Am J Pathol. 2000;156:1469–1476. doi: 10.1016/S0002-9440(10)65015-8. [DOI] [PMC free article] [PubMed] [Google Scholar]
- 19.Konishi H, Steinbach G, Terry N H, Fujita K, Lee J J, Ruifrok A, Spaulding D, Lynch P M, Dubin J A, Andreeff M, et al. Cancer Epidemiol Biomarkers Prev. 1997;6:531–536. [PubMed] [Google Scholar]
- 20.Arbiser J L, Moses M A, Fernandez C A, Ghiso N, Cao Y, Klauber N, Frank D, Brownlee M, Flynn E, Parangi S, et al. Proc Natl Acad Sci USA. 1997;94:861–866. doi: 10.1073/pnas.94.3.861. [DOI] [PMC free article] [PubMed] [Google Scholar]
- 21.Herron G S, Banda M J, Clark E J, Gavrilovic J, Werb Z. J Biol Chem. 1986;261:2814–2818. [PubMed] [Google Scholar]
- 22.Kotelnikov V, Cass L, Coon J S, Spaulding D, Preisler H D. Clin Cancer Res. 1997;3:669–673. [PubMed] [Google Scholar]
- 23.Zindy F, Cunningham J J, Sherr C J, Jogal S, Smeyne R J, Roussel M F. Proc Natl Acad Sci USA. 1999;96:13462–13467. doi: 10.1073/pnas.96.23.13462. [DOI] [PMC free article] [PubMed] [Google Scholar]
- 24.Holmgren L, O'Reilly M S, Folkman J. Nat Med. 1995;1:149–153. doi: 10.1038/nm0295-149. [DOI] [PubMed] [Google Scholar]
- 25.Rak J, Mitsuhashi Y, Sheehan C, Tamir A, Viloria-Petit A, Filmus J, Mansour S J, Ahn N G, Kerbel R S. Cancer Res. 2000;60:490–498. [PubMed] [Google Scholar]
- 26.Bergers G, Brekken R, McMahon G, Vu T H, Itoh T, Tamaki K, Tanzawa K, Thorpe P, Itohara S, Werb Z, et al. Nat Cell Biol. 2000;2:737–744. doi: 10.1038/35036374. [DOI] [PMC free article] [PubMed] [Google Scholar]
- 27.Lochter A, Sternlicht M D, Werb Z, Bissell M J. Ann NY Acad Sci. 1998;857:180–193. doi: 10.1111/j.1749-6632.1998.tb10116.x. [DOI] [PubMed] [Google Scholar]
- 28.Oh L Y, Larsen P H, Krekoski C A, Edwards D R, Donovan F, Werb Z, Yong V W. J Neurosci. 1999;19:8464–8475. doi: 10.1523/JNEUROSCI.19-19-08464.1999. [DOI] [PMC free article] [PubMed] [Google Scholar]
- 29.Kuroki M, Voest E E, Amano S, Beerepoot L V, Takashima S, Tolentino M, Kim R Y, Rohan R M, Colby K A, Yeo K T, et al. J Clin Invest. 1996;98:1667–1675. doi: 10.1172/JCI118962. [DOI] [PMC free article] [PubMed] [Google Scholar]
- 30.Finkel T. FEBS Lett. 2000;476:52–54. doi: 10.1016/s0014-5793(00)01669-0. [DOI] [PubMed] [Google Scholar]
- 31.Valverde P, Manning P, McNeil C J, Thody A J. Pigm Cell Res. 1996;9:77–84. doi: 10.1111/j.1600-0749.1996.tb00093.x. [DOI] [PubMed] [Google Scholar]
- 32.Kuniyasu H, Yasui W, Shinohara H, Yano S, Ellis L M, Wilson M R, Bucana C D, Rikita T, Tahara E, Fidler I J. Am J Pathol. 2000;157:1523–1535. doi: 10.1016/S0002-9440(10)64790-6. [DOI] [PMC free article] [PubMed] [Google Scholar]
- 33.Rak J, Filmus J, Kerbel R S. Eur J Cancer. 1996;32A:2438–2450. doi: 10.1016/s0959-8049(96)00396-6. [DOI] [PubMed] [Google Scholar]
- 34.Fenrick R, Wang L, Amann J M, Rooney R J, Walker-Daniels J, Crawford H C, Hulboy D L, Kinch M S, Matrisian L M, et al. Mol Cell Biol. 2000;20:5828–5839. doi: 10.1128/mcb.20.16.5828-5839.2000. [DOI] [PMC free article] [PubMed] [Google Scholar]


