

Abstract
The sentinel lymph node (SN) concept has a significant impact on cancer surgery. We aimed to examine which morphology of dendritic cells (DCs) and macrophages corresponds to “preconditioning” of the SN against cancer. Although macrophages are generally able to tolerate cancer metastasis, the CD169‐positive subtype is believed to be a limited exception. Immunohistochemical and morphometric analyses were performed to examine DC‐SIGN‐, CD68‐, and CD169‐positive cells in SNs and non‐SNs of 23 patients with gastric cancer with or without nodal metastasis. All patients survived for >5 years without recurrence. DCs were present in the subcapsular, paracortical, and medullary sinuses, the endothelia of which expressed DC‐SIGN and smooth muscle actin (SMA). In the non‐SNs of patients without metastasis, subcapsular DCs occupied a larger area than SNs, and this difference was statistically significant. Conversely, subcapsular DCs were likely to have migrated to the paracortical area of the SNs. DC clusters often overlapped with macrophage clusters; however, histiocytosis‐like clusters of CD169‐negative macrophages showed a smaller overlap. We found a significantly larger overlap between DC‐SIGN and CD169‐positive clusters in SNs than in non‐SNs; the larger overlap seemed to correspond to a higher cross‐presentation of cancer antigens between these cell populations. DC‐SIGN–CD169‐double positive cells might exist within this overlap. SNs in gastric cancers are usually preconditioned as a frontier of cancer immunity, but they may sometimes be suppressed earlier than non‐SNs. DC‐SIGN‐ and CD169‐positive cells appeared to decrease owing to a long lag time from the primary lesion occurrence and a short distance from the metastasis.
Keywords: CD169, DC‐SIGN, dendritic cells, gastric cancer, macrophages, morphometry, sentinel lymph node
Distribution of DC‐SIGN‐positive DCs and CD68‐positive macrophages in the sentinel and non‐sentinel nodes (SN, non‐SN) was studied. The proportion (%) of subcapsular clusters of DCs in the entire circumference of the node was significantly larger in non‐SNs than in SNs of 15 patients without metastasis.

1. INTRODUCTION
The sentinel lymph node (SN), which is identified by injecting a tracer during surgery, is believed to be the first lymph node to receive cancer metastasis among the many regional nodes of the viscera in cancer patients (reviewed by Takeuchi et al., 2008). In the field of vascular morphology, the SN concept has perhaps had the greatest impact on clinical practice in relation to cancer since the 1980s. Cancer surgery in combination with the intraoperative identification of both SNs and metastatic cancer cells contained within them is called “sentinel node navigation surgery.” Sentinel node navigation surgery for gastric cancer has recently provided minimal tailor‐made surgery for stomach preservation (Kamiya et al., 2021; Kitagawa et al., 2020). Recently, Li and Jung (2022) described the changes expected to occur in the SNs, but their considerations were conceptual and were not supported by any histological evidence from real SNs in patients.
Interdigitating dendritic cells, or simply dendritic cells (DCs), are key professional antigen‐presenting cells in cancer immunity. This definition does not include follicular dendritic cells. A marker of DCs, “DC‐SIGN” (dendritic cell‐specific ICAM‐3–grabbing nonintegrin; CD209), is commonly expressed among nodal DCs and a subpopulation of macrophages (Angel et al., 2009; Granelli‐Piperno et al., 2005; Park et al., 2014). The latter, DC‐SIGN‐positive macrophages, are called “monocyte‐derived DCs” (moDCs; Cheong et al., 2010; Lutz et al., 2022; Marzaioli et al., 2022). The subcapsular sinus (SCS) of human nodes is filled with moDCs rather than DC‐SIGN‐negative CD68‐positive macrophages (Aoki et al., 2023; Yamada et al., 2023). Paracortical and medullary sinus endothelia also express DC‐SIGN (Aoki et al., 2023; Engering et al., 2004; Lai et al., 2006; Park et al., 2014).
CD169 (sialoadhesin)‐positive macrophages are thought to activate cytotoxic T lymphocytes (CTLs) and natural killer (NK) cells (Kawasaki et al., 2013; Kumamoto et al., 2021). Yamada et al. (2023) demonstrated that the subcapsular sinuses (SCSs) of regional nodes of the human colon contain abundant CD169‐positive macrophages. Therefore, in the present study, we examined CD169 reactivity and the correlation between DCs and CD68‐positive cells. Although macrophages are generally tolerable for cancer metastasis, the CD169‐positive subtype is believed to cross‐present cancer antigens with DCs (Grabowska et al., 2018; Reis‐Sobreiro et al., 2021).
The aim of the present study was to identify morphological differences between SN and nearby regional nodes (non‐SNs) surgically obtained from gastric cancer patients with or without metastasis. We designed the present morphometric analysis to compare three pairs of data: (1) the SN and nearby non‐SNs in patients without metastasis, (2) the SN with metastasis and nearby non‐SNs without metastasis, and (3) patients with metastasis and patients without metastasis. In these comparisons, the first pair (the SN and non‐SNs in patients without metastasis) was the most important for providing a morphological understanding of the “pre‐conditioned SN” before the homing of metastatic cancer cells.
2. MATERIALS AND METHODS
A total of 137 regional gastric nodes were morphologically and immunohistochemically examined. Nodes were surgically obtained from 15 patients without metastasis (male, n = 10; female, n = 5; age, 46–88 years) and 8 patients with nodal metastasis (male, n = 4; female, n = 4; age, 58–77 years). All patients underwent curative gastrectomy with lymph node dissection based on sentinel node navigation using the indocyanine green (ICG) fluorescence method at Kagoshima University Hospital between April 2000 and December 2017. After routine curative resection and nodal dissection (distal gastrectomy, n = 10; proximal gastrectomy, n = 10; and total gastrectomy, n = 3), all patients survived for >5 years without any recurrence. Final pathological examinations revealed 17 cases of stage I gastric cancer and 6 cases of stage II gastric cancer. The cancers were histopathologically classified as differentiated (n = 15 [papillary, well‐differentiated, or moderately differentiated tubular adenocarcinoma]) or undifferentiated (n = 8 [poorly differentiated adenocarcinoma, mucinous adenocarcinoma, or signet‐ring cell carcinoma]) according to the Japanese Gastric cancer Association (2011). The use of specimens was approved by the Ethics Committee of the Kagoshima University Graduate School of Medical and Dental Sciences (No. 220277).
Because one site or “node group” often contained multiple nodes, for one patient, we observed the SN (1 or 2 nodes per site) and other nearby non‐SNs (1–5 nodes per site). Table 1 shows the sites and names of the node groups, that is, 6 node groups along the supplying arteries (e.g., left gastric artery nodes) and 4 node groups along the stomach (e.g., lesser curvature nodes). Injection for sentinel node navigation always identifies 1 or 2 SNs, whereas multiple nodes are also removed as non‐SNs. In non‐SNs near the SN, we chose 1 node (a larger node showing good polarization at the maximum sectional area) for detailed morphometry. Here, the term “polarization” indicates a laminar structure from the superficial cortex (afferent side of the node) via the paracortex to the medullary sinus (MS) with the hilus (efferent side).
TABLE 1.
Sites and numbers of lymph nodes examined.
| Site names a | ① | ② | ③ | ④ | ⑤ | ⑥ | ⑦ | ⑧ | ⑨ | ⑪ | Total b |
|---|---|---|---|---|---|---|---|---|---|---|---|
| Meta‐negative patients | |||||||||||
| SN | 2 | 2 | 30 | 2 | 0 | 3 | 0 | 0 | 0 | 1 | 40 (15) |
| Non‐SN | 7 | 0 | 19 | 14 | 1 | 9 | 3 | 3 | 3 | 0 | 59 |
| Meta‐positive patients | |||||||||||
| SN | 0 | 3 | 5 | 7 | 0 | 0 | 0 | 0 | 0 | 0 | 15 (8) |
| Non‐SN | 3 | 8 | 3 | 1 | 0 | 1 | 5 | 2 | 0 | 0 | 23 |
Notes: ① right cardiac node; ② left cardiac node; ③ lesser curvature node; ④ greater curvature node; ⑤ suprapyloric node; ⑥ subpyloric node; ⑦ left gastric artery node; ⑧ common hepatic artery node; ⑨ celiac artery node; ⑪ splenic artery node.
The numbering: according to Japanese Association of Gastric Cancer (see also below).
Total numbers of nodes (patients).
The removed nodes were fixed in 10% (w/w) neutral formalin solution for 7 days, followed by routine histological procedures for paraffin‐embedded samples. Five or 6 serial sections were prepared for each node, including 1 section corresponding to the maximum cross‐sectional area of the node. One section was stained with hematoxylin and eosin (H&E) and the other sections were used for immunohistochemistry.
3. IMMUNOHISTOCHEMISTRY
The primary antibodies, together with their dilutions and antigen retrieval procedures, are listed in Table 2. Briefly, we used (1) an antibody against DC‐SIGN (also known as CD209; for more details, see the second paragraph of the Introduction) as a DC marker, (2) CD68 (a pan‐macrophage marker), (3) CD169 (another marker for macrophage subpopulation [for more detail, see the third paragraph of the Introduction]), (4) CD3 (a pan‐T lymphocyte marker), and (5) an antibody for alpha smooth muscle actin (SMA) for the endothelium. The paracortical lymph sinus endothelium expresses both SMA and DC‐SIGN (Aoki et al., 2023). After incubation with primary antibodies, the sections were incubated for 30 min with horseradish peroxidase (HRP)‐conjugated secondary antibodies (Histofine Simple Stain Max‐PO; Nichirei, Tokyo, Japan) diluted 1:1000. Immunoreactive proteins were detected by incubation with diaminobenzidine (DAB) for 3–5 min (Histofine Simple Stain DAB; Nichirei, Tokyo, Japan). Each sample was counterstained with hematoxylin, and a negative control without the primary antibody was used for all specimens. Treated sections were counterstained with hematoxylin, dehydrated in ethanol, and cleared in xylene. All histological photographs were captured using an Olympus BX53 microscope.
TABLE 2.
Primary monoclonal antibodies and their dilution and specific treatment.
| Legend | Ig types | Sources | Final dilution | Antigen retrieval |
|---|---|---|---|---|
| DC‐SIGN | Mouse | Santa Cruz sc‐65740 (Texas, USA) | 1:200 | Dako PT Link, high pH |
| CD169 | Rabbit | Abcam ab183356 (Cambridge, UK) | 1:100 | Citrate buffer |
| CD68 | Mouse | Dako M0814 (Glostrup, Denmark) | 1:200 | Trypsin |
| CD3 | Mouse | Dako IR621 (Glostrup, Denmark) | 1:400 | Autoclave 121°C, 5 min |
| SMA | Mouse | Dako M0851 (Glostrup, Denmark) | 1:800 | Trypsin |
Abbreviation: SMA, α smooth muscle actin.
3.1. Morphometric analysis of clusters of DCs and macrophages
Using stained sections corresponding to the maximum cross‐sectional area of the node, we measured (1) the entire sectional area of the nodes, (2) the proportional area of a DC cluster, (3) the proportional area of CD68‐positive macrophage clusters, and (4) the proportional area of CD169‐positive macrophage clusters, although areas 2 and 3 were expected to overlap because of double‐positive moDCs (see Introduction). Whether there is an overlap between areas 2 and 4 has not yet been reported. After manually tracing the nodes and lesions, scanned images (Adobe Photoshop) of each site were obtained using a 1× objective lens and processed using ImageJ (version 1.45; U.S. National Institutes of Health). Differences between the values were statistically analyzed using Student's t‐test.
4. RESULTS
4.1. SNs without cancer metastasis
In 15 patients without nodal metastasis (40 SNs and 59 non‐SNs; Table 1), the total sectional area of the node group ranged from 3.5 to 33.9 mm2 in the SNs and from 4.0 to 65.0 mm2 in the non‐SNs: the SNs were slightly smaller in size than the non‐SNs (Table 3). However, after choosing one larger node with good polarization, the mean maximum sectional area of the SN was slightly larger than those of non‐SNs (Table 3). All parameters for the chosen node are described below. The mean number of secondary follicles in SNs was 6.9, while that in non‐SNs was 5.5; the difference was not statistically significant.
TABLE 3.
Sectional areas of clusters of DC, CD68‐positive cells, and CD169‐positive cells: A comparison between SN and non‐SN.
| Node group size mm2 | Node size mean mm2 | SF/node | Meta‐foci/node group area mean % | DC cluster/node area mean % a | CD68/node area mean % b | CD169/node area mean % c | |
|---|---|---|---|---|---|---|---|
| Meta‐negative patients | |||||||
| SN | 15.8 | 10.9 | 6.9 | ‐ | 25.3 | 35.7 | 30.7 |
| Non‐SN | 20.3 | 8.8 | 5.5 | ‐ | 22.7 | 27.9 | 22.8 |
| Meta‐positive patients | |||||||
| SN | 59.7 | 12.6 | 11.6 | 41.0 | 15.4 | 30.2 | 22.7 |
| 35.2 d | 7.9 d | 19.8 e | 25.8 e | 25.2 e | |||
| Non‐SN | 9.7 | 5.9 | 2.6 | 6.2 | 35.8 f | 44.9 f | 37.3 f |
| 9.1 d | 5.9 d | ||||||
Abbreviation: SF, secondary follicle.
A proportion (%) of DC cluster area in the nodal area.
A proportion (%) of CD68‐positive macrophage cluster area in the nodal area.
A proportion (%) of CD169‐positive cell cluster area in the nodal area.
Corrected area = area of the node group (or one node we chose) ‐ area of metastasis foci.
A proportion of the cluster area in the corrected area.
We analyzed a node without metastasis.
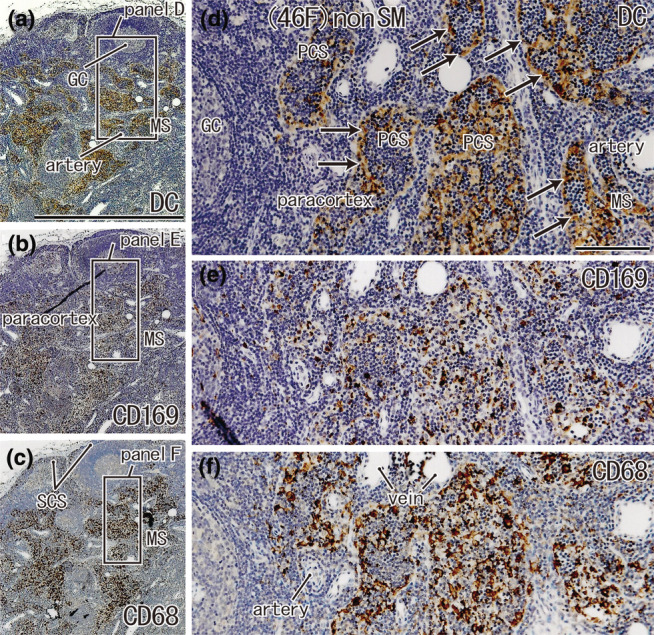
DC clusters were distributed in the subcapsular, paracortical, and medullary sinuses and overlapped with CD68‐positive macrophage clusters (Figure 1). A difference between SNs and non‐SNs was often evident in the proportional areas of the macrophages, but this difference was not statistically significant (P = 0.56). DCs of non‐SNs were sometimes restricted to the subcapsular sinus (Figure 1c,d). Thus, the proportion (%) of subcapsular clusters of DCs in the entire circumference of the node was significantly larger in non‐SNs than in SNs of 15 patients without metastasis (p = 0.037; Table 4). Notably, CD68‐negative and CD169‐positive cells were sometimes present in the subcapsular sinus (Figures 2h,i and 3h,i).
FIGURE 1.
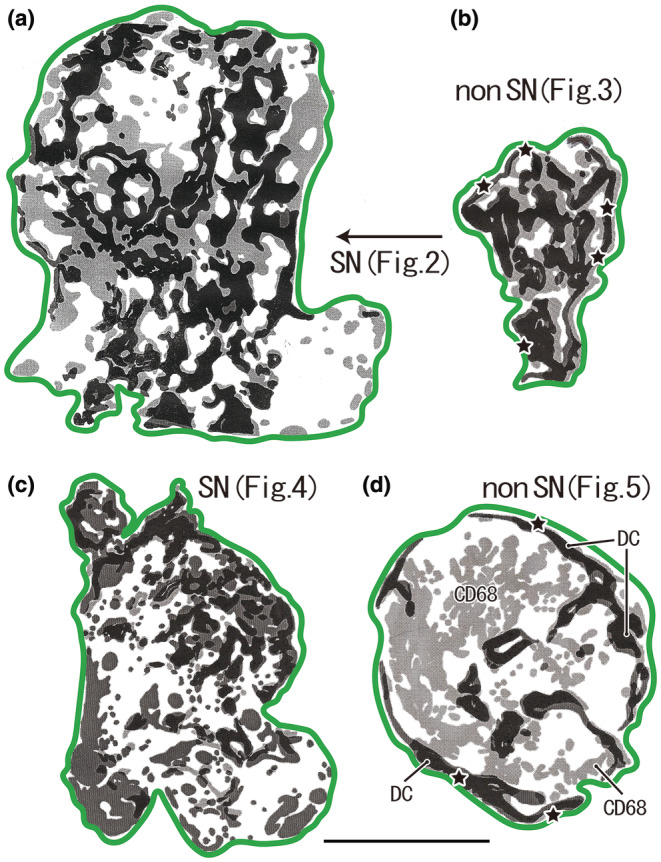
Distribution of DC‐SIGN‐positive DCs and CD68‐positive macrophages in the sentinel and non‐sentinel nodes (SN, non‐SN). (a, b) A male patient of 77 years of age at the time of surgery. (c, d) A male patient of 69 years of age. Dark zones indicate dendritic cell (DC) clusters, whereas pale zones indicate macrophage clusters. A large overlap between these zones is present; however, it is masked by the dark zone in this figure. The green line indicates the nodal capsule. (a) (SN) displays a lesser curvature node and (b) (non‐SN) also displays the lesser curvature node, but it is distant from (a). (c) (SN) exhibits a lesser curvature node and (d) (non‐SN) exhibits a right cardiac node. Parts of (a)–(d) are shown histologically in Figures 2, 3, 4, 5, respectively. In the center of (d), a large area of macrophage clusters was observed (CD68), independent of the DC clusters. The stars in (b) and (d) indicate subcapsular DC clusters along almost the entire circumference of the node. All panels were prepared at the same magnification (scale bar, 5.0 mm). DC, DC‐SIGN‐positive cells; GC, germinal center; MS, medullary sinus; PCS, paracortical sinus; SCS, subcapsular sinus.
TABLE 4.
Subcapsular clusters of DC and macrophage: meta‐negative patients.
| Age & sex | Node group | Circumferential length of node mm | Subcapsular DCs/circumference% | Subcapsular CD68‐macrophage/circumference% | Subcapsular CD169‐macrophage/circumference% |
|---|---|---|---|---|---|
| 46F a | SN ④ | 22.7 | 17.2 | 27.6 | 38.0 |
| Non ③ | 4.4 | 50.7 | 11.0 | 10.2 | |
| 49F | SN ③ | 17.7 | 43.5 | 37.4 | 57.8 |
| Non ⑥ | 17.0 | 71.2 | 47.5 | 50.6 | |
| 52F | SN ③ | 9.5 | 15.9 | 36.6 | 61.1 |
| Non ④ | 8.8 | 74.0 | 61.4 | 68.5 | |
| 55M | SN ③ | 11.8 | 66.9 | 52.2 | 50.8 |
| Non ⑨ | 7.0 | 70.6 | 44.6 | 64.6 | |
| 58M | SN ⑥ | 18.8 | 67.0 | 16.5 | 27.1 |
| Non ③ | 7.6 | 50.8 | 75.7 | 54.9 | |
| 58M‐2 | SN ⑪ | 19.1 | 46.3 | 48.0 | 48.1 |
| Non ⑥ | 9.9 | 62.6 | 39.3 | 45.8 | |
| 63M | SN ③ | 16.5 | 75.7 | 39.3 | 79.8 |
| Non ⑦ | 19.0 | 31.5 | 30.3 | 38.0 | |
| 64M b | SN ④ | 10.0 | 32.0 | 7.0 | 23.2 |
| Non ② | 10.1 | 58.4 | 23.0 | 52.2 | |
| 65M | SN ① | 9.4 | 54.6 | 28.6 | 40.2 |
| Non ④ | 6.0 | 63.2 | 49.4 | 47.6 | |
| 69M c | SN ③ | 14.0 | 75.7 | 78.1 | 51.2 |
| Non ① | 8.6 | 79.9 | 50.8 | 87.7 | |
| 71M | SN ③ | 7.3 | 56.0 | 65.1 | 38.5 |
| Non ⑨ | 20.6 | 63.7 | 49.3 | 58.2 | |
| 75F | SN ③ | 12.8 | 20.7 | 68.6 | 72.3 |
| Non ⑤ | 11.8 | 33.7 | 42.6 | 50.8 | |
| 77M d | SN ③ | 18.5 | 44.1 | 70.7 | 56.0 |
| Non ① | 7.9 | 80.0 | 66.1 | 63.6 | |
| 79M | SN ③ | 15.5 | 24.9 | 40.5 | 53.1 |
| Non ⑧ | 16.7 | 61.1 | 57.2 | 63.2 | |
| 88F | SN ⑥ | 13.1 | 67.3 | 67.9 | 65.1 |
| Non ④ | 6.8 | 77.3 | 82.1 | 86.6 | |
| Mean | SN | 14.4 | 50.5* | 50.8 | 50.8 |
| Non SN | 10.8 | 61.9* | 48.7 | 56.2 |
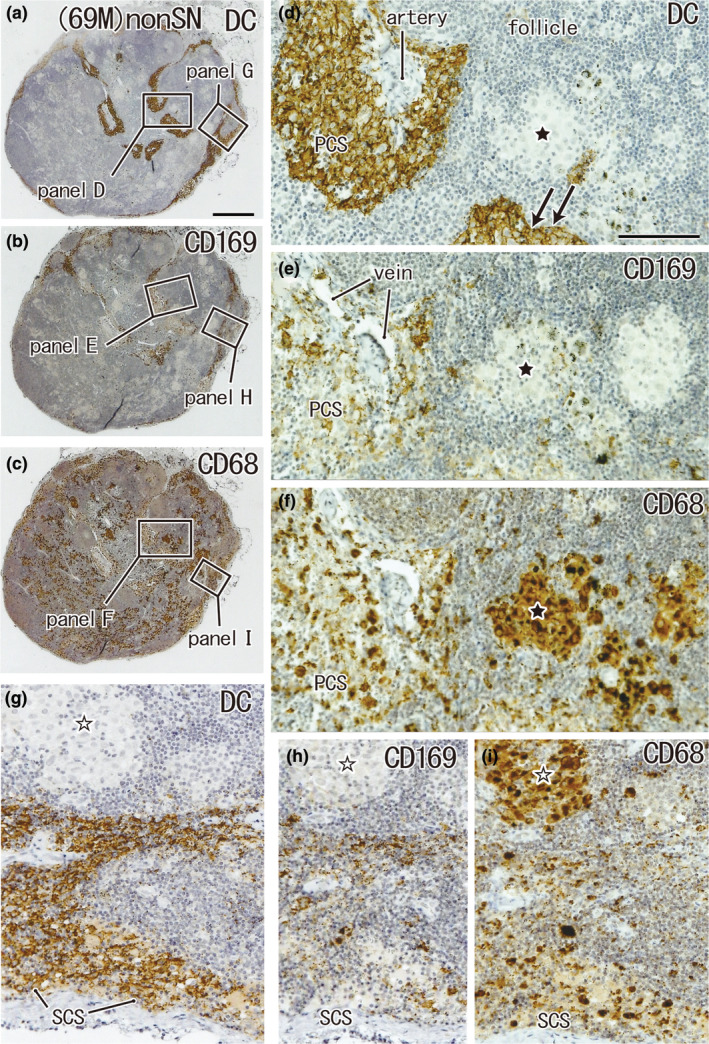
FIGURE 2.
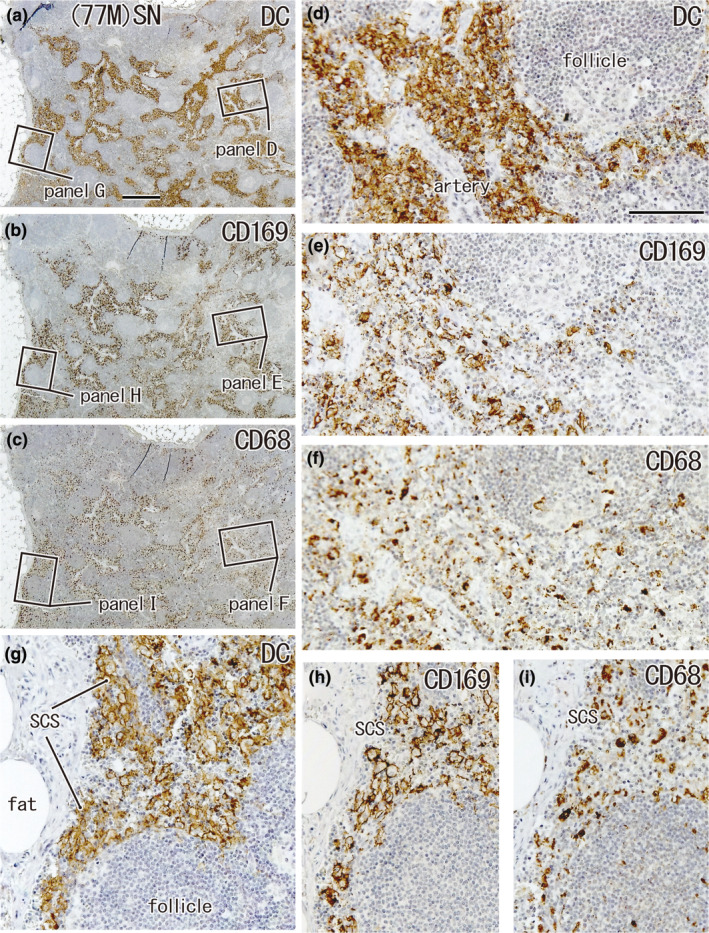
Large overlap in the distribution of DCs and CD169‐positive macrophages: SN from a 77‐year‐old man without metastasis. A lesser curvature node. Immunohistochemistry for the detection of DC‐SIGN (a, d, g), CD169 (b, e, h), and CD68 (c, f, i). (a–c) Show adjacent sections. The two squares in (a) (as well as b, c) are shown in (d) and (g) (as well as e, h and f, i) at higher magnification. In the subcapsular sinus (SCS in panels g–i) as well as in the paracortical area, including a vascular sheath (d–f), DCs co‐exist with CD169‐positive macrophages; the latter appear to be greater in number than CD68‐positive macrophages (e.g., h vs. i). (a–c) and (d–i) were prepared at the same magnification (scale bars: 1 mm in a; 0.1 mm in d). DC, DC‐SIGN‐positive cells; GC, germinal center; MS, medullary sinus; PCS, paracortical sinus; SCS, subcapsular sinus.
FIGURE 3.
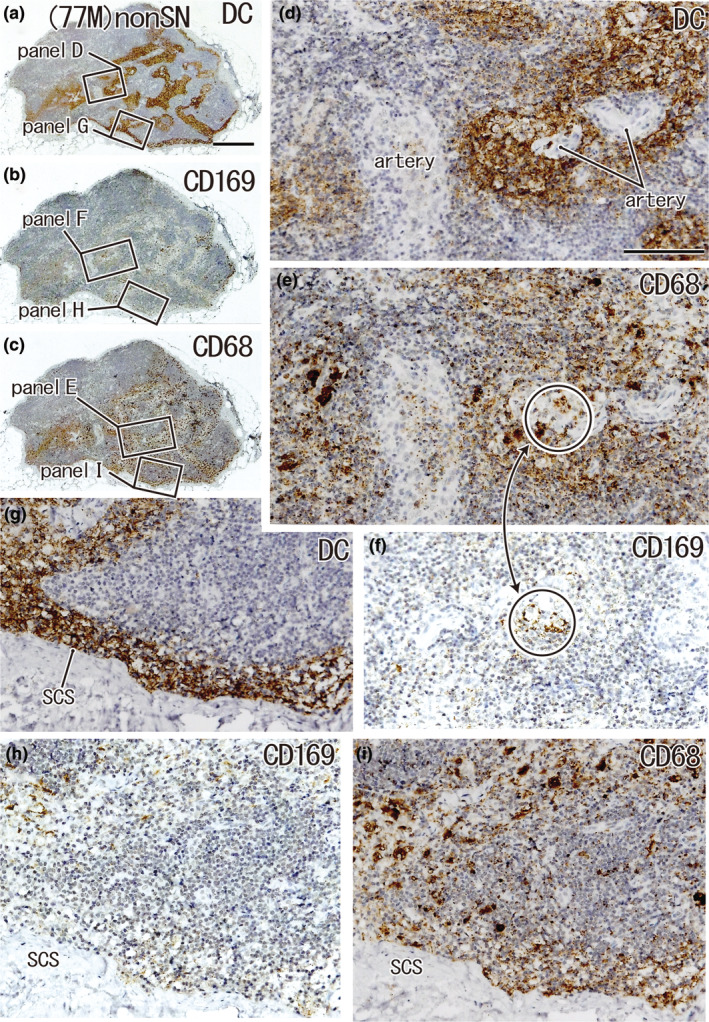
Large overlap in the distribution of DCs and CD68‐positive macrophages: A non‐SN from a 77‐year‐old man without metastasis. The patient's condition was the same as that shown in Figure 2. A lesser curvature node. Immunohistochemistry for the detection of DC‐SIGN (a, d, and g), CD169 (b, f, and h), and CD68 (c, e, and i). (a–c) Show adjacent sections. The two squares in (a) (as well as b and c) are shown in (d) and (g) (as well as f and h and e and i) at higher magnification. In the subcapsular sinus (SCS in g–i), as well as in the paracortical area, including vascular sheaths (d–f), DCs co‐exist with CD68‐positive macrophages, but the latter are much more abundant than CD169‐positive macrophages: the latter cells appear to be restricted in a circle (e, f). (a–c) and (d–i) were prepared at the same magnification (scale bars: 1 mm in (a); 0.1 mm in (d)). DC, DC‐SIGN‐positive cells; GC, germinal center; MS, medullary sinus; PCS, paracortical sinus; SCS, subcapsular sinus.
In the three sinuses, DC clusters overlapped with CD68‐ or CD169‐positive macrophage clusters (Figures 2, 3, 4, 5). Conversely, usually, macrophage clusters do not overlap with DC clusters outside the sinuses. The follicles, especially the secondary follicles, contained abundant CD68‐positive macrophages, but few CD169‐positive macrophages (Figures 2h and 4e). Table 5 shows individual variations in the three parameters of cell distribution, that is, overlapping areas between (1) clusters of CD68‐positive macrophages and DC (overlap A), (2) clusters of CD68‐positive and CD169‐positive macrophages (overlap B), and (3) clusters of DC and CD169‐positive macrophages (overlap C).
FIGURE 4.
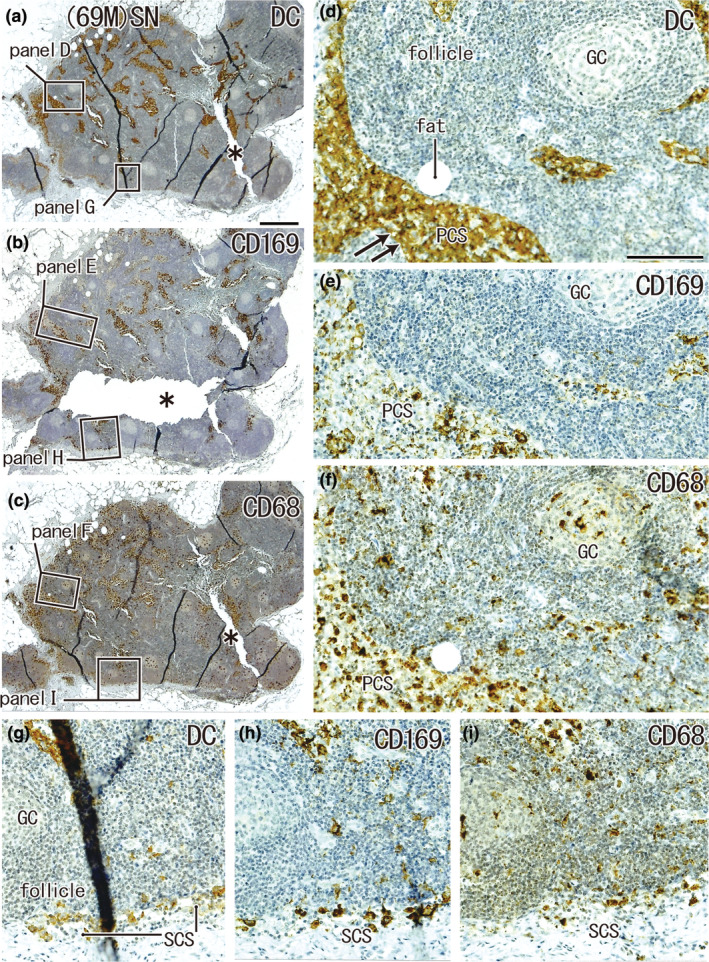
Large overlap in the distribution of DCs and CD169‐positive macrophages: SN from a 69‐year‐old man without metastasis. A lesser curvature node. Immunohistochemistry for the detection of DC‐SIGN (a, d, and g), CD169 (b, e, and h), and CD68 (c, f, and i). (a–c) Show adjacent sections. The two squares in (a) (as well as (b) and (c)) are shown in (d, g) (as well as (e) and (h) and (f) and (i)) at higher magnification. DCs co‐exist with macrophages in the subcapsular sinus (SCS in (g)–(i)) and paracortical sinus (PCS in (d)–(f)). There were fewer CD169‐positive macrophages than CD68‐positive ones. The asterisks in (b) and (c) indicate tissue damage during the histological procedure. Double arrows in (d) indicate the DC‐SIGN‐positive endothelium of the lymph sinus (for greater detail, see Figures 8, 9). (a–c) and (d–i) were prepared at the same magnification (scale bars: 1 mm in (a); 0.1 mm in (d)). DC, DC‐SIGN‐positive cells; GC, germinal center; MS, medullary sinus; PCS, paracortical sinus; SCS, subcapsular sinus.
FIGURE 5.
CD68‐positive macrophage clusters that did not contain DCs: non‐SN from a 69‐year‐old man without metastasis. The patient's condition was the same as that shown in Figure 4. A right cardiac node. Immunohistochemistry for the detection of DC‐SIGN (a, d and g), CD169 (b, e, and h), and CD68 (c, f, and i). (a)–(c) Show adjacent sections. The two squares in (a) (as well as (b) and (c)) are shown in (d) and (g) (as well as (e) and (h) and (f) and (i)) at higher magnification. In the subcapsular sinus (SCS in g–i) as well as in the paracortical sinus (PCS in d–f), DCs co‐exist with macrophages, but in the cortex, histiocytosis‐like clusters of CD68‐positive macrophages (stars) do not contain either DCs or CD169‐positive macrophages (d, e, g, and h). Double arrows in (d) indicate the DC‐SIGN‐positive endothelium of the lymph sinus; for greater detail, see Figures 8 and 9. (a)–(c) and (d)–(i) were prepared at the same magnification (scale bars: 1 mm in (a); 0.1 mm in (d)). DC, DC‐SIGN‐positive cells; GC, germinal center; MS, medullary sinus; PCS, paracortical sinus; SCS, subcapsular sinus.
TABLE 5.
Node size and overlaps between DC and macrophage clusters: meta‐negative patients.
| Age & sex | Node group | Node size (mm2) | Overlap A DC‐CD68/CD68 area% | Overlap B CD169‐68/CD68 area% | Overlap C CD169‐DC/DC area% | Evaluation of reactivity to cancer | |
|---|---|---|---|---|---|---|---|
| 46F 1) | SN ④ | 29.4 | 32.8 | 28.5 | 40.8 | ‐ | |
| Non ③ | 2.0 | 29.3 | 4.0 | 7.1 | ‐ | ||
| 49F | SN ③ | 11.3 | 47.7 | 63.4 | 67.1 | + | |
| Non ⑥ | 17.8 | 34.5 | 26.7 | 32.3 | ‐ | ||
| 52F | SN ③ | 4.7 | 55.9 | 76.0 | 75.7 | ++ | ★ |
| Non ④ | 4.3 | 58.2 | 62.0 | 57.8 | + | ||
| 55M | SN ③ | 7.6 | 36.3 | 65.5 | 80.4 | ++ | ★ |
| Non ⑨ | 3.4 | 67.2 | 81.3 | 72.5 | ++ | ||
| 58M | SN ⑥ | 3.5 | 75.9 | 67.6 | 66.5 | + | ★ |
| Non ③ | 18.4 | 39.7 | 43.9 | 50.3 | + | ||
| 58M‐2 | SN ⑪ | 15.3 | 50.3 | 49.0 | 61.5 | + | |
| Non ⑥ | 6.3 | 59.3 | 33.7 | 38.3 | ‐ | ||
| 63M | SN ③ | 9.9 | 39.1 | 39.7 | 58.6 | + | |
| Non ⑦ | 14.5 | 49.1 | 36.1 | 33.6 | ‐ | ||
| 64M 2) | SN ④ | 8.6 | 39.5 | 32.6 | 41.8 | ‐ | ★★ |
| Non ② | 6.2 | 33.6 | 70.2 | 53.3 | + | ||
| 65M | SN ① | 5.9 | 55.4 | 57.7 | 55.4 | + | ★ |
| Non ④ | 3.0 | 41.1 | 37.5 | 51.3 | + | ||
| 69M 3) | SN ③ | 8.5 | 34.1 | 22.8 | 33.2 | ‐ | ★★ |
| Non ① | 5.4 | 28.5 | 30.5 | 63.6 | + | ||
| 71M | SN ③ | 3.9 | 40.3 | 41.8 | 70.4 | ++ | |
| Non ⑨ | 19.4 | 39.1 | 37.0 | 42.5 | ‐ | ||
| 75F | SN ③ | 9.2 | 26.0 | 36.1 | 58.6 | + | |
| Non ⑤ | 7.1 | 14.4 | 14.4 | 25.9 | ‐ | ||
| 77M 4) | SN ③ | 20.8 | 53.6 | 58.5 | 77.9 | ++ | |
| Non ① | 3.6 | 57.9 | 20.5 | 24.0 | ‐ | ||
| 79M | SN ③ | 16.4 | 46.4 | 39.9 | 43.8 | ‐ | |
| Non ⑧ | 17.1 | 48.4 | 36.8 | 49.4 | ‐ | ||
| 88F | SN ⑥ | 9.1 | 55.3 | 51.1 | 61.8 | + | ★ |
| Non ④ | 3.5 | 59.3 | 63.7 | 69.0 | + | ||
| Mean | SN | 10.9 | 45.9 | 48.7 | 59.6* | ||
| Non SN | 8.8 | 44.0 | 39.9 | 44.7* |
Note: 1) the histologies are shown in Fig 9; 2) Fig 8; 3) Figs 4 and 5; 4) Figs 2 and 3. Overlap A: a proportion of the area overlapped with DC clusters in CD68‐positve macrophage areas of the node. Overlap B: a proportion of the area overlapped with CD169‐positive cell cluster in CD68‐positve macrophage areas of the node. Overlap C: a proportion of the area overlapped with CD169‐positive cell cluster in DC areas of the node. Evaluation of reactivity: ++, overlap C >70%; +, 50%–70%; ‐, <50% (See the second paragraph). ★ Both SN and non‐SN seemed to react in 5 patients; ★★ The non‐SN seemed to react stronger than SN in two patients.
p = 0.019.
The area of overlap A ranged from 26.0% to 75.9% in SNs and 14.4%–67.2% in non‐SNs (Table 5). Because of the large variation, the mean overlap in SNs and non‐SNs (45.9% vs. 44.0%, respectively) was almost the same.
Notably, the smaller area of overlap A was usually caused by the histiocytosis‐like clusters (Aoki et al., 2023; van der Valk & Meijer, 1997) of CD169‐negative macrophages in the cortex (star in Figure 5). The area of overlap B ranged from 22.8% to 76.0% in SNs and 4.0%–81.3% in non‐SNs (Table 5). The overlap was often greater (11/15) in SNs than in non‐SNs; however, this difference was not statistically significant p = 0.201. The area of overlap C ranged from 33.2% to 80.4% in SNs and 7.1%–72.5% in non‐SNs (Table 5). This overlap was usually (11/15) greater in SNs than in non‐SNs, and almost 40% (or more) of CD169‐positive macrophages colocalized with DCs in SNs. The difference in overlap C was statistically significant (p = 0.019). Therefore, DCs and CD169‐positive cells strongly co‐exist in SNs.
Consequently, in patients without metastasis, SNs showed (1) a significantly smaller subcapsular cluster of DCs than non‐SNs (p = 0.037; Table 4) and (2) significantly larger colocalization between DCs and CD169‐positive cells (overlap C) relative to non‐SNs (p = 0.019; Table 5).
4.2. SNs with cancer metastasis
The SNs always received metastasis, and in two of the eight patients with nodal metastasis, a non‐SN also carried metastasis (a woman of 76 years of age, 1 of 2 non‐SNs; a woman of 69 years of age, 1 of 5 non‐SNs). SNs with metastasis were significantly larger in comparison to nearby groups of non‐SNs (59.7 vs. 9.7 mm2) and they carried greater numbers of secondary follicles than non‐SNs (Table 3). When the metastatic foci were small, SN maintained polarization of the structures (Figure 6a,c). The foci contained large macrophages with phagosomes, but few DCs and CD169‐positive macrophages (Figure 6d,e,g,h). Similarly, even in non‐SNs, we sometimes found specific cortical and paracortical areas containing no (or few) DCs and CD169‐positive macrophages (Figure 7a,b). In the evaluation of overlaps A, B, and C, we sometimes found a value “0.0” (e.g., the SN of 69M in Table 6). The absence of an overlap indicates an overlapping distribution that is restricted to metastatic foci. Overlaps A and B were significantly larger in non‐SNs without metastasis than in SNs with metastasis (p = 0.018 and 0.012, respectively).
FIGURE 6.
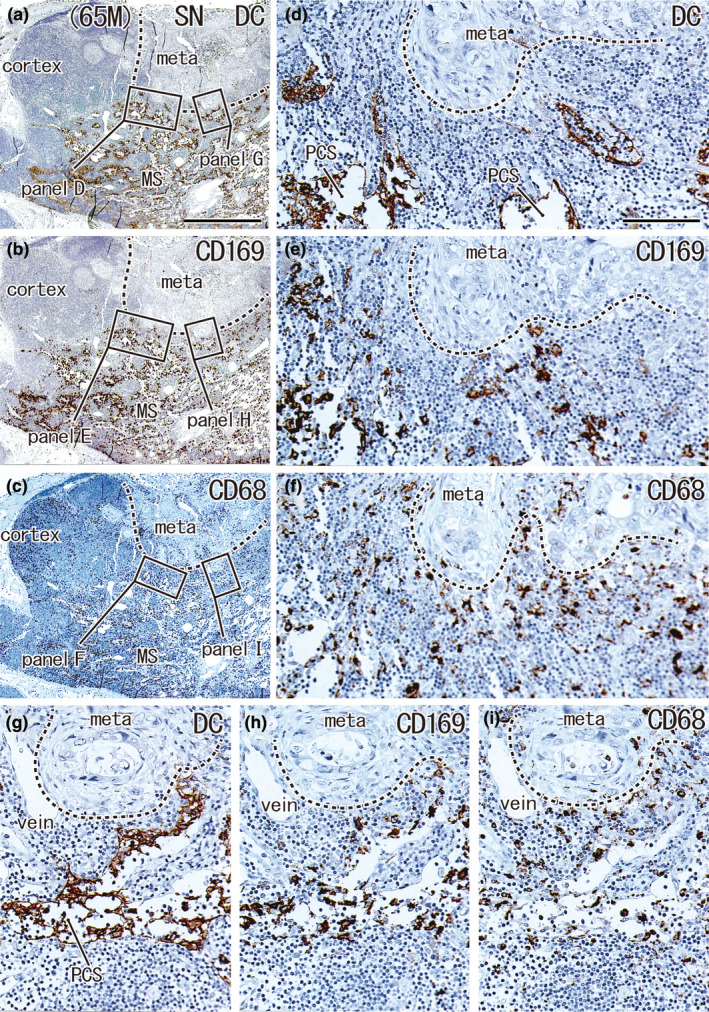
Small metastatic focus and decreased numbers of DCs: SN with metastasis from a 65‐year‐old man. A lesser curvature node. The metastatic focus accounted for 23.4% of the nodal area (meta in a–c). Immunohistochemistry for the detection of DC‐SIGN (a, d, and g), CD169 (b, e, and h), and CD68 (c, f, and i). (a)–(c) show adjacent sections. The two squares in (a) (as well as (b) and (c)) are shown in (d) and (g) (as well as (e) and (h) and (f) and (i)) at higher magnification. The cortex contained abundant CD68‐positive macrophages (c) but few CD169‐positive macrophages (b). The medullary sinuses (MS in (a)–(c)) appeared to contain both DCs and macrophages (a–c), but most DC‐SIGN‐positive cells corresponded to the epithelium of the paracortical sinuses (PCS in (d) and (g); for details, see Figures 8 and 9). (a)–(c) and (d)–(i) were prepared at the same magnification (scale bars: 1 mm in (a); 0.1 mm in (d)). DC, DC‐SIGN‐positive cells; GC, germinal center; MS, medullary sinus; PCS, paracortical sinus; SCS, subcapsular sinus.
FIGURE 7.
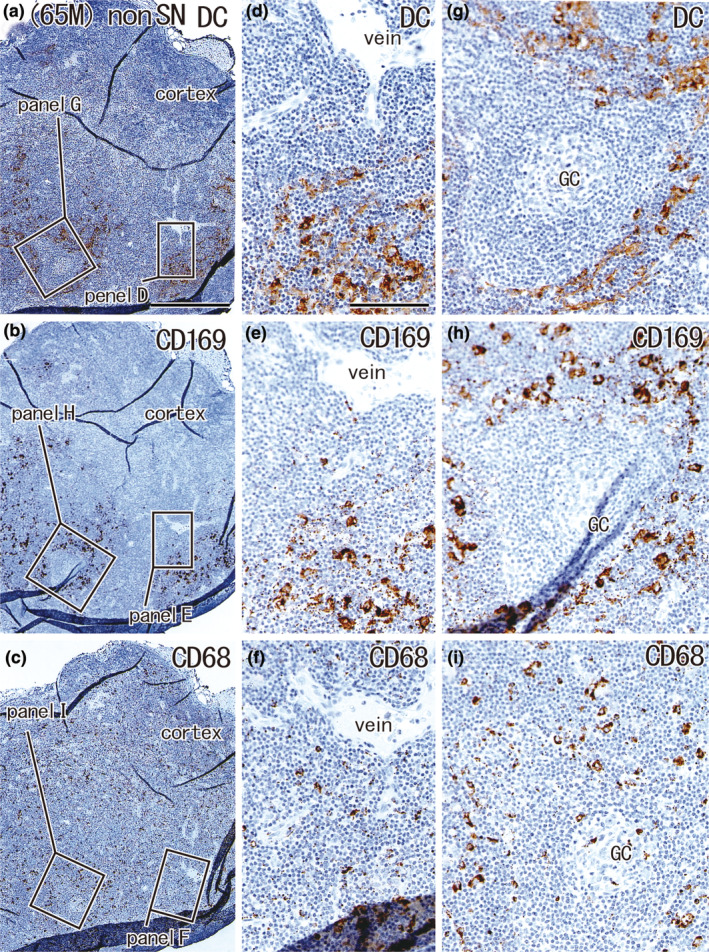
Large overlap in the distribution of DCs and CD169‐positive macrophages: Non‐SN without metastasis from a 65‐year‐old man with metastasis to the SN. The patient's condition was the same as that shown in Figure 6. The node was located in the greater curvature. Immunohistochemistry for the detection of DC‐SIGN (a, d, and g), CD169 (b, e, and h), and CD68 (c, f, and i). (a–c) Show adjacent sections. The two squares in (a) (as well as (b) and (c)) are shown in (d) and (g) (as well as (e) and (h) and (f) and (i)) at higher magnification. This node contained no metastatic foci; however, the cortex contained few DCs and CD169‐positive macrophages (a, b). DCs co‐existed with CD169‐positive macrophages (e.g., (d) vs. (e)). (a–c) and (d–i) were prepared at the same magnification (scale bars: 1 mm in (a); 0.1 mm in (d)). DC, DC‐SIGN‐positive cells; GC, germinal center; MS, medullary sinus; PCS, paracortical sinus; SCS, subcapsular sinus.
TABLE 6.
Node size and overlaps between DC and macrophage clusters: meta‐positive patients.
| Age & sex | Node group | Total area of nodes mm2 (meta foci) | Node size mm2 | Overlap A DC‐CD68/CD68 area% | Overlap B CD169‐68/CD68 area% | Overlap C CD169‐DC/DC area% |
|---|---|---|---|---|---|---|
| 58M | SN ④ | 367.1 (179.0) | 21.1 | 0.7 | 0.0 | 2.4 |
| 58M | Non ② | 7.8 | 7.8 | 69.4 | 71.1 | 69.6 |
| 65M a | SN ③ | 13.7 (0.9) | 13.7 | 13.1 | 25.5 | 32.3 |
| 65M a | Non ④ | 9.5 | 4.1 | 52.4 | 71.6 | 90.6 |
| 65F | SN ③ | 4.5 (0.4) | 4.5 | 58.1 | 57.1 | 61.4 |
| 65F | Non ⑧ | 4.3 | 4.3 | 54.6 | 57.5 | 60.2 |
| 69M | SN ② | 24.2 (4.0) | 6.7 | 0.0 | 0.0 | 0.0 |
| 69M | Non ① | 2.5 | 2.5 | 48.4 | 51.6 | 51.6 |
| 69F | SN ③ | 26.4 (4.7) | 26.4 | 16.7 | 21.0 | 58.1 |
| 69F | Non ⑦ | 16.7 | 6.9 | 47.0 | 47.4 | 48.2 |
| 74M | SN ③ | 13.8 (3.1) | 13.8 | 50.3 | 45.4 | 58.2 |
| 74M | Non ① | 4.4 | 4.4 | 69.1 | 71.1 | 70.5 |
| 76F | SN ③ | 11.0 (3.5) | 11.0 | 62.6 | 70.7 | 65.9 |
| 76F | Non ② | 15.7 | 6.0 | 46.5 | 50.4 | 55.2 |
| 77F | SN ④ | 16.5 (0.6) | 3.8 | 14.2 | 14.2 | 100.0 |
| 77F | Non ③ | 16.4 | 11.1 | 54.4 | 59.5 | 60.0 |
| Mean | SN | 59.7 (24.5) | 12.6 | 30.2 | 34.9 | 44.0 |
| Non SN | 9.7 | 5.9 | 55.2 | 60.0 | 63.2 |
Notes: Overlap A: A proportion of the area overlapped with DC clusters in CD68‐positive macrophage areas of the node. Overlap B: A proportion of the area overlapped with CD169‐positive cell cluster in CD68‐positive macrophage areas of the node. Overlap C: A proportion of the area overlapped with CD169‐positive cell cluster in DC areas of the node.
Finally, we compared the cell distribution parameters between patients with and without metastasis. Non‐SNs in patients with metastasis showed larger overlaps B and C (Table 6; mean, 60.0% and 63.2%, respectively) than non‐SNs in patients without metastasis (Table 5; mean, 39.9% and 44.7%, respectively; both, p = 0.02). Conversely, SNs without metastasis showed a larger overlap B (Table 5; mean, 48.7%) than SNs with metastasis (Table 6; mean, 34.9%; p = 0.036). These comparisons were performed using the corrected area after the reduction of the focus area to avoid the volume effect.
4.3. The paracortical sinus and other features seen commonly in nodes with or without metastasis
Figure 8 shows a rare morphology, in which the paracortical sinus (PCS) is dilated and almost vacant. In contrast, Figure 9 shows multiple paracortical and medullary sinuses without dilation. The lymph endothelia of the paracortical and medullary sinuses expressed both DC‐SIGN and smooth muscle actin (Figure 8a,b), although the endothelia of the arteries and veins were positive for actin. Regardless of the presence or absence of metastatic foci, DCs were concentrated in the subcapsular, paracortical, and medullary lymph sinuses in both SNs and non‐SNs. In these lymph sinuses, the paracortical sinus is almost always filled with abundant DCs. This corresponded to a belt‐like cluster around the follicles (Figures 2g, 3d, 5d, 7g) and a cluster along the trabeculae connected to the nodal capsule (Figures 2d, 3g, 4d, 5g). DCs were sometimes fewer in number in parts of these sinuses, and at such sites, the DC‐SIGN‐positive endothelium became evident along the medullary sinus (Figure 9d), paracortical sinus (Figures 4d, 5d), and both (Figure 6g). Conversely, because DCs filled and expanded the sinus, the endothelium was usually difficult to identify by DC‐SIGN immunohistochemistry (Figures 2d, 3d).
FIGURE 8.
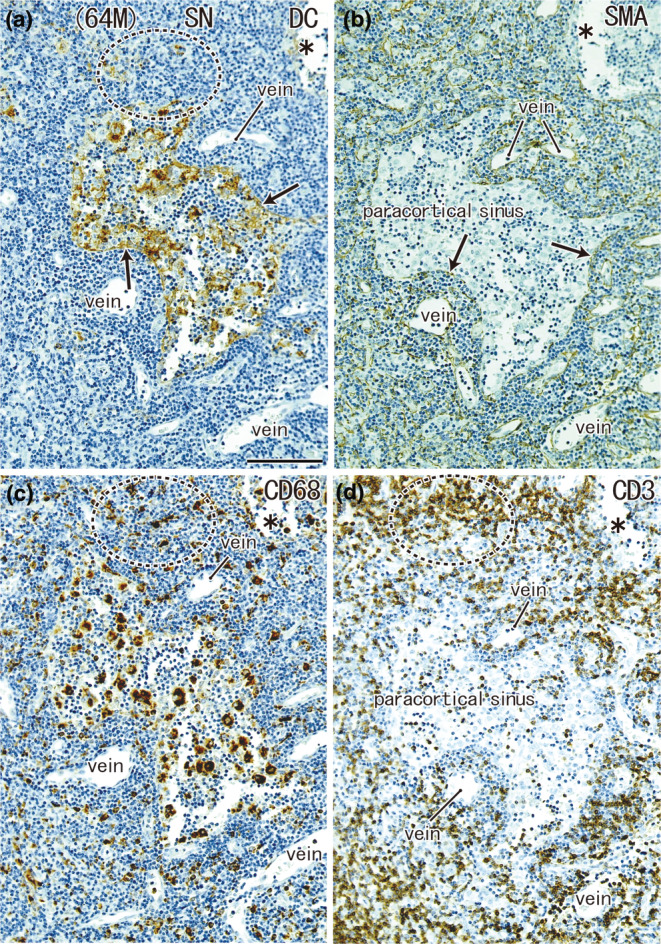
A highly dilated paracortical sinus: SN from a 64‐year‐old man without metastasis. The node was located in the greater curvature. Immunohistochemistry for the detection of DC‐SIGN (a), smooth muscle actin (SMA) (b), CD68 (c), and CD3 (d). All panels show the nearby sections at the same magnification. The endothelium of the paracortical sinus expresses both DC‐SIGN and SMA (arrows in (a) and (b)). The endothelium of the arteries and veins was positive for SMA. The sinus contains abundant macrophages (c), but few CD3‐positive T lymphocytes (d). T‐lymphocyte areas, such as a circle by dotted line, contain abundant macrophages (c) but few DCs (a). Asterisks indicate damage during the histological procedures. Scale bar in (a): 0.1 mm. DC, DC‐SIGN‐positive cells; GC, germinal center; MS, medullary sinus; PCS, paracortical sinus; SCS, subcapsular sinus.
FIGURE 9.
Usual paracortical sinuses seen in a non‐SN from a 64‐year‐old woman without metastasis. A lesser curvature node. Immunohistochemistry for the detection of DC‐SIGN (a, d), CD169 (b, e), and CD68 (c, f). Squares in (a)–(c), after tilting, are shown in (d)–(f), respectively. Thus, the upper side including a germinal center (GC) in (a) corresponds to the left‐hand side of (d). Endothelium of the paracortical and medullary sinuses (PCS, MS) expresses DC‐SIGN (arrows in (d)). In these sinuses, the DC cluster (d) overlapped with macrophage clusters (e, f). (a–c) and (d–f) were prepared at the same magnification (scale bars: 1 mm in (a); 0.1 mm in (d)). The DC‐SIGN‐positive endothelium of the lymph sinus is also shown in Figures 4d, 5d, 6g. DC, DC‐SIGN‐positive cells; GC, germinal center; MS, medullary sinus; PCS, paracortical sinus; SCS, subcapsular sinus.
4.4. Clinical stage and pathology of the primary cancer
Although all 23 patients examined survived for more than 5 years without any recurrence (see the Materials and Methods), the present study included four patients with clinical stage II disease. Compared to stage I patients, these four patients tended to have DC clusters that were separate from macrophage clusters. However, whether the pathology of the primary cancer was well or poorly differentiated did not correlate with any of the examined parameters. In addition, we found no evidence that the total area (mm2) of the “node group” (multiple nodes at one site) was correlated with stage or pathology.
5. DISCUSSION
Although several hypotheses have been postulated for the reprogramming of the sentinel lymph node microenvironment during tumor metastasis (Li & Jung, 2022; Riedel et al., 2016), no studies have shown which histology corresponds to changes or reprogramming. To elucidate the histological differences between SNs and non‐SNs, we noted and evaluated the amount of subcapsular cell components and three parameters of cell distribution: overlap A between DC and CD68‐positive macrophages, overlap B between CD68‐ and CD169‐positive cells, and overlap C between DC and CD169‐positive cells. Accordingly, we found two significant differences in cell distribution between SNs and non‐SNs in patients without nodal metastasis: (1) the subcapsular DC clusters in SNs were smaller than those in non‐SNs (p = 0.037) and (2) overlap C in SNs was larger than that in non‐SNs (p = 0.019).
Abundant monocyte‐derived DCs (moDCs) were present in CD169‐positive cell clusters, and CD68‐negative CD169‐positive cells were observed in DC clusters. According to Grabowska et al. (2018) and Reis‐Sobreiro et al. (2021), CD169‐positive macrophages are frequently the first cell type infected and thereby provide a confined source of antigen, while cross‐presenting DCs interact with antigen‐containing macrophages, pick up antigens, and activate T lymphocytes. Moreover, cross‐priming of T lymphocytes by DCs is enhanced by the localized production of type I interferons (IFNs) by CD169‐positive macrophages. Therefore, the larger overlap between them (overlap C) seemed to correspond to the increased cross‐presentation of cancer antigens. Based on the data of overlap C, we classified the 15 patients without metastasis into three categories (the final two columns in Table 5): (1) SNs showed higher activity than non‐SNs (8 patients without stars), (2) both SNs and non‐SNs showed higher activity (5 patients with a single star), and (3) non‐SNs showed higher activity than SNs (2 patients with double stars). In these categories, the high activity of the non‐SNs (not SNs) might be a result of (1) unstable lymph flow to the SN, (2) the long lag time after cancer debris reached the SN, and/or (3) suppression of the SN by the cancer earlier than the non‐SN. The “unstable flow” might be caused by local inflammation, feeding status, and/or other factors, including the shape of the stomach pressed by the air of the colon and/or lung.
Subcapsular moDCs are considered immature cells that are “waiting” for antigens from afferent lymph vessels (Engering et al., 2004; Yamada et al., 2023). Chen et al. (2022) reported that CD169‐positive subcapsular macrophages provide microvesicles that react with follicular dendritic cells after apoptosis. We found significantly longer subcapsular DC clusters in non‐SNs than in SNs of patients without metastasis. Dead and fragmented cells from the primary cancer lesion might “call” (attract) moDCs to the subcapsular sinus of the SN first and, at the time of surgery, the moDCs (after activation) may migrate to the paracortical sinus to meet T lymphocytes. In contrast, calling and migration were likely to be delayed in non‐SN areas slightly distant from the major lymph flow. Thus, rather than the SN, we observed the accumulation of subcapsular moDCs in non‐SNs. We considered the “time and distance” as keys to understanding nodal morphometric data (see also the next paragraph). Since the subcapsular clusters were much smaller than the paracortical and medullary clusters, distinct individual variations in the latter cluster seemed to mask the migration of DCs. The subcapsular sinus contained candidate CD68‐negative and CD169‐positive cells. We speculate that moDCs express CD169 after exposure to cancer debris.
The present morphometric analysis also showed a difference between an SN with metastasis and a nearby node (non‐SN) without metastasis and a difference in nodal morphology between patients with and without metastasis. Overlaps A and B were larger in non‐SNs without metastasis than in SNs with metastasis (p = 0.018 and p = 0.012, respectively). Non‐SNs in patients with metastasis showed larger B and C overlaps relative to non‐SNs in patients without metastasis (both p = 0.02). Conversely, SNs without metastasis showed a larger B overlap than SNs with metastasis (p = 0.036). These results appear somewhat controversial, but the lag time after receiving cancer debris, as well as the distance from the cancer, seems to provide a suitable interpretation. The cancer debris first reaches the SN and, with a time lag, seems to reach non‐SNs. The nodes examined seemed to be arranged in line as follows: (1) the SN with metastasis, (2) non‐SNs near the metastatic SN (a node nearest the cancer), (3) the SN in patients without metastasis, and (4) non‐SNs in patients without metastasis (most distant from the cancer). This arrangement was compatible with nodes from downstream to upstream along the lymph flow, and exposure to the cancer debris seemed to occur in the aforementioned order of 1–4 with a lag time. In patients with metastasis, overlap C is often larger in non‐SNs than in SNs. Rather than suppressing SNs through metastasis, non‐SNs are likely to play an active role in cancer immunity.
Many studies have provided evidence that the suppression of cancer immunity occurs earliest in SNs of patients with melanoma (Botella‐Estrada et al., 2005; Cochran et al., 2001, 2006; Virgilio et al., 2022), breast cancer (Van Pul et al., 2019, 2020), vulvar cancer (Heeren et al., 2021), and gastric cancer (Pak et al., 2019). These results have been reviewed to identify clinical solutions (Tanaka & Sakaguchi, 2017; Tay et al., 2023). Ito et al. (2006) demonstrated that metastatic cells induce apoptosis of DCs in vitro. Indeed, the number of CD169‐positive cells appeared to decrease after the metastatic foci were established in the node. Both the primary cancer and metastatic foci were most likely to suppress CD169‐positive cells. Even in the SNs of patients without metastasis, we sometimes found a specific paracortex without DCs and CD169‐positive macrophages, in contrast to the abundant CD68‐positive macrophages. The term “sentinel” suggests a frontier in the battle against cancer; however, rather than being preconditioned, SNs seemed to be suppressed earlier than non‐SNs.
DCs are usually localized to the T lymphocytes in the outer zone of the paracortex (e.g., Angel et al., 2009; Engering et al., 2004). However, this description may create the false impression that DCs intermingle with T lymphocytes in this region to facilitate antigen presentation. Rather than a mixture of cells, we emphasized using the final two figures that showed that most DCs existed within the lymph sinuses and were enclosed by the endothelium. Park et al. (2014) classified human intranodal sinuses on the basis of lymphatic vessel endothelial hyaluronan receptor 1 (LYVE‐1) reactivity. However, we considered DC‐SIGN immunoreactivity to be sufficient for the identification of sinuses. Johnson and Jackson (2010) stated that the lymphatic endothelium may be a key regulator of DC transmigration at the subcapsular, paracortical, and medullary sinuses of a node.
Conclusive remark: Gastric SNs were characterized by (1) the presence of a small subcapsular DC cluster and (2) a large overlapping area between clusters of DC and CD169‐positive cells. Therefore, according to these two parameters and other observations, SNs seemed to have already been preconditioned against cancer and non‐SNs might have also started a delayed reaction. Nevertheless, decreased areas of DCs and CD169‐positive cells in the metastatic node strongly suggest cancer‐induced suppression, even in early gastric cancer. We believe that the present methodology provides new insights into this research field.
6. STUDY LIMITATIONS
The essential limitation of this study was the small number of patients. In our hospital, sentinel node navigation surgery was stopped in December 2017 and was changed to expanded lymph node dissection. Because the surgically obtained SNs were used in various studies between 2018 and 2023, it was difficult to determine the maximum sectional area of the SNs in the remaining paraffin blocks. Another limitation was the use of a DC‐SIGN antibody that stained not only DCs, but also the lymph sinus epithelium. Thus, when few DCs are present in the metastatic nodes, the reactivity of the epithelium is likely to provide a false‐positive area for the cluster of DCs. One striking feature of the present observations is that the T‐lymphocyte area was separated from a major part of the paracortical DC clusters by the lymph sinus epithelium. However, the present histology did not reveal possible pores in the epithelium, and the present morphometry did not evaluate the number of DCs that had transmigrated through the epithelium.
AUTHOR CONTRIBUTIONS
G. M. designed the study; T. A., D. M., M. S., Y. T., and K. S. collected anatomical specimens; T. S. and M. A. analyzed and visualized the anatomical data; T. S. drafted the manuscript; T. O. and G. M. critically revised the manuscript. All authors have read and approved the final manuscript.
CONFLICT OF INTEREST
The authors declare no conflict of interest associated with this study.
ACKNOWLEDGMENTS
This work is supported by Department of Digestive Surgery, Kagoshima University Graduate Schol of Medical and Dental Sciences.
Sonoda, T. , Arigami, T. , Aoki, M. , Matsushita, D. , Shimonosono, M. , Tsuruda, Y. et al. (2025) Difference between sentinel and non‐sentinel lymph nodes in the distribution of dendritic cells and macrophages: An immunohistochemical and morphometric study using gastric regional nodes obtained in sentinel node navigation surgery for early gastric cancer. Journal of Anatomy, 246, 272–287. Available from: 10.1111/joa.14147
Contributor Information
Tomohiro Sonoda, Email: tsonoda713@gmail.com.
Gen Murakami, Email: g.murakamisaori@gmail.com.
DATA AVAILABILITY STATEMENT
All data supporting the histological findings of this study are available from the corresponding author upon reasonable request.
REFERENCES
- Angel, C.E. , Chen, C.J.J. , Horlacher, O.C. , Winkler, S. , John, T. , Browning, J. et al. (2009) Distinctive localization of antigen‐presenting cells in human lymph nodes. Blood, 113, 1257–1267. [DOI] [PMC free article] [PubMed] [Google Scholar]
- Aoki, M. , Jin, Z.W. , Ueda, K. , Kamimura, G. , Takeda‐Harada, A. , Murakami, G. et al. (2023) Localization of macrophages and dendritic cells in human thoracic lymph node: An immunohistochemical study using surgically‐obtained specimens. Journal of Anatomy, 243(3), 504–516. [DOI] [PMC free article] [PubMed] [Google Scholar]
- Botella‐Estrada, R. , Dasi, F. , Ramos, D. , Nagore, E. , Herrero, M. , Gimenez, J. et al. (2005) Cytokine expression and dendritic cell density in melanoma sentinel node. Melanoma Research, 15, 99–106. [DOI] [PubMed] [Google Scholar]
- Chen, X. , Zheng, Y. , Liu, S. , Yu, W. & Liu, Z. (2022) CD169+ subcapsular sinus macrophage‐derived microvesicles are associated with light zone follicular dendritic cells. European Journal of Immunology, 52, 1581–1594. [DOI] [PMC free article] [PubMed] [Google Scholar]
- Cheong, C. , Matos, I. , Choi, J.H. , Dandamudi, D.B. , Shrestha, E. , Longhi, M.P. et al. (2010) Microbial stimulation fully differentiates monocytes to DC‐ SIGN/CD209(+) dendritic cells for immune T cell areas. Cell, 143, 416–429. [DOI] [PMC free article] [PubMed] [Google Scholar]
- Cochran, A.J. , Huang, R.R. , Lee, J. , Itakura, E. , Leong, S.P. & Essner, R. (2006) Tumor‐induced immune modulation of sentinel nodes. Nature Reviews Immunology, 6, 659–670. [DOI] [PubMed] [Google Scholar]
- Cochran, A.J. , Morton, D.L. , Stern, S. , Lana, A.M. , Essner, R. & Wen, D.R. (2001) Sentinel lymph nodes show profound downregulation of antigen‐presenting cells of the paracortex: implication for tumor biology and treatment. Modern Pathology, 14, 604–608. [DOI] [PubMed] [Google Scholar]
- Engering, A. , van Vliet, S. , Hebeda, K. , Jackson, D.G. , Prevo, R. , Singh, S.K. et al. (2004) Dynamic populations of dendritic cell‐specific ICAM‐3 grabbing nonintegrin‐positive immature dendritic cells and liver/lymph node‐specific ICAM‐3 grabbing nonintegrin‐positive endothelial cells in the outer zones of the paracortex of human lymph nodes. The American Journal of Pathology, 164, 1587–1595. [DOI] [PMC free article] [PubMed] [Google Scholar]
- Grabowska, J. , Lopez‐Venegas, M.A. , Affandi, A.J. & den Haan, J.M.M. (2018) CD169+ macrophages capture and dendritic cell instruct: the interplay of the gatekeeper and the general of the immune system. Frontiers in Immunology, 9, 2472. Available from: 10.3389/fimmu.2018.02472 [DOI] [PMC free article] [PubMed] [Google Scholar]
- Granelli‐Piperno, A. , Pritsker, A. , Pack, M. , Shimeliovich, I. , Arrighi, J.F. , Park, C.G. et al. (2005) Dendritic cell‐specific intercellular adhesion molecule 3‐grabbing nonintegrin/CD209 is abundant on macrophages in the normal human lymph node and is not required for dendritic cell stimulation of the mixed leukocyte reaction. Journal of Immunology, 175, 4265–4273. [DOI] [PMC free article] [PubMed] [Google Scholar]
- Heeren, A.M. , Rotman, J. , Samuels, S. , Zijlmans, H.J.M.A.A. , Fons, G. , van de Vijver, K.K. et al. (2021) Immune landscape in vulvar cancer‐draining lymph nodes indicates distinct immune escape mechanisms in support of metastatic spread and growth. J Immunother Cancer, 9, e003623. [DOI] [PMC free article] [PubMed] [Google Scholar]
- Ito, M. , Minamiya, Y. , Kawai, H. , Saito, S. , Saito, H. , Nakagawa, T. et al. (2006) Tumor‐derived TGFbeta‐1 induces dendritic cell apoptosis in the sentinel lymph node. Journal of Immunology, 176, 5637–5643. [DOI] [PubMed] [Google Scholar]
- Japanese Gastric cancer Association . (2011) Japanese classification of gastric carcinoma. Gastric Cancer, 14, 101–112. [DOI] [PubMed] [Google Scholar]
- Johnson, L.A. & Jackson, D.G. (2010) Inflammation‐induced secretion of CCL21 in lymphatic endothelium is a key regulator of integrin‐mediated dendritic cell transmigration. International Immunology, 22, 839–849. [DOI] [PubMed] [Google Scholar]
- Kamiya, S. , Takeuchi, H. , Fukuda, K. , Kawakubo, H. , Takahashi, N. , Mitsumori, N. et al. (2021) A multicenter non‐randomized phase III study of sentinel node navigation surgery for early gastric cancer. The Japanese Journal of Clinical Oncology, 51, 305–309. [DOI] [PubMed] [Google Scholar]
- Kawasaki, N. , Vela, J.L. , Nycholat, C.M. , Rademacher, C. , Khurana, A. , van Rooijen, N. et al. (2013) Targeted delivery of lipid‐antigen to macrophages via the CD169/sialoadhesin endocytic pathway induces robust invariant killer T cell activation. Proceedings of the National Academy of Sciences of the United States of America, 110, 7826–7831. [DOI] [PMC free article] [PubMed] [Google Scholar]
- Kitagawa, Y. , Fujii, H. , Mukai, M. , Kubota, T. , Ando, N. , Watanabe, M. et al. (2020) The role of the sentinel lymph node in gastrointestinal cancer. The Surgical Clinics of North America, 80, 1799–1809. [DOI] [PubMed] [Google Scholar]
- Kumamoto, K. , Tasaki, T. , Ohnishi, K. , Shibata, M. , Shimajiri, S. , Harada, M. et al. (2021) CD169 expression on lymph node macrophages predicts in patients with gastric cancer. Front Oncologia, 11, 636751. [DOI] [PMC free article] [PubMed] [Google Scholar]
- Lai, W.K. , Sun, P.J. , Zhang, J. , Jennings, A. , Lalor, P.F. , Hubscher, S. et al. (2006) Expression of DC‐SIGN and DC‐SIGNR on human sinusoidal endothelium. The American Journal of Pathology, 169, 200–208. [DOI] [PMC free article] [PubMed] [Google Scholar]
- Li, Y.L. & Jung, W.C. (2022) Reprogramming of sentinel lymph node microenvironment during tumor metastasis. Journal of Biomedical Science, 29, 84. [DOI] [PMC free article] [PubMed] [Google Scholar]
- Lutz, M.B. , Ali, S. , Audiger, C. , Autenrieth, S.E. , Berod, L. & Bigley, V. (2022) Guidelines for mouse and human DC generation. European Journal of Immunology, 53, e2249816. Available from: 10.1002/eji.202249816 [DOI] [PMC free article] [PubMed] [Google Scholar]
- Marzaioli, V. , Canavan, M. , Floudas, A. , Flynn, K. , Mullan, R. , Veale, D.J. et al. (2022) CD209/CD14+ dendritic cells characterization in rheumatoid and psoriatic arthritis patients: activation, synovial infiltration, and therapeutic targeting. Frontiers in Immunology, 12, 722349. [DOI] [PMC free article] [PubMed] [Google Scholar]
- Pak, K.H. , Park, K.C. & Cheong, J.H. (2019) VEGF‐C induced by TGF‐ß1 signaling in gastric cancer enhances tumor‐induced lymphangiogenesis. BMC Cancer, 19, 799. [DOI] [PMC free article] [PubMed] [Google Scholar]
- Park, S.M. , Angel, C.E. , McIntosh, J. , Mansell, C.M. , Chen, C.J.J. , Cebon, J. et al. (2014) Mapping the distinctive populations of lymphatic endothelial cells in different zones of human lymph nodes. PLoS One, 9, e94781. [DOI] [PMC free article] [PubMed] [Google Scholar]
- Reis‐Sobreiro, M. , da Mota, A.T. , Jardim, C. & Serre, K. (2021) Bringing macrophages to the frontline against cancer: current immunotherapies targeting macrophages. Cells, 10, 2364. Available from: 10.3390/cells10092364 [DOI] [PMC free article] [PubMed] [Google Scholar]
- Riedel, A. , Shorthouse, D. , Haas, L. , Hall, B.A. & Shields, J. (2016) Tumor induced stromal reprogramming drives lymph node transformation. Nature Immunology, 17, 1118–1127. [DOI] [PMC free article] [PubMed] [Google Scholar]
- Takeuchi, H. , Kitajima, M. & Kitagawa, Y. (2008) Sentinel lymph node as a target of molecular diagnosis of lymphatic micrometastasis and local immunoresponse to malignant cells. Cancer Science, 99, 441–450. [DOI] [PMC free article] [PubMed] [Google Scholar]
- Tanaka, A. & Sakaguchi, S. (2017) Regulatory T cells in cancer immunotherapy. Cell Research, 27, 109–118. [DOI] [PMC free article] [PubMed] [Google Scholar]
- Tay, C. , Tanaka, A. & Sakaguchi, S. (2023) Tumor‐infiltrating regulatory T cells as targets of cancer immunotherapy. Cancer Cell, 41, 450–465. [DOI] [PubMed] [Google Scholar]
- van der Valk, P. & Meijer, C.J.L.M. (1997) Reactive lymph node. In: Histology for pathologists, 2nd edition. Philadelphia: Lippincott‐Raven, pp. 651–673. [Google Scholar]
- van Pul, K.M. , Vuylsteke, R.J.C.L.M. , de Beijer, M.T.A. , van de Ven, R. , van den Tol, M.P. , Stockmann, H.B.A.C. et al. (2020) Breast cancer‐induced immune suppression in the sentinel lymph node is effectively countered by CpG‐B in conjunction with inhibition of the JAK2/STAT3 pathway. J Immunother Cancer, 8, e000761. [DOI] [PMC free article] [PubMed] [Google Scholar]
- Van Pul, K.M. , Vuylsteke, R.J.C.L.M. , De Ven, V. , Te Velde, E.A. , Th Rutgers, E.J. , Van Den Tol, M.P. et al. (2019) Selectively hampered activation of lymph node‐ resident dendritic cells precedes profound T cell suppression and metastatic spread in the breast cancer sentinel lymph node. The Journal of Immunotherapy Cancer, 7, 133. [DOI] [PMC free article] [PubMed] [Google Scholar]
- Virgilio, T. , Bordini, J. , Cascione, L. , Sartori, G. , Latino, I. , Romero, D.M. et al. (2022) Subcapsular sinus macrophages promote melanoma metastasis to the sentinel lymph nodes via an IL1a‐STAT axis. Cancer Immunology Research, 10, 1525–1541. [DOI] [PMC free article] [PubMed] [Google Scholar]
- Yamada, R. , Ohnishi, K. , Pan, C. , Yano, H. , Fujiwara, Y. , Shiota, T. et al. (2023) Expression of macrophage/dendritic cell‐related molecules in lymph node sinus macrophages. Microbiology and Immunology, 67, 490–500. Available from: 10.1111/1348-0421.13095 [DOI] [PubMed] [Google Scholar]
Associated Data
This section collects any data citations, data availability statements, or supplementary materials included in this article.
Data Availability Statement
All data supporting the histological findings of this study are available from the corresponding author upon reasonable request.