

Abstract
Sodium–glucose cotransporter 2 (SGLT2) inhibitors can cause a reversible decline in glomerular filtration rate (GFR), which may influence dosing recommendations for renally excreted medications. In practice, GFR is typically estimated by serum creatinine concentration, but creatinine may not be a reliable indicator of GFR decline in the setting of SGLT2 inhibitor use. Alternative filtration markers such as cystatin C, β‐trace protein (BTP), and β2‐microglobulin (B2M) may be more appropriate, but little is known about how these markers are affected by SGLT2 inhibitor use. Therefore, we determined creatinine, cystatin C, BTP, and B2M concentration in a crossover study of 35 people with type 2 diabetes receiving 12 weeks of dapagliflozin treatment or placebo. Estimated GFR (eGFR) based on creatinine (eGFRcre), cystatin C (eGFRcys), their combination (eGFRcomb), or a panel of all four markers (eGFRpanel) was compared with measured GFR (mGFR) based on plasma clearance of chromium‐51 labeled ethylenediamine tetraacetic acid (51Cr‐EDTA). Dapagliflozin treatment was associated with a significant decrease in mGFR (−9 mL/min/1.73 m2, P < 0.001) but not a corresponding increase in concentration of any filtration marker. No eGFR equation accurately predicted change in mGFR between treatment periods, but eGFRcomb and eGFRpanel yielded the highest overall accuracy relative to mGFR across both treatment periods. These findings highlight the stability in performance gained by combining multiple filtration markers but suggest that eGFR in general is not an ideal metric for assessing short‐term GFR decline in people initiating SGLT2 inhibitor therapy.
Study Highlights.
WHAT IS THE CURRENT KNOWLEDGE ON THE TOPIC?
SGLT2 inhibitors can cause a reversible decline in GFR, but creatinine‐based eGFR is not a reliable indicator of this decline. Alternative filtration markers such as cystatin C, BTP, and B2M may be more appropriate, but little is known about how these markers are affected by SGLT2 inhibitor use.
WHAT QUESTION DID THIS STUDY ADDRESS?
What is the effect of dapagliflozin treatment on creatinine, cystatin, BTP, and B2M concentration, and do these changes accurately reflect the change in mGFR?
WHAT DOES THIS STUDY ADD TO OUR KNOWLEDGE?
No eGFR equation accurately predicted the change in mGFR following 12 weeks of dapagliflozin treatment. However, eGFR equations combining creatinine and cystatin C yielded the highest overall accuracy relative to mGFR across both treatment periods.
HOW MIGHT THIS CHANGE CLINICAL PHARMACOLOGY OR TRANSLATIONAL SCIENCE?
Clinicians should expect a short‐term decline in renal filtration for patients initiating SGLT2 inhibitor therapy and be aware of the drawbacks of eGFR for assessing this decline. Given the strong overall performance of eGFRcomb, clinicians should consider routine use of cystatin C in this patient population.
As the prevalence of type 2 diabetes (T2D) increases worldwide, so does the use of antidiabetic medications including sodium–glucose cotransporter 2 (SGLT2) inhibitors. Approximately 9% of people with T2D in the United States received an SGLT2 inhibitor in 2021, 1 but this number is significantly higher in younger people and continues to increase. 2 According to a recent analysis of guidelines from the American Diabetes Association, SGLT2 inhibitors are indicated for more than one‐third of people with diabetes, 3 corresponding to nearly 5% of the entire United States population. 4 Use of SGLT2 inhibitors has also increased in recent years due to evidence of cardiovascular and renal benefits beyond their glucose‐lowering effects, 5 and they are now considered among other first‐line agents for the treatment of chronic kidney disease (CKD) and congestive heart failure (CHF) regardless of diabetes status. 6
Several large clinical trials have demonstrated that SGLT2 inhibitors slow CKD progression in people with T2D with or without concomitant CKD. 7 However, SGLT2 inhibitors can also cause a short‐term decline in glomerular filtration rate (GFR) due to vasoconstriction of afferent arterioles. 8 This GFR decline is reversible and compensated for in the long‐term by reduced glomerular hypertension, but the sudden GFR decline may necessitate a corresponding dose reduction for medications that depend on renal elimination. Many common medications used to treat T2D, CKD, and CHF must be dosed according to kidney function, and improper dose adjustment of these medications can lead to therapy failure or adverse drug reactions. 9 Therefore, it is essential that clinicians who start their patients on an SGLT2 inhibitor know to expect a short‐term GFR decline and can accurately assess this decline.
Measured GFR (mGFR) using an exogenous filtration marker is considered the “gold standard” for assessing GFR, but this procedure is not (yet) available for routine clinical use. Instead, GFR is typically estimated by serum creatinine concentration, but estimated GFR (eGFR) based on creatinine is not necessarily a reliable indicator of the GFR decline caused by SGLT2 inhibitors. 10 Cystatin C can also be used to calculate eGFR, and earlier studies have found that SGLT2 inhibitor use leads to discrepancies between creatinine‐ and cystatin C‐based eGFR. 11 However, no studies to our knowledge have compared the accuracy of creatinine‐ and cystatin C‐based eGFR relative to mGFR in the setting of SGLT2 inhibitor use. There is also no data regarding the effect of SGLT2 inhibitors on other filtration markers such as β‐trace protein (BTP) and β2‐microglobulin (B2M), and it is unclear whether incorporating these additional markers improves eGFR accuracy in this setting.
Therefore, we aimed to determine the effect of dapagliflozin treatment on creatinine, cystatin C, BTP, and B2M concentration and identify which eGFR equations based on these markers most accurately reflect the short‐term changes in mGFR. We also investigated how the choice of the eGFR equation would affect dosing recommendations for renally excreted medications before and after initiation of dapagliflozin therapy.
MATERIALS AND METHODS
Study design
This was a post hoc analysis of a previously described clinical trial (“DapKid”) performed at Steno Diabetes Center Copenhagen in Herlev, Denmark. The purpose of the DapKid study was to determine the effects of dapagliflozin treatment on urinary proteomic patterns in people with T2D, and study findings have been published previously. 12 In short, the DapKid study enrolled adults (age ≥ 18 years) with T2D, HbA1c > 58 mmol/mol (7.5%), eGFR ≥ 45 mL/min/1.73 m2, and urinary albumin‐to‐creatinine ratio (UACR) ≥ 30 mg/g. Exclusion criteria were history of CHF, recent (< 2 months) cardiovascular event, or current use of a loop diuretic. Study participants were randomized to receive either placebo or oral dapagliflozin 10 mg daily for 12 weeks, at which point participants were switched to the other treatment for 12 weeks (no washout period). Participants who completed the DapKid study were considered for analysis in this study and subsequently excluded if they were missing data for mGFR or any filtration marker.
Ethical standards
The DapKid study was approved by the Danish Data Protection Agency (P SDC‐2015‐036 [I‐suite 03814]) and Research Ethics Committees for the Capital Region (H‐15006370). All study participants provided informed consent in accordance with the Declaration of Helsinki. The clinical trial is registered at ClinicalTrials.gov (NCT02914691) and EudraCT (2015‐000335‐32).
Measurements
Demographic information including age, sex, weight, and height was collected at baseline (prior to any treatment). Measured GFR was determined at the end of each treatment period (placebo and dapagliflozin) by plasma clearance of chromium‐51 labeled ethylenediamine tetraacetic acid (51Cr‐EDTA) using a one‐compartment model with four‐point sampling (180, 200, 220, and 240 minutes after injection). Weight was remeasured and blood samples were collected immediately prior to GFR measurement at each timepoint, and filtration markers were measured from plasma using standard assays: creatinine was measured by a traceable enzymatic assay on a Roche Cobas® 8000 c702 (coefficient of variation [CV]: 4%), cystatin C was measured by a traceable immunoturbidimetric assay on a Roche Cobas® 8000 c502 (CV: 5%), BTP was measured by nephelometry on a Siemens BN ProSpec® (CV: 5%), and B2M was measured by immunoturbidimetry on a Roche Cobas® 8000 c702 (CV: 4%). Estimated GFR was calculated using equations from the Chronic Kidney Disease Epidemiology Collaboration (CKD‐EPI) based on creatinine (eGFRcre 13 ), cystatin C (eGFRcys 14 ), the combination of creatinine and cystatin C (eGFRcomb 14 ), or a panel of creatinine, cystatin C, BTP, and B2M (eGFRpanel 15 ) (Table S1 ). For eGFRcre and eGFRcomb, results are shown for the original (2009 and 2012, respectively) CKD‐EPI equations. Selected results for the race‐free (2021) CKD‐EPI equations 16 are presented in the Supplemental material.
Outcomes
The primary outcome was change in filtration marker concentration between treatment periods. Secondary outcomes were change in eGFR between treatment periods, eGFR accuracy relative to mGFR during each treatment period, and recommended dosing categories during each treatment period.
Statistics
Clinical characteristics are presented as median with interquartile range for continuous variables, or frequency with percent for categorical variables. Change in mGFR, filtration marker concentration, and eGFR between treatment periods (placebo vs. dapagliflozin) was evaluated by the Wilcoxon rank‐sum test. Change in eGFR vs. change in mGFR between treatment periods was evaluated by Pearson's correlation coefficient. A sensitivity analysis was performed to evaluate whether the order of randomization (placebo first vs. dapagliflozin first) had any impact on the results of these tests. The accuracy of each eGFR equation relative to mGFR was evaluated by bias (median value of [eGFR–mGFR]) and percent of eGFR values within ± 30% (P30) or ± 20% (P20) of mGFR. Confidence intervals for bias, P30, and P20 were generated by bootstrapping with 10,000 iterations. Accuracy was determined separately for each treatment period, as well as for the pooled data from both treatment periods. For all statistical tests, P < 0.05 was considered statistically significant. Statistical analysis and figure generation were performed in R version 4.3.0 (R Foundation for Statistical Computing, Vienna, Austria) using the ggplot2 and ggpubr packages.
Supplementary analysis
Agreement in recommended dosing categories for each eGFR equation relative to mGFR was evaluated by net reclassification and presented in the Supplemental material. For the calculation of dosing categories, all eGFR and mGFR values were converted from body surface area (BSA)‐indexed units (mL/min/1.73 m2) to non‐indexed units (mL/min) by multiplying by BSA/1.73 m2, where BSA was calculated using the DuBois & DuBois formula 17 based on weight and height measurements at the time of GFR measurement. Dosing categories were defined using common GFR cutoffs for renally excreted medications (≥ 90, 60–89, 45–59, 30–44, 15–29, or < 15 mL/min). Net reclassification was defined as the sum of differences in recommended dosing categories across all study participants when switching from mGFR to eGFR, where each successive category was considered one class below the previous. For example, if a participant was classified as ≥ 90 mL/min according to mGFR and 45–59 mL/min according to eGFR, then reclassification for that individual would be −2 (and net reclassification would be the sum of these reclassification values across all study participants).
RESULTS
Baseline characteristics
In total, 36 participants completed the DapKid study (Figure S1 ). Of these, one participant was missing a cystatin C measurement and, therefore, excluded from the analysis. Baseline clinical characteristics for the remaining 35 participants are given in Table 1 : median age was 64 years, median body mass index (BMI) was 31, and 3 participants (8.6%) were female. All study participants were White.
Table 1.
Baseline clinical characteristics for 35 adults with type 2 diabetes from the DapKid clinical trial
| Clinical characteristic | Median (IQR) or frequency (%) |
|---|---|
| Age (years) | 64.2 (58.4–70.0) |
| Female | 3 (8.6%) |
| Weighta (kg) | 99.3 (89.8–117.0) |
| Heighta (cm) | 178 (173–185) |
| Body mass indexa (kg/m2) | 30.9 (28.1–37.4) |
| Body surface area a , b (m2) | 2.18 (2.06–2.38) |
| Diabetes durationa (years) | 16 (13–18) |
| Hypertension | 29 (82.9%) |
| Hemoglobin A1c (mmol/mol) | 68.0 (63.0–77.5) |
| Urine albumin‐to‐creatinine ratio (mg/g) | 150.3 (91.4–337.5) |
IQR, interquartile range (Q1–Q3).
Value missing for 1 individual (i.e., n = 34).
Body surface area calculated using the Dubois & DuBois formula: 0.007184 × Weight0.425 × Height0.725.
Effect of dapagliflozin treatment
Measured GFR, filtration marker concentration, and eGFR at the end of each treatment period are given in Table 2 . Compared with placebo, dapagliflozin treatment was associated with a significant decrease in mGFR (median change −9 mL/min/1.73 m2, P < 0.001). There was not a significant change in concentration for any of the four filtration markers (Figure 1 ) or eGFR according to any combination of filtration markers (Figure 2 ). Change in eGFR for each eGFR equation vs. change in mGFR is shown in Figure 3 . Pearson's correlation coefficient (R) was between −0.1 and +0.1 (P > 0.7) for all eGFR equations. Switching to the race‐free (2021) CKD‐EPI equations for eGFRcre and eGFRcomb led to higher median eGFR values under both treatment periods but had a negligible effect on eGFR change between treatment periods (Table S2 ). Separating study participants based on the order of randomization did not affect the overall interpretation of results (data not shown).
Table 2.
Measured GFR, filtration marker concentration, and eGFR during placebo vs. dapagliflozin treatment
| Marker | Placebo median (IQR) | Dapagliflozin median (IQR) | Differencea median (IQR) | P‐value for differenceb |
|---|---|---|---|---|
| Measured GFR (mL/min/1.73 m2) | 82 (72 to 99) | 76 (57 to 94) | −9 (−20 to −5) | < 0.001 |
| Filtration marker concentration | ||||
| Creatinine (mg/dL) | 0.86 (0.74 to 1.02) | 0.84 (0.75 to 1.05) | +0.02 (−0.07 to +0.10) | 0.3 |
| Cystatin C (mg/mL) | 1.04 (0.89 to 1.30) | 1.10 (0.88 to 1.30) | +0.01 (−0.08 to +0.14) | 0.5 |
| BTP (mg/mL) | 0.57 (0.47 to 0.77) | 0.58 (0.45 to 0.77) | −0.01 (−0.10 to +0.14) | 0.8 |
| B2M (mg/mL) | 2.55 (1.94 to 2.86) | 2.30 (2.03 to 3.06) | −0.06 (−0.20 to +0.30) | 0.6 |
| Estimated GFR (mL/min/1.73 m2) | ||||
| eGFRcre | 88.4 (72.4 to 95.5) | 88.7 (71.1 to 95.8) | −2.3 (−5.7 to +4.5) | 0.3 |
| eGFRcys | 74.8 (55.2 to 90.1) | 69.1 (54.3 to 96.6) | −0.8 (−9.0 to +6.8) | 0.7 |
| eGFRcomb | 80.3 (67.9 to 99.3) | 76.9 (63.3 to 99.6) | +0.5 (−10.1 to +5.4) | 0.5 |
| eGFRpanel | 80.5 (68.5 to 96.1) | 80.7 (63.3 to 97.0) | −0.1 (−7.0 to +5.4) | 0.5 |
IQR, interquartile range (Q1–Q3); GFR, glomerular filtration rate.
Difference calculated as the value under dapagliflozin treatment minus the value under placebo.
P‐values determined by Wilcoxon rank‐sum test.
Figure 1.

Filtration marker concentration under placebo vs. dapagliflozin treatment. Points represent individual study participants, and lines connect identical study participants across treatment periods.
Figure 2.
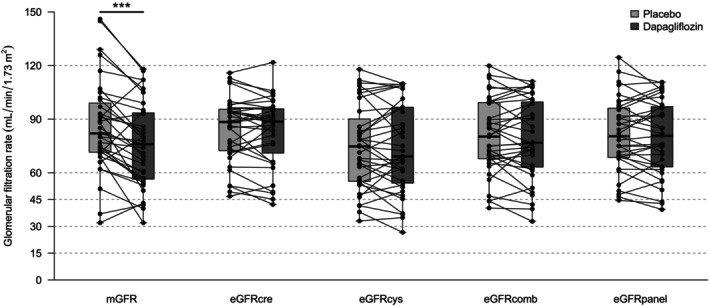
Measured and estimated glomerular filtration rate under placebo vs. dapagliflozin treatment. Points represent individual study participants, and lines connect identical study participants across treatment periods. mGFR, measured glomerular filtration rate; eGFR, estimated glomerular filtration rate. ***P < 0.001.
Figure 3.

Change in measured vs. estimated glomerular filtration rate between treatment periods. Change is calculated as the value under dapagliflozin treatment minus the value under placebo. Points represent individual study participants, and lines represent linear regression with corresponding Pearson's correlation coefficient (R) and P‐value. mGFR, measured glomerular filtration rate; eGFR, estimated glomerular filtration rate.
GFR in non‐indexed units
Weight, BMI, and BSA at the end of each treatment period are given in Table S3 . Compared with placebo, dapagliflozin treatment was associated with a median weight change of −1.6 kg, BMI change of −0.5 kg/m2, and BSA change of −0.01 m2. Measured GFR and eGFR (in non‐indexed units) at the end of the treatment period are given in Table S4 .
Accuracy of eGFR equations
The accuracy of each eGFR equation relative to mGFR during each treatment period is given in Table 3. Under placebo, all eGFR equations underestimated mGFR, with eGFRcre having the smallest (closest to 0) bias (−3 mL/min/1.73 m2) and eGFRpanel having the best (highest) P30 (94%) and P20 (74%). Dapagliflozin treatment was associated with a higher (more positive) bias for all eGFR equations, with eGFRcre having the largest (furthest from 0) bias (+9 mL/min/1.73 m2) and worst (lowest) P30 (80%) and P20 (71%). Pooling data from both treatment periods, eGFRcomb and eGFRpanel had the smallest overall bias (−2 and 0 mL/min/1.73 m2, respectively), highest P30 (90 and 91%, respectively), and highest P20 (73 and 79%, respectively). Switching to the race‐free (2021) CKD‐EPI equations for eGFRcre and eGFRcomb led to worse overall performance for eGFRcre but similar overall performance for eGFRcomb (Table S5 ).
Table 3.
Accuracy of eGFR equations relative to mGFR during placebo vs. dapagliflozin treatment
| Performance metric and eGFR equation | Placebo (n = 35) | Dapagliflozin (n = 35) | Pooled data (n = 70) |
|---|---|---|---|
| Biasa (95% CIc) | |||
| eGFRcre | −3 (−9 to +9) | +9 (+1 to +12) | +3 (−1 to +10) |
| eGFRcys | −12 (−21 to −6) | −3 (−7 to +1) | −7 (−11 to −2) |
| eGFRcomb | −4 (−13 to +1) | +4 (−3 to +8) | −2 (−4 to +4) |
| eGFRpanel | −5 (−11 to +1) | +3 (−1 to +9) | 0 (−3 to +3) |
| P30b (95% CIc) | |||
| eGFRcre | 89 (77 to 97) | 80 (66 to 91) | 84 (76 to 91) |
| eGFRcys | 83 (69 to 94) | 89 (77 to 97) | 86 (77 to 93) |
| eGFRcomb | 91 (80 to 100) | 89 (77 to 97) | 90 (83 to 96) |
| eGFRpanel | 94 (86 to 100) | 89 (77 to 97) | 91 (84 to 97) |
| P20b (95% CIc) | |||
| eGFRcre | 60 (43 to 77) | 71 (57 to 86) | 66 (54 to 77) |
| eGFRcys | 54 (37 to 71) | 83 (69 to 94) | 69 (57 to 79) |
| eGFRcomb | 69 (51 to 83) | 77 (63 to 91) | 73 (61 to 83) |
| eGFRpanel | 74 (60 to 89) | 83 (69 to 94) | 79 (69 to 87) |
CI, confidence interval; eGFR, estimated glomerular filtration rate; mGFR, measured glomerular filtration rate.
Bias is the median value of [eGFR–mGFR] in mL/min/1.73 m2.
P30 and P20 are the percent of eGFR values within ± 30% or ± 20%, respectively, of mGFR.
All 95% CI generated by bootstrapping with 10,000 iterations.
Agreement in dosing recommendations
Agreement in recommended dosing categories between mGFR and each eGFR equation is given in Table S6 . One participant was missing weight and height measurements and, therefore, excluded from this analysis. Under both treatment periods, eGFRcre had the largest positive net reclassification (+4 under placebo and +8 under dapagliflozin), whereas eGFRcys had the largest negative net reclassification (−9 under placebo and –2 under dapagliflozin). Pooling data from both treatment periods, eGFRcomb and eGFRpanel had the smallest (closest to 0) net reclassification (+2 and +4, respectively).
DISCUSSION
As expected, we found that 12 weeks of dapagliflozin 10 mg/day was associated with a significant decrease in mGFR (median change of −9 mL/min/1.73 m2) relative to placebo. The magnitude of mGFR decline is comparable to earlier studies investigating the effect of SGLT2 inhibitor therapy on kidney function in several different study settings. For example, Heerspink et al. 18 observed a decrease in mGFR of 8% relative to placebo following dapagliflozin 10 mg/day for 12 weeks in people with T2D. Similarly, Jurgens et al. 19 observed a decrease in mGFR of 8 mL/min relative to placebo following empagliflozin 25 mg/day for 13 weeks in people with T2D, and Jensen et al. 20 observed a decrease of 7.5 mL/min relative to placebo following empagliflozin 10 mg/day for 12 weeks in people with heart failure.
Despite the decrease in mGFR, we did not observe a corresponding change in any filtration markers or eGFR according to any equation. This finding was somewhat surprising but not unique to this study. In the study by Heerspink et al., 18 the authors report an initial decrease in eGFRcre after 2 weeks of dapagliflozin treatment that returned to baseline levels after 12 weeks of treatment (despite a sustained reduction in mGFR). A similar pattern was observed in people with CKD receiving dapagliflozin. 21
The question of how eGFR will change after initiation of SGLT inhibitor therapy is complicated by the fact that SGLT2 inhibitors may influence filtration marker concentration independently from their effect on GFR. For example, SGLT2 inhibitor use is associated with decreased intravascular volume. 19 , 20 , 22 This likely contributes to the cardiorenal benefits of SGLT2 inhibitors and may explain the initial increase in creatinine concentration (and drop in eGFRcre) observed by others, but it does not explain the subsequent return to baseline levels after 12 weeks of treatment. Increased tubular secretion of creatinine as fluid status equilibrates might account for some of this effect, 23 but cystatin C, BTP, and B2M do not bypass the glomerulus.
Another possible explanation for the return to baseline eGFR is that SGLT2 inhibitors affect endogenous filtration marker generation. In a recent meta‐analysis, Pan et al. 10 reported a significant reduction in both muscle and fat mass following initiation of SGLT2 inhibitors in people with T2D. Since creatinine generation depends on muscle tissue 24 and cystatin C generation may depend on adipose tissue, 25 , 26 reduced muscle and fat mass could lead to lower creatinine and cystatin C concentrations (and increased eGFR). Muscle and fat mass were not directly measured in this study, but it is plausible that muscle and fat account for at least some of the median 1.6 kg weight loss relative to placebo. The nonrenal factors affecting BTP and B2M are less well understood, but these markers may be susceptible to other systemic effects of SGLT2 inhibitors, such as reduced inflammation. 27 , 28
In summary, the combined and often counteracting effects of reduced filtration, hemodynamic changes, post‐glomerular kinetics, and changes to body composition make it difficult to predict how SGLT2 inhibitors will affect endogenous filtration markers (and therefore, eGFR based on these markers). Importantly, we observed no consistent trends when comparing change in eGFR and change in mGFR between treatment periods, suggesting that eGFR in general may not be a reliable indicator of mGFR in the setting of SGLT2 inhibitor use. This conclusion is supported by Kolwelter et al., 29 who observed high accuracy of eGFRcre relative to mGFR among people with T2D at baseline but a weak correlation (R = 0.286) between change in mGFR and change in eGFRcre following a pharmacological intervention that included empagliflozin.
Due to the unpredictable nature of eGFR following the initiation of SGLT2 inhibitors, it is important to consider which filtration marker(s) yield the most reliable kidney function estimates across both treatment periods. Under placebo, we found that all eGFR equations underestimated mGFR, which is consistent with earlier studies in people with T2D (not receiving an SGLT2 inhibitor). 30 , 31 Under dapagliflozin treatment, bias increased (became more positive) for all eGFR equations because mGFR decreased, but P30 was consistently below 90%. Pooling data from both treatment periods, eGFRcomb and eGFRpanel outperformed both eGFRcre and eGFRcys across all performance metrics, including a P30 above 90% and P20 above 70%.
The eGFRcomb and eGFRpanel equations also yielded the highest agreement in dosing recommendations relative to mGFR and the most balanced direction of disagreement across both treatment periods. This finding highlights the stability gained by combining multiple filtration markers, but the clinical relevance of this stability for the purpose of dose adjustments is unclear. For individual patients with a large and sudden eGFR decline after initiating SGLT2 inhibitor therapy, clinicians should be aware of frequently used medications that depend on renal elimination and have a narrow therapeutic index with potentially severe adverse effects – such medications include factor X inhibitors, gabapentinoids, digoxin, lithium, methotrexate, and acyclovir. Since cystatin C is relatively cheap and easy to measure on standard clinical laboratory platforms, clinicians should consider using eGFRcomb for routine use in people with T2D initiating SGLT2 inhibitor therapy. The relatively minor differences in performance and dosing recommendations between eGFRcomb and eGFRpanel likely do not justify the increased cost and complexity of measuring BTP and B2M.
The main strength of this study is its use of a crossover design, which enabled person‐specific matching between the intervention (dapagliflozin) and control (placebo). The collection of mGFR also allowed for the comparison of different eGFR equations to a reliable reference value. The study also has some notable limitations. First, the relatively small sample size was likely underpowered to detect clinically relevant changes in filtration marker concentration. The cohort also contained exclusively White participants and very few female participants (less than 10%). Larger and more diverse study cohorts are necessary to clarify the effect of SGLT2 inhibitors on cystatin C, BTP, and B2M, and the accuracy of eGFR equations based on these markers. Second, study outcomes were only measured at the end of each treatment period. Since study participants did not have histologically confirmed diabetic nephropathy, it is possible they experienced a transient (and reversible) hyperfiltration during the initial treatment period that was captured by placebo but masked by dapagliflozin. Separating study participants based on the order of randomization did not change the overall interpretation of results, but future studies in people with histologically confirmed diabetic nephropathy would be helpful. Third, the method for calculating mGFR in this study is less accurate at high values because it uses a one‐compartment model. Two‐ or three‐compartment models may be more appropriate for evaluating mGFR tracer pharmacokinetics. Finally, we used the original (2009 and 2012) CKD‐EPI equations for the calculation of eGFRcre and eGFRcomb, respectively, because these remain the clinical standard across Northern Europe. 32 Switching to the race‐free (2021) CKD‐EPI equations yielded substantially higher median eGFR, which is unsurprising for this non‐Black cohort given how variables are reweighted in the 2021 equations. However, switching between different forms of the same eGFR equation (e.g., 2009 CKD‐EPIcre and 2021 CKD‐EPIcre) did not impact eGFR change between treatment periods, which was the focus of this study.
In conclusion, no eGFR equation accurately predicted the change in mGFR following 12 weeks of dapagliflozin treatment. Clinicians should expect a short‐term decline in renal filtration for patients initiating SGLT2 inhibitor therapy and be aware of the drawbacks of eGFR for assessing this decline. Importantly, the eGFRcomb and eGFRpanel equations yielded the highest accuracy and agreement in dosing recommendations relative to mGFR across both treatment periods. In the absence of mGFR, clinicians should consider eGFRcomb for routine use in this patient population.
FUNDING
EI is personally supported by a postdoctoral fellowship from the Carlsberg Foundation (grant no. CF23‐1141). MBH is personally supported by a postdoctoral fellowship from the BRIDGE Translational Excellence Program (grant no. NNF20SA0064340). The funders had no role in the study design, data collection, or the decision to submit the study findings.
CONFLICTS OF INTEREST
The authors declared no competing interests for this work.
AUTHOR CONTRIBUTIONS
E.I., L.J.N., and M.B.H. wrote the manuscript; V.R.C., M.K.E., M.F., F.P., and P.R. designed the research; V.R.C., M.K.E., M.F., F.P., and P.R. performed the research; E.I., L.J.N., V.R.C., A.B.W., P.R., and M.B.H. analyzed the data. All authors have accepted responsibility for the content of this manuscript and approved its submission.
Supporting information
Data S1.
Contributor Information
Esben Iversen, Email: esben.iversen@regionh.dk.
Line Juel Nielsen, Email: morten.baltzer.houlind@regionh.dk.
DATA AVAILABILITY STATEMENT
De‐identified data can be made available upon reasonable request. Those submitting a request will be required to send a protocol, plan for statistical analysis, and data access agreement to ensure appropriate use of the study data.
References
- 1. Eberly, L.A. et al. Association of Race/ethnicity, gender, and socioeconomic status with sodium‐glucose cotransporter 2 inhibitor use among patients with diabetes in the US. JAMA Netw. Open 4, e216139 (2021). [DOI] [PMC free article] [PubMed] [Google Scholar]
- 2. Mahtta, D. et al. Utilization rates of SGLT2 inhibitors and GLP‐1 receptor agonists and their facility‐level variation among patients with atherosclerotic cardiovascular disease and type 2 diabetes: insights from the Department of Veterans Affairs. Diabetes Care 45, 372–380 (2022). [DOI] [PMC free article] [PubMed] [Google Scholar]
- 3. Aggarwal, R. , Lu, K. , Chiu, N. , Bakris, G.L. & Bhatt, D.L. U.S. Prevalence of individuals with diabetes and chronic kidney disease indicated for SGLT‐2 inhibitor therapy. J. Am. Coll. Cardiol. 76, 2907–2910 (2020). [DOI] [PubMed] [Google Scholar]
- 4. Fang, M. , Wang, D. , Coresh, J. & Selvin, E. Undiagnosed diabetes in U.S. adults: prevalence and trends. Diabetes Care 45, 1994–2002 (2022). [DOI] [PMC free article] [PubMed] [Google Scholar]
- 5. van Baar, M.J.B. , van Ruiten, C.C. , Muskiet, M.H.A. , van Bloemendaal, L. , IJzerman, R.G. & van Raalte, D.H. SGLT2 inhibitors in combination therapy: from mechanisms to clinical considerations in type 2 diabetes management. Diabetes Care 41, 1543–1556 (2018). [DOI] [PubMed] [Google Scholar]
- 6. Blonde, L. et al. American Association of Clinical Endocrinology Clinical Practice Guideline: developing a diabetes mellitus comprehensive care Plan‐2022 update. Endocr. Pract. 28, 923–1049 (2022). [DOI] [PMC free article] [PubMed] [Google Scholar]
- 7. Mende, C.W. Chronic kidney disease and SGLT2 inhibitors: a review of the evolving treatment landscape. Adv. Ther. 39, 148–164 (2022). [DOI] [PMC free article] [PubMed] [Google Scholar]
- 8. DeFronzo, R.A. , Reeves, W.B. & Awad, A.S. Pathophysiology of diabetic kidney disease: impact of SGLT2 inhibitors. Nat. Rev. Nephrol. 17, 319–334 (2021). [DOI] [PubMed] [Google Scholar]
- 9. Christiansen, C.F. et al. Metformin initiation and renal impairment: a cohort study in Denmark and the UK. BMJ Open 5, e008531 (2015). [DOI] [PMC free article] [PubMed] [Google Scholar]
- 10. Pan, R. , Zhang, Y. , Wang, R. , Xu, Y. , Ji, H. & Zhao, Y. Effect of SGLT‐2 inhibitors on body composition in patients with type 2 diabetes mellitus: a meta‐analysis of randomized controlled trials. PLoS One 17, e0279889 (2022). [DOI] [PMC free article] [PubMed] [Google Scholar]
- 11. Mende, C. & Katz, A. Cystatin C‐ and creatinine‐based estimates of glomerular filtration rate in dapagliflozin phase 3 clinical trials. Diabetes Ther 7, 139–151 (2016). [DOI] [PMC free article] [PubMed] [Google Scholar]
- 12. Eickhoff, M.K. et al. Effect of dapagliflozin on cardiac function in people with type 2 diabetes and albuminuria – a double blind randomized placebo‐controlled crossover trial. J. Diabetes Complicat. 34, 107590 (2020). [DOI] [PubMed] [Google Scholar]
- 13. Levey, A.S. et al. A new equation to estimate glomerular filtration rate. Ann. Intern. Med. 150, 604–612 (2009). [DOI] [PMC free article] [PubMed] [Google Scholar]
- 14. Inker, L.A. et al. Estimating glomerular filtration rate from serum creatinine and cystatin C. N. Engl. J. Med. 367, 20–29 (2012). [DOI] [PMC free article] [PubMed] [Google Scholar]
- 15. Inker, L.A. et al. A new panel‐estimated GFR, including β2‐microglobulin and β‐trace protein and not including race, developed in a diverse population. Am. J. Kidney Dis. 77, 673–683.e1 (2021). [DOI] [PMC free article] [PubMed] [Google Scholar]
- 16. Inker, L.A. et al. New creatinine‐ and cystatin C–based equations to estimate GFR without race. N. Engl. J. Med. 385, 1737–1749 (2021). [DOI] [PMC free article] [PubMed] [Google Scholar]
- 17. Du Bois, D. & Du Bois, E.F. A formula to estimate the approximate surface area if height and weight be known. 1916. Nutrition 5, 303–311 (1989) discussion 312–313. [PubMed] [Google Scholar]
- 18. Lambers Heerspink, H.J. , de Zeeuw, D. , Wie, L. , Leslie, B. & List, J. Dapagliflozin a glucose‐regulating drug with diuretic properties in subjects with type 2 diabetes. Diabetes Obes. Metab. 15, 853–862 (2013). [DOI] [PMC free article] [PubMed] [Google Scholar]
- 19. Jürgens, M. et al. The effects of empagliflozin on measured glomerular filtration rate and estimated extracellular and plasma volumes in patients with type 2 diabetes. Diabetes Obes. Metab. 25, 2888–2896 (2023). [DOI] [PubMed] [Google Scholar]
- 20. Jensen, J. et al. Effects of empagliflozin on estimated extracellular volume, estimated plasma volume, and measured glomerular filtration rate in patients with heart failure (empire HF renal): a prespecified substudy of a double‐blind, randomised, placebo‐controlled trial. Lancet Diabetes Endocrinol. 9, 106–116 (2021). [DOI] [PubMed] [Google Scholar]
- 21. Heerspink Hiddo, J.L. , Stefánsson, B.V. , Ricardo, C.‐R. et al. Dapagliflozin in patients with chronic kidney disease. N. Engl. J. Med. 383, 1436–1446 (2020). [DOI] [PubMed] [Google Scholar]
- 22. Mayne, K.J. et al. Effects of empagliflozin on fluid overload, weight, and blood pressure in CKD. J. Am. Soc. Nephrol. 35, 202–215 (2024). [DOI] [PMC free article] [PubMed] [Google Scholar]
- 23. Sjöström, P.A. , Odlind, B.G. & Wolgast, M. Extensive tubular secretion and reabsorption of creatinine in humans. Scand. J. Urol. Nephrol. 22, 129–131 (1988). [DOI] [PubMed] [Google Scholar]
- 24. Baxmann, A.C. , Ahmed, M.S. , Marques, N.C. et al. Influence of muscle mass and physical activity on serum and urinary creatinine and serum cystatin C. Clin. J. Am. Soc. Nephrol. 3, 348–354 (2008). [DOI] [PMC free article] [PubMed] [Google Scholar]
- 25. Schmid, C. , Ghirlanda, C. , Zwimpfer, C. , Tschopp, O. , Zuellig, R.A. & Niessen, M. Cystatin C in adipose tissue and stimulation of its production by growth hormone and triiodothyronine in 3T3‐L1 cells. Mol. Cell. Endocrinol. 482, 28–36 (2019). [DOI] [PubMed] [Google Scholar]
- 26. Naour, N. et al. Potential contribution of adipose tissue to elevated serum cystatin C in human obesity. Obesity 17, 2121–2126 (2009). [DOI] [PubMed] [Google Scholar]
- 27. Foster, M.C. et al. Non‐GFR determinants of low‐molecular‐weight serum protein filtration markers in the elderly: AGES‐kidney and MESA‐kidney. Am. J. Kidney Dis. 70, 406–414 (2017). [DOI] [PMC free article] [PubMed] [Google Scholar]
- 28. Heerspink, H.J.L. et al. Canagliflozin reduces inflammation and fibrosis biomarkers: a potential mechanism of action for beneficial effects of SGLT2 inhibitors in diabetic kidney disease. Diabetologia 62, 1154–1166 (2019). [DOI] [PMC free article] [PubMed] [Google Scholar]
- 29. Kolwelter, J. et al. Change of renal function after short‐term use of cardioprotective agents in patients with type 2 diabetes is not accurately assessed by the change of estimated glomerular filtration rate: an observational study. Diabetol. Metab. Syndr. 14, 102 (2022). [DOI] [PMC free article] [PubMed] [Google Scholar]
- 30. Luis‐Lima, S. & Porrini, E. An overview of errors and flaws of estimated GFR versus true GFR in patients with diabetes mellitus. Nephron 136, 287–291 (2016). [DOI] [PubMed] [Google Scholar]
- 31. Cheuiche, A.V. , Queiroz, M. , Azeredo‐da‐Silva, A.L.F. & Silveiro, S.P. Performance of cystatin C‐based equations for estimation of glomerular filtration rate in diabetes patients: a Prisma‐compliant systematic review and meta‐analysis. Sci. Rep. 9, 1418 (2019). [DOI] [PMC free article] [PubMed] [Google Scholar]
- 32. Delanaye, P. et al. The new, race‐free, chronic kidney disease epidemiology consortium (CKD‐EPI) equation to estimate glomerular filtration rate: is it applicable in Europe? A position statement by the European Federation of Clinical Chemistry and Laboratory Medicine (EFLM). Clin. Chem. Lab. Med. 24, 44–47 (2022). [DOI] [PubMed] [Google Scholar]
Associated Data
This section collects any data citations, data availability statements, or supplementary materials included in this article.
Supplementary Materials
Data S1.
Data Availability Statement
De‐identified data can be made available upon reasonable request. Those submitting a request will be required to send a protocol, plan for statistical analysis, and data access agreement to ensure appropriate use of the study data.