

Abstract
Sacituzumab govitecan (SG), a Trop‐2‐directed antibody‐drug conjugate, is approved for patients with metastatic triple‐negative breast cancer (mTNBC) who received ≥2 prior systemic therapies (≥1 in metastatic setting). Exposure–response (E‐R) relationships between SG exposure and efficacy and safety outcomes were characterized in 277 patients with mTNBC using data from the phase I/II IMMU‐132‐01 and phase III ASCENT (IMMU‐132‐05) studies. Evaluated endpoints included complete response (CR), objective response rate (ORR), progression‐free survival (PFS), overall survival (OS), and safety endpoints (individual first worst grade of select adverse events (AEs)). E‐R analyses were also conducted for time to first dose reduction or delay. Patients received SG at 8 or 10 mg/kg intravenously on days 1 and 8 of a 21‐day cycle. Average SG‐related serum exposure over the treatment duration (until the event) was consistently the most significant exposure metric correlated with efficacy and safety endpoints. Higher average concentration over the treatment duration for SG (CAVGSG) was the best predictor of CR and ORR. The model‐predicted proportions of patients with CR and ORR at 10 mg/kg were 4.26% and 32.6%, respectively. Higher CAVG for total antibody was the best predictor of OS and PFS. The model‐predicted probability of OS at 12 months at median lactate dehydrogenase (227 IU/L) was 53%. The probability of grade ≥1 evaluated AEs and the risk of dose reductions and delays significantly increased with increasing CAVGSG. The model‐predicted proportions of patients with any‐grade AEs were 35.9%, 67.4%, 64.7%, and 67.1% for vomiting, diarrhea, nausea, and neutropenia, respectively (10 mg/kg dose group). Neutropenia was the only evaluated AE for which CAVGSG was significantly associated with grade ≥3 events. The clinically meaningful efficacy and manageable safety achieved with SG 10 mg/kg on days 1 and 8 of every 21‐day cycle dosing regimen supports the appropriateness of this clinical dosage in patients with mTNBC.
Study Highlights.
WHAT IS THE CURRENT KNOWLEDGE ON THE TOPIC?
Sacituzumab govitecan (SG) is an anti‐Trop2 antibody‐drug conjugate approved for patients with metastatic triple‐negative breast cancer (mTNBC) after ≥2 prior chemotherapies (≥1 in metastatic setting).
WHAT QUESTION DID THIS STUDY ADDRESS?
This work characterized exposure–response relationships between SG, free SN‐38, and total antibody exposure and safety and efficacy outcomes in 277 patients with mTNBC.
WHAT DOES THIS STUDY ADD TO OUR KNOWLEDGE?
Average SG‐related serum exposures over treatment duration (CAVG) until the event were identified as the most significant exposure metric correlated with evaluated safety and efficacy outcomes. CAVG of SG was the best predictor of complete response and objective response rate, whereas CAVG of total antibody was the best predictor of overall survival and progression‐free survival.
HOW MIGHT THIS CHANGE CLINICAL PHARMACOLOGY OR TRANSLATIONAL SCIENCE?
The presented analyses demonstrate dependence of the efficacy and safety of SG on serum exposure. The clinically meaningful efficacy and manageable safety achieved with 10 mg/kg SG (days 1 and 8 per 21‐day cycle) monotherapy dosing supports the appropriateness of this regimen in the approved mTNBC indication.
Triple‐negative breast cancer (TNBC), one of the most aggressive forms of breast cancer, accounts for almost 15% of all invasive breast cancers. 1 It is characterized by the absence of both the estrogen and progesterone receptors as well as the human epidermal growth factor receptor (HER2) and is usually associated with poor prognosis. 2 Although there are several treatment options for other subtypes of breast cancer, sequential, single‐agent chemotherapy remains the gold standard for locally advanced or metastatic TNBC after first‐line therapy 3 , 4 ; however, standard chemotherapy is associated with low response rates as well as short progression‐free survival (PFS) among patients with TNBC, highlighting the urgent need for advances in treatment options for these patients.
Trophoblast cell surface antigen 2 (Trop‐2) has been identified as a key driver of tumor growth and metastasis that is overexpressed in many solid tumors, including breast cancer, and is associated with poor prognosis. 5 , 6 , 7 , 8 Sacituzumab govitecan (SG) is an antibody‐drug conjugate (ADC) composed of an anti‐Trop‐2 antibody coupled to SN‐38, a topoisomerase 1 inhibitor and the active metabolite of irinotecan, via a proprietary hydrolyzable linker. 9 As a result of this increased specificity for Trop‐2–expressing cells, SG delivers significantly greater amounts of SN‐38 to Trop‐2–expressing tumors, including adjacent cancer cells, than conventional irinotecan chemotherapy. This Trop‐2–specific therapy may thus reduce toxic effects in normal tissues, where expression of Trop‐2 is lower. 10 , 11 , 12 Due to the hydrolyzable linker and high drug‐to‐antibody ratio, SG can release SN‐38 both intracellularly and, subsequently, extracellularly in the tumor microenvironment, resulting in bystander killing of Trop‐2‐negative tumor cells.
SG is approved in multiple regions, including the United States, European Union, and Asia, for the treatment of patients with unresectable, locally advanced TNBC or metastatic TNBC (mTNBC) who have received two or more prior systemic therapies (at least one in the metastatic setting), in the United States and European Union for patients with pretreated hormone receptor–positive (HR+)/HER2‐negative (HER2–) advanced BC. 13 IMMU‐132‐01 (NCT01631552), a multicenter phase I/II dose‐escalation and dose‐expansion study, initially evaluated the safety and efficacy of SG in patients with non–Trop‐2 selected advanced epithelial cancers, including mTNBC, who had received at least one prior treatment. 14 SG was administered intravenously and escalating doses (8, 10, 12, and 18 mg/kg) of SG were studied in phase I of the IMMU‐132‐01 study, with the maximum tolerated dose (MTD) determined to be 12 mg/kg. 14 , 15 In the analysis of IMMU‐132‐01 in 108 patients with refractory mTNBC, 16 SG demonstrated an objective response rate (ORR), per investigator assessment, of 33.3%. Median PFS was 5.5 months, and median overall survival (OS) was 13.0 months (95% confidence interval (CI) 11.2–13.7). In ASCENT (IMMU‐132‐05, NCT02574455), a pivotal phase III study in which 529 patients with mTNBC were randomized to SG (10 mg/kg dose) or treatment of physician's choice (eribulin, vinorelbine, capecitabine, or gemcitabine), 17 SG demonstrated significantly higher median PFS (5.6 vs. 1.7 months; P < 0.001) and median OS (12.1 vs. 6.7 months; P < 0.0001) vs. single‐agent chemotherapy in the primary analysis. ORR also favored SG (35% vs. 5%).
Using data from the IMMU‐132‐01 and ASCENT studies, population pharmacokinetic (PopPK) models characterizing the pharmacokinetics of SG, free SN‐38, and total antibody (tAB) were developed. 18 Pharmacokinetics of the three analytes were each described by a two‐compartment model with estimated body weight–based scaling exponents for clearance and volume. Exposure metrics for the three analytes for each patient, based on the available dosing information and individual pharmacokinetic parameter values, were estimated using the respective PopPK models and were used for exposure–response (E‐R) analyses. The present analyses evaluate the relationship between SG‐related exposures and efficacy and safety outcomes in patients with mTNBC from the IMMU‐132‐01 and ASCENT studies. 19
METHODS
Study ethics
The analyzed studies were conducted in accordance with the guidance issued by the International Council for Harmonisation Good Clinical Practice and the Declaration of Helsinki. Written consent was provided by all patients at the start of each study and all clinical trial protocols were approved by the institutional review boards or independent ethics committees at the respective trial sites.
Study design and dataset
Detailed designs and outcomes of IMMU‐132‐01 and ASCENT have been reported. 17 , 20 The E‐R analysis dataset included patients with mTNBC from IMMU‐132‐01 and all patients from ASCENT who were evaluated in the PopPK analyses to estimate the exposures, and had at least one reported efficacy and/or safety outcome. 18 Data cutoff dates were March 1, 2019, for IMMU‐132‐01 and March 11, 2020, for ASCENT. Details of bioanalytical methods used were described previously. 18
Definition of SG‐related exposure metrics
Twelve exposure metrics were evaluated as predictors of complete response (CR) and ORR, including the average concentration (CAVG) between first dose and the time of event (accounting for dose reductions and delays), maximum concentration (C max), area under the concentration‐time curve (AUC) in the first treatment cycle, and total exposure from the first dose to the time of response (cumulative AUC) for each of the three analytes (SG: intact ADC; free SN‐38: SN‐38 released from SG; and tAB: hRS7 conjugated or unconjugated to SN‐38). Nine of these exposure metrics (excluding cumulative AUCs) were evaluated for OS, PFS, time to first dose reduction, time to first dose delay, and in the E‐R analyses of SG safety.
CAVG of SG, free SN‐38, and tAB for the prediction of SG efficacy and safety was defined by the following equation, where C SG, C fSN38, and C tAB are the predicted concentrations of SG, free SN‐38, and tAB, using the respective population pharmacokinetic models, and t event is the time to the efficacy or safety observation as defined in Table S1 , 18 :
| (1) |
In Eq. 1, CAVGSG indicates SG average concentration; CAVGfSN38, free SN‐38 average concentration; CAVGtAB, total antibody average concentration; and t event, time to the efficacy or safety observation.
Exposure–response analyses
The E‐R analyses relating the exposure of SG, free SN‐38, or tAB to efficacy outcomes (CR, ORR, PFS, and OS) as well as safety outcomes (adverse events (AEs) related to vomiting, diarrhea, nausea, and neutropenia) and time to first dose reduction and time to first dose delay were conducted. The definitions of efficacy and safety variables used for E‐R analyses are provided in Table S2 . The impact of exposure on efficacy outcomes was evaluated using logistic regression models (CR and ORR) or Cox proportional‐hazards (Cox PH) time‐to‐event (TTE) models for OS and PFS. The proportional hazards assumption was tested for the final Cox PH models of OS and PFS and the models were qualified based on diagnostic checks, including Schoenfeld and Martingale residuals. Additional details are provided in Supplemental Section 1 .
Efficacy endpoints based on blinded independent central review (BICR) were used for the E‐R analyses. However, BICR for PFS was missing for most patients with PK data from IMMU‐132‐01 and, hence, analysis of PFS was based on BICR for ASCENT and investigator assessment for IMMU‐132‐01.
The impact of exposure on the probability of developing an AE was evaluated using logistic regression models. Cox PH models similar to those used in the analysis of PFS and OS were used for modeling time to first dose reduction and time to first dose delay. Dose interruptions or dose reductions not related to AEs were not considered in the E‐R analyses. Additional details are provided in Supplement Section 1 .
Covariate selection
The effect of clinically relevant covariates, including baseline body weight, age, race, region, lactate dehydrogenase (LDH; efficacy only), prior treatment, number of prior lines of therapy, Eastern Cooperative Oncology Group performance status, baseline Trop‐2 level (efficacy only), baseline neutrophil count (neutropenia only), UGT1A1 genotype, UGT1A1 inhibitor/inducer treatment, granulocyte colony‐stimulating factor (neutropenia only), and study (safety only) was evaluated. UGT1A1 is responsible for the metabolism of SN‐38 through glucuronidation. Patients with specific variant alleles of UGT1A1 such as UGT1A1 *28/*28 have reduced enzyme activity, resulting in an increased risk of neutropenia upon treatment with irinotecan (the prodrug of SN‐38). 21 , 22 While the impact of UGT1A1 genotype on SG (and free SN‐38) exposure was previously evaluated in the population pharmacokinetic analyses, this covariate was tested again in the present exposure‐safety analyses to capture any impact on safety that may have not been accounted for through impact on exposure. 18 Trop‐2 expression levels were available as a categorical covariate (level of staining) in IMMU‐132‐01 and a continuous covariate (H score) in ASCENT. 18 , 23 Only the effect of Trop‐2 levels represented by a continuous covariate was evaluated in the E‐R analyses. First, the most statistically significant exposure metric among all exposure metrics (i.e., that best described the data based on the likelihood‐ratio test vs. null model) was retained in the respective base model. Then, a univariate analysis was performed for each aforementioned covariate. Only covariates that satisfied the pre‐set criteria of significance level α = 0.01 were included in the multivariate stepwise covariate modeling involving forward addition (significance level α = 0.01) and backward elimination (significance level α = 0.001) of covariates to obtain the final model. Covariate effects were only evaluated in models in which exposure was statistically significant (significance level α = 0.05).
Evaluation and application of final E‐R models
The developed logistic regression models were evaluated graphically by plots showing the model‐predicted probability of response/AE compared with the observed data stratified by exposure quartiles and other covariates. Kaplan–Meier (KM) plots for the TTE variables were generated. Odds ratios associated with 95% CI were reported for exposures and any covariates included in the final E‐R models.
Model‐based simulations
Logistic regression models were qualified with simulation‐based diagnostic plots. The observed proportions of patients with CR, ORR, or AEs at reported grades were compared with the corresponding model‐predicted proportion of patients with efficacy responses or AEs (and associated 95% CI) based on 1,000 simulated replicates of the dataset. For Cox PH models, the probability of the event at 12 months was computed. For statistically significant continuous covariates included in the final models, predictions were performed for the lower, median, and upper quartiles, whereas for significant categorical covariates, predictions for each of the different categories of the covariate were generated.
Software
E‐R analyses and simulations were performed using R (Versions 4.0.3 and 4.1.1). Data management was performed using the Statistical Analysis System (SAS®, Version 9.4, SAS‐Institute, Cary, NC, USA).
RESULTS
Baseline characteristics
Data from 277 patients with mTNBC were used in the E‐R analyses of all efficacy, safety, and dose reduction/dose delays endpoints except PFS, which was missing for two patients from ASCENT; hence, data from 275 patients were used for PFS analysis. Of the 277 patients, 24 were from IMMU‐132‐01 (starting dose 8 mg/kg for 16 patients, 10 mg/kg for five patients, and 12 mg/kg for three patients) and 253 were from ASCENT (starting dose 8 mg/kg for four patients and 10 mg/kg for 249 patients). Key clinical covariates including demographics and disease characteristics are summarized in Table S3 . The median age of patients included in the E‐R dataset was 54 years (range, 27–82), and median body weight was 66.7 kg (range, 37.2–132). The majority of patients were female (99.3%), white (80.5%), and from North America (67.9%). Since a very small number of patients were co‐administered UGT1A1 inhibitors (n = 6) or inducers (n = 1), this covariate was not included in the covariate evaluation.
Exposure–efficacy analyses
Efficacy outcomes for CR, ORR, PFS, and OS observed in the analysis population are summarized in Table S4 .
E‐R analyses for CR and ORR showed that, of the 12 exposure metrics assessed, CAVGSG was the most statistically significant metric (P < 0.001) correlated with both endpoints (Tables S5 and S6 ) such that higher values of CAVGSG were significantly associated with an increased probability of CR and objective response. After the inclusion of CAVGSG in the model for CR and ORR, none of the evaluated covariates were found to be significant. Based on the analyses, the model‐predicted proportions of patients with CR and ORR at 10 mg/kg dose were 4.26% (95% CI 1.94–6.59) and 32.6% (95% CI 27.5–37.2), respectively.
Table 1 shows the observed vs. final model‐predicted proportion of patients with CR and objective response. The observed proportion and model‐predicted probability of CR and objective response vs. CAVGSG is presented in Figure 1 a,b , respectively. Parameter estimates for the final CR and ORR models are presented in Table S7 . The models clearly confirmed the observed increase in the probability of CR and objective response with an increase in SG exposure.
Table 1.
Observed vs. final model‐predicted proportion of patients with efficacy response by endpoint for patients with 8 and 10 mg/kg starting dose
| Endpoint | Observed proportion (number) of patients who achieved efficacy response with starting dose of 10 mg/kg (n = 258) | Observed proportion (number) of patients who achieved efficacy response with starting dose of 8 mg/kg (n = 16) | Model‐predicted proportion of patients with CR/ORR (95% CI) with starting dose of 10 mg/kg (n = 258) | Model‐predicted proportion of patients with CR/ORR (95% CI) with starting dose of 8 mg/kg (n = 16) |
|---|---|---|---|---|
| CR | 0.0426 (11) | 0 (0) | 0.0426 (0.0194–0.0659) | 0 (0–0.0625) |
| ORR | 0.326 (84) | 0.125 (2) | 0.326 (0.275–0.372) | 0.125 (0–0.250) |
CI, confidence interval; CR, complete response; OR, objective response.
Figure 1.
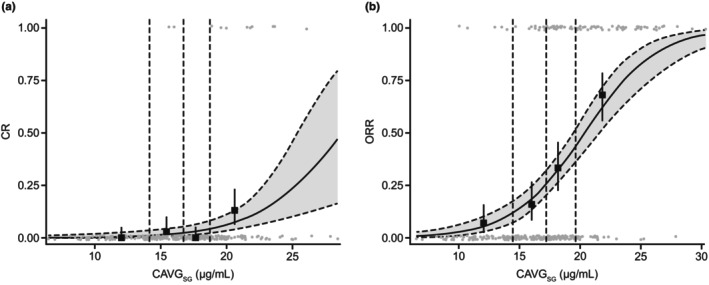
Observed proportions and model‐predicted probability of response by CAVGSG. (a) CR and (b) ORR. Gray circles indicate individual patient data. Closed squares with error bars show observed proportion of patients with efficacy response (95% CI) by exposure quartiles, with dashed vertical lines showing boundaries of exposure quartiles. Solid (dashed and gray area) curves show model‐predicted probability of response event. CAVGSG, sacituzumab govitecan average concentration; CI, confidence interval; CR, complete response; ORR, objective response rate. Mean CAVGSG in the 8 and 10 mg/kg groups for the CR endpoint was 12.6 and 16.8 μg/mL, respectively, and for the ORR endpoint was 12.9 and 17.5 μg/mL, respectively.
Of the nine exposure metrics tested for PFS and OS, CAVGtAB was found to be the most statistically significant (P < 0.001) such that higher values of CAVGtAB were significantly associated with longer PFS and OS (Tables S8 and S9 ). KM plots stratified by quartiles of CAVGtAB for PFS and OS are shown in Figure 2a,b , respectively. Median survival times by quartiles of exposure for PFS and OS are presented in Table 2 . Prior treatment was identified as a significant covariate for PFS (P < 0.001) such that prior treatments with platinum‐based chemotherapy, checkpoint inhibitors (CPI), or platinum‐based chemotherapy and CPI were associated with a higher risk of PFS than prior treatment with “Others.” Parameter estimates for the final PFS and OS models are presented in Table S10 . Model‐predicted probability of PFS at 12 months based on CAVGtAB and prior treatment are presented in Table S11 . For OS, after the inclusion of CAVGtAB, LDH was identified as a significant covariate (P < 0.001), with higher values of LDH being significantly associated with shorter OS. Model‐predicted probability of OS at 12 months based on CAVGtAB and LDH quartile are presented in Table S12 . These results demonstrated that the OS probability for the 10 mg/kg SG starting dose group is higher than for the 8 mg/kg SG starting dose for a fixed LDH value. Similarly, the PFS probability for 10 mg/kg is higher than that for 8 mg/kg for a given prior treatment category.
Figure 2.

Survival outcomes stratified by CAVGtAB. (a) PFS and (b) OS. Vertical dashed lines indicate median survival time (survival probability 0.5) associated with each exposure quartile. CAVGtAB, average total antibody concentration; CI, confidence interval; OS, overall survival; PFS, progression‐free survival. Mean CAVGtAB in the 8 and 10 mg/kg groups for the PFS endpoint was 122 and 152 μg/mL, respectively, and for the OS endpoint was 125 and 148 μg/mL, respectively.
Table 2.
Median survival times by quartiles of exposure for PFS and OS
| Endpoint | Stratum: CAVGtAB median (range) (μg/mL) | Median survival time (95% CI) (months) |
|---|---|---|
| PFS | First quartile: 95.1 (50.9–112) | 2.79 (1.87–3.35) |
| Second quartile: 130 (112–142) | 4.01 (2.76–5.68) | |
| Third quartile: 158 (143–174) | 5.55 (4.24–6.73) | |
| Fourth quartile: 205 (175–450) | 7.91 (6.90–10.4) | |
| OS | First quartile: 88.7 (50.6–107) | 6.57 (5.12–9.03) |
| Second quartile: 125 (109–139) | 10.8 (9.00–14.5) | |
| Third quartile: 153 (140–173) | 13.3 (10.9–15.9) | |
| Fourth quartile: 204 (174–451) | 19.7 (17.6–NA) |
CAVGtAB, total antibody average concentration; CI, confidence interval; NA, not available; OS, overall survival; PFS, progression‐free survival.
Exposure–safety analysis
The proportion of patients in the analysis population who experienced select AEs categorized as any grade (grade ≥1), grade ≥3, and grade 4, as well as dose reductions and delays, are summarized in Tables S13 and S14 , respectively. Among the four AEs, the percentage of patients with any grade AEs was approximately 35% for vomiting, 65% for diarrhea, 64% for nausea, and 66% for neutropenia. Grade 3 AEs were relatively common for neutropenia (54%) and diarrhea (11%).
E‐R analyses for safety showed that while each of the nine evaluated exposure metrics had a statistically significant relationship (P < 0.001) with the probability of any grade AEs of vomiting, diarrhea, nausea, and neutropenia, CAVGSG was identified as the most significant exposure metric (P < 0.001 across all AE types with improvement in log‐likelihood ratio (2LL) ranging from 272 to 651 for one degree of freedom) in all cases (Table S15 ). It is noteworthy that SG C max was also statistically significantly correlated with these safety endpoints, but with higher P‐values than CAVGSG (P < 0.001 across all AE types with improvement in 2LL ranging from 154 to 446). Nonproportional odds models estimating grade‐specific E‐R relationships were found to be statistically better than corresponding proportional odds models in describing the grades of the different AE types. Higher values of CAVGSG were significantly associated (P < 0.001) with an increased probability of any grade of vomiting, diarrhea, nausea, and neutropenia. Neutropenia was the only AE where the effect of exposure (CAVGSG) on the probability of ≥ grade 3 AE was statistically significant. There was no significant association detected between CAVGSG and the risk of grade 4 AEs for any of the select AEs evaluated. After the inclusion of CAVGSG, none of the evaluated covariates met the selection criteria to be included in the final models for all AEs. The observed proportion and final model‐predicted probability are shown for any grade AE of diarrhea (Figure 3 a ) and neutropenia (Figure 3 b ), and for ≥ grade 3 neutropenia (Figure 3 c ). The models developed were used to estimate the odds ratio and proportions of patients experiencing selected AEs at the 8 and 10 mg/kg SG dose levels (Table 3 ).
Figure 3.

Observed proportion and model‐predicted probability of any‐grade AE of diarrhea and neutropenia and for grade ≥3 neutropenia. (a) Grade 1 or worse diarrhea AE, (b) grade 1 or worse neutropenia AE, and (c) grade 3 or worse neutropenia AE are shown. Gray circles indicate data from individual patients. Closed squares (error bars) show the observed proportion of patients with the AE (95% CI) by exposure quartile. Dashed vertical lines show the boundaries of the exposure quartiles. Solid (dashed and gray area) curves show the model‐predicted probability of the AE (95% CI). Mean CAVGSG in the 8 and 10 mg/kg groups for diarrhea was 19.6 and 29.7 μg/mL, respectively, and neutropenia was 15.9 and 22.1 μg/mL, respectively. AE, adverse event; CAVGSG, sacituzumab govitecan average concentration; CI, confidence interval.
Table 3.
Estimated odds ratios and model‐predicted proportions of patients with AE outcomes
| Safety endpoint | Odds ratio (95% CI) for a 1 μg/mL increase in CAVGSG | Predicted proportion (95% CI) at 8 mg/kg | Predicted proportion (95% CI) at 10 mg/kg |
|---|---|---|---|
| Vomiting | |||
| Grade ≥1a | 1.29 (1.18–1.39) | 0.250 (0.125–0.438) | 0.359 (0.314–0.403) |
| Grade ≥3 | 1.00 (0.978–1.03) | 0 (0–0.125) | 0.0194 (0.00388–0.0349) |
| Diarrhea | |||
| Grade ≥1a | 1.45 (1.30–1.63) | 0.375 (0.250–0.500) | 0.674 (0.632–0.713) |
| Grade ≥3 | 1.01 (0.991–1.02) | 0.0625 (0–0.250) | 0.109 (0.0736–0.147) |
| Nausea | |||
| Grade ≥1a | 1.55 (1.36–1.80) | 0.625 (0.500–0.688) | 0.647 (0.612–0.682) |
| Grade ≥3 | 1.00 (0.985–1.02) | 0 (0–0.125) | 0.0271 (0.0116–0.0504) |
| Neutropenia | |||
| Grade ≥1a | 1.37 (1.26–1.50) | 0.375 (0.250–0.563) | 0.671 (0.620–0.717) |
| Grade ≥3a | 1.09 (1.05–1.14) | 0.438 (0.188–0.625) | 0.543 (0.488–0.605) |
| Grade 4 | 1.03 (0.988–1.07) | 0.125 (0–0.375) | 0.186 (0.140–0.233) |
AE, adverse event; CAVGSG, sacituzumab govitecan average concentration; CI, confidence interval.
Statistically significant relationship with CAVGSG.
CAVGSG was also the most significant exposure metric (P < 0.001) correlating with time to first dose reduction and time to first dose delay such that higher values of CAVGSG were associated with an increased risk of dose reductions and delays. None of the evaluated covariates were found to have a statistically significant impact on the time to first dose reduction after accounting for the effect of CAVGSG. KM plots for time to first dose reduction stratified by quartiles of CAVGSG are shown in Figure S1 . Body weight was identified to have a statistically significant (P < 0.001) impact on the probability of dose delay where patients with greater body weight were estimated to have a lower risk of dose delays than patients with lower body weight. While body weight was included as a covariate in the final model of dose delays, this effect could not be directly confirmed by analysis of KM plots stratified by body weight quartiles as shown in Figure S2 . The models developed were used to estimate the probabilities of patients experiencing dose reductions and dose delays at the 8 mg/kg and 10 mg/kg SG dose levels (Table 4 ). The results show that the probability of continuing without dose reduction or dose delay is lower for the 10 mg/kg compared with the 8 mg/kg dose group.
Table 4.
Model‐predicted probability of dose reduction and dose delay events over 12 months based on CAVGSG
| Safety endpoint | Probability at mean 8 mg/kg CAVGSG (95% CI), (n = 16) | Probability at mean 10 mg/kg CAVGSG (95% CI), (n = 258) |
|---|---|---|
| Dose reductions | 0.0674 (0.0356–0.0993) | 0.212 (0.148–0.276) |
| Dose delaysa | 0.512 (0.430–0.594) | 0.886 (0.831–0.941) |
CAVGSG, sacituzumab govitecan average concentration; CI, confidence intervals.
Based on median body weight (66.7 kg).
Continuous Trop‐2 expression level was evaluated as a covariate in the E‐R analyses, even if values were missing in 115 of the 277 patients (41.5%). With this limitation, Trop‐2 expression was not found to be a statistically significant predictor of any efficacy endpoints.
DISCUSSION
This report represents the first comprehensive evaluation of the relationship between SG's serum exposure and its efficacy and safety in patients with mTNBC based on the combined data from Study IMMU‐132‐01 and ASCENT. Clinical efficacy was evaluated in terms of CR, ORR, OS, and PFS, while safety was evaluated based on the most commonly reported AEs of vomiting, diarrhea, nausea, and neutropenia. The time to first dose reduction and the time to first dose delay were analyzed as indicators of the tolerability of SG.
Efficacy
CAVGSG was identified as the most statistically significant predictor of CR and ORR. Within the evaluated exposure range associated with the starting SG doses of 8 and 10 mg/kg, higher values of CAVGSG were associated with an increase in the probability of CR and objective response. Once exposure was included in the CR or ORR models, no additional covariates were found to be statistically significant and, as such, the final models of CR and ORR included only the effect of CAVGSG. CAVGtAB was the most statistically significant exposure metric correlated with OS and PFS such that increasing CAVGtAB resulted in increased efficacy as demonstrated by reduction of the hazard of both death and disease progression/death. Higher values of CAVGtAB were associated with a statistically significant lower risk of death and disease progression. Higher levels of LDH were associated with an increased risk of death. Elevated LDH levels at baseline are known to be associated with worse outcomes across multiple solid tumors, including BC. 24 , 25 The risk of disease progression was predicted to be higher for patients previously treated with CPI and platinum‐based chemotherapy, followed by previous treatment with platinum‐based chemotherapy and previous treatment with CPI. The risk of disease progression was lowest for patients in the “Other” group of previous treatments.
Safety
The safety of SG assessed by the individual worst AE grade of neutropenia, vomiting, diarrhea, and nausea was analyzed using ordered categorical logistic regression models. Patients reported up to grade 4 vomiting, nausea, and neutropenia, and up to grade 3 diarrhea.
Like CR and ORR, CAVGSG was identified as the most statistically significant exposure metric correlated with the four AEs. The probability of grade 1 or worse AEs of vomiting, diarrhea, nausea, and neutropenia was found to significantly increase with increasing CAVGSG. Neutropenia was the only AE for which the effect of exposure was statistically significant on the probability of grade 3 or worse AEs. There was no statistically significant association detected between exposure and the probability of grade 4 AEs. No additional covariates were found to be statistically significant in any of the AE models.
An increase in SG exposure was associated with a statistically significant increase in the risk of dose reductions and dose delays. After accounting for the exposure effect in the model of dose delay, heavier patients were found to have a statistically significant reduction in risk of dose delays, although it should be noted that the effect of body weight on dose delays was not clearly evident from the KM curves stratified by body weight. As such, cautious interpretation and further investigation of this effect is warranted.
Dose selection
The 10 mg/kg on days 1 and 8 of every‐21‐day–cycle dose regimen of SG was established based on the phase I and phase II portions of Study IMMU‐132‐01. 15 In the dose‐escalation portion of this study, the 12 mg/kg dose of SG on days 1 and 8 of every 21‐day cycle was found to be the MTD. However, the 12 mg/kg dose level was associated with frequent dose reductions and dose delays with treatment over several cycles. Subsequently, the phase II portion of Study IMMU‐132‐01 compared the efficacy and safety of two lower dose levels of SG, 8 and 10 mg/kg, in two expansion cohorts across several tumor types, including mTNBC. The 10 mg/kg dose level showed superior ORR across tumor types. While the tolerability profile of the 10 mg/kg dose level was worse than that of the 8 mg/kg dose level, the safety was manageable, and the superior efficacy profile of the 10 mg/kg dose level justified advancing this dose level to subsequent monotherapy clinical trials to maximize the efficacy benefit for patients. 15 The 12 mg/kg MTD was not selected as the recommended phase II dose because multi‐cycle safety and tolerability and ability to manage the safety profile with prolonged treatment were considered to be not favorable. While the dose‐finding phase II clinical comparison between the 8 and 10 mg/kg dose levels was not a randomized comparison, the clear separation between the two dose levels in ORR favored advancing the 10 mg/kg dose level to subsequent clinical testing in mTNBC.
Overall, the presented analyses support the approved clinical dose of SG in mTNBC, and they show dependence of the efficacy of SG on its serum exposure. The 10 mg/kg on days 1 and 8 every‐21‐day–cycle regimen did not achieve the plateau of efficacy among the exposure quartiles associated with this dose (as assessed by CR, ORR, OS, and PFS). The E‐R analyses also demonstrate the superiority of the efficacy of the 10 mg/kg dose level compared with the 8 mg/kg dose level. Given that dependence on the exposure of SG was also observed for all evaluated safety endpoints, the exposures associated with the 10 mg/kg SG dose regimen achieve an acceptable balance between efficacy and safety in this serious disease and late line of therapy.
Advancing SG to earlier lines of therapy may involve potential combinations with other therapeutic agents. The toxicity profile of the potential combination partners and presence of overlapping toxicities will need to be considered in combination trials. Alternative dosing schedules and appropriate use of G‐CSF may also be considered for managing toxicity, to offer clinicians flexibility, and to potentially harmonize dosing with future combination partners. 26
Strengths of the presented analyses include consideration of all relevant analytes (SG, tAB, and SN‐38) and exposure metrics, and the most clinically relevant efficacy and safety outcomes. Free SN‐38 (the payload) is theoretically the analyte driving the safety of SG. However, the low exposure levels and high variability of this analyte limited the ability to characterize a robust correlation to the AEs in the E‐R analyses.
Limitations of the current analyses include the relatively small number of patients receiving the lower 8 mg/kg SG dose (n = 16), as the majority of patients received 10 mg/kg SG dose. However, dose reductions and dose delays in some patients increased the spread of the exposure and enabled robust characterization of the E‐R relationships in the relevant clinical exposure range. All evaluated data in the present analyses come from the same days 1 and 8 of every 21‐day–cycle dosing schedule. As such, the different exposure metrics for each analyte are strongly correlated and the spread afforded in the dataset originates from the inter‐patient variability in these correlations and the impact of dose reductions and dose delays on the correlations of the exposure metrics. Lack of consistent availability of Trop‐2 expression levels across both studies limits the assessment of impact of Trop‐2 expression on evaluated endpoints and additional analyses of impact of Trop‐2 on efficacy from future trials are warranted. Free SN‐38 is metabolized via the UGT1A1 enzyme. 22 UGT1A1 genotype was evaluated as a covariate in the PopPK analyses 18 and in the current E‐R analyses. The UGT1A1 genotype was not detected as a statistically significant covariate impacting the pharmacokinetics, efficacy, or safety. Additional analyses of the impact of UGT1A1 genotype on the exposure of free SN‐38 from SG as well as the safety of SG are warranted using data from ongoing clinical trials.
FUNDING
This study was sponsored by Gilead Sciences, Inc.
CONFLICT OF INTEREST
Abhishek G. Sathe is an employee of and holds stocks in Gilead Sciences, Inc. Paul M. Diderichsen is an employee of and holds stocks in Certara and received support for the current manuscript and consulting fees from Gilead Sciences, Inc. Floris Fauchet is an employee of and holds stocks in Certara and received support for the current manuscript and consulting fees from Gilead Sciences, Inc. See Phan is an employee of and holds stocks in Gilead Sciences, Inc. Sandhya Girish is an employee of and holds stocks in Gilead Sciences, Inc. Ahmed A. Othman reports employment with Gilead Sciences, Inc., at the time of this research and holds stocks in Gilead Sciences, Inc.
AUTHOR CONTRIBUTIONS
A.G.S. and A.A.O. wrote the manuscript. A.G.S., A.A.O., and P.M.D. designed the research. A.G.S., A.A.O., P.M.D., and F.F. performed the research. All authors analyzed the data.
ETHICS APPROVAL/CONSENT TO PARTICIPATE
The samples used were obtained from two clinical trials, IMMU‐132‐01 and ASCENT. These clinical trial study protocols were approved by the institutional review boards at the participating study sites, conducted in compliance with the ethical principles originating in the Declaration of Helsinki, and conducted according to the International Council for Harmonisation Good Clinical Practice guidelines.
Supporting information
Data S1.
ACKNOWLEDGMENTS
We thank Indrajeet Singh, Pratap Singh, Ana Ruiz, John Maringwa, and Philippe Pierrillas for contributions to the presented analyses. We also thank the study participants and their caregivers for their participation and commitment to clinical research. We also thank the clinical study investigators and study teams. Editorial assistance was provided by Ben Labbe, PhD, CMPP, from Parexel and funded by Gilead Sciences, Inc.
DATA AVAILABILITY STATEMENT
Gilead Sciences, Inc. shares anonymized individual patient data upon request or as required by law or regulation with qualified external researchers based on submitted curriculum vitae and reflecting nonconflict of interest. The request proposal must also include a statistician. Approval of such requests is at Gilead Sciences, Inc.'s discretion and is dependent on the nature of the request, the merit of the research proposed, the availability of the data, and the intended use of the data. Data requests should be sent to datarequest@gilead.com.
References
- 1. DeSantis, C.E. , Fedewa, S.A. , Goding Sauer, A. , Kramer, J.L. , Smith, R.A. & Jemal, A. Breast cancer statistics, 2015: convergence of incidence rates between black and white women. CA Cancer J. Clin. 66, 31–42 (2016). [DOI] [PubMed] [Google Scholar]
- 2. Plasilova, M.L. , Hayse, B. , Killelea, B.K. , Horowitz, N.R. , Chagpar, A.B. & Lannin, D.R. Features of triple‐negative breast cancer: analysis of 38,813 cases from the national cancer database. Medicine (Baltimore) 95, e4614 (2016). [DOI] [PMC free article] [PubMed] [Google Scholar]
- 3. Zeichner, S.B. , Terawaki, H. & Gogineni, K. A review of systemic treatment in metastatic triple‐negative breast cancer. Breast Cancer (Auckl.) 10, 25–36 (2016). [DOI] [PMC free article] [PubMed] [Google Scholar]
- 4. Cardoso, F. et al. 3rd ESO‐ESMO international consensus guidelines for advanced breast cancer (ABC 3). Breast 31, 244–259 (2017). [DOI] [PubMed] [Google Scholar]
- 5. Ambrogi, F. et al. Trop‐2 is a determinant of breast cancer survival. PLoS One 9, e96993 (2014). [DOI] [PMC free article] [PubMed] [Google Scholar]
- 6. Trerotola, M. et al. Upregulation of Trop‐2 quantitatively stimulates human cancer growth. Oncogene 32, 222–233 (2013). [DOI] [PubMed] [Google Scholar]
- 7. Vidula, N. , Yau, C. & Rugo, H.S. Trop2 gene expression (Trop2e) in primary breast cancer (BC): correlations with clinical and tumor characteristics. J. Clin. Oncol. 35, 1075 (2017). [Google Scholar]
- 8. Zeng, P. , Chen, M.B. , Zhou, L.N. , Tang, M. , Liu, C.Y. & Lu, P.H. Impact of TROP2 expression on prognosis in solid tumors: a systematic review and meta‐analysis. Sci. Rep. 6, 33658 (2016). [DOI] [PMC free article] [PubMed] [Google Scholar]
- 9. Goldenberg, D.M. & Sharkey, R.M. Sacituzumab govitecan, a novel, third‐generation, antibody‐drug conjugate (ADC) for cancer therapy. Expert Opin. Biol. Ther. 20, 871–885 (2020). [DOI] [PubMed] [Google Scholar]
- 10. Goldenberg, D.M. , Cardillo, T.M. , Govindan, S.V. , Rossi, E.A. & Sharkey, R.M. Trop‐2 is a novel target for solid cancer therapy with sacituzumab govitecan (IMMU‐132), an antibody‐drug conjugate (ADC). Oncotarget 6, 22496–22512 (2015). [DOI] [PMC free article] [PubMed] [Google Scholar]
- 11. Govindan, S.V. , Cardillo, T.M. , Sharkey, R.M. , Tat, F. , Gold, D.V. & Goldenberg, D.M. Milatuzumab‐SN‐38 conjugates for the treatment of CD74+ cancers. Mol. Cancer Ther. 12, 968–978 (2013). [DOI] [PubMed] [Google Scholar]
- 12. Lopez, S. et al. Preclinical activity of sacituzumab govitecan (IMMU‐132) in uterine and ovarian carcinosarcomas. Oncotarget 11, 560–570 (2020). [DOI] [PMC free article] [PubMed] [Google Scholar]
- 13. Trodelvy (Sacituzumab Govitecan‐Hziy) [Package Insert]. Foster City, CA: Gilead Sciences Inc.; 2023.
- 14. Starodub, A.N. et al. First‐in‐human trial of a novel anti‐Trop‐2 antibody‐SN‐38 conjugate, sacituzumab govitecan, for the treatment of diverse metastatic solid tumors. Clin. Cancer Res. 21, 3870–3878 (2015). [DOI] [PMC free article] [PubMed] [Google Scholar]
- 15. Ocean, A.J. et al. Sacituzumab govitecan (IMMU‐132), an anti‐Trop‐2‐SN‐38 antibody‐drug conjugate for the treatment of diverse epithelial cancers: safety and pharmacokinetics. Cancer 123, 3843–3854 (2017). [DOI] [PubMed] [Google Scholar]
- 16. Bardia, A. et al. Sacituzumab govitecan‐hziy in refractory metastatic triple‐negative breast cancer. N. Engl. J. Med. 380, 741–751 (2019). [DOI] [PubMed] [Google Scholar]
- 17. Bardia, A. et al. Sacituzumab govitecan in metastatic triple‐negative breast cancer. N. Engl. J. Med. 384, 1529–1541 (2021). [DOI] [PubMed] [Google Scholar]
- 18. Sathe, A.G. et al. Population pharmacokinetics of sacituzumab govitecan in patients with metastatic triple‐negative breast cancer and other solid tumors. Clin. Pharmacokinet. 63, 669–681 (2024). [DOI] [PMC free article] [PubMed] [Google Scholar]
- 19. Singh, I. et al. Exposure‐response analysis of sacituzumab govitecan efficacy and safety in patients with metastatic triple‐negative breast cancer. J. Clin. Oncol. 40(Suppl 16), 1076 (2022). [DOI] [PMC free article] [PubMed] [Google Scholar]
- 20. Bardia, A. et al. Sacituzumab govitecan, a Trop‐2‐directed antibody‐drug conjugate, for patients with epithelial cancer: final safety and efficacy results from the phase I/II IMMU‐132‐01 basket trial. Ann. Oncol. 32, 746–756 (2021). [DOI] [PubMed] [Google Scholar]
- 21. Dean, L. Irinotecan therapy and UGT1A1 genotype. In Medical Genetics Summaries (eds. Pratt, V.M. , Scott, S.A. , Pirmohamed, M. , Esquivel, B. , Kattman, B.L. & Malheiro, A.J. ) (National Center for Biotechnology Information (US), Bethesda, 2012) <https://www.ncbi.nlm.nih.gov/books/NBK294473/>. Accessed Sep 11, 2024. [PubMed] [Google Scholar]
- 22. Chabot, G.G. Clinical pharmacokinetics of irinotecan. Clin. Pharmacokinet. 33, 245–259 (1997). [DOI] [PubMed] [Google Scholar]
- 23. Bardia, A. et al. Biomarker analyses in the phase III ASCENT study of sacituzumab govitecan versus chemotherapy in patients with metastatic triple‐negative breast cancer. Ann. Oncol. 32, 1148–1156 (2021). [DOI] [PubMed] [Google Scholar]
- 24. Forkasiewicz, A. , Dorociak, M. , Stach, K. , Szelachowski, P. , Tabola, R. & Augoff, K. The usefulness of lactate dehydrogenase measurements in current oncological practice. Cell. Mol. Biol. Lett. 25, 35 (2020). [DOI] [PMC free article] [PubMed] [Google Scholar]
- 25. Pelizzari, G. et al. Lactate dehydrogenase (LDH) response to first‐line treatment predicts survival in metastatic breast cancer: first clues for a cost‐effective and dynamic biomarker. Cancers (Basel) 11, 1243 (2019). [DOI] [PMC free article] [PubMed] [Google Scholar]
- 26. Lustberg, M.B. Management of neutropenia in cancer patients. Clin. Adv. Hematol. Oncol. 10, 825–826 (2012). [PMC free article] [PubMed] [Google Scholar]
Associated Data
This section collects any data citations, data availability statements, or supplementary materials included in this article.
Supplementary Materials
Data S1.
Data Availability Statement
Gilead Sciences, Inc. shares anonymized individual patient data upon request or as required by law or regulation with qualified external researchers based on submitted curriculum vitae and reflecting nonconflict of interest. The request proposal must also include a statistician. Approval of such requests is at Gilead Sciences, Inc.'s discretion and is dependent on the nature of the request, the merit of the research proposed, the availability of the data, and the intended use of the data. Data requests should be sent to datarequest@gilead.com.