

Abstract
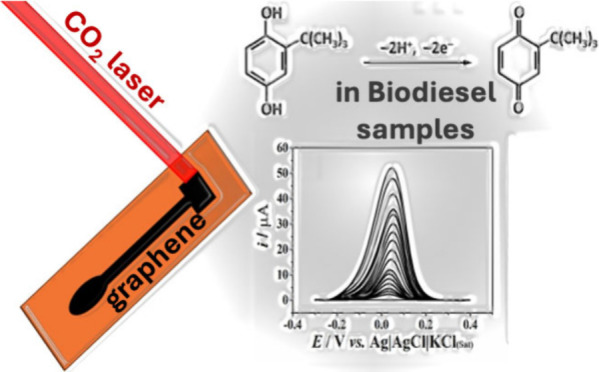
Synthetic antioxidants are often introduced to biodiesel to increase its oxidative stability, and tert-butyl hydroquinone (TBHQ) has been selected due to its high efficiency for this purpose. The monitoring of antioxidants in biodiesel therefore provides information on the oxidative stability of biodiesels. Herein, a laser-induced graphene (LIG) electrode is introduced as a new sensor for detecting tert-butyl hydroquinone (TBHQ) in biodiesel samples. An infrared CO2 laser was applied for LIG formation from the pyrolysis of polyimide (Kapton). Based on the voltammetric profile of a reversible redox probe, the fabrication of LIG electrodes was set using 1.0 W power and 40 mm s–1 speed, which presented an electroactive area of 0.26 cm2 (higher than the geometric area of 0.196 cm2). Importantly, lower engraving speed resulted in higher electroactive area, probably due to a more efficient graphene formation. Scanning-electron microscopy and Raman spectroscopy confirmed the creation of porous graphene induced by laser. The sensing platform enabled the differential-pulse voltammetric determination of TBHQ from 5 and 450 μmol L–1. The values of detection limit (LOD) of 2 μmol L–1 and RSD (relative standard deviation) of 2.5% (n = 10, 10 μmol L–1 of TBHQ) were obtained. The analysis of spiked biodiesel samples revealed recoveries from 88 to 106%. Also, the method provides a satisfactory selectivity, as it is free of interference from metallic ions (Fe3+, Mn2+, Cr2+, Zn2+, Pb2+, and Cu2+) commonly presented in the biofuel. These results show that LIG electrodes can be a new electroanalytical tool for detecting and quantifying TBHQ in biodiesel.
1. Introduction
Biofuels are renewable and biodegradable energy sources that are environmentally friendly and have been incorporated into diesel, enabling the use of existing engines. Due to this set of advantageous features, biodiesel has gained significant attention in recent decades as a promising alternative to conventional petroleum-based fuels.1,2 Crude oil reserves are limited, and fuel demand is ever-increasing. In addition, the exaggerated consumption of petroleum-derived fuels has increased the Earth’s temperature, negatively affecting life and biodiversity.3
The most common route to obtain biodiesel is through the catalyzed transesterification reaction of vegetable oils, recycled oils, or animal fats, forming a mixture of long-chain fatty acid esters (biodiesel itself) and glycerol.4,5 The obtained biodiesel does not contain sulfur and aromatic compounds; moreover, it decreases the emission of particles (HC, CO, and CO2) compared to diesel.6,7 Also, biodiesel is more vulnerable to self-oxidation than fossil fuels8 because it contains high quantities of unsaturated fatty acids from vegetable oil sources, like linolenic acid (approximately 8%), which are transferred to esters produced after transesterification.7,9
In general, the biodiesel deterioration phenomenon happens because of different causes, including oxidation by O2(g) in the atmosphere by direct contact with biodiesel, thermal oxidation with as temperatures increase, microbial degradation, hydrolysis by the effect of humidity, metallic residues, which can occur separately or in combination.10−12 The measurement of stability against oxidation process indicates that if a biodiesel has undergone a degradation process, it changes its physical-chemical parameters and compromises its market acceptance.13 As a result of the low stability, biodiesel or diesel oil blends also have lower oxidative stability than pure diesel.2,14−16
The deterioration of biodiesel during storage can occur in two ways: (1) chemical, through reactions in the presence of air, water, light, temperature, and metals, whose reaction occurs preferentially in the unsaturated bonds of the carbon chains;17 (2) on account of micro-organisms, found throughout the ester, without distinction of types of chemical bonds.18 The Rancimat method, an accelerated oxidation method, described in European Standard (EN) 14.112, is employed to measure the oxidative stability of biodiesel in the presence of additives or not.19,20 These methods assess an induction period in which biofuel degradation initiates the production of volatile secondary oxidation compounds (including organic acids like formic and acetic acids), which are absorbed into a collecting solution whose conductivity is continuously monitored; a sudden increase in the conductivity marks the induction period of biodiesel oxidation.21−23 This process affects biodiesel properties, including acidity, flash point, cetane number, pour point, calorific value, peroxide and peroxide index, cloudiness, iodine number, and induction period. This phenomenon can lead to the formation of solid particles in biodiesel, which can deposit on the pipe walls or engine. These property changes could impact engine performance and fuel systems.24
In view of this, oxidative stability is a decisive and determining parameter in the analysis of the final condition of biodiesel, and antioxidants are fundamental for this purpose.25−29 Antioxidants additives, any compound that can slow or prevent substrate oxidation at low concentrations, are used to delay the oxidative degradation of food and biofuels.30−32 Among many, tert-butyl hydroquinone (TBHQ), phenolic structure in Scheme 1, is a very popular additive that can be introduced in biodiesel during the production process to increase oxidative stability and improve market acceptance.33−35 The mechanism of action of TBHQ involves the donation of protons to the free radicals, avoiding the next oxidative process steps.36−38 Natural Gas and Biofuels (ANP), a Brazilian agency, established the limit of 12 h of induction period for the quantum Satis of TBHQ.23
Scheme 1. Structure of TBHQ.

The voltammetric determination of TBHQ was monitored using many electrochemical methods employing mainly carbon-based electrodes.33,35,36,39−42 However, the accurate determination of TBHQ in biodiesel samples using laser-induced graphene (LIG) electrodes has not yet been reported.
Research into graphene is currently leading to its successful use in applications ranging since catalysis to electronics, taking advantage of its chemical and physical properties.43 Graphene has been designed in three-dimensional (3D) porous structures from so many applications to offer a high surface area while maintaining its mechanical stability and high conductivity.44,45 The use of a commercial CO2 infrared laser scriber, which is an easily accessible tool that can be found in machine shops, is a an easy and scalable approach for the formation and patterning of porous 3D graphene on polyimide (PI) under ambient conditions.46 LIG electrodes can be manufactured in only a single step, which gives them a major advantage over conventional methods for 3D graphene synthesis.47 The LIG production from PI occurs through a photothermal process that starts with the localized high temperature and pressure resulting from CO2 laser irradiation. This results in a hierarchical porous structure on the LIG surface giving rise to a high surface area (about 340 m2 g–1), comparable to that of 3D graphene derived from wet chemistry.46,48 Laser parameters (power, printing speed, focus distance, etc.) have a profound effect on controlling the chemical and physical properties of LIG.49 In general, amplifying laser power can generate thicker LIGs while improving the conductivity. In this gratification process, sp3 carbon atoms form PI polymer are photothermally converted into sp2 carbon atoms by pulsed laser irradiation,50 and the resulting laser-induced graphene (LIG) exhibits high electrical conductivity. Thus, optimizing the laser parameters is important in producing high-quality and reproducible LIG electrodes.
LIG sensors allow excellent control over doping, sensitivity, short manufacturing time, low cost, and use without treatment.51 Their structures and composition motivated large applications, including energy storage devices, optoelectronic devices, biological and biometric devices, and chemical detection.52−56 Infrared-LIG-manufactured electrodes offer many advantages, such as low cost, design freedom, robustness, reproducibility, ease of operation, and portability. This work demonstrates that infrared-LIG electrodes detect antioxidants commonly added to biofuels and biodiesel. The electrochemistry response of TBHQ was investigated without any sensor surface treatment, which is a good condition for a ready-to-use sensor. The sensor was compatible with varying amounts of ethanol, which was required in the electrolyte to increase the solubility of the biodiesel prior to the voltammetric detection of TBHQ. To the best of our knowledge, the LIG electrodes have not been applied to control biodiesel quality.
2. Experimental Procedures
All solutions were prepared with deionized water (R ≥ 18MΩcm) obtained from a Direct-Q3 water purification system (Millipore, Bedford, MA, USA). Aqueous acids were analytical grade, used as received, and obtained from Synth (Sao Paulo, Brazil). The antioxidant tert-butylhydroquinone (TBHQ) (99% w/w) was purchased from Sigma-Aldrich (Steinheim, Germany). Standard TBHQ stock solutions were prepared in ethanol (99.8% v/v). Standard aqueous solutions of Cd(II), Fe(III), Cu(II), Pb(II), Zn(II), and Mn(II) (all at 1000 mg L–1) were purchased from Quimlab (Jacareí, Brazil). Methyl biodiesel produced from soybean oil (locally known as biodiesel) was donated by the Biodiesel Quality Control Laboratory of the Institute of Chemistry. The biodiesel was synthesized in the laboratory and according to a previous study,57 the biofuel did not contain any synthetic antioxidants. Analyses were performed in Britton–Robinson (BR) buffered solution (0.12 mol L–1; pH 6.0) with 30% Dimethylformamide (DMF).
Voltammetric measurements were conducted using a computer coupled with a Metrohm μ-AUTOLAB type III potentiostat/galvanostat (Utrecht, The Netherlands). The NOVA 2.1 software was used to control the instrument. Data were processed with the definitive software for mathematical analysis and graphing, OriginPro 8.5 (OriginLab, Northampton, MA, USA). The electrochemical cell was a 10 mL beaker, an Ag|AgCl (saturated KCl) was the reference electrode, and auxiliary electrodes were a platinum wire. The electrochemical measurements were performed at about 25 °C without removing dissolved oxygen. The electrode was used without any electrochemical treatment process. Cyclic voltammetry experiments in the presence of 1.0 mmol L–1 of K3[Fe(CN)6] in 0.1 mol L–1 KCl at scan rate of 50 mV s–1 and step potential of 5 mV were performed to evaluate the obtained LIG electrodes. In other experiments, the scan rate was varied from 10 to 200 mV s–1. Differential Pulse Voltammetry (DPV) used 0.12 mol L–1 Britton-Robinson (BR) as the supporting electrolyte. The optimized conditions for TBHQ determination were a modulation amplitude of 90 mV, a modulation time of 80 ms, and a step potential of 8 mV. The Raman spectroscopy measurements were performed on a confocal Raman microscope with a λexc of 633 nm from WITec.
Electrodes were prepared using a commercial laser cutter, Workspecial Laser (São Paulo, Brazil), of laser spot diameter of 150 μm and wavelength of approximately 10.6 μm. This laser cutter was used to etch and pattern conductive graphene directly onto a commercial Kapton polyimide (PI) sheet (thickness of 0.15 mm) provided by Vemar (Sorocaba, Brazil). A laser power of 900 mW with a pulse duration of 14 μs and a distance between the substrate and the laser output of 1 cm was used to etch the LIG electrodes. The laser power was measured by a power CO2 laser meter (CS-HLP-200, Gauge, China) with a minimal resolution of 0.1 W. The electrode design was produced using RDWorks 8.0 software, and the LIG electrode conductivity was estimated to be 1.11 ms cm–1. The etched area used for the working electrode was 0.196 cm2.
The biofuel sample was prepared by diluting it to a 1:10 biofuel/ethanol (v/v) ratio, and then, a 10 μL aliquot of the diluted biofuel was added to BR (pH 6.0) containing 30% DMF. TBHQ was determined in biodiesel by applying a standard addition procedure.
3. Results and Discussion
3.1. Fabrication and Evaluation of the Laser-Scribed Sensor
Initially, to generate the electrode, the laser power (from P7 to P11) and engraving speed (from 20 to 150 mm s–1) parameters were evaluated. Table S1 lists the conditions of electrode fabrication that generated LIG electrodes with the potential to be applied for electrochemical measurements. Electrodes were identified as Pxvy, where P is the applied power, v is the engraving speed while x and y correspond to the values of power and speed applied to generate the electrode (see Table S1 for conditions of electrode fabrication). Cyclic voltammetric studies of these electrodes were carried out in 0.1 mol L–1 potassium chloride as the supporting electrolyte in the presence of 1 mmol L–1 K3[Fe(CN)6], used as the electrochemical probe. Figure S1 shows cyclic voltammograms performed on the obtained LIG electrodes. All of the fabricated electrodes responded to the redox probe. These voltammograms were analyzed based on the typical profile for a reversible diffusion-controlled redox probe involving the transference of one electron (the case of [Fe(CN)6]4-/3–), with a ratio Ipa/Ipc close to 1 and anodic to cathodic peak-to-peak separation (ΔE) close to 59 mV at 298 K.58,59 For better visualization of the voltammetric data of Figure S1, Figure S2 shows a plot of Ipa/Ipc and ΔE as a function of the scribing speed for different laser power values.
Figure S2 illustrates that LIG electrodes with ΔE ranging from 96 to 130 mV were produced by using varying laser power levels, which depend on the scribing speed. For example, with higher laser power (power P11), lower ΔE values were obtained at faster scribing speeds, while slower speeds destroyed the polyimide sheet. On the other hand, at lower power (P8), ΔE values showed significant variability with scribing speed, decreasing as speed increased, with the lowest ΔE observed at 40 and 60 mm/s. At power P9, the smallest ΔE was recorded at a speed of 100 mm/s, similar to P10. Thus, it is crucial to carefully control both the laser power and scribing speed for optimal voltammetric performance with this redox probe. The ΔE values ranged between 96 and 170 mV, which are higher than the theoretical value of 59 mV. However, LIG electrodes typically present values of ΔE higher than 100 mV.60 Higher power requires faster scribing speeds to achieve successful graphitization and prevent polyimide damage.47,60 Also, Figure S3 shows that the anodic (Ipa) and cathodic peak currents (Ipc) are directly proportional to the square root of the scan rate (ν1/2).59 The change in potential (ΔEp) was found to be approximately 75 to 105 mV as the scan rates increased from 10 to 200 mV s–1. This range is higher than expected (59 mV at 298 K) for a reversible electrochemical process involving a single electron. As mentioned before, ΔEp values higher than 100 mV have been reported in the literature for LIG electrodes, so the obtained value is within the values reported in the literature.60−62
The electroactive area of all electrodes was fabricated, as described in Table S1 was calculated using the Randles-Sevick eq (eq 1), with [Fe(CN)6]4–/3– as the redox probe, according to eq 1. This reversible probe was used as a reference to estimate how the power and speed influence the electroactive area:
| 1 |
Where n = number of electrons transferred = 1, A = electroactive surface area of the electrode (cm2), C = concentration of the redox probe (mol L–1) = 0.001 mol L–1, D = diffusion coefficient of the redox probe (cm2/s) = 6.7 × 10⁻⁶ cm2/s, and v = scan rate (V/s) = 0.05 V/s.
Figures S4–S13 show the cyclic voltammograms used to calculate the electroactive area values listed in Table S2. For all laser powers applied to generate LIG electrodes (P8, P9, P10, and P11), the electroactive area decreased with the increase in scribing speed. Considering the same trend using different laser power, it can be stated that the electroactive area of LIG electrodes increases inversely with the scribing speed. The energy transferred by laser to pyrolyze polyimide depends on the laser speed and may determine the carbon forms generated, affecting the electroactive area of LIG electrodes. When a lower speed of laser engraving is applied, it can be assumed that more energy is transferred from the laser to the pyrolysis process of polyimide, generating graphene more efficiently. Pyrolysis involves the atomization of the polyimide components, leading to the release of gaseous products and the formation of a porous graphene material. This statement is confirmed by calculated electroactive area values, which are larger than the geometric area (0.196 cm2) in all cases (Table S2), as reported in the literature.63 Hence, more efficient pyrolysis results in the formation of more porous graphene, which consequently may explain the higher electroactive area of the LIG electrodes obtained at lower engraving speeds. Even though the p9v40 provided a higher electroactive area, the p8v40 was chosen due to the better voltammetric profile and best reversible parameters (ΔEp and ratio Ipa/Ipc), as shown in Figure S2.
The selected condition for electrode preparation was 1.0 W power and 40 mm/s speed (P8v40) based on the voltammetric profile obtained for the redox probe and current intensity. A high current value and a low separation between the anodic and cathodic peaks (ΔE = 95.67 mV) for electrochemical probe [Fe(CN)6]4–/3–, which indicates higher electrochemical reversibility (measurement shown in Figure 1A), was obtained. Figure 1A shows that demonstrates that the LIG electrode responded consistently with the expected for a reversible diffusion-controlled redox process involving the transference of 1 with a ratio between the Ipa/Ipc close to 1 (Ipa = 0.2771and Ipc = 0.18143). The SEM (scanning electron microscopy) image of the LIG electrodes (Figure 1B) showed a very regular configuration with a rough surface, conferring a high porosity, as observed in the LIG electrodes obtained by the laser-photothermal conversion of PI into graphene.60,64 The laser irradiation results in a localized reaction at high temperature with a break of the C=O, CO, and N=C bonds in polyimide polymer; gas are released due to the local pressure, and the graphene structures are the result of the reorganization of the remaining aromatic compounds.46,65 At this point, the gases released with high pressure also play a key role in the successful conversion of PI to LIG, the high pressure extinguishes the decomposition of C precursors and allows small carbon clusters to combine and form larger graphene layers.46,66 Moreover, the gases released can minimize the oxidation of graphitic structures in the conversion process to graphene,67 resulting in the formation of a porous structure, as observed by microscopy. Also, the electrodes were characterized by Raman spectroscopy, the LIG spectra (Figure S14) displayed the characteristic bands of graphene like-based materials.64 The D band, located at 1330 cm–1, is signed with the sp2 carbon ring breathing mode. The G band, appearing at 1580 cm–1, corresponds to sp2 in-plane carbon vibrations. The 2D band signal, originating from second-order zone-boundary phonons, arises at 2652 cm–1. The ID/IG (1,20) ratio indicates the formation of highly ordered graphite with a high density of defects within graphene sheets.68 Also, the I2D/IG (0.30–0.50) ratio indicates that the graphene sheets must have 4–5 layers.68 All these results, cyclic voltammetry, SEM, and Raman spectroscopy, indicate the conversion of polyimide to LIG after CO2 laser irradiation.
Figure 1.
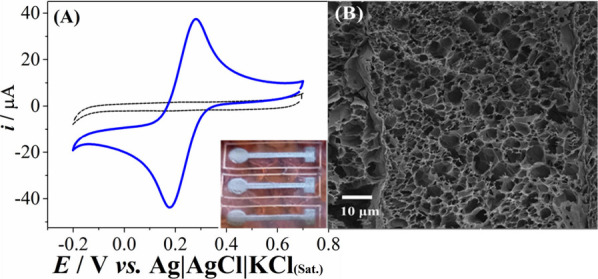
(A) Cyclic voltammogram for 1.0 mmol L–1 of K3[Fe(CN)6] using the LIG electrode fabricated under optimized conditions (laser power 1.0 W and engraving speed of 40 mm/s). The electrolyte sign is the dashed line. Supporting electrolyte: 0.1 mol L–1 potassium chloride. Voltammetric conditions: scan rate = 50 mVs–1 and step potential = 5 mV. The inset shows a picture of the LIG electrode (black) and polyimide polymer substrate (orange color). The circle (r = 2.5 mm) was used as the working electrode, which was isolated from the rest of the graphene material by applying a layer of nail polish. (B) SEM image of the LIG surface.
3.2. Determination of TBHQ
3.2.1. Influence of pH
The P8v40 parameter (1.0 W and 40 mm s–1) was selected to prepare LIG electrodes to be applied as an electrochemical sensor for TBHQ. The choice of pH of the supporting electrolyte is fundamental in voltammetric analysis for the detection of electroactive compounds.69 In this context, the electrochemical response of the electrode in the presence and absence of TBHQ (50 μmol L–1) was studied in a BR buffer solution controlling the pH from 2.0 to 10.0 by cyclic voltammetry (CV), Figure 2. Protons play an important role in electrochemical reactions and considerably affect the analyte’s peak potential and current.69 For the case of the laser-engraved electrode, the increase in pH resulted in the shift of the peak to a less positive potential, showing that the process was influenced by protonation.41 Therefore, pH 6.0 was chosen because the electrochemical response presented a higher intensity and a better definition of the cathodic and anodic peaks. A linearity of pH was observed in the of 2.0 to 10.0 range, resulting in an angular coefficient of −58.4 mVpH–1 (Ep = −0.0584 pH + 0.000333). For this case, the slope of 58.4 mV pH–1 is in agreement with the conversion of TBHQ molecule to TBQ (tert-butyl-p-benzoquinone), indicating that the slopes are very close to the theoretical value of 59.0 (mV pH–1) for a Nernstian system, which indicates that that the oxidation process involves the transfer of the same number of protons and electrons.42,70−72 This result is consistent with the mechanism described by Nunes Angelis,36 in which 2 protons and 2 electrons participate in the oxidation of TBHQ, as illustrated in Scheme 2.40
Figure 2.
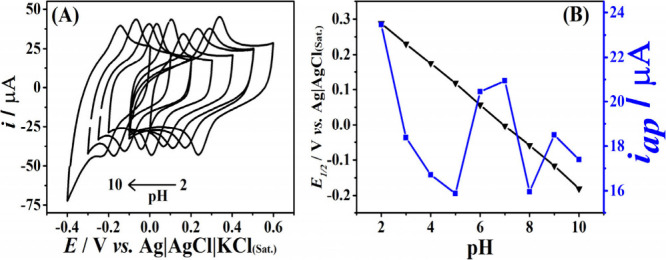
(A) Cyclic voltammograms employing LIG electrode in the presence of 50 μmol L–1 of [TBHQ] in 0.12 mol L–1 BR buffer at different pH’s. (B) Relationship between pH and half-wave potential (E1/2) and peak current (i) for the oxidation of TBHQ. CV conditions: scan rate = 50 mV s–1; step potential = 5 mV.
Scheme 2. Mechanism for the 2 Protons and 2 Electrons Oxidation Process of TBHQ.

The electrochemical behavior of 100.0 μmol L–1 TBHQ in 0.12 mol L–1 BR buffer solution (pH 6.0) was evaluated by cyclic voltammetry (Figure S3). From Figure S3, it can be seen the TBHQ electrochemical profile, one oxidation peak at 133 mV (Ep,a) and the reduction peak at 33 mV (Ep,c), resulting in a separation between the anodic and cathodic peaks (ΔEp) of 100 mV. Reversibility was checked by changing the scan rate, evaluating the voltammogram profile and graph of anodic and cathodic peak current (ip) versus the square root of the scan rate (v1/2) (Figure S3C). The Ipa/Ipc ratio reaches 1 (1.07), and the current intensity grows linearly as a function of the scan rate’s square root, confirming the occurrence of an electrochemical reversible system.73 The Figure S3D shows the logarithm plots of the current as a function of the scan rate, and it shows a linear correlation with angular coefficient values of 0.61 and 0.50 for the anodic and cathodic processes (r = 0.999 and 0.998, respectively). Both values are close to the theoretical value of 0.50, which suggests that the rate-determining step of the reaction is the diffusion of the TBHQ species to the electrode surface.74 On opposite, values close to 1.0 (theoretical value) would indicate that the rate-determining step of the reaction is the electron transfer, which was not the case of this work.
3.2.2. Optimization of DPV Parameters for Determination of TBHQ
The DPV technique was selected to perform for the voltammetric determination of TBHQ. The following experiments to evaluate the DPV parameters were performed in BR buffer, pH 6.0, using the LIG electrode. The DPV parameters were optimized in the presence of 50 μmol L–1 of tert-butyl hydroquinone and 30% DMF in the solution for increasing biodiesel solubility. The parameters evaluated were modulation amplitude from 10 to 100 mV (Figure S15), modulation time from 10 to 100 mV (Figure S16), and step potential from 1 to 10 mV (Figure S17). Table 1 summarizes the DPV parameters, pH solution, studied ranges, and selected values used in all experiments. The final values were chosen considering the stability of the signal, the current response, and the resolution of the peak profile after the initial treatment.
Table 1. Intervals Studied and Optimized Values Selected for TBHQ Determination Using DPV.
| Parameters | Studied range | Optimized value |
|---|---|---|
| pH | 2.0–10.0 | 6.0 |
| Modulation Amplitude | 10–100 | 90 |
| Modulation Time | 10–100 | 80 |
| Step potential | 1–10 | 8 |
After optimization, an analytical curve was obtained, and the linear range for TBHQ was determined to be from 5 to 450 μmol L–1 (r = 0.999), Figure 3. The limit of detection (LOD) and limit of quantification (LOQ) were calculated according to the IUPAC (International Union of Pure and Applied Chemistry): LOD was calculated as three times the standard deviation of the intercept (σ) of the analytical curve divided by the slope of the analytical curve (s), i.e., 3σ/s, while LOQ was calculated to be 10 times the standard deviation of the intercept (σ) of the calibration curve divided by the slope of the calibration curve (s), i.e., 10σ/s. The repeatability study used the same electrode for three different TBHQ concentration levels (10, 40, and 100 μmol L–1). RSD values lower than 3% were obtained in all cases, indicating high precision. Table 2 lists all of the obtained analytical parameters. Thus, the proposed method based on a laser-engraved graphene sensor can be applied to determine tert-butyl hydroquinone in biodiesel samples.
Figure 3.
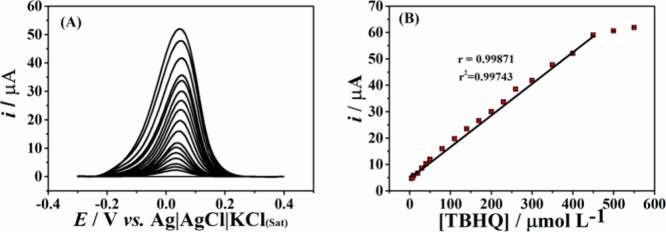
(A) Differential-pulse voltammograms with corrected baseline (n = 3) for increasing concentrations of TBHQ (5–550 μmol L–1) in BR buffer (pH = 6.0) and (B) respective calibration curve. The experiment was carried out under the optimized conditions listed in Table 1.
Table 2. Analytical Parameters Fund from the Proposed Method for TBHQ Determination.
| Parameters | Optimized values |
|---|---|
| Linear range (μmol L–1) | 5–450 |
| Sensitivity (μA μmol–1 L) | 0.1199 ± 0.001 |
| Limit of detection (LOD) (μmol L–1) | 2 |
| Limit of quantification (LOQ) (μmol L–1) | 7 |
| R | 0.9989 |
| Intraelectrode (n = 10 for 10 μmol L–1)% | 3 |
| Intraelectrode (n = 10 for 40 μmol L–1)% | 2 |
| Intraelectrode (n = 10 for 100 μmol L–1)% | 1 |
3.2.3. Interference Study
The selectivity of the LIG electrode was analyzed by testing its response in the presence of various metals as potential interfering species, even at low concentrations. These metals have attracted significant attention due to their negative impact on the oxidative stability of biodiesel and their role in accelerating degradation processes.75 Thus, engine activity and performance are hindered by the formation of insoluble salts, corrosion of components, and gum buildup, as well as by accelerated degradation in the case of biofuels.4,76 Additionally, various metals can be introduced into biodiesel when it comes into contact with metal components of engines or storage tanks, causing corrosion and releasing metals into the biofuel.77−79 Given these harmful effects, maximum limits for some contaminants, including water, sulfate, methanol, chloride, iron, and sodium, are set by regulatory agencies around the world to highlight Brazilian (ANP), European (CEN) and American (ASTM). In addition, ANP Resolution No. 842, of May 14, 2021, determined a stringent limit for the high concentration of some metal ions like Fe3+, Pb2+, Cu2+, Mn2+, and Cr2+ in biofuel (of 1.0 mg kg–1). The selectivity of the LIG electrode was studied by considering Fe3+, Mn2+, Cr2+, Cu2+, Zn2+, and Pb2+ as interferents, keeping 50 μg L–1 of each interfering species and 0.008 μg L–1 of the antioxidant TBHQ. The measurements were performed in triplicate, and the DPV measurements for these tests are shown in Figure 4. Low deviations in the signal were obtained for TBHQ in the presence of Fe3+, Mn2+, Cr2+, and Zn2+ ions. For Pb2+, a small shift in the potential was also registered, but this did not affect the determination of the analyte. Significantly interference with the detection of TBHQ was observed in the presence of Cu2+ ion; a new peak rose at around −0.1 V. To minimize copper ion interference, the samples were treated with ethylenediaminetetraacetic acid – EDTA solution at a ratio of 1:2 m/m EDTA:Cu2+. Ethylenediaminetetraacetic acid (EDTA) is a chelating agent and can form stable and water-soluble chelates with almost all transition metal ions over a wide pH range.80,81 EDTA binds to some metal ions in water, removing all the substances that harm the product formula, making it more stable and intractable than free metal ions.82−84 In the presence of EDTA, the interference of the Cu2+ ion was minimized due to the nonobservation of the signal at −0.1 V. Again, these metal species do not interfere with the detection of TBHQ under the selected conditions on the laser-engraved LIG electrode. Therefore, this sensor serves as a viable alternative to conventional methods for TBHQ determination, offering advantages such as low cost, selectivity, accuracy, and rapid fabrication without the need for additional treatment.
Figure 4.

DPV (baseline corrected) obtained for 50 μmol L–1 of TBHQ and a mixture containing the same TBHQ contraction and 50 μg of (A) Fe3+, (B) Mn2+, (C) Cr2+, (D) Cu2+, (E) Zn2+, and (F) Pb2+, under the optimized conditions.
3.3. Application for Biodiesel Analysis
After the best conditions were selected, the DPV method using the LIG electrodes was employed for TBHQ determination in soy biodiesel samples. The method’s accuracy was evaluated by recovery/addition testing. Three TBHQ concentration levels, 3.3, 16.6, and 33.0 mg L–1 (equivalent to concentration of 20, 100, and 200 μmol L–1 TBHQ in the electrochemical cell after dilution), were selected. The antioxidant concentration in the biodiesel was estimated to reach 12 h induction period measured by the Rancimat method.34 The curves from these analyses demonstrated satisfactory linearity (r > 0.99). Figure 5 presents the voltammetric measurements and the corresponding standard addition curves, while Table 3 displays the recoveries (mean values for n = 3) obtained from these analyses using the LIG sensor. Recovery values between 87.6% and 106% were obtained, which follows the recovery compliance criteria established by the Brazilian National Metrology, Quality and Technology Institute (INMETRO),85 and thus confirms acceptable accuracy at the level of concentrations studied. In addition, these results suggest that the proposed method is free of interference from the sample matrix (soy biodiesel) under the optimized conditions.
Figure 5.
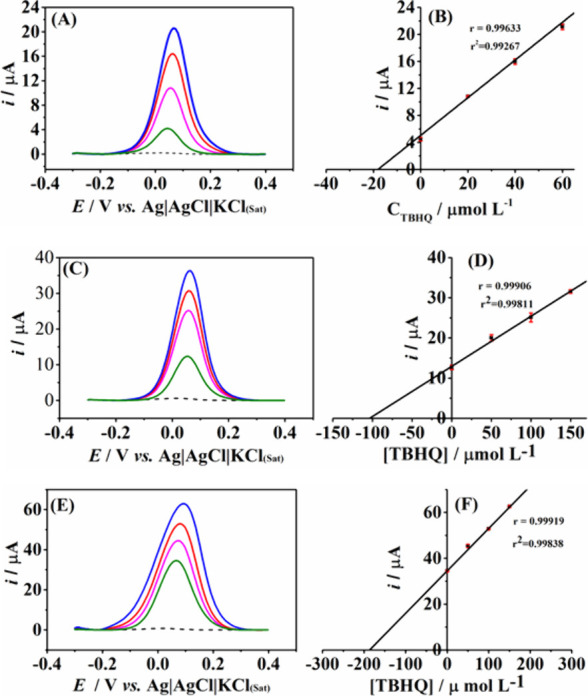
DPV records for TBHQ determination in soy biodiesel samples ((A), (C), and (E)) spiked with a standard solution resulting in final concentrations in the cell of 20 (B), 100 (D), and 200 (F) μmol L–1, followed by three additions of standard solutions. The respective standard addition curves are side by side in their voltammogram. The first scans show supporting electrolyte with 30% of DMF; second scan: shows spiked samples; third, fourth and fifth scans show: addition of the TBHQ standard solutions (the values can be seen in the respective curves).
Table 3. Results Obtained from Recovery Experiments with TBHQ-Enriched Biodiesel Samples (n = 3), Showing Concentration Values Corresponding to the Amount of TBHQ in the Cell.
| Sample | Found (μmol L–1) | Fortified (μmol L–1) | Found ± SD (μmol L–1) | Recovery ± SD (%) |
|---|---|---|---|---|
| Biodiesel | <LOD | 20 | 17.5 ± 0.1 | 87.6 ± 0.3 |
| <LOD | 100 | 106 ± 8 | 106 ± 8 | |
| <LOD | 200 | 191 ± 4 | 96 ± 2 |
The procedure developed for determining TBHQ in biodiesel using the LIG electrode was compared, in terms of linear range and LOD, with other electroanalytical methods available in the literature (Table 4).
Table 4. Electrochemical Detection of TBHQ Employing Different Working Electrodes.
| aTechnique | bWorking electrode | Detection limit (μmol) | Linear range (μmol) | Ref |
|---|---|---|---|---|
| DPV | LIG | 2 | 5–450 | This work |
| DPV | GCE | 0.57 | - | (6) |
| SWV | Gold | 1 | 4.76–92.40 | (33) |
| DPV | CB/PLA | 0.15 | 0.5–175 | (35) |
| SWV | G/PLA | 0.017 | 0.3–450 | (39) |
| DPV | Platinum Ultramicro-electrode | 26 | 29.0–361.6 | (86) |
| LSV | SPE–MWCNT | 0.34 | 0.5–10 | (87) |
| SWV | HMDE | 0.034 | 1–10 | (88) |
| DPV | UME | 212 | 1200–8900 | (89) |
| MPA | GCE | 5 | 60–600 | (5) |
DPV: Differential pulse voltammetry; SWV: Square-wave voltammetry; LSV: Linear sweep voltammetry MPA: multiple-pulse amperometry.
G/PLA: graphene-integrated polylactic acid; CB/PLA: carbon-black/polylactic acid electrode; GCE: Glassy carbon electrode; SPE–MWCNT: multiwalled carbon nanotube modified screen-printed electrodes; HMDE: Hanging mercury-drop electrode UME: platinum ultramicroelectrode.
The analyzed parameters, including working electrode type, technique, LOD, and linear range, show that the new method provides similar or better results than those already published in the literature. The proposed method presents a slightly higher LOD than some of the DPV and SWV using G/PLA, CB/PLA, GCE, Gold SPE-MWCNT, and HMDE electrodes, which obtained a LOD lower than LIG. In addition, the HDME electrode is not environmentally sound and poses a hazard to the analyst. Notably, several works have used glassy carbon, gold, and boron doped diamond electrodes, all commercial, which have a higher cost compared to the CO2 laser-scribed electrode used in this work. Some of these electrodes were prepared by applying more than one step, increasing the manufacturing time and affecting reproducibility.87 Furthermore, the CO2 laser printed electrode (LIG) used in this work took 60 s to manufacture and required no treatment for its application.
4. Conclusion
In summary, a simple, fast, and environmentally friendly protocol for producing graphene on flexible polyimide sheets for the electrochemical detection of TBHQ was introduced. The analytical performance of the LIG electrode was adequate, providing the determination and quantification of TBHQ with a linear range between 5 and 450 μmol L–1, and an LOD value of 2 μmol L–1. In addition, spiked biodiesel samples with three different concentrations were analyzed by the proposed sensor, and recovery values between 88% and 106% were obtained. Selectivity toward metallic ion interfering species was assessed, and in the critical cases (e.g., Cu2+) EDTA can be added to the electrolyte solutions to deplete the interference. The LIG sensor presented a similar performance compared to more expensive sensors described in the literature, which require complex and time-consuming surface treatments. Thus, these results indicate that the presented sensor manufactured from the CO2 laser can be used to quantify TBHQ at small concentrations and can be applied to analyze biodiesel.
Acknowledgments
This work was financed by Brazilian agencies, CAPES (001), CNPq (427731/2018-6, 208504/2018-6, 428094/2018-0, 307271/2017- 0) and FAPESP (2022/01810-5 and 2023/00246-1) for the financial support. The authors wish to acknowledge the Multiuser Laboratories at the Federal University of Uberlândia (RELAM-UFU) for supplying the equipment and technical support for electron microscopy experiments (FAPEMIG grant APQ-02391-22)
Supporting Information Available
The Supporting Information is available free of charge at https://pubs.acs.org/doi/10.1021/acsomega.4c06339.
Laser power and engraving speed evaluated to generate laser-induced graphene electrodes (Table S1); Cyclic voltammograms recorded at different parameters (Figure S1); Relationship between ΔE (anodic and cathodic peak-to-peak separation) (Figure S2); Voltammetric scanning rate study (Figure S3); Study of the voltammetric scan rate in the LIG recorded at P8 to P11 (Figure S4 to S13); Electroactive area of all electrodes (Table S2); Raman spectrum of LIG electrode with λexc of 633 nm (Figure S14); DPV registered for TBHQ (50 μmol L–1), using a 0.12 mol L–1 BR buffer (pH 6) as supporting electrolyte to evaluate the effect of modulation amplitude and the peak current and half peak width (Figure S15); DPV registered for TBHQ (50 μmol L–1), using a 0.12 mol L–1 BR buffer (pH 6) as supporting electrolyte to evaluate the effect of modulation time and peak current and midpeak width (Figure S16); DPV registered for TBHQ (50 μmol L–1), using a 0.12 mol L–1 BR buffer (pH 6) as supporting electrolyte to evaluate the effect of step potential and the peak current and half peak width (Figure S17). (PDF)
The Article Processing Charge for the publication of this research was funded by the Coordination for the Improvement of Higher Education Personnel - CAPES (ROR identifier: 00x0ma614).
The authors declare no competing financial interest.
Supplementary Material
References
- Khandelwal A.; Chhabra M.; Lens P. N. L. Integration of third generation biofuels with bio-electrochemical systems: Current status and future perspective. Frontiers in Plant Science 2023, 14, 1–14. 10.3389/fpls.2023.1081108. [DOI] [PMC free article] [PubMed] [Google Scholar]
- Saluja R. K.; Kumar V.; Sham R. Stability of biodiesel - A review. Renewable and Sustainable Energy Reviews 2016, 62, 866–881. 10.1016/j.rser.2016.05.001. [DOI] [Google Scholar]
- Umar M.; Ji X.; Kirikkaleli D.; Xu Q. COP21 Roadmap: Do innovation, financial development, and transportation infrastructure matter for environmental sustainability in China?. Journal of Environmental Management 2020, 271 (June), 111026. 10.1016/j.jenvman.2020.111026. [DOI] [PubMed] [Google Scholar]
- Knothe G.; Steidley K. R. The effect of metals and metal oxides on biodiesel oxidative stability from promotion to inhibition. Fuel Process. Technol. 2018, 177 (April), 75–80. 10.1016/j.fuproc.2018.04.009. [DOI] [Google Scholar]
- Tormin T. F.; Gimenes D. T.; Silva L. G.; Ruggiero R.; Richter E. M.; Ferreira V. S.; Muñoz R. A. A. Direct amperometric determination of tert-butylhydroquinone in biodiesel. Talanta 2010, 82 (4), 1599–1603. 10.1016/j.talanta.2010.07.011. [DOI] [PubMed] [Google Scholar]
- Goulart L. A.; Teixeira A. R. L.; Ramalho D. A.; Terezo A. J.; Castilho M. Development of an analytical method for the determination of tert-butylhydroquinone in soybean biodiesel. Fuel 2014, 115, 126–131. 10.1016/j.fuel.2013.06.050. [DOI] [Google Scholar]
- Sharma P.; Bhatti T. S. A review on electrochemical double-layer capacitors. Energy Conversion and Management 2010, 51 (12), 2901–2912. 10.1016/j.enconman.2010.06.031. [DOI] [Google Scholar]
- Varatharajan K.; Pushparani D. S. Screening of antioxidant additives for biodiesel fuels. Renewable and Sustainable Energy Reviews 2018, 82, 2017–2028. 10.1016/j.rser.2017.07.020. [DOI] [Google Scholar]
- Shan R.; Lu L.; Shi Y.; Yuan H.; Shi J. Catalysts from renewable resources for biodiesel production. Energy Conversion and Management 2018, 178 (July), 277–289. 10.1016/j.enconman.2018.10.032. [DOI] [Google Scholar]
- Ryu K. Effect of antioxidants on the oxidative stability and combustion characteristics of biodiesel fuels in an indirect-injection (IDI) diesel engine. Journal of Mechanical Science and Technology 2009, 23 (11), 3105–3113. 10.1007/s12206-009-0902-6. [DOI] [Google Scholar]
- Rashedul H. K.; Masjuki H. H.; Kalam M. A.; Teoh Y. H.; How H. G.; Rizwanul Fattah I. M. Effect of antioxidant on the oxidation stability and combustion-performance-emission characteristics of a diesel engine fueled with diesel-biodiesel blend. Energy Conversion and Management 2015, 106, 849–858. 10.1016/j.enconman.2015.10.024. [DOI] [Google Scholar]
- Sharma A.; Murugan S. Effect of blending waste tyre derived fuel on oxidation stability of biodiesel and performance and emission studies of a diesel engine. Applied Thermal Engineering 2017, 118, 365–374. 10.1016/j.applthermaleng.2017.03.008. [DOI] [Google Scholar]
- Yaakob Z.; Narayanan B. N.; Padikkaparambil S.; Unni K. S.; Akbar P. M. A review on the oxidation stability of biodiesel. Renewable and Sustainable Energy Reviews 2014, 35, 136–153. 10.1016/j.rser.2014.03.055. [DOI] [Google Scholar]
- Zhou J.; Xiong Y.; Xu S. Evaluation of the oxidation stability of biodiesel stabilized with antioxidants using the PetroOXY method. Fuel 2016, 184, 808–814. 10.1016/j.fuel.2016.07.080. [DOI] [Google Scholar]
- Nogales-Delgado S.; Encinar J. M.; González J. F. Safflower Biodiesel: Improvement of its Oxidative. Energies 2019, 12, 1940–22. 10.3390/en12101940. [DOI] [Google Scholar]
- Jemima Romola C. V.; Meganaharshini M.; Rigby S. P.; Ganesh Moorthy I.; Shyam Kumar R.; Karthikumar S. A comprehensive review of the selection of natural and synthetic antioxidants to enhance the oxidative stability of biodiesel. Renewable and Sustainable Energy Reviews 2021, 145 (April), 111109. 10.1016/j.rser.2021.111109. [DOI] [Google Scholar]
- De Oliveira F. C.; Coelho S. T. History, evolution, and environmental impact of biodiesel in Brazil: A review. Renewable and Sustainable Energy Reviews 2017, 75, 168–179. 10.1016/j.rser.2016.10.060. [DOI] [Google Scholar]
- Bücker F.; de Moura T. M.; da Cunha M. E.; de Quadros P. D.; Beker S. A.; Cazarolli J. C.; Caramão E. B.; Frazzon A. P. G.; Bento F. M. Evaluation of the deteriogenic microbial community using qPCR, n-alkanes and FAMEs biodegradation in diesel, biodiesel and blends (B5, B10, and B50) during storage. Fuel 2018, 233, 911–917. 10.1016/j.fuel.2017.11.076. [DOI] [Google Scholar]
- Jia T.; Zhao M.; Pan L.; Deng C.; Zou J. J.; Zhang X. Effect of phenolic antioxidants on the thermal oxidation stability of high-energy-density fuel. Chem. Eng. Sci. 2022, 247, 117056. 10.1016/j.ces.2021.117056. [DOI] [Google Scholar]
- Ruan L.; Lu L.; Zhao X.; Xiong W.; Xu H.; Wu S. Effects of natural antioxidants on the oxidative stability of Eucommia ulmoides seed oil: Experimental and molecular simulation investigations. Food Chem. 2022, 383, 132640. 10.1016/j.foodchem.2022.132640. [DOI] [PubMed] [Google Scholar]
- Focke W. W.; van der Westhuizen I.; Oosthuysen X. Biodiesel oxidative stability from Rancimat data. Thermochim. Acta 2016, 633, 116–121. 10.1016/j.tca.2016.03.023. [DOI] [Google Scholar]
- De Menezes L. C.; De Sousa E. R.; Da Silva G. S.; Marques A. L. B.; Viegas H. D. C.; Dos Santos M. J. C. Investigations on Storage and Oxidative Stability of Biodiesel from Different Feedstocks Using the Rancimat Method, Infrared Spectroscopy, and Chemometry. ACS Omega 2022, 7 (35), 30746–30755. 10.1021/acsomega.2c01348. [DOI] [PMC free article] [PubMed] [Google Scholar]
- Agência Nacional Do Petróleo, Gás Natural E Biocombustíveis - ANP. Resolução anp n° 920 de 04/04/2023. 2023, pp 1–5.
- Longanesi L.; Pereira A. P.; Johnston N.; Chuck C. J. Oxidative stability of biodiesel: recent insights. Biofuels, Bioproducts and Biorefining 2022, 16 (1), 265–289. 10.1002/bbb.2306. [DOI] [Google Scholar]
- Kumar N. Oxidative stability of biodiesel: Causes, effects and prevention. Fuel 2017, 190, 328–350. 10.1016/j.fuel.2016.11.001. [DOI] [Google Scholar]
- de Siqueira Cavalcanti E. H.; Zimmer A. R.; Bento F. M.; Ferrão M. F. Chemical and microbial storage stability studies and shelf life determinations of commercial Brazilian biodiesels stored in carbon steel containers in subtropical conditions. Fuel 2019, 236, 993–1007. 10.1016/j.fuel.2018.09.043. [DOI] [Google Scholar]
- Vidigal I. G.; Siqueira A. F.; Melo M. P.; Giordani D. S.; da Silva M. L. C. P.; Cavalcanti E. H. S.; Ferreira A. L. G. Applications of an electronic nose in the prediction of oxidative stability of stored biodiesel derived from soybean and waste cooking oil. Fuel 2021, 284, 119024. 10.1016/j.fuel.2020.119024. [DOI] [PMC free article] [PubMed] [Google Scholar]
- Komariah L. N.; Arita S.; Rendana M.; Ramayanti C.; Suriani N. L.; Erisna D. Microbial contamination of diesel-biodiesel blends in storage tank; an analysis of colony morphology. Heliyon 2022, 8 (4), e09264 10.1016/j.heliyon.2022.e09264. [DOI] [PMC free article] [PubMed] [Google Scholar]
- Silva de Sousa L.; Verônica Rodarte de Moura C.; Miranda de Moura E. Action of natural antioxidants on the oxidative stability of soy biodiesel during storage. Fuel 2021, 288, 119632. 10.1016/j.fuel.2020.119632. [DOI] [Google Scholar]
- Othón-Díaz E. D.; Fimbres-García J. O.; Flores-Sauceda M.; Silva-Espinoza B. A.; López-Martínez L. X.; Bernal-Mercado A. T.; Ayala-Zavala J. F. Antioxidants in Oak (Quercus sp.): Potential Application to Reduce Oxidative Rancidity in Foods. Antioxidants 2023, 12 (4), 861. 10.3390/antiox12040861. [DOI] [PMC free article] [PubMed] [Google Scholar]
- Antioxidant Biomaterials in Cutaneous Wound Healing and Tissue Regeneration: A Critical Review. Antioxidants 2023, 12 (4), 787. 10.3390/antiox12040787. [DOI] [PMC free article] [PubMed] [Google Scholar]
- Shah M. A.; Bosco S. J. D.; Mir S. A. Plant extracts as natural antioxidants in meat and meat products. Meat Science 2014, 98 (1), 21–33. 10.1016/j.meatsci.2014.03.020. [DOI] [PubMed] [Google Scholar]
- Squissato A. L.; Richter E. M.; Munoz R. A.A. Voltammetric determination of copper and tert-butylhydroquinone in biodiesel: A rapid quality control protocol. Talanta 2019, 201 (April), 433–440. 10.1016/j.talanta.2019.04.030. [DOI] [PubMed] [Google Scholar]
- van der Westhuizen I.; Focke W. W. Stabilizing sunflower biodiesel with synthetic antioxidant blends. Fuel 2018, 219, 126–131. 10.1016/j.fuel.2018.01.086. [DOI] [Google Scholar]
- Inoque N. I. G.; João A. F.; de Faria L. V.; Muñoz R. A. A. Electrochemical determination of several biofuel antioxidants in biodiesel and biokerosene using polylactic acid loaded with carbon black within 3D-printed devices. Microchimica Acta 2022, 189 (2), 1–11. 10.1007/s00604-021-05152-x. [DOI] [PubMed] [Google Scholar]
- Nunes Angelis P.; de Cássia Mendonça J.; Rianne da Rocha L.; Boareto Capelari T.; Carolyne Prete M.; Gava Segatelli M.; Borsato D.; Ricardo Teixeira Tarley C. Feasibility of a Nano-Carbon Black Paste Electrode for Simultaneous Voltammetric Determination of Antioxidants in Food Samples and Biodiesel in the Presence of Surfactant. Electroanalysis 2020, 32 (6), 1198–1207. 10.1002/elan.201900479. [DOI] [Google Scholar]
- Rezende M. J. C.; de Lima A. L.; Silva B. V.; Mota C. J. A.; Torres E. A.; da Rocha G. O.; Cardozo I. M. M.; Costa K. P.; Guarieiro L. L. N.; Pereira P. A. P.; Martinez S.; de Andrade J. B. Biodiesel: An overview II. J. Braz. Chem. Soc. 2021, 32 (7), 1301–1344. 10.21577/0103-5053.20210046. [DOI] [Google Scholar]
- Chen X.; Zhang Y.; Zu Y.; Yang L.; Lu Q.; Wang W. Antioxidant effects of rosemary extracts on sunflower oil compared with synthetic antioxidants. International Journal of Food Science and Technology 2014, 49 (2), 385–391. 10.1111/ijfs.12311. [DOI] [Google Scholar]
- João A. F.; Matias T. A.; Gomes J. S.; Guimaraes R. R.; Sousa R. M. F.; Muñoz R. A. A. An Environmentally Friendly Three-Dimensional Printed Graphene-Integrated Polylactic Acid Electrochemical Sensor for the Quality Control of Biofuels. ACS Sustainable Chem. Eng. 2021, 9 (48), 16052–16062. 10.1021/acssuschemeng.1c03361. [DOI] [Google Scholar]
- Wang P.; Han C.; Zhou F.; Lu J.; Han X.; Wang Z. Electrochemical determination of tert-butylhydroquinone and butylated hydroxyanisole at choline functionalized film supported graphene interface. Sensors and Actuators, B: Chemical 2016, 224, 885–891. 10.1016/j.snb.2015.10.098. [DOI] [Google Scholar]
- Sousa Carvalho R. M.; Yotsumoto Neto S.; Carvalho Silva F.; Santos Damos F.; de Cássia Silva Luz R. A Sensitive Sensor Based on CuTSPc and Reduced Graphene Oxide for Simultaneous Determination of the BHA and TBHQ Antioxidants in Biodiesel Samples. Electroanalysis 2016, 28 (12), 2930–2938. 10.1002/elan.201600187. [DOI] [Google Scholar]
- Cao W.; Wang Y.; Zhuang Q.; Wang L.; Ni Y. Developing an electrochemical sensor for the detection of tert-butylhydroquinone. Sensors and Actuators, B: Chemical 2019, 293, 321–328. 10.1016/j.snb.2019.05.012. [DOI] [Google Scholar]
- Ye R.; James D. K.; Tour J. M. Laser-Induced Graphene. Acc. Chem. Res. 2018, 51 (7), 1609–1620. 10.1021/acs.accounts.8b00084. [DOI] [PubMed] [Google Scholar]
- Xu Y.; Sheng K.; Li C.; Shi G. Self-Assembled Graphene Hydrogel. ACS Nano 2010, 4 (7), 4324–4330. 10.1021/nn101187z. [DOI] [PubMed] [Google Scholar]
- Luo P.; Guan X.; Yu Y.; Li X.; Yan F. Hydrothermal synthesis of graphene quantum dots supported on three-dimensional graphene for supercapacitors. Nanomaterials 2019, 9 (2), 201. 10.3390/nano9020201. [DOI] [PMC free article] [PubMed] [Google Scholar]
- Lin J.; Peng Z.; Liu Y.; Ruiz-Zepeda F.; Ye R.; Samuel E. L. G.; Yacaman M. J.; Yakobson B. I.; Tour J. M. Laser-induced porous graphene films from commercial polymers. Nat. Commun. 2014, 5, 5–12. 10.1038/ncomms6714. [DOI] [PMC free article] [PubMed] [Google Scholar]
- Zhang J.; Zhang C.; Sha J.; Fei H.; Li Y.; Tour J. M. Efficient Water-Splitting Electrodes Based on Laser-Induced Graphene. ACS Appl. Mater. Interfaces 2017, 9 (32), 26840–26847. 10.1021/acsami.7b06727. [DOI] [PubMed] [Google Scholar]
- Ye R.; Liu Y.; Peng Z.; Wang T.; Jalilov A. S.; Yakobson B. I.; Wei S. H.; Tour J. M. High performance electrocatalytic reaction of hydrogen and oxygen on ruthenium nanoclusters. ACS Appl. Mater. Interfaces 2017, 9 (4), 3785–3791. 10.1021/acsami.6b15725. [DOI] [PubMed] [Google Scholar]
- Duy L. X.; Peng Z.; Li Y.; Zhang J.; Ji Y.; Tour J. M. Laser-induced graphene fibers. Carbon 2018, 126, 472–479. 10.1016/j.carbon.2017.10.036. [DOI] [Google Scholar]
- Jeong S. Y.; Ma Y. W.; Lee J. U.; Je G. J.; Shin B. S. Flexible and highly sensitive strain sensor based on laser-induced graphene pattern fabricated by 355 nm pulsed laser. Sensors (Switzerland) 2019, 19 (22), 4867. 10.3390/s19224867. [DOI] [PMC free article] [PubMed] [Google Scholar]
- Zhu J.; Huang X.; Song W. Physical and Chemical Sensors on the Basis of Laser-Induced Graphene: Mechanisms, Applications, and Perspectives. ACS Nano 2021, 15 (12), 18708–18741. 10.1021/acsnano.1c05806. [DOI] [PubMed] [Google Scholar]
- Wang F.; Wang K.; Zheng B.; Dong X.; Mei X.; Lv J.; Duan W.; Wang W. Laser-induced graphene: preparation, functionalization and applications. Materials Technology 2018, 33 (5), 340–356. 10.1080/10667857.2018.1447265. [DOI] [Google Scholar]
- Alhajji E.; Zhang F.; Alshareef H. N. Status and Prospects of Laser-Induced Graphene for Battery Applications. Energy Technology 2021, 9 (10), 1–15. 10.1002/ente.202100454. [DOI] [Google Scholar]
- Cheng L.; Guo W.; Cao X.; Dou Y.; Huang L.; Song Y.; Su J.; Zeng Z.; Ye R. Laser-induced graphene for environmental applications: Progress and opportunities. Materials Chemistry Frontiers 2021, 5 (13), 4874–4891. 10.1039/D1QM00437A. [DOI] [Google Scholar]
- Vivaldi F. M.; Dallinger A.; Bonini A.; Poma N.; Sembranti L.; Biagini D.; Salvo P.; Greco F.; Di Francesco F. Three-Dimensional (3D) Laser-Induced Graphene: Structure, Properties, and Application to Chemical Sensing. ACS Appl. Mater. Interfaces 2021, 13 (26), 30245–30260. 10.1021/acsami.1c05614. [DOI] [PMC free article] [PubMed] [Google Scholar]
- Ye R.; James D. K.; Tour J. M. Laser-Induced Graphene: From Discovery to Translation. Adv. Mater. 2019, 31 (1), 1–15. 10.1002/adma.201803621. [DOI] [PubMed] [Google Scholar]
- Serqueira D. S.; Fernandes D. M.; Cunha R. R.; Squissato A. L.; Santos D. Q.; Richter E. M.; Munoz R. A. A. Influence of blending soybean, sunflower, colza, corn, cottonseed, and residual cooking oil methyl biodiesels on the oxidation stability. Fuel 2014, 118, 16–20. 10.1016/j.fuel.2013.10.028. [DOI] [Google Scholar]
- Liu M.; Wu J. N.; Cheng H. Y. Effects of laser processing parameters on properties of laser-induced graphene by irradiating CO2 laser on polyimide. Science China Technological Sciences 2022, 65 (1), 41–52. 10.1007/s11431-021-1918-8. [DOI] [Google Scholar]
- Bard A. J.; Faulkner L. R.. Electrochemical Methods - Fundamentals and Applications, 2nd. ed.; John Wiley & Sons, Inc.: Austin, TX, 2001. [Google Scholar]
- Matias T. A.; de Faria L. V.; Rocha R. G.; Silva M. N. T.; Nossol E.; Richter E. M.; Muñoz R. A. A. Prussian blue-modified laser-induced graphene platforms for detection of hydrogen peroxide. Microchimica Acta 2022, 189 (5), 1–9. 10.1007/s00604-022-05295-5. [DOI] [PubMed] [Google Scholar]
- Inoque N. I. G.; Araújo D. A. G.; de Lima D. M.; Sousa R. M. F.; Paixão T. R. L. C.; Munoz R. A. A. Rapid Quantification of Antioxidant Capacity in Tea Using Laser-Induced Graphene Electrodes. ACS Food Science and Technology 2024, 4 (6), 1589–1597. 10.1021/acsfoodscitech.4c00265. [DOI] [Google Scholar]
- Ferreira D. C. M.; Inoque N. I. G.; Tanaka A. A.; Dantas L. M. F.; Muñoz R. A. A.; da Silva I. S. Lab-made CO2 laser-engraved electrochemical sensors for ivermectin determination. Analytical Methods 2024, 16 (25), 4136–4142. 10.1039/D4AY00414K. [DOI] [PubMed] [Google Scholar]
- Matias T. A.; Rocha R. G.; Faria L. V.; Richter E. M.; Munoz R. A. A. Infrared Laser-Induced Graphene Sensor for Tyrosine Detection. ChemElectroChem. 2022, 9 (14), e202300140. 10.1002/celc.202200339. [DOI] [Google Scholar]
- Costa W. R. P.; Rocha R. G.; de Faria L. V.; Matias T. A.; Ramos D. L. O.; Dias A. G. C.; Fernandes G. L.; Richter E. M.; Muñoz R. A. A. Affordable equipment to fabricate laser-induced graphene electrodes for portable electrochemical sensing. Microchimica Acta 2022, 189 (5), 185. 10.1007/s00604-022-05294-6. [DOI] [PubMed] [Google Scholar]
- Le T. S. D.; Phan H. P.; Kwon S.; Park S.; Jung Y.; Min J.; Chun B. J.; Yoon H.; Ko S. H.; Kim S. W.; Kim Y. J. Recent Advances in Laser-Induced Graphene: Mechanism, Fabrication, Properties, and Applications in Flexible Electronics. Adv. Funct. Mater. 2022, 32 (48), 2205158. 10.1002/adfm.202205158. [DOI] [Google Scholar]
- Dong Y.; Rismiller S. C.; Lin J. Molecular dynamic simulation of layered graphene clusters formation from polyimides under extreme conditions. Carbon 2016, 104, 47–55. 10.1016/j.carbon.2016.03.050. [DOI] [Google Scholar]
- Peng Z.; Lin J.; Ye R.; Samuel E. L. G.; Tour J. M. Flexible and stackable laser-induced graphene supercapacitors. ACS Appl. Mater. Interfaces 2015, 7 (5), 3414–3419. 10.1021/am509065d. [DOI] [PubMed] [Google Scholar]
- Muzyka K.; Xu G. Laser-induced Graphene in Facts, Numbers, and Notes in View of Electroanalytical Applications: A Review. Electroanalysis 2022, 574–589. 10.1002/elan.202100425. [DOI] [Google Scholar]
- Selcuk O.; Unal D. N.; Kanbes Dindar Ç.; Süslü İ.; Uslu B. Electrochemical determination of phosphodiesterase-3 enzyme inhibitor drug Milrinone with nanodiamond modified paste electrode. Microchemical Journal 2022, 181, 107720. 10.1016/j.microc.2022.107720. [DOI] [Google Scholar]
- Balram D.; Lian K. Y.; Sebastian N.; Rasana N. Ultrasensitive detection of cytotoxic food preservative tert-butylhydroquinone using 3D cupric oxide nanoflowers embedded functionalized carbon nanotubes. Journal of Hazardous Materials 2021, 406, 124792. 10.1016/j.jhazmat.2020.124792. [DOI] [PubMed] [Google Scholar]
- Tapia Mattar V.; Gavilán-Arriazu E. M.; Rodriguez S. A. Study of Electrochemical Mechanisms Using Computational Simulations: Application to Phenol Butylated Hydroxyanisole. J. Chem. Educ. 2022, 99 (2), 1044–1052. 10.1021/acs.jchemed.1c01230. [DOI] [Google Scholar]
- Cardoso R. M.; Kalinke C.; Rocha R. G.; dos Santos P. L.; Rocha D. P.; Oliveira P. R.; Janegitz B. C.; Bonacin J. A.; Richter E. M.; Munoz R. A. A. Additive-manufactured (3D-printed) electrochemical sensors: A critical review. Anal. Chim. Acta 2020, 1118 (xxxx), 73–91. 10.1016/j.aca.2020.03.028. [DOI] [PubMed] [Google Scholar]
- Jamil S.; Janjua M. R. S. A.; Khan S. R. Synthesis of Self-Assembled Co3O4 Nanoparticles with Porous Sea Urchin-Like Morphology and their Catalytic and Electrochemical Applications. Aust. J. Chem. 2017, 70 (8), 908–916. 10.1071/CH16694. [DOI] [Google Scholar]
- Pacheco W. F.; Semaan F. S.; Almeida V. G. K.; Ritta A. G. S. L.; Aucelio R. Q. Voltammetry: A brief review about concepts. Revista Virtual de Quimica 2013, 5 (4), 516–537. 10.5935/1984-6835.20130040. [DOI] [Google Scholar]
- Fernandes D. M.; Squissato A. L.; Lima A. F.; Richter E. M.; Munoz R. A. A. Corrosive character of Moringa oleifera Lam biodiesel exposed to carbon steel under simulated storage conditions. Renewable Energy 2019, 139, 1263–1271. 10.1016/j.renene.2019.03.034. [DOI] [Google Scholar]
- João A. F.; Squissato A. L.; Richter E. M.; Muñoz R. A. A. Additive-manufactured sensors for biofuel analysis: copper determination in bioethanol using a 3D-printed carbon black/polylactic electrode. Anal. Bioanal. Chem. 2020, 412 (12), 2755–2762. 10.1007/s00216-020-02513-y. [DOI] [PubMed] [Google Scholar]
- Sánchez R.; Sánchez C.; Lienemann C. P.; Todolí J. L. Metal and metalloid determination in biodiesel and bioethanol. Journal of Analytical Atomic Spectrometry 2015, 30 (1), 64–101. 10.1039/C4JA00202D. [DOI] [Google Scholar]
- Barela P. S.; Souza J. P.; Pereira J. S. F.; Marques J. C.; Müller E. I.; Moraes D. P. Development of a microwave-assisted ultraviolet digestion method for biodiesel and subsequent trace elements determination by SF-ICP-MS. Journal of Analytical Atomic Spectrometry 2018, 33 (6), 1049–1056. 10.1039/C8JA00095F. [DOI] [Google Scholar]
- Tomášková M.; Chýlková J.; Šelešovská R.; Janíková L. Voltammetric method for rapid determination of propyl gallate and its application for monitoring of biofuels quality. Monatshefte fur Chemie 2017, 148 (3), 457–461. 10.1007/s00706-016-1860-1. [DOI] [Google Scholar]
- Eivazihollagh A.; Svanedal I.; Edlund H.; Norgren M. On chelating surfactants: Molecular perspectives and application prospects. J. Mol. Liq. 2019, 278, 688–705. 10.1016/j.molliq.2019.01.076. [DOI] [Google Scholar]
- Zhang K.; Dai Z.; Zhang W.; Gao Q.; Dai Y.; Xia F.; Zhang X. EDTA-based adsorbents for the removal of metal ions in wastewater. Coord. Chem. Rev. 2021, 434, 213809. 10.1016/j.ccr.2021.213809. [DOI] [Google Scholar]
- He H.; Wu D.; Zhao L.; Luo C.; Dai C.; Zhang Y. Sequestration of chelated copper by structural Fe(II): Reductive decomplexation and transformation of CuII-EDTA. Journal of Hazardous Materials 2016, 309, 116–125. 10.1016/j.jhazmat.2016.02.009. [DOI] [PubMed] [Google Scholar]
- Song P.; Sun C.; Wang J.; Ai S.; Dong S.; Sun J.; Sun S. Efficient removal of Cu-EDTA complexes from wastewater by combined electrooxidation and electrocoagulation process: Performance and mechanism study. Chemosphere 2022, 287 (P1), 131971. 10.1016/j.chemosphere.2021.131971. [DOI] [PubMed] [Google Scholar]
- Wu L.; Wang H.; Lan H.; Liu H.; Qu J. Adsorption of Cu(II)-EDTA chelates on tri-ammonium-functionalized mesoporous silica from aqueous solution. Sep. Purif. Technol. 2013, 117, 118–123. 10.1016/j.seppur.2013.06.016. [DOI] [Google Scholar]
- Instituto Nacional de Metrologia Qualidade e Tecnologia (INMETRO) . Orientação sobre validação de métodos analíticos DOQ-CGCRE-008, revisão 08; 2020.
- Schaumlöffel L. de S.; Dambros J. W. V.; Bolognese Fernandes P. R.; Gutterres M.; Piatnicki C. M. S. Direct and simultaneous determination of four phenolic antioxidants in biodiesel using differential pulse voltammetry assisted by artificial neural networks and variable selection by decision trees. Fuel 2019, 236, 803–810. 10.1016/j.fuel.2018.09.048. [DOI] [Google Scholar]
- Caramit R. P.; De Freitas Andrade A. G.; Gomes De Souza J. B.; De Araujo T. A.; Viana L. H.; Trindade M. A. G.; Ferreira V. S. A new voltammetric method for the simultaneous determination of the antioxidants TBHQ and BHA in biodiesel using multi-walled carbon nanotube screen-printed electrodes. Fuel 2013, 105, 306–313. 10.1016/j.fuel.2012.06.062. [DOI] [Google Scholar]
- De Araujo T. A.; Barbosa A. M. J.; Viana L. H.; Ferreira V. S. Electroanalytical determination of TBHQ, a synthetic antioxidant, in soybean biodiesel samples. Fuel 2011, 90 (2), 707–712. 10.1016/j.fuel.2010.09.022. [DOI] [Google Scholar]
- Hoffmann Da Rocha A. A.; Casagrande M.; De Souza Schaumlöffel L.; Da Silva Y. P.; Sartori Piatnicki C. M. Simultaneous Voltammetric Determination of tert-Butylhydroquinone and Propyl Gallate in Biodiesel-Ethanol at a Pt Ultramicroelectrode. Energy Fuels 2017, 31 (7), 7076–7081. 10.1021/acs.energyfuels.7b00204. [DOI] [Google Scholar]
Associated Data
This section collects any data citations, data availability statements, or supplementary materials included in this article.