

Abstract
Objectives:
To assess brain development in living fetuses with Down syndrome (DS) by biometric measurements on fetal brain magnetic resonance images (MRI).
Methods:
We scanned 10 MRIs of fetuses with confirmed trisomy 21 at birth and 12 control fetal MRIs without any detected anomalies. Fetal brain MRIs were analyzed using 14 fetal brain and skull biometric parameters. We compared measures between DS and controls in both raw MRIs and motion-corrected and anterior-posterior commissure-aligned images.
Results:
In the reconstructed images, the measured values of the height of the cerebellar vermis (HV) and anteroposterior diameter of the cerebellar vermis (APDV) were significantly smaller, and the anteroposterior diameter of the fourth ventricle (APDF) was significantly larger in fetuses with DS than controls. In the raw MRIs, the measured values of the right lateral ventricle were significantly larger in fetuses with DS than in controls. Logistic regression analyses revealed that a new parameter, the cerebellar-to-fourth-ventricle ratio (i.e., (APDV * Height of the vermis)/APDF), was significantly smaller in fetuses with DS than controls and was the most predictive to distinguish between fetuses with DS and controls.
Conclusions:
The study revealed that fetuses with DS have smaller cerebellums and larger fourth ventricles compared to the controls.
1 |. INTRODUCTION
Down syndrome is the most common chromosomal cause of intellectual disability with an incidence of one out of 700 live births in the United States.1,2 Individuals with DS present with global developmental delay, especially with varying degrees of impairment in language and memory. Unique developmental abnormalities of children with DS originate in the fetal period. The understanding of the anatomical brain abnormalities in DS has mostly come from fetal autopsies, manifested as a grossly reduced brain weight3 and histological changes of reduced neurogenesis and impaired neuronal cell differentiation.4 Knowledge from living fetuses with DS is scarce and comes from sonographic analysis. Sonographic biometric studies, most commonly used in clinical practice, showed shortened frontal lobe and cerebellar hypoplasia in second trimester fetuses with DS.5,6
In the past few decades, the introduction of fetal MRI has provided additional and novel anatomical brain developmental features. Development of quantitative fetal MRI has allowed the recognition of subtle anatomical changes in the brain.7 Our team and others conducted post-acquisition volumetric analysis of fetal brain MRIs in DS and found reduced overall cerebral and cerebellar growth trajectories compared to the typically developing fetuses.8,9 Furthermore, we conducted regional cortical folding pattern analysis that detected a region-specific reduction in bilateral Sylvian fissures, the right central, and parieto-central sulcal depth and increased depth in the left supratemporal sulcus in regions associated with specifically impaired regional functionality in fetuses with DS.10
While advanced post-acquisition quantitative analyses of fetal brain MRIs provide precise and detailed anatomical features of the developing fetal brain, the analytic process is laborious and time consuming. An automated processing method is in development,11 yet additional approaches are needed to meet the daily clinical time constraints in prenatal diagnosis and counseling.
Biometric MRI measurement is gaining widespread attention as a valid measure to evaluate fetal brain development.12-15 It is less labor-intensive and provides quantitative information on fetal brain development. It requires a shorter processing time; thus, the results can be reported within the time window of patient care. Although biometric measurement is well developed in fetal sonography, MRI has the potential advantage of a high spatial resolution that enables more accurate measurements of the fetal brain.14,16
In this study, we aimed to assess the detailed biometric quantitative features of developing fetal brains in DS by analyzing fetal brain MRIs.
2 |. MATERIALS AND METHODS
2.1 |. Subjects
Participants were identified and recruited at the Obstetric clinic at Tufts Medical Center from 4/2013 to 3/2016 with written informed consent. The study was approved by the Institutional Review Board (protocol #10214).
Fetuses with DS were screened with non-invasive prenatal genetic screening and/or diagnosed with fetal genotyping by chorionic villus sampling or amniocentesis. The infant's karyotype was confirmed upon birth as trisomy 21. Healthy pregnant women carrying fetuses without any detected anomalies were identified as potential candidates for control imaging. No genetic testing was performed for those women. Pregnant women carrying control fetuses were recruited and offered fetal MRI without cost. We excluded multiple gestational pregnancies, other brain malformations or brain lesions, known significant maternal comorbidities, or congenital infections in both fetuses with DS and controls. We obtained written informed consent from participants carrying both cases (DS) and controls. We aimed to scan the fetal brain MRIs of consented pregnant women between 18 and 33 weeks of gestation.
2.2 |. Fetal MR imaging
Targeted fetal brain MRI studies were scanned using T2-weighted HASTE (Half-Fourier Acquisition Single-Shot Turbo Spin-Echo) MRI sequence on a Phillips 1.5 T without maternal or fetal sedation. The following parameters were used for each subject: repetition time = ~12.5 s, echo time = 180 ms, field of view = 256 mm, in-plane resolution = 1 mm, and slice thickness = 2–3 mm. The HASTE acquisition was acquired at least three times in different orthogonal orientations. The entire process took about 40–60 min and there were no complications. Screening scans of the heart and stomach were used to determine the left and right sides of the fetuses in the absence of situs inversus.
2.3 |. MRI motion correction and anterior and posterior commissure points processing
We used a motion correction method that interleaved slice-to-volume registration and a combination of novel intensity matching of acquired 2D slices and robust statistics excluding misregistered or corrupted voxels and slices.17 Based on the motion correction algorithm, fetal head motion artifacts were corrected, and then isotropic high-resolution volume images (voxel size: 0.75 × 0.75 × 0.75 [mm]) were constructed from the multiple scans. We manually aligned each subject's volume images along the anterior and posterior commissure (ACPC) points using AFNI (afni.nimh.nih.gov/afni).18
2.4 |. Biometric analysis of fetal brain
We used 14 biometric parameters that were measured in linear dimensions of the fetal brain and skull on the reconstructed MRI studies (ACPC) and the raw MRI studies (Table 1, Figure 1). These parameters reflect the growth of each part of the brain. We examined which combination of biometric measures could be a useful model for distinguishing between fetuses with DS and control fetuses. Considering the anatomical proximity and the correlation in the size of the vermis, pons, and APDF, we assessed the cerebellar-to-fourth-ventricle ratio as a new parameter (i.e., APDV * Height of the vermis (HV)/APDF). To assess the predictability of each biometric parameter for the diagnosis of fetuses with DS and controls, we constructed a logistic regression model using this index and gestational age, and then calculated its area under the curve (AUC). Fetal biometric measurements were all performed by the same researcher (R.K.).
TABLE 1.
Biometric parameters.
| Cerebral parameters | |
|---|---|
| Bone biparietal diameter (bone BPD) | Distance between the two internal tables of the skull on the coronal slice at the level of the temporal horns of the lateral ventricles. It corresponds to the greatest diameter of the skull. |
| Cerebral BPD | The greatest transversal diameter of the brain on the coronal slice at the level of the temporal horns of the lateral ventricles |
| Fronto-occipital diameter (FOD) | Distance between the extreme points of the frontal and occipital lobes on the near midline sagittal slice |
| Anteroposterior distance (APD) | Distance between the extreme points of the frontal and occipital lobes on the axial slice |
| Bone APD | The greatest diameter of the skull between two internal tables of the skull on the axial slice. |
| Length of the corpus callosum (LCC) | Length from the genu to the posterior extremity of the splenium on the midline sagittal slice |
| Cerebellar parameters | |
| Transcerebellar diameter(TCD) | The greatest diameter between the cerebellar hemispheres on the coronal slice at the level of the atria. |
| Height of the vermis (HV) | The greatest height of the vermis on the midline sagittal slice |
| Anteroposterior diameter of the vermis (APDV) | The greatest anteroposterior diameter of the vermis that goes from the median part of the fourth ventricle's roof on the midline sagittal slice. |
| Ventricle parameters | |
| Lateral diameter of the third ventricle (LDT) | Width on the coronal slice at the level of mammillary body. |
| Anteroposterior diameter of the fourth ventricle (APDF) | Width on the midline sagittal slice between the median parts of its roof and in floor. |
| Transversal diameter of the right (RV) and left (LV) lateral ventricles | Width of the lateral ventricle at an axis perpendicular to that of the ventricle, at mid-height of the ventricle on the coronal slice at the level of the atria. |
| Brainstem parameters | |
| Anteroposterior diameter of the pons (APDP) | Distance between the anterior and posterior boundaries of the pons in its widest section perpendicularly to its rostrocaudal axis. |
| Anteroposterior diameter of the medulla (APDM) | Distance between the anterior and posterior portions of the medulla, just inferiorly to the pons. |
Note: Fourteen biometric parameters were measured on fetal brain MRI.
FIGURE 1.

Biometric measurements of fetal brain. Illustration of each biometric measurement as indicated by a solid line and a dotted line. APD, anteroposterior distance; APDF, Anteroposterior diameter of the fourth ventricles; APDM, Anteroposterior diameter of the medulla; APDP, Anteroposterior diameter of the pons; APDV, Anteroposterior diameter of the vermis; BPD, Biparietal diameter; FOD, Fronto-occipital diameter; HV, Height of the vermis; LCC, Length of the corpus callosum; LDT, Lateral diameter of the third ventricle.
2.5 |. Statistical analysis
Demographic differences in maternal and gestational age between the two groups, DS and Controls, were analyzed using a two-tailed t-test. Fisher's exact tests were performed for maternal ethnicity and fetal sex. The difference between biometric measurements in Raw MRI and ACPC for fetuses with DS and control fetuses was assessed using Paired Wilcoxon Signed-Rank Tests.
Data analysis was conducted using the statistical software package Prism (version 9.3.1, GraphPad, San Diego, CA) and the R programming language (version 3.6.3, R Foundation for Statistical Computing, Vienna, Austria). We plotted each biometric measure from all participants as a function of gestational age. To examine whether the biometric measures of fetal brains were different between DS and typically developing control groups, we fit separate non-linear regression models for each group. We examined the non-linear regression model as a function of gestational age. We fitted growth curves of each biometric measure in DS and control groups using the exponential curve that fit best as in our previous volumetric study.8 The extra sum-of-squares F test was used to compare a model in which separate best-fit values for some parameters are found for each group, or a model in which those parameters are shared among groups. Statistical significance was set at 0.05. If the separated curves had a significantly better fit, the control and DS groups were determined to have distinct growth curves.
To assess the predictability of each biometric parameter for discriminating between fetuses with DS and control fetuses, we constructed a logistic regression model using this index and gestational age. We then calculated its AUC.
3 |. RESULTS
3.1 |. Subjects, MRI scans, and processing
Twenty-four pregnant women were recruited into the study. Twelve of them were carrying fetuses with DS, and 12 were carrying typically developing control fetuses. Three pregnant women carrying fetuses with DS were excluded because two fetuses died in utero, and one pregnancy was terminated before the MRI scan could be performed. Of nine pregnant women carrying a fetus with DS, one woman (DS08) volunteered for two fetal MRI scans (Table 2). Twelve pregnant women whose fetuses had no anomalies were scanned as controls. As a result, we scanned 10 fetal MRIs of fetuses with DS (mean: 30.4 weeks of gestation, SD: 5.2, range: 21.7–37.7) and 12 typically developing control fetuses (mean: 26.7 weeks of gestation, SD:5.5 range: 18.6–33.3). Maternal ages were higher in the DS group (34.6+/−4.1 years, mean+/−SD) compared with the typically developing group (29.4+/−4.2 years) (p = 0.008). Gestational ages (p = 0.124), ethnicity (p = 0.481), and fetal sex (p = 0.231) were not significantly different between the groups (Table 3). Six of the nine fetuses with DS had congenital heart disease (CHD) and underwent surgical repair after birth. Of the six fetuses with CHD, three had atrioventricular canal defects (AVCD), and three had atrial septal defects. The control fetuses had no congenital anomalies.
TABLE 2.
Demographics of fetuses with Down syndrome (DS) and typically developing controls.
| Subject number |
Ethnicity | Maternal age |
CVS/AC/postnatal karyotype |
Fetal sex |
GA of MRI |
Other anomalies | |
|---|---|---|---|---|---|---|---|
| Fetuses with down syndrome | DS-01 | White | 30 | 47,XX,+21 | F | 30.86 | None |
| DS-02 | White | 33 | 47,XY,+21 | M | 31.57 | None | |
| DS-03 | White | 30 | 47,XX,+21 | F | 29.71 | AVCD repaired after birth | |
| DS-04 | White | 42 | 47,XX,+21 | F | 35.14 | ASD repaired after birth | |
| DS-07 | White | 41 | 47,XX,+21 | F | 30.00 | AVCD repaired after birth | |
| DS-08 | White | 33 | 47,XX,+21 | F | 22.29 | ASD, mitral regurgitation, PFO repaired after birth | |
| DS-08b | White | 33 | 47,XX,+21 | F | 29.71 | ASD, mitral regurgitation, PFO repaired after birth | |
| DS-09 | White | 34 | 47,XY,+21 | M | 37.71 | AVCD repaired after birth | |
| DS-10 | White | 36 | 47,XY,+21 | M | 21.71 | Neonatal pulmonary hypertension | |
| DS-11 | White | 34 | 47,XX,+21 | F | 35.14 | None | |
| Typically developing controls | BM-10 | White | 23 | N/A | M | 20 | None |
| BM-18 | White | 30 | N/A | M | 29.57 | None | |
| BM-26 | White | 31 | N/A | M | 18.57 | None | |
| BM-28 | White | 32 | N/A | F | 22.86 | None | |
| BM-37 | Asian | 22 | N/A | F | 29.14 | None | |
| BM-38 | Asian | 33 | N/A | F | 25.57 | None | |
| BM-39 | White | 34 | N/A | M | 32 | None | |
| BM-42 | White | 30 | N/A | F | 33.29 | None | |
| BM-47 | White | 34 | N/A | M | 24.71 | None | |
| BM-54 | White | 27 | N/A | M | 19.71 | None | |
| BM-56 | White | 25 | N/A | M | 33.29 | None | |
| BM-61 | White | 32 | N/A | F | 31.86 | None |
Abbreviations: AC, amniocentesis; ASD, atrial septal defect; AVCD, atrioventricular canal defect; CVS, chorionic villi sampling; GA, gestational age; PFO, patent foramen oval.
TABLE 3.
Demographic characteristics.
| DS (n = 9) (10 MRIs) |
Control (n = 12) (12 MRIs) |
p value | |
|---|---|---|---|
| Maternal age (years)* | 34.6+/−4.1 [30–42] | 29.4+/−4.2 [22–34] | 0.008** |
| Ethnicity = White (%) | 9 (100) | 10 (83.3) | 0.481 |
| Gestational age (weeks)* | 30.4+/−5.2 [21.7–37.7] | 26.7+/−5.5 [18.6–33.3] | 0.124 |
| Fetal sex = Male (%) | 3 (33.3) | 7 (58.3) | 0.231 |
Note: Demographic characteristics of the participants. In comparing epidemiologic characteristics, maternal age was higher in fetuses with DS than in controls. * mean+/−SD [range] ** significance p-value <0.05.
Abbreviation: DS, Down syndrome.
3.2 |. MRI motion correction and ACPC points processing
All raw MR images of 10 fetuses with DS and 12 control fetuses were analyzed for biometric analyses. Motion correction and ACPC processing of MRI for one DS and two control fetuses were unsuccessful due to significant motion artifacts. As a result, we analyzed ACPC images of 9 fetuses with DS and 10 control fetuses for biometric analyses.
3.3 |. Biometric measures
Paired Wilcoxon Signed-Rank Tests with stratified sampling revealed no significant differences in biometric measurements between Raw MRI and ACPC images in each group.
Using a non-linear regression model, the following biometric measures were significantly different between the control and DS groups (Figure 2).
FIGURE 2.

Biometric measurements from the ACPC images. Non-linear regression model of biometric measurements in ACPC images. Height of the vermis (HV) and APDV were significantly smaller and APDF was significantly larger in fetuses with Down syndrome (DS) (n = 10) than in controls (n = 12).
In ACPC images, the measured values of HV (p < 0.001) and APDV (p = 0.025) were significantly smaller and those of APDF (p = 0.02) were significantly larger in fetuses with DS than control fetuses.
In raw MRIs, the measured values of the right lateral ventricle (p = 0.041) were significantly larger in fetuses with DS than in control fetuses (Figure 3).
FIGURE 3.
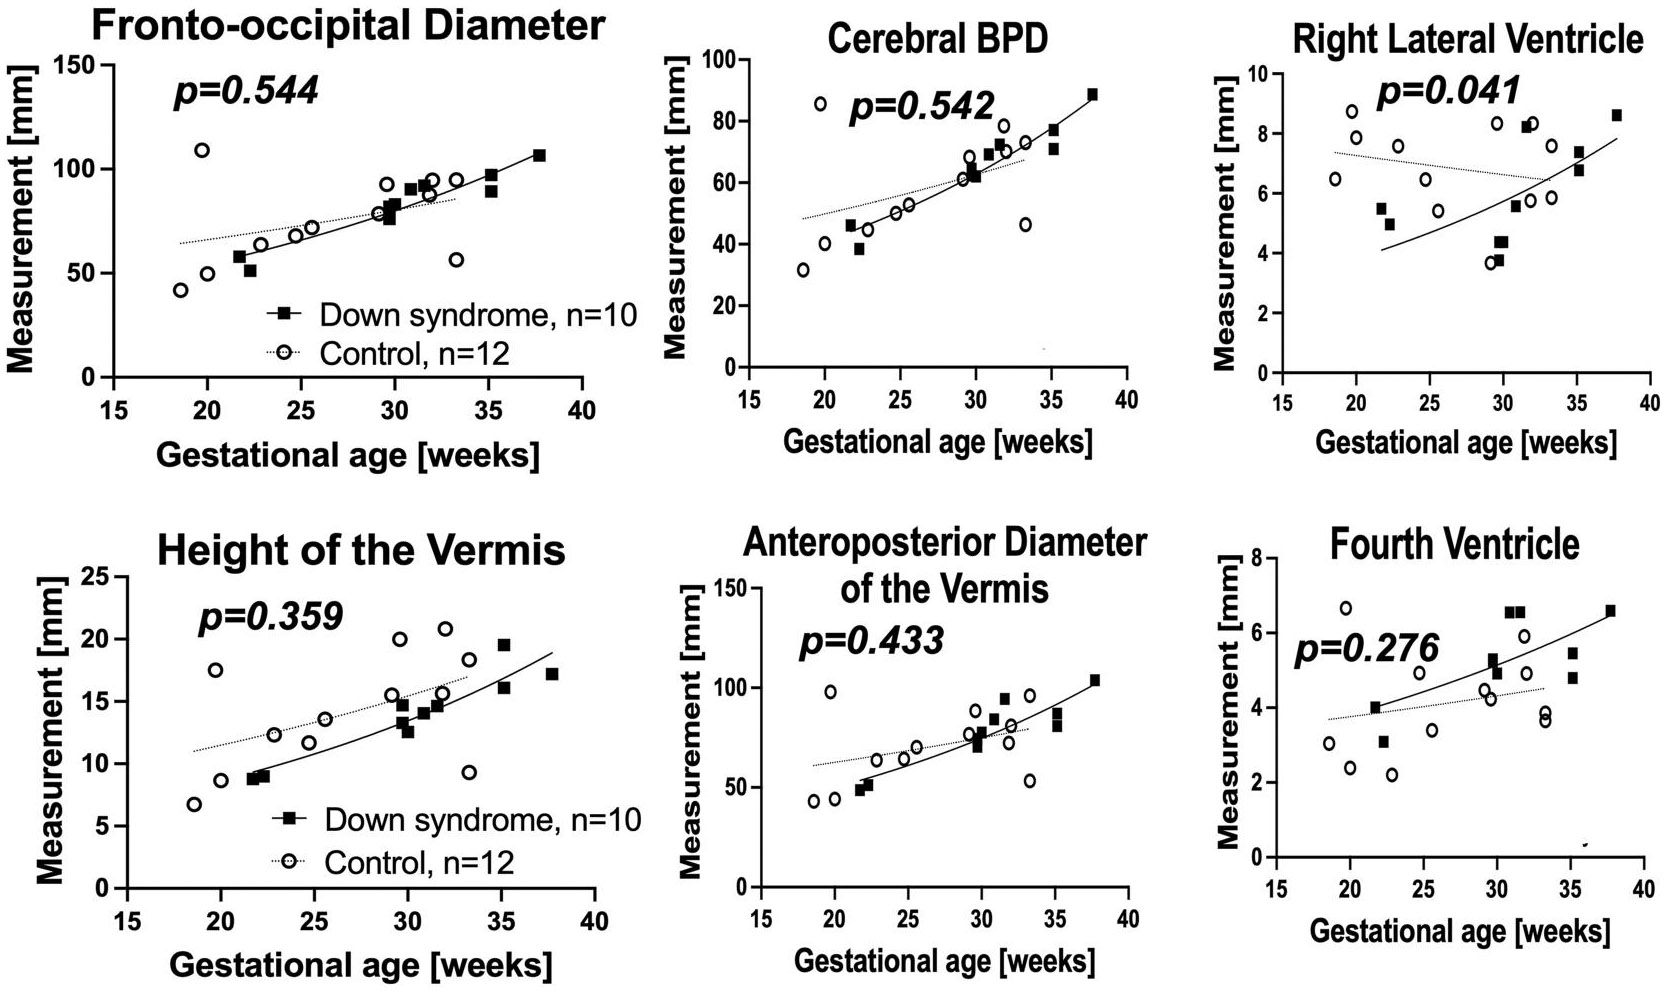
Biometric measurements from the RAW images. Non-linear regression model of biometric measurements in Raw MRI. The right lateral ventricle was significantly larger in fetuses with Down syndrome (DS).
3.4 |. Key measures characteristic of DS
The logistic regression model identified that the (APDV * HV)/APDF indices were significantly smaller in fetuses with DS than in controls (p < 0.05, AUC = 1). This ratio distinguished between fetuses with DS and control fetuses (Figure 4).
FIGURE 4.

(APDV * Height of the vermis (HV))/APDF index. As shown in the figure, the distribution of measures from the fetuses with Down syndrome (DS) was different from that from the control fetuses. (APDV * HV)/APDF indices were significantly smaller in fetuses with DS (p < 0.05, area under the curve (AUC) = 1).
4 |. DISCUSSION
In this study, we measured and compared 14 fetal brain biometric parameters between fetuses with DS and control fetuses reflecting fetal brain volumes in the period from 22 to 37 weeks of gestation using fetal brain MRIs. The measures of HV and APDV were significantly smaller, and APDF was larger in fetuses with DS than control fetuses in ACPC, reflecting altered cerebral and cerebellar/brainstem development in fetuses with DS.
This study used three-dimensionally reconstructed and ACPC-aligned images, which may have increased sensitivity to detect biometric differences between fetuses with DS and controls. Biometric measurement depends on the accurate identification of two anatomical landmarks. In sonographic imaging studies, the operator can adjust the probe position to obtain an aligned plane that enables consistent positioning of the landmarks. In contrast, fetal brain position varies among the children relative to the MRI scan planes. In raw images, it is challenging or impossible to localize two landmarks in the same plane, making biometric measurement inconsistent. Although there was no significant difference in biometric measurements between Raw MRI and ACPC imaging, the results of ACPC imaging detected more differences between fetuses with DS and controls. Therefore, ACPC alignment may be necessary to align two landmarks in the same plane.
4.1 |. Cerebral development
The differences in the non-linear regression models of bBPD, cBPD and Fronto-occipital diameter were not statistically significant. Those observations are consistent with prior fetal sonographic analysis5,6 reports that reported no significant differences in bone BPD and cerebral BPD. On the other hand, biometry of the frontal lobe size - frontothalamic distance - was found to be significantly smaller in fetuses with DS in those studies.5,6
The latest MRI studies that utilized post-acquisition regional volumetric analysis of fetal brain MRIs concluded that fetuses with DS have smaller cortical plates and subcortical and cerebellar volumes than controls.8,9 Previous fetal autopsy studies have observed smaller fetal brains in DS.3 Given that DS is associated with a smaller brain volume in children,19-21 the aberrant brain growth appears to start in the fetal period and continues through childhood.
The biometric measurements were not sensitive enough to show that fetuses with DS had smaller cerebrums as in the volumetric analysis, but the non-linear regression model did show these trends, which may lead to a significant difference in a larger study.
4.2 |. Cerebellum and brainstem development
The anteroposterior diameter of the fourth ventricle (APDF) was larger in fetuses with DS than in control fetuses. At the same time, there was no significant enlargement of the lateral or third ventricles suggestive of hydrocephalus. Isolated fourth ventricular hydrocephalus is an atypical pathology. Increased cerebrospinal fluid production or decreased absorption is an unlikely mechanism. We previously reported that the lateral ventricular or whole ventricular volumes were not significantly different between fetuses with DS and controls.8 Patkee et al. reported that fetuses with DS had lateral ventricular enlargement but no significant extra cerebrospinal fluid.9
We hypothesize that hypoplasia of the surrounding brain parenchyma - cerebellar vermis and pons may indirectly affect the larger APDF. Although no significant differences were observed in the anteroposterior diameter of the pons (APDP) in fetuses with DS, the anteroposterior diameter of the cerebellar vermis (APDV) was significantly smaller in fetuses with DS. In some studies, cerebellar volumes, TCD, and vermis were smaller in the fetuses with DS.6,8,9,22 Therefore, biometric measurement of the vermis is consistent with a volumetric study.
Little is known about the brainstem anatomy in fetuses and children with DS. Haken et al. reported that in an ultrasound study, fetuses with DS tended to have smaller pons and cerebellar vermises. There was a correlation between the pons and cerebellar vermis hypoplasia.23 Fujii et al. indicated that children, including neonates with DS, had smaller pons in an MRI study.24
Since we hypothesized that the enlargement of the fourth ventricle correlates with the hypoplasia of the vermis and pons, we examined combinations of biometric parameters that can distinguish fetuses with DS from controls. (APDV * HV)/APDF indices were significantly smaller in fetuses with DS than control fetuses (p < 0.05, AUC = 1). This result suggests that the enlargement of the fourth ventricle is a recognizable feature in fetuses with DS. The visual recognition of the enlargement of the fourth ventricle may be easier than that of the hypoplastic vermis or pons because of their small sizes in the fetus.
4.3 |. Strengths
The strengths of this study include the fact that the brains of living fetuses with DS were imaged and analyzed, and that typically developing control fetuses were included. Both sexes were studied. We created a list of 14 different biometric parameters that resulted in a more sensitive detection of differences in brain development during gestation than in sonographic examinations and prior MRI studies.
4.4 |. Limitations
The limitations of this study included the small sample size and the wide range of gestational weeks. Although there were no significant differences, MRIs of fetuses with DS were scanned at a later gestational age (30.4 ± 5.2 weeks) compared with controls (26.7 ± 5.5 weeks). More precise matching of gestational ages between the groups could improve the sensitivity of the study.
More than 50% of neonates with DS have CHD. The most common of these is atrioventricular canal defect (AVCD), followed by ventricular septal defect (VSD).25-27 In this study, was found in six of the nine fetuses with DS, of which AVCD and VSD were found in equal numbers. Fetuses with CHD have been reported to have less cerebral, cerebellum and brainstem volume in MRI and sonographic studies.28-30 In this study, we did not have sufficient subject numbers to conduct subgroup analysis to assess specific impacts of CHD on fetal brain growth in DS, which would be the subject of future larger scale study.
Although the measurements were taken twice on the same individual, they were treated as separate data and each was used in the analysis. The effect of data duplication should be considered. It is more desirable to be able to measure twice in other patients.
A single examiner manually conducted biometric measurements; however, to make them more objective, it is desirable to perform the measurements with multiple individuals.
While we proved the feasibility of fetal brain MRI biometric measures, other tools can also be used to elucidate the unique developmental features of fetuses with DS. Fetal sonographic examinations are easier to acquire and enable observations over multiple time points. With sonography, it is easier to adjust the cross-sectional area, and it is not easily affected by motion artifacts. Therefore, it is desirable to verify the results with sonographic examination to see if equivalent results can be obtained.
Further studies are needed to confirm the relationship between fetal biometric measures and postnatal imaging data and the neurodevelopmental prognosis of the participants.
5 |. CONCLUSIONS
Our biometric measures of fetal brain MRIs revealed that fetuses with DS have smaller cerebellar vermis and larger fourth ventricles compared with controls. Such differences were more sensitively detected in motion-corrected, aligned, and reconstructed MR images than in raw MR images. The smaller vermis could be the most characteristic morphological change in fetuses with DS. Smaller cerebellar-to-fourth-ventricle ratios may be a novel fetal brain feature that is characteristic of DS. Further studies are needed to validate this finding, especially by performing MRI and fetal sonographic measurements matched for gestational age.
Key points.
What is already known about this topic?
The understanding of the anatomical brain abnormalities in Down syndrome (DS) has come mostly from fetal autopsies, demonstrated by a grossly reduced brain weight.
Knowledge from living fetuses with DS is scarce and comes mainly from sonographic analyses.
Biometric MRI measurement is gaining widespread acceptance to evaluate fetal brain development.
What does this study add?
Our biometric measures revealed that fetuses with DS have smaller cerebellums and larger fourth ventricles compared with controls.
Smaller cerebellar-to-fourth-ventricle ratios may be a novel fetal brain feature that is characteristic of DS.
ACKNOWLEDGMENTS
The authors would like to thank Michael Stanley, Annie Felhofer, Jiyeon Janice Jang, and Esther Muradov for their help with the post-acquisition segmentation of fetal brain MRI, and Drs Ada Taymoori and Vidya Iyer for helping identification and recruitment of the participants. NICHD K23 HD079605, Jerome Lejeune Foundation, Susan Saltonstall Fund (T.T.)
Funding information
Eunice Kennedy Shriver National Institute of Child Health and Human Development, Grant/Award Number: K23 HD079605; Susan Saltonstall Fund; Jerome Lejeune Foundation
Footnotes
CONFLICT OF INTEREST STATEMENT
The authors declare that they have no conflicts of interest.
DATA AVAILABILITY STATEMENT
The data that support the findings of this study are available from the corresponding author upon reasonable request.
REFERENCES
- 1.DeGraaf G, Buckley F, Skotko BG. Estimates of the live births, natural losses, and elective terminations with Down syndrome in the United States. Am J Med Genet. 2015;167A(4):756–767. 10.1002/ajmg.a.37001 [DOI] [PubMed] [Google Scholar]
- 2.DeGraaf G, Buckley F, Dever J, Skotko BG. Estimation of live birth and population prevalence of Down syndrome in nine U.S. states. Am J Med Genet. 2017;173(10):2710–2719. 10.1002/ajmg.a.38402 [DOI] [PubMed] [Google Scholar]
- 3.Guihard-Costa A-M, Khung S, Delbecque K, Ménez F, Delezoide A-L Biometry of face and brain in fetuses with trisomy 21. Pediatr Res. 2006;59(1):33–38. 10.1203/01.pdr.0000190580.88391.9a [DOI] [PubMed] [Google Scholar]
- 4.Guidi S, Bonasoni P, Ceccarelli C, et al. Neurogenesis impairment and increased cell death reduce total neuron number in the hippocampal region of fetuses with Down syndrome. Brain Pathol. 2008;18(2):180–197. 10.1111/j.1750-3639.2007.00113.x [DOI] [PMC free article] [PubMed] [Google Scholar]
- 5.Winter TC, Reichman JA, Luna JA, et al. Frontal lobe shortening in second-trimester fetuses with trisomy 21: usefulness as a US marker. Radiology. 1998;207(1):215–222. 10.1148/radiology.207.1.9530318 [DOI] [PubMed] [Google Scholar]
- 6.Winter TC, Ostrovsky AA, Komarniski CA, Uhrich SB. Cerebellar and frontal lobe hypoplasia in fetuses with trisomy 21: usefulness as combined US markers. Radiology. 2000;214(2):533–538. 10.1148/radiology.214.2.r00fe40533 [DOI] [PubMed] [Google Scholar]
- 7.Clouchoux C, Guizard N, Evans AC, du Plessis AJ, Limperopoulos C. Normative fetal brain growth by quantitative in vivo magnetic resonance imaging. Am J Obstet Gynecol. 2012;206(2):173–173.e8. 10.1016/j.ajog.2011.10.002 [DOI] [PubMed] [Google Scholar]
- 8.Tarui T, Im K, Madan N, et al. Quantitative MRI analyses of regional brain growth in living fetuses with Down syndrome. Cerebr Cortex. 2020;30(1):382–390. 10.1093/cercor/bhz094 [DOI] [PMC free article] [PubMed] [Google Scholar]
- 9.Patkee PA, Baburamani AA, Kyriakopoulou V, et al. Early alterations in cortical and cerebellar regional brain growth in Down Syndrome: an in vivo fetal and neonatal MRI assessment. Neuroimage Clinic. 2020;25:102139. 10.1016/j.nicl.2019.102139 [DOI] [PMC free article] [PubMed] [Google Scholar]
- 10.Yun HJ, Perez JDR, Sosa P, et al. Regional Alterations in Cortical Sulcal Depth in Living Fetuses with Down Syndrome; 2021. Cereb Cortex [Internet]. [cited 2020 Dec 5];https://academic.oup.com/cercor/advance-article/doi/10.1093/cercor/bhaa255/5906900 [DOI] [PMC free article] [PubMed] [Google Scholar]
- 11.Hong J, Yun HJ, Park G, et al. Fetal cortical plate segmentation using fully convolutional networks with multiple plane aggregation. Front Neurosci. 2020;14:591683. 10.3389/fnins.2020.591683 [DOI] [PMC free article] [PubMed] [Google Scholar]
- 12.Tilea B, Alberti C, Adamsbaum C, et al. Cerebral biometry in fetal magnetic resonance imaging: new reference data. Ultrasound Obstet Gynecol. 2009;33(2):173–181. 10.1002/uog.6276 [DOI] [PubMed] [Google Scholar]
- 13.Tarui T, Khwaja OS, Estroff JA, Robinson JN, Gregas MC, Grant PE. Altered fetal cerebral and cerebellar development in twin-twin transfusion syndrome. AJNR Am J Neuroradiol. 2012;33(6):1121–1126. 10.3174/ajnr.a2922 [DOI] [PMC free article] [PubMed] [Google Scholar]
- 14.Gafner M, Fried S, Gosher N, et al. Fetal brain biometry: is there an agreement among ultrasound, MRI and the measurements at birth? Eur J Radiol. 2020;133:109369. 10.1016/j.ejrad.2020.109369 [DOI] [PubMed] [Google Scholar]
- 15.Gafner M, Yagel I, Fried S, Ezra O, Bar-Yosef O, Katorza E. Fetal brain biometry in isolated mega cisterna magna: MRI and US study. J Matern Fetal Neonatal Med. 2022;35(21):4199–4207. 10.1080/14767058.2020.1849094 [DOI] [PubMed] [Google Scholar]
- 16.Recio Rodríguez M, Andreu-Vázquez C, Thuissard-Vasallo IJ, et al. Real-life diagnostic accuracy of MRI in prenatal diagnosis. Radiol Res Pract. 2020;2020:4085349–4085412. 10.1155/2020/4085349 [DOI] [PMC free article] [PubMed] [Google Scholar]
- 17.Kuklisova-Murgasova M, Quaghebeur G, Rutherford MA, Hajnal JV, Schnabel JA. Reconstruction of fetal brain MRI with intensity matching and complete outlier removal. Med Image Anal. 2012;16(8):1550–1564. 10.1016/j.media.2012.07.004 [DOI] [PMC free article] [PubMed] [Google Scholar]
- 18.Cox RW. AFNI: what a long strange trip it‘s been. NeuroImage. 2012;62(2):743–747. 10.1016/j.neuroimage.2011.08.056 [DOI] [PMC free article] [PubMed] [Google Scholar]
- 19.Carducci F, Onorati P, Condoluci C, et al. Whole-brain voxel-based morphometry study of children and adolescents with Down syndrome. Funct Neurol. 2013;28:19–28. [PMC free article] [PubMed] [Google Scholar]
- 20.Pinter JD, Eliez S, Schmitt JE, Capone GT, Reiss AL. Neuroanatomy of down’s syndrome: a high-resolution MRI study. Aust J Pharm. 2001;158(10):1659–1665. 10.1176/appi.ajp.158.10.1659 [DOI] [PubMed] [Google Scholar]
- 21.Smigielska-Kuzia J, Boćkowski L, Sobaniec W, et al. A Volumetric Magnetic Resonance Imaging Study of Brain Structures in Children with Down Syndrome [Internet]. Neurologia I Neurochirurgia Polska; 2011. [cited 2020 Dec 5];https://pubmed.ncbi.nlm.nih.gov/22101997/ [DOI] [PubMed] [Google Scholar]
- 22.Hatab MR, Kamourieh SW, Twickler DM. MR volume of the fetal cerebellum in relation to growth. J Magn Reson Imag. 2008;27(4):840–845. 10.1002/jmri.21290 [DOI] [PubMed] [Google Scholar]
- 23.Erenel H, Madazli R. Pons anteroposterior and cerebellar vermis craniocaudal diameters in fetuses with Down syndrome. J Ultrasound Med. 2021;40(1):123–128. [Internet]. n/a. https://onlinelibrary.wiley.com/doi/abs/10.1002/jum.15382 [DOI] [PubMed] [Google Scholar]
- 24.Fujii Y, Aida N, Niwa T, Enokizono M, Nozawa K, Inoue T. A small pons as a characteristic finding in Down syndrome: a quantitative MRI study. Brain Dev. 2017;39(4):298–305. 10.1016/j.braindev.2016.10.016 [DOI] [PubMed] [Google Scholar]
- 25.Asim A, Kumar A, Muthuswamy S, Jain S, Agarwal S. Down syndrome: an insight of the disease. J Biomed Sci. 2015;22(1):41. 10.1186/s12929-015-0138-y [DOI] [PMC free article] [PubMed] [Google Scholar]
- 26.Bergström S, Carr H, Petersson G, et al. Trends in congenital heart defects in infants with Down syndrome. Pediatrics. 2016;138(1):e20160123. 10.1542/peds.2016-0123 [DOI] [PubMed] [Google Scholar]
- 27.Visootsak J, Mahle WT, Kirshbom PM, et al. Neurodevelopmental outcomes in children with Down syndrome and congenital heart defects. Am J Med Genet. 2011;155A(11):2688–2691. 10.1002/ajmg.a.34252 [DOI] [PMC free article] [PubMed] [Google Scholar]
- 28.Ren J-Y, Zhu M, Dong S-Z Three-dimensional volumetric magnetic resonance imaging detects early alterations of the brain growth in fetuses with congenital heart disease. J Magn Res on Imag. 2021;54(1):263–272. 10.1002/jmri.27526 [DOI] [PubMed] [Google Scholar]
- 29.Dovjak GO, Hausmaninger G, Zalewski T, et al. Brainstem and cerebellar volumes at magnetic resonance imaging are smaller in fetuses with congenital heart disease. Am J Obstet Gynecol. 2022;227(2):282.e1–282.e15. 10.1016/j.ajog.2022.03.030 [DOI] [PubMed] [Google Scholar]
- 30.Griffiths PD, Mousa HA, Finney C, et al. An integrated in utero MR method for assessing structural brain abnormalities and measuring intracranial volumes in fetuses with congenital heart disease: results of a prospective case-control feasibility study. Neuroradiology. 2019;61(5):603–611. 10.1007/s00234-019-02184-2 [DOI] [PMC free article] [PubMed] [Google Scholar]
Associated Data
This section collects any data citations, data availability statements, or supplementary materials included in this article.
Data Availability Statement
The data that support the findings of this study are available from the corresponding author upon reasonable request.