Abstract
The phosphorylation of a previously uncharacterized protein of apparent Mr ≈ 140,000 was found to be increased when rat adipocytes were incubated with insulin. The sequences of peptides generated by digesting the protein with trypsin matched perfectly with sequences in mouse lipin. Lipin is the product of the gene that is mutated in fatty liver dystrophy (fld) mice [Peterfy, M., Phan, J., Xu, P. & Reue, K (2001) Nat. Genet. 27, 121–124], which exhibit several phenotypic abnormalities including hyperlipidemia, defects in adipocyte differentiation, impaired glucose tolerance, and slow growth. When immunoblots were prepared with lipin antibodies, both endogenous adipocyte lipin and recombinant lipin overexpressed in HEK293 cells appeared as bands ranging in apparent Mr from 120,000 to 140,000. Incubating adipocytes with insulin decreased the electrophoretic mobility and stimulated the phosphorylation of both Ser and Thr residues in lipin. The effects of insulin were abolished by inhibitors of phosphatidylinositol 3-OH kinase, and by rapamycin, a specific inhibitor of the mammalian target of rapamcyin (mTOR). The inhibition by rapamycin was blocked by FK506, which competitively inhibits those effects of rapamycin that are mediated by inhibition of mTOR. Moreover, amino acids, which activate mTOR, mimicked insulin by increasing lipin phosphorylation in a rapamycin-sensitive manner. Thus, lipin represents a target of the mTOR pathway, and potentially links this nutrient-sensing pathway to adipocyte development.
The actions of insulin are mediated by phosphorylation cascades, all of which begin with the insulin receptor, involve kinase and phosphatase intermediates, and culminate in changes in the phosphorylation of downstream targets (1). Studies conducted with 32P-labeled fat cells were instrumental in establishing the importance of protein phosphorylation in these cascades. The results obtained yielded the first evidence of insulin-stimulated protein phosphorylation (2–4), and the realization that the phosphorylated proteins were likely to represent important downstream targets of insulin provided the impetus for purifying and identifying the proteins. As a result, the identities of most of the prominent insulin-stimulated phosphoproteins in adipocytes are known. However, several of the less intensely labeled proteins remain to be identified.
Activation of phosphatidylinositol 3-OH kinase (PI3-kinase) is central to insulin-stimulated phosphorylation in fat cells, as well as most of the important metabolic actions of insulin (5). One mechanism through which the signal generated by PI3-kinase activation is propagated involves the proto-oncogene, protein kinase B (PKB; ref. 6). The three PKB isoforms, designated α, β, and γ, are controlled by multiple mechanisms, including direct activation by phospholipid products of the PI3-kinase reaction, membrane localization, and covalent phosphorylation (6). PKB has been implicated as a mediator of several of the important effects of insulin, including the activation of glycogen synthase (7) and increasing the phosphorylation of the translational regulators, 4E-BP1 and p70S6K (8–10). The effects of insulin on these three proteins are either attenuated or abolished by rapamycin (11–14), a potent and selective inhibitor of TOR (target of rapamycin) proteins (15), which include Tor1p and Tor2p from Saccharomyces cerevisiae, and a single mammalian homologue, termed mTOR [also known as FRAP (FKBP12-rapamycin-associated protein) or RAFT1 (rapamycin and FKBP12 target 1); refs. 16 and 17].
mTOR is a founding member of the family of Ser/Thr protein kinases that have catalytic domains homologous to that in PI3-kinase (18, 19). The protein kinase activity of mTOR may be increased in response to insulin, certain growth factors, and serum (9, 19, 20). mTOR itself is phosphorylated in response to increased PKB activity, both in vitro and in vivo (9, 20, 21). There is evidence that the activity of mTOR in cells is increased by amino acids (22–24), and the protein is believed to function in a nutrient-sensing pathway that maintains a proper balance between amino acid availability, protein synthesis, and cell growth (16, 17).
In the present report, we describe the identification of a previously undocumented protein target of insulin action and present evidence that the phosphorylation of the protein, recently named lipin (25), is controlled by mTOR. Lipin is the product of the gene whose mutation results in the fatty liver dystrophy (fld) phenotype (25). In addition to other abnormalities, mice homozygous for the fld mutation grow slowly, fail to develop normal adipose tissue, and exhibit hyperlipidemia and glucose intolerance (26, 27).
Materials and Methods
Incubation of Adipocytes.
Fat cells were isolated by collagenase digestion of rat epididymal adipose tissue (Wistar, 120–140 g) as described previously (28), then washed two times and suspended (1 g fat per 10 ml medium) in Low Pi Medium (0.2 mM sodium phosphate/125 mM NaCl/5.4 mM KCl/1.4 mM MgCl2/1.4 mM CaCl2/30 mg/ml BSA/20 mM sodium Hepes, pH 7.4). Na32Pi (0.5 mCi/ml medium, ICN) was added, and the cells were incubated at 37°C for 90 min, a time sufficient to achieve steady state labeling of the γ phosphate of ATP (28). After treatments with insulin and other additions, the incubations were terminated by homogenizing the cells in buffer A (1 ml/g fat; ref. 28). Buffer A contained 100 mM NaF, 10 mM EDTA, 2 mM EGTA, 1 mM benzamidine, 0.2 mM phenylmethylsulfonyl fluoride, and 50 mM Tris (pH 7.8). The homogenates were centrifuged at 10,000 × g for 30 min, and the supernatants were retained for analyses.
Antibodies.
A sheep PKB-β antibody that had been generated with a peptide having a sequence (CRYDSLGSLELDQRTH) not found in PKB-α or PKB-γ was obtained from Upstate Biotechnology (Lake Placid, NY). This PKB-β peptide and two peptides, each with an NH2-terminal Cys residue followed by a sequence in mouse lipin, were synthesized and coupled to limpet hemacyanin before rabbits were immunized with the peptide conjugates as described previously (12). The peptide for lipin antibody-1 (LAb-1) corresponded to the sequence between S (377) and G (397) in mouse lipin and that for LAb-2 corresponded to the last 11 aa in the protein. The antibodies were affinity-purified with resin prepared by coupling the respective peptides to Sulfo-Link beads as directed by the supplier (Pierce Endogen).
Identification of Lipin.
A 5-ml suspension of protein G-Sepharose (Amersham Pharmacia Biotech; 1 ml packed beads) in PBS [145 mM NaCl and 10 mM sodium phosphate (pH 7.4)] was incubated at 21°C with 2 mg sheep PKB-β antibodies. After 1 h, the beads were washed twice and suspended in 10 ml 0.2 M sodium borate (pH 9.0). Dimethylpimelimidate was added (20 mM final conc.) (29), and the beads were incubated for 30 min, rinsed, and incubated in 10 ml 0.2 M ethanolamine for 2 h, and then rinsed three times with PBS. Samples (16 × 1 ml) of extracts of insulin-treated 32P-labeled rat adipocytes (from 14 g tissue) were incubated with aliquots (60 μl) of the cross-linked PKB-β antibody beads for 2 h at 4°C. The beads were washed five times (1 ml/wash) with buffer A before proteins were eluted with SDS sample buffer and exchanged into a solution of 0.03% SDS, 0.01% β-mercaptoethanol, 10 μM EDTA, and 0.67 mM Tris/phosphate (pH 6.8) by using a rapid-desalting column on a SMART system (Amersham Pharmacia Biotech). The samples were pooled, lyophilized, and reconstituted in 100 μl SDS sample buffer. The protein sample was loaded onto a single lane of a 7.5% acrylamide gel, and subjected to SDS/PAGE (30). After staining with Coomassie blue, a slice of the gel containing the 32P-labeled apparent molecular weight (appMr) = 140,000 protein was removed, destained in 50% methanol, and macerated. The gel pieces were dehydrated in acetonitrile, and then rehydrated in 30 μl of 10 mM DTT and 0.1 M NH4HCO3. The pieces were incubated for 30 min at 21°C before the solution containing DTT was removed. The sample was then incubated for 30 min in 30 μl of 50 mM iodoacetamide and 0.1 M NH4HCO3. After washing to remove excess iodoacetamide, the pieces were dehydrated in acetonitrile, dried under vacuum, and rehydrated in 30 μl of 50 mM NH4HCO3 containing 20 ng/ml trypsin. Fragments, released after the sample was incubated at 37°C for 18 h, were identified in the W. M. Keck Biomedical Mass Spectrometry Laboratory at the University of Virginia by using a Finnigan LCQ ion trap mass spectrometry system with a Protana nanospray ion source interfaced with a Phonomenex Jupiter 8 cm × 75 mm C18 column. Samples (0.5–2 μl) of the digest were injected, and the peptides were eluted with an increasing gradient of acetonitrile. The digest was analyzed by using the double play capability of the instrument acquiring full scan mass spectra to determine peptide Mr and product ion spectra to determine amino acid sequence in sequential scans.
Immunoprecipitation of Lipin and PKB-β.
Rabbit antibodies to lipin and PKB-β were coupled to protein A-agarose beads (0.25 mg antibody per ml beads) by incubating at 23°C for 60 min in buffer A. The beads were then washed three times with buffer A. Samples (1 ml) of extract were incubated with the beads (25 μl) for 30 min at 23°C with constant mixing. After washing the beads 5 times with buffer A (1 ml per wash), proteins were eluted with SDS sample buffer (30). Immunoprecipitations with the mouse monoclonal antibody to influenza hemagglutinin (HA) epitope (12CA5, Boehringer Mannheim), and with the sheep PKB-β antibody, were conducted as described for the rabbit antibodies, except that protein G-agarose was used.
Expression of Recombinant HA-Lipin.
Lipin cDNA was amplified by PCR from reversed transcribed mouse liver cDNA (CLONTECH) by using PFU Turbo DNA polymerase (Stratagene) and the following primers: CGGGGTACCCATATGGAATTCATGAATTACGTGG and CGGGGTACCCATATGGAATTCTCAAGCTGAGGC. The product was digested with EcoRI and inserted into the EcoRI site of pKH3 (31) to generate a plasmid (pKH3-lipin) encoding lipin with a triple HA epitope tag at its NH2 terminus. For expression studies with HA-lipin, human embryonic kidney (HEK) 293 cells (ATCC, CRL 1573) were seeded at 2 × 10⁴ cells/cm2 and cultured for 24 h in growth medium composed of 10% (vol/vol) horse serum in DMEM. Cells were transfected with pKH3 or pKH3-lipin (7.5 μg plasmid/100 mm diameter dish) by using TransIt-LT2 (Panvera, Madison, WI) as described previously (18).
Electrophoretic Analyses.
Protein samples were subjected to electrophoresis in 7.5% polyacrylamide gels in the presence of SDS by using the method of Laemmli (30). Dried gels were exposed to film to enable detection of 32P-labeled proteins. Relative amounts of 32P were determined by using a PhosphorImager (Molecular Dynamics). Immunoblots were prepared as described previously (12), except with different antibodies.
For phosphoamino acid analyses, lipin was transferred to Immobilon P (Millipore), before slices of the membrane containing the protein were incubated in 5.7 M HCl for 1.5 h at 110°C. After removing the acid under vacuum, samples were subjected to high voltage electrophoresis at pH 1.9 and pH 3.5 (32).
Preparation of Mouse Tissue Extracts.
Tissues from 5-month-old male wild-type and BALB/cByJ-fld/fld mice (The Jackson Laboratory) were ground in to powders by using a porcelain mortar and pestle chilled in liquid nitrogen. The powdered tissue was homogenized in buffer A by using a glass homogenization tube and Teflon pestle driven at 1,000 rpm. Homogenates were centrifuged at 10,000 × g for 20 min a 4°C, and the supernatants were retained for analyses.
Animal Care.
Animals were allowed free access to food and water, and kept in a clean dry environment under the supervision of two trained veterinarians. Procedures involving animals were approved in advance by the University of Virginia Animal Care and Use Committee.
Other Materials.
Insulin, rapamycin, LY294002, and wortmannin were obtained from Calbiochem Novobiochem. Most commonly used chemicals were from Sigma Aldrich.
Results
Identification of Lipin as an Insulin-Stimulated Phosphoprotein.
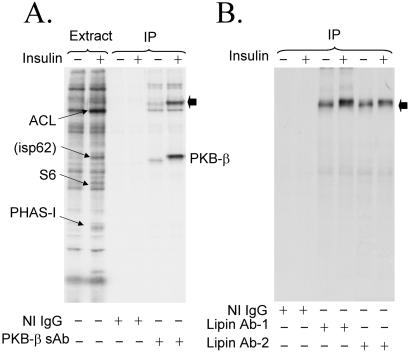
Rat adipocytes were incubated in medium containing 32Pi, and then treated with insulin before extract samples of control and insulin-treated cells were subjected to SDS/PAGE. The major insulin-stimulated phosphoproteins were ATP-citrate lyase (33), ribosomal protein S6 (34), PHAS-I (phosphorylated heat- and acid-stable protein stimulated by insulin) (35), and a protein designated isp62 (ref. 36; Fig. 1A). By mass spectrometric sequence analyses, we recently determined that isp62 is PKB-β (T.A.H. and J.C.L., unpublished observations), the predominant PKB isoform expressed in adipocytes (37). In experiments to confirm this assignment, sheep PKB-β antibodies were found to immunoprecipitate not only the kinase but also a previously uncharacterized 32P-labeled protein of appMr = 140,000 (denoted by the filled arrow in Fig. 1A). This protein was not detected if immunoprecipitations were conducted with nonimmune IgG, indicating either that it coimmunoprecipitated with PKB-β or that it was recognized by crossreacting antibodies in the PKB-β antibody preparation.
Figure 1.
Identification of lipin. Rat adipocytes were incubated in medium containing 32Pi for 90 min, and then incubated without or with 1 milliunit/ml insulin for an additional 20 min before extracts were prepared. Immunoprecipitations were conducted by using nonimmune IgG (NI IgG) or sheep PKB-β antibody (PKB-β sAb). Samples of extracts and immunoprecipitated proteins were subjected to SDS/PAGE, and an autoradiogram of the dried gel was prepared (A). The bands of 32P corresponding to ATP-citrate lyase (ACL, appMr = 130,000), isp62 (appMr = 62,000), ribosomal protein S6 (S6, appMr = 32,000), and PHAS-I (appMr = 22,000) are indicated by the arrows. The major 32P-labeled proteins immunoprecipitated correspond to PKB-β and an unknown protein (filled arrow), which we later identified as lipin. In a separate experiment, immunoprecipitations from extracts were performed with nonimmune IgG and two lipin antibodies, LAb-1 and LAb-2 (B). The filled arrow points to lipin.
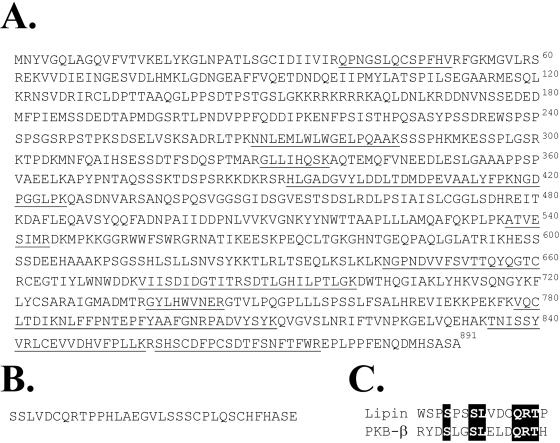
The amount of 32P associated with the appMr = 140,000 protein was increased by insulin (Fig. 1A), and, although the protein was not one of the most prominent of the 32P-labeled species, it was visible as bands of relatively low intensity located just above that of ATP citrate lyase in autoradiograms of extract samples (Fig. 1A). Thus, it was sufficiently abundant in fat cells to allow purification for identification by mass spectrometric sequencing. Isolation of the appMr = 140,000 protein was accomplished by performing multiple immunoprecipitations by using the sheep PKB-β antibody covalently coupled to protein G-agarose. After digesting the protein with trypsin, a total of 14 unique peptides were sequenced. In initial database searches, the peptide sequences were highly homologous to sequences in the hypothetical protein product of the gene, Kiaa0188. While our studies were in progress, this gene was reported to be mutated in the fld mouse, and the gene and its protein product were named Lpin1 and lipin, respectively (25). The position of the peptides from the appMr = 140,000 protein in mouse lipin are underlined (Fig. 2A).
Figure 2.
Amino acid sequence of mouse lipin. The lipin sequence (25) with underlined residues denoting peptides sequenced by mass spectrometry are shown (A). Lipin cDNA having a 99-bp insert was cloned from a mouse liver cDNA library. The extra bases encode 33 aa, which would be inserted between amino acids 240 and 241 in lipin (B). The sequence of the insert has a region homologous to that of the peptide used to generate the PKB-β antibody (C).
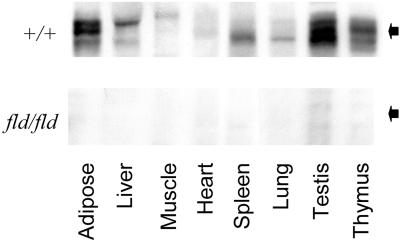
Two other lipin isoforms, designated lipin-2 and lipin-3, have been identified (25). None of the peptide sequences matched sequences in these two isoforms, and the perfect match with lipin leaves little doubt that the peptides sequenced were derived from lipin. However, based on its cDNA, lipin is predicted to contain only 891 aa and to have a Mr ≈ 103,000 (25), which is significantly less that the appMr of the 32P-labeled protein. To be sure that the 32P-labeled adipocyte protein was lipin, two antibodies to lipin peptides were generated. When immunoprecipitated with either antibody 1 (LAb-1) or antibody 2 (LAb-2) and subjected to SDS/PAGE, 32P-labeled lipin had the same mobility as the appMr = 140,000 protein (Fig. 1B). Additional evidence for the specificity of LAb-1 was provided by immunoblotting tissue samples from wild-type and fld mice (Fig. 3). Lipin was found in several tissues from wild-type mice, with highest levels in testicular and adipose tissues. As expected, none of the protein was detected in tissues from fld/fld mice, which have a grossly disrupted lipin gene (25). Thus, results with the fld/fld mice confirm that the appMr = 140,000 protein recognized by the antibodies is lipin.
Figure 3.
Lipin levels in wild-type and fld mice. Extracts (75 μg protein) of different tissues from wild-type (+/+) mice or mice homozygous (fld/fld) for the fld allele were subjected to SDS/PAGE, and immunoblots were prepared with LAb-1. Pictures of regions of the blot surrounding lipin, denoted by the filled arrows, are shown.
PKB-β Antibodies Bind Directly to Lipin.
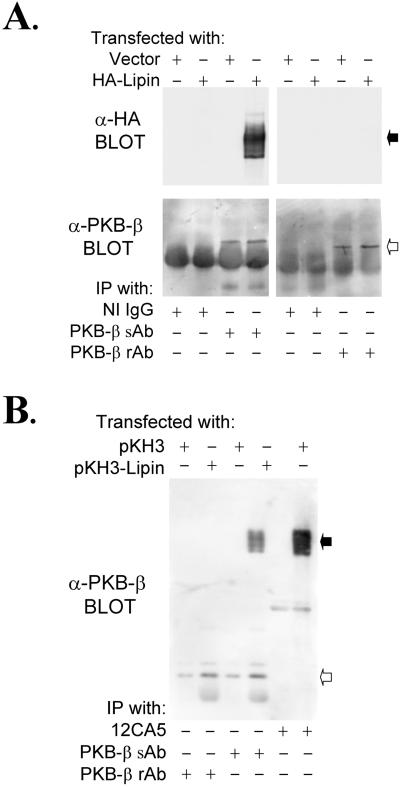
32P-PKB-β was not immunoprecipitated by either of the lipin antibodies from extracts of control or insulin-treated 32P-labeled fat cells (Fig. 1B). This result was surprising, because we believed the most likely hypothesis to explain the recovery of lipin with the PKB-β antibody was that the lipin was bound to PKB-β. The possibility that the lipin-1 antibodies might have promoted dissociation of a lipin–PKB-β complex was explored by overexpressing an epitope-tagged lipin in HEK293 cells. HA-lipin was immunoprecipitated by the sheep PKB-β antibody (Fig. 4A); however, PKB-β did not coimmunoprecipitate with HA-lipin (Fig. 4B). Moreover, HA-lipin was not immunoprecipitated by a rabbit PKB-β antibody, despite the fact that the sheep and rabbit antibodies were raised against the same peptide and were equally effective in immunoprecipitating PKB-β (Fig. 4A).
Figure 4.
Sheep PKB-β antibodies crossreact with recombinant lipin. HEK293 cells were transfected with pKH3 or with pKH3-lipin. After preparation of extracts, immunoprecipitations were conducted with the sheep PKB-β Ab (PKB-sAb) or with the rabbit PKB-β antibody (PKB-β rAb), which we generated for this study. Samples of the immunoprecipitated proteins were subjected to SDS/PAGE, and immunoblots were prepared with the HA antibody, 12CA5, or with the sheep PKB-β antibody (A). Immunoprecipitations were also conducted with the two PKB-β antibodies and with 12CA5, before an immunoblot was prepared with the sheep PKB-β antibody (B). The filled and open arrows point to lipin and PKB-β, respectively.
In cloning lipin from mouse liver cDNA, we found that 19 of 20 clones sequenced differed from the reported sequence (25) by an extra 99 bp, which encoded an in-frame insertion of 33 aa beginning at residue 240 (Fig. 2B). The cDNA insert, which apparently results from alternative splicing, contains a unique EcoNI restriction site. Almost all (>90%) of the lipin cDNA generated by PCR from mouse liver cDNA could be cut by EcoNI, indicating that the larger lipin is the predominant form, at least in mouse liver. For this reason, the HA-tagged construct used in our experiments was prepared with the form of lipin containing the insert. Homology between the PKB-β peptide and the initial residues in the 33-aa insert is evident in the alignment shown in Fig. 2C, suggesting that the sheep PKB-β antibodies might bind directly to lipin. Confirmation of this interpretation was provided by the finding that the sheep antibodies immunoblotted HA-lipin (Fig. 4B). Therefore, we conclude that the initial immunoprecipitation of 32P-labeled lipin from adipocytes was due to crossreacting antibodies in the PKB-β antibody preparation, and not to an association between lipin and PKB-β.
Control of Lipin Phosphorylation.
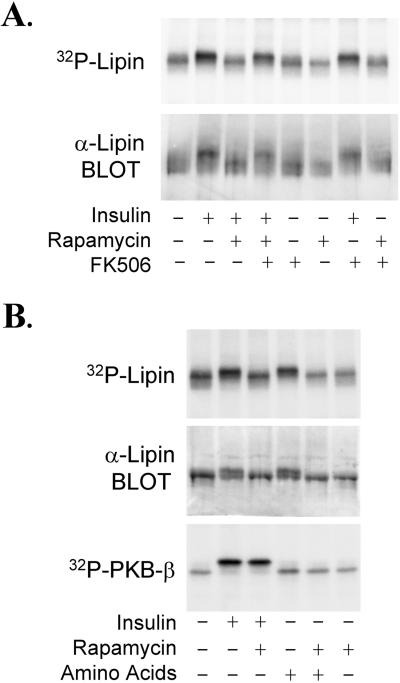
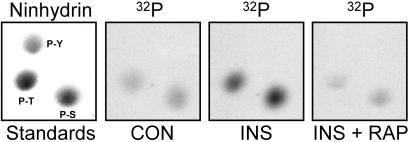
In nine experiments in which 32P-labeled rat adipocytes were incubated with 1 milliunit/ml insulin for 20 min, the hormone increased the 32P-content of lipin that was immunoprecipitated with LAb-1 by 52 ± 0.09%. Insulin also decreased the electrophoretic mobility of the bulk of the protein, indicating that a significant fraction of lipin was phosphorylated in insulin-treated cells (Fig. 5A). Lipin from control cells was phosphorylated exclusively on Ser and Thr residues, both of which were increased by insulin (Fig. 6). No [32P]Tyr was detected in lipin, even after incubating cells with insulin.
Figure 5.
mTOR-dependent phosphorylation of lipin. 32P-Labeled rat adipocytes were incubated with 25 nM rapamycin, 200 nM FK506, or the combination of agents for 30 min. After adding insulin (1 milliunit/ml) as indicted, the incubations were continued for 20 min before extracts were prepared. [32P]Lipin was immunoprecipitated with LAb-1 and subjected to SDS/PAGE. An autoradiogram of the dried gel in the region surrounding lipin, and a lipin immunoblot of cell extracts, are shown (A). In a separate experiment, 32P-labeled rat adipocytes were incubated without or with 25 nM rapamycin for 30 min, and then incubated for an additional 10 min after insulin (1 milliunit/ml final concentration) and/or MEM amino acids (2.5× final concentration) were added. 32P-labeled lipin and PKB-β were immunoprecipitated with LAb-1 and the rabbit PKB-β antibody, respectively. Autoradiograms of [32P]lipin and [32P]PKB-β, and an immunoblot showing lipin from the cell extracts, are shown (B).
Figure 6.
Phosphoamino acid analyses of 32P-labeled lipin. Samples of 32P-labeled lipin from control adipocytes (CON) or cells that had been incubated for 20 min with either 1 milliunit/ml insulin (INS) or 25 nM rapamycin plus insulin (INS + RAP) were subjected to SDS/PAGE. The protein was transferred to an Immobilon P membrane, then hydrolyzed in 5.7 M HCl for 1.5 h at 110°C. After adding standards of P-Ser (P-S), P-Tyr (P-Y), and P-Thr (P-T) to allow visualization with ninhydrin, the phosphoamino acids were resolved by two-dimensional high voltage electrophoresis at pH 1.9 and pH 3.5. Pictures of autoradiograms in the region surrounding the phosphoamino acids are shown.
Because essentially all of the important metabolic effects of insulin are dependent on PI3-kinase activity, experiments were conducted to determine whether the stimulatory effect of insulin on lipin phosphorylation was sensitive to wortmannin and LY294002, two inhibitors of PI3-kinase (5). Increasing concentrations of wortmannin progressively inhibited the effect of insulin on lipin (IC50 = 50 nM), and incubating cells with 100 μM LY294002 abolished insulin-stimulated phosphorylation (T.A.H. and J.C.L., unpublished observations). Thus, PI3-kinase activity appears to be necessary for the hormonal effect. Adipocytes were also incubated with rapamycin, a highly specific inhibitor of mTOR signaling (15). At 25 nM, rapamycin abolished the insulin-stimulated increase in lipin phosphorylation, again assessed both by 32P-labeling and by gel shift (Fig. 5A). This result was reflected by a decrease in the [32P]Ser and [32P]Thr content of the protein (Fig. 6).
Incubating cells with FK506, an agent that competes with rapamycin for binding to FKBP12 (FK506-binding protein of Mr = 12,000; ref. 15), was without effect on lipin phosphorylation, and FK506 did not attenuate the effect of insulin. However, FK506 abolished the effect of rapamycin on lipin (Fig. 5A). Unlike the rapamycin–FKBP12 complex, the FK506–FKBP12 complex does not bind to mTOR (15). Consequently, the effects of rapamycin that are mediated by inhibition of mTOR function are competitively inhibited by FK506. Thus, the findings with rapamycin and FK506 indicate that mTOR is necessary for the effect of insulin on lipin.
Incubating adipocytes with amino acids increased the phosphorylation of lipin to the same extent as insulin (Fig. 5B). The stimulatory effect of amino acids was abolished by rapamycin, providing additional evidence implicating mTOR in the control of lipin phosphorylation. Insulin stimulated the phosphorylation of PKB-β in a rapamycin-insensitive manner, and, in contrast to insulin, amino acids did not increase PKB-β phosphorylation (Fig. 5B).
Discussion
The results herein demonstrate that lipin is phosphorylated in response to insulin and that lipin phosphorylation is controlled by the mTOR signaling pathway. Supporting the latter conclusion are our findings that the effects of insulin were blocked by rapamycin, a highly selective inhibitor of mTOR (15), and mimicked by amino acids, which increase mTOR function in cells (22–24). The phosphorylation of lipin also depended on PI3-kinase activity, but, as is the case with the phosphorylation of several other proteins that are targets of both PI3-kinase and mTOR (16), it is not clear whether mTOR functions to control lipin phosphorylation by acting downstream of PI3-kinase or in a parallel signaling pathway.
Products of the PI3-kinase reaction lead to the activation of several protein kinases, including PKB (6), which we considered to be the prime candidate for phosphorylating lipin after lipin was identified in immunoprecipitates generated with a PKB-β antibody (Fig. 1). In subsequent experiments, we were unable to detect a stable complex between lipin and PKB-β (Fig. 4). The failure to detect such a complex does not eliminate the possibility that PKB is involved in the control of lipin. However, PKB is not inhibited by rapamycin, and amino acids, which do not activate PKB (23, 24), increased lipin phosphorylation to the same extent as insulin (Fig. 5B).
Lipin contains many potential phosphorylation sites, and it is possible that multiple signaling pathways contribute to the control of lipin phosphorylation. However, regardless of the kinases responsible for directly phosphorylating lipin, the conclusion that mTOR controls lipin phosphorylation has potentially important implications with respect to the control of cell growth and development, as well as the control of carbohydrate and lipid metabolism.
A naturally occurring disruption of the Lpin1 gene has provided insight into the consequences of lipin deficiency. The fld allele arose as a result of a complex genetic rearrangement, which included a 2-kb deletion that eliminates exons 2 and 3 of Lpin1, and an inversion of more than 40 kb that contained most of the remainder of the coding sequence (25). As a result, fld/fld mice do not express lipin mRNA (25) or protein (Fig. 3). At birth, these animals appear normal, but, within a few days, they become markedly hypertriglyceridemic and develop fatty livers as hepatocytes become engorged with large lipid droplets (26). Hypertriglyceridemia is one of the most frequent side effects when rapamycin is used in immunosuppressant therapy in humans (38). Although the effect of mTOR-dependent phosphorylation of lipin is still unknown, inhibition of lipin phosphorylation by rapamycin represents a potential link to the increase in blood lipids.
The fatty livers and elevated serum lipids in fld/fld mice spontaneously resolve at about the time of weaning, but other derangements develop and persist throughout the life of the animals (26). Several of the abnormalities exhibited by the mutant mice are also similar to those that result after the function of mTOR is compromised, either genetically or with rapamycin. Adipocyte differentiation is impaired in fld/fld mice (27), and inhibiting mTOR with rapamycin blocks fat cell differentiation in vitro (39). TOR proteins appear to have evolved as sensors of nutrient availability. S. cerevisiae cells treated with rapamycin or depleted of TOR proteins enter a state closely resembling that induced by nutrient starvation (16, 17). Similarly, mammalian cells starved of certain amino acids or treated with rapamycin exhibit decreased rates of mRNA translation initiation and protein synthesis (16, 17). The link between mTOR and lipid synthesis represented by lipin phosphorylation would seem to be in keeping with the nutrient-sensing role of mTOR.
Fld/fld mice develop glucose intolerance and insulin resistance (27), and the finding that rapamycin inhibits the effect of insulin on activating glycogen synthase is evidence that mTOR is involved in insulin-stimulated glucose disposal (11, 14). However, glucose intolerance has not been reported to be a significant side effect of rapamycin in humans, and it may develop in the fld/fld mice as a result of diminished adipose tissue mass (27). A-ZIP/F1 mice, which lack adipose tissue, exhibit marked insulin resistance, and transplanting adipose tissue into the animals restores normal insulin responsivity (40). Fld/fld mice grow more slowly than wild-type or heterozygous littermates, and the adult animals are 25–35% smaller (26). Rapamycin slows growth of cells from many species by reducing the rate of G1 progression (15, 17). Drosophila harboring two mutant alleles of dTOR, the fly mTOR homolog, hatch normally, but the larvae grow more slowly and are smaller than the wild-type larvae (41, 42). Knocking out dS6K, a downstream effector of dTOR, results in smaller flies (43). Similarly, knocking out S6K-1, an effector of mTOR, produces a small mouse phenotype (44). Mice with an mTOR mutation, termed flat-top, die in utero (45), but embryos lacking mTOR exhibit delayed development and are smaller than wild-type embryos at the same age (16).
The processes involved in the control of growth and metabolism by mTOR are complex, and loss of signaling to lipin clearly cannot explain all of the defects resulting from loss of mTOR. However, in view of the similarities of some of the defects resulting from deficiencies in lipin and mTOR, and the connection between mTOR and lipin phosphorylation described in the present study, it seems reasonable to suspect that lipin is an important effector in the mTOR pathway.
Acknowledgments
We thank Lloyd McMahon for technical assistance, and Thurl Harris and Angus Scrimgeour for comments regarding the manuscript. This work was supported by National Institutes of Health Grants DK28312 and DK52753. The mass spectrometric sequencing of peptides from lipin was performed by Dr. Nicholas E. Sherman in the W. M. Keck Biomedical Mass Spectrometry Laboratory, which is supported by the University of Virginia Pratt Fund.
Abbreviations
- appMr
apparent molecular weight
- FKBP12
FK506-binding protein of Mr = 12,000
- HA
hemagglutinin antigen
- HEK
human embryonic kidney
- LAb
lipin antibody
- mTOR
mammalian target of rapamycin
- PI3-kinase
phosphatidylinositol 3-OH kinase
- PKB
protein kinase B
- fld
fatty liver dystrophy
Footnotes
Data deposition: The lipin sequence reported in this paper has been deposited in the GenBank database (accession no. AF412811).
References
- 1.Avruch J. Mol Cell Biochem. 1998;182:31–48. [PubMed] [Google Scholar]
- 2.Avruch J, Alexander M C, Palmer J L, Pierce M W, Nemenoff R A, Blackshear P J, Tipper J P, Witters L A. Fed Proc. 1982;41:2629–2633. [PubMed] [Google Scholar]
- 3.Benjamin W B, Singer I. Biochemistry. 1975;14:3301–3309. doi: 10.1021/bi00686a003. [DOI] [PubMed] [Google Scholar]
- 4.Denton R M, Brownsey R W, Belsham G J. Diabetologia. 1981;21:347–362. doi: 10.1007/BF00252681. [DOI] [PubMed] [Google Scholar]
- 5.Shepherd P R, Nave B T, O'Rahilly S. J Mol Endocrinol. 1996;17:175–184. doi: 10.1677/jme.0.0170175. [DOI] [PubMed] [Google Scholar]
- 6.Alessi D R, Cohen P. Curr Opin Genet Dev. 1998;8:55–62. doi: 10.1016/s0959-437x(98)80062-2. [DOI] [PubMed] [Google Scholar]
- 7.Cross D A, Alessi D R, Cohen P, Andjelkovich M, Hemmings B A. Nature (London) 1995;378:785–789. doi: 10.1038/378785a0. [DOI] [PubMed] [Google Scholar]
- 8.Gingras A-C, Kennedy S G, O'Leary M A, Sonenberg N, Hay N. Genes Dev. 1998;12:502–513. doi: 10.1101/gad.12.4.502. [DOI] [PMC free article] [PubMed] [Google Scholar]
- 9.Scott P H, Brunn G J, Kohn A D, Roth R A, Lawrence J C., Jr Proc Natl Acad Sci USA. 1998;95:7772–7777. doi: 10.1073/pnas.95.13.7772. [DOI] [PMC free article] [PubMed] [Google Scholar]
- 10.Ueki K, Yamamoto-Honda R, Kaburagi Y, Yamauchi T, Tobe K, Burgering B M T, Coffer P J, Komuro I, Akanuma Y, Yazaki Y, Kadowaki T. J Biol Chem. 1998;273:5315–5322. doi: 10.1074/jbc.273.9.5315. [DOI] [PubMed] [Google Scholar]
- 11.Azpiazu I, Saltiel A R, DePaoli-Roach A A, Lawrence J C., Jr J Biol Chem. 1996;271:5033–5039. doi: 10.1074/jbc.271.9.5033. [DOI] [PubMed] [Google Scholar]
- 12.Lin T-A, Kong X, Saltiel A R, Blackshear P J, Lawrence J C., Jr J Biol Chem. 1995;270:18531–18538. doi: 10.1074/jbc.270.31.18531. [DOI] [PubMed] [Google Scholar]
- 13.Price D J, Grove J R, Calvo V, Avruch J, Bierer B E. Science. 1992;257:973–977. doi: 10.1126/science.1380182. [DOI] [PubMed] [Google Scholar]
- 14.Shepherd P R, Nave B T, Siddle K. Biochem J. 1995;305:25–28. doi: 10.1042/bj3050025. [DOI] [PMC free article] [PubMed] [Google Scholar]
- 15.Abraham R T, Wiederrecht G J. Annu Rev Immunol. 1996;14:483–510. doi: 10.1146/annurev.immunol.14.1.483. [DOI] [PubMed] [Google Scholar]
- 16.Raught B, Gingras A-C, Sonenberg N. Proc Natl Acad Sci USA. 2001;98:7037–7044. doi: 10.1073/pnas.121145898. [DOI] [PMC free article] [PubMed] [Google Scholar]
- 17.Schmelzle T, Hall M N. Cell. 2000;103:253–262. doi: 10.1016/s0092-8674(00)00117-3. [DOI] [PubMed] [Google Scholar]
- 18.Brunn G J, Hudson C C, Sekulic A, Williams J M, Hosoi H, Houghton P J, Lawrence J C, Jr, Abraham R T. Science. 1997;277:99–101. doi: 10.1126/science.277.5322.99. [DOI] [PubMed] [Google Scholar]
- 19.Burnett P E, Barrow R K, Cohen N A, Snyder S H, Sabatini D M. Proc Natl Acad Sci USA. 1998;95:1432–1437. doi: 10.1073/pnas.95.4.1432. [DOI] [PMC free article] [PubMed] [Google Scholar]
- 20.Sekulic A, Hudson C C, Homme J L, Yin P, Otterness D M, Karnitz L M, Abraham R T. Cancer Res. 2000;60:3504–3513. [PubMed] [Google Scholar]
- 21.Nave B T, Ouwens M, Withers D J, Alessi D R, Shepherd P R. Biochem J. 1999;344:427–431. [PMC free article] [PubMed] [Google Scholar]
- 22.Hara K, Yonezawa K, Weng Q-P, Kozlowski M T, Belham C M, Avruch J. J Biol Chem. 1998;273:14484–14494. doi: 10.1074/jbc.273.23.14484. [DOI] [PubMed] [Google Scholar]
- 23.Patti M E, Brambilla E, Luzi L, Landaker E J, Kahn C R. J Clin Invest. 1998;101:1519–1529. doi: 10.1172/JCI1326. [DOI] [PMC free article] [PubMed] [Google Scholar]
- 24.Wang X M, Campbell L E, Miller C M, Proud C G. Biochem J. 1998;334:261–267. doi: 10.1042/bj3340261. [DOI] [PMC free article] [PubMed] [Google Scholar]
- 25.Peterfy M, Phan J, Xu P, Reue K. Nat Genet. 2001;27:121–124. doi: 10.1038/83685. [DOI] [PubMed] [Google Scholar]
- 26.Reue K, Doolittle M H. J Lipid Res. 1996;37:1387–1405. [PubMed] [Google Scholar]
- 27.Reue K, Xu P, Wang X P, Slavin B G. J Lipid Res. 2000;41:1067–1076. [PubMed] [Google Scholar]
- 28.Lawrence J C, Jr, James C. J Biol Chem. 1984;259:7975–7982. [PubMed] [Google Scholar]
- 29.Harlow E, Lane D. Antibodies: A Laboratory Manual. Plainview, NY: Cold Spring Harbor Lab. Press; 1988. pp. 522–523. [Google Scholar]
- 30.Laemmli U K. Nature. 1970;227:680–685. doi: 10.1038/227680a0. [DOI] [PubMed] [Google Scholar]
- 31.Mattingly R R, Sorisky A, Brann M R, Macara I G. Mol Cell Biol. 1994;14:7943–7952. doi: 10.1128/mcb.14.12.7943. [DOI] [PMC free article] [PubMed] [Google Scholar]
- 32.Cooper J A, Sefton B M, Hunter T. Methods Enzymol. 1983;99:387–402. doi: 10.1016/0076-6879(83)99075-4. [DOI] [PubMed] [Google Scholar]
- 33.Pucci D L, Ramakrishna S, Benjamin W B. J Biol Chem. 1983;258:12907–12911. [PubMed] [Google Scholar]
- 34.Smith C J, Wejksnora P J, Warner J R, Rubin C S, Rosen O M. Proc Natl Acad Sci USA. 1979;76:2725–2729. doi: 10.1073/pnas.76.6.2725. [DOI] [PMC free article] [PubMed] [Google Scholar]
- 35.Hu C, Pang S, Kong X, Velleca M, Lawrence J C., Jr Proc Natl Acad Sci USA. 1994;91:3730–3734. doi: 10.1073/pnas.91.9.3730. [DOI] [PMC free article] [PubMed] [Google Scholar]
- 36.Lawrence J C, Jr, Hiken J F, Inkster M, Scott C W, Mumby M C. Proc Natl Acad Sci USA. 1986;83:3649–3653. doi: 10.1073/pnas.83.11.3649. [DOI] [PMC free article] [PubMed] [Google Scholar]
- 37.Hill M M, Clark S F, Tucker D F, Birnbaum M J, James D E, Macaulay S L. Mol Cell Biol. 1999;19:7771–7781. doi: 10.1128/mcb.19.11.7771. [DOI] [PMC free article] [PubMed] [Google Scholar]
- 38.Ingle G R, Sievers T M, Holt C D. Ann Pharmacother. 2000;34:1044–1055. doi: 10.1345/aph.19380. [DOI] [PubMed] [Google Scholar]
- 39.Yeh W C, Bierer B E, McKnight S L. Proc Natl Acad Sci USA. 1995;92:11086–11090. doi: 10.1073/pnas.92.24.11086. [DOI] [PMC free article] [PubMed] [Google Scholar]
- 40.Reitman M L, Gavrilova O. Int J Obes Relat Metab Disord. 2000;24, Suppl. 4:S11–S14. doi: 10.1038/sj.ijo.0801493. [DOI] [PubMed] [Google Scholar]
- 41.Oldham S, Montagne J, Radimerski T, Thomas G, Hafen E. Genes Dev. 2000;14:2689–2694. doi: 10.1101/gad.845700. [DOI] [PMC free article] [PubMed] [Google Scholar]
- 42.Zhang H, Stallock J P, Ng J C, Reinhard C, Neufeld T P. Genes Dev. 2000;14:2712–2724. doi: 10.1101/gad.835000. [DOI] [PMC free article] [PubMed] [Google Scholar]
- 43.Montagne J, Stewart M J, Stocker H, Hafen E, Kozma S C, Thomas G. Science. 1999;285:2126–2129. doi: 10.1126/science.285.5436.2126. [DOI] [PubMed] [Google Scholar]
- 44.Shima H, Pende M, Chen Y, Fumagalli S, Thomas G, Kozma S C. EMBO J. 1998;17:6649–6659. doi: 10.1093/emboj/17.22.6649. [DOI] [PMC free article] [PubMed] [Google Scholar]
- 45.Hentges K, Thompson K, Peterson A. Development (Cambridge, UK) 1999;126:1601–1609. doi: 10.1242/dev.126.8.1601. [DOI] [PubMed] [Google Scholar]


