Abstract
Objective
To estimate the relation between alcohol consumption and risk of death, the level of alcohol consumption at which risk is least, and how these vary with age and sex.
Design
Analysis using published systematic reviews and population data.
Setting
England and Wales in 1997.
Main outcome measures
Death from any of the following causes: cancer of lip, oral cavity, pharynx, oesophagus, colon, rectum, liver, larynx, and breast, essential hypertension, coronary heart disease, stroke, cirrhosis, non-cirrhotic chronic liver disease, chronic pancreatitis, and injuries.
Results
A direct dose-response relation exists between alcohol consumption and risk of death in women aged 16-54 and in men aged 16-34. At older ages the relation is U shaped. The level at which the risk is lowest increases with age, reaching 3 units a week in women aged over 65 and 8 units a week in men aged over 65. The level at which the risk is increased by 5% above this minimum is 8 units a week in women aged 16-24 and 5 units a week in men aged 16-24, increasing to 20 and 34 units a week in women and men aged over 65, respectively.
Conclusions
Substantially increased risks of all cause mortality can occur even in people drinking lower than recommended limits, and especially among younger people.
What is already known on this topic
Non-drinkers and heavy drinkers have higher all cause mortality rates than light drinkers—the U shaped curve
The precise shape and location of the U are likely to depend on age and sex, but this has not been quantified
What this study adds
The level of alcohol consumption that carries the lowest mortality ranges from 0 in men and women aged under 35 to 3 units a week in women aged over 65 and 8 units a week in men aged over 65
The level of alcohol consumption that carries a 5% increase in mortality increases with age from 8 to 20 units a week in women and from 5 to 34 units a week in men
Our calculations were for England and Wales in 1997: nadirs are likely to be lower in the future and in countries with less ischaemic heart disease
Introduction
Alcohol consumption increases the risk of various cancers, hypertension, liver disease, unintentional injuries, and violence.1,2 Definitions of light and moderate alcohol consumption vary, but these levels of consumption are generally found to decrease the risk of ischaemic heart disease.2–6 For all cause mortality the relation is typically U shaped, with non-drinkers and heavier drinkers having higher risks than light and moderate drinkers.2,7–9 The royal colleges of physicians, psychiatrists, and general practitioners have therefore advised men and women to drink less than 21 and 14 units a week, respectively, whereas the UK government has recommended no more than 4 and 3 units a day, respectively; 1 unit is 8-10 g of alcohol.10,11 However, the levels giving the lowest or a low risk are likely to vary with age as well as sex and have not been systematically quantified.12 We used statistical models relating alcohol consumption to the risk of death from single causes to estimate the all cause risk for men and women of different ages in England and Wales.
Methods
To compute risks of all cause mortality we required data on cause specific relative risks, distribution of alcohol consumption, and distribution of causes of death.
Relative risks
Three reviews have quantitatively related alcohol consumption to comprehensive lists of causes of death.1,13,14 The most appropriate review for our study was by Corrao and others because it included more recent studies, assessed study quality, and estimated risk as a function of alcohol consumption.14
Corrao and others systematically identified epidemiological studies relating incident disease or death to reported alcohol consumption for each of 15 groups of causes of death (table 1).14 A second paper dealt with ischaemic heart disease.15 Studies were independently assessed by two raters. The authors excluded studies with low quality scores and studies unadjusted for known confounders when the relative risks differed significantly from better studies.
Table 1.
Causes of death considered related to alcohol
| Cause
|
ICD-9 codes*
|
Meta-analysis
|
Deaths in England and Wales, 1997
|
||
|---|---|---|---|---|---|
| Included studies
|
Included cases
|
Analysed Studies
|
|||
| Cancer: | |||||
| Lip, oral cavity, and pharynx | 140.0-149.9 | 24 | 7 880 | 8 | 1 682 |
| Oesophagus | 150.0-150.9 | 28 | 6 303 | 14 | 5 855 |
| Colon | 153.0-153.9 | 16 | 5 360 | 16 | 10 447 |
| Rectum | 154.0-154.9 | 14 | 2 759 | 3 | 4 771 |
| Liver | 155.0-155.9 | 19 | 1 981 | 10 | 1 979 |
| Larynx | 161.0-161.9 | 20 | 3 789 | 20 | 791 |
| Breast | 174.0-174.9 | 48 | 42 154 | 29 | 11 980 |
| Essential hypertension | 401.0-404.9† | 3 | 5 980 | 2 | 3 084 |
| Stroke: | |||||
| Ischaemic | 433.0-438.9 | 7 | 1 060 | 6 | 50 641 |
| Haemorrhagic | 430.0-432.9 | 9 | 1 192 | 9 | 7 067 |
| Gastric and duodenal ulcer | 531.0-532.9 | 3 | 660 | 2 | 3 343 |
| Cirrhosis | 571.5, 571.6 | 15 | 3 951 | 8 | 2 346 |
| Non-cirrhotic chronic liver disease | 571.4, 571.8, 571.9 | 1 | 121 | 1 | 1 754 |
| Chronic pancreatitis | 577.1 | 2 | 247 | 2 | 74 |
| Injuries | E800.0-E999.9 | 18 | 6 076 | 9 | 15 688 |
| Ischaemic heart disease | 410.0-414.9 | 51 | 66 118 | 28 | 122 425 |
| Other‡ | 291.0-291.9, 303.0, 305.0, 425.5, 535.3 | — | — | — | 635 |
| Non-alcohol-related | — | — | — | 304 957 | |
| All | 549 519 | ||||
International classification of diseases, 9th revision.
Corrao et al considered hypertension as just ICD 401, but we applied the same relative risk to codes 402-404.
Causes for which alcohol consumption is necessary activity. Not included in risk functions as risk is likely to be low in range of alcohol consumption considered.
Corrao and others described each cause specific risk by way of a linear, quadratic, or cubic function of alcohol consumption, or, for ischaemic heart disease, a model involving linear and square root terms. They reported results separately when significant differences were found between Mediterranean and non-Mediterranean countries, case-control and cohort studies, incident disease and death, or men and women: we used the results for non-Mediterranean countries, cohort studies, and deaths. Otherwise we used the pooled results. We expressed alcohol consumption in units a week, taking 1 unit as 9 g of alcohol.16
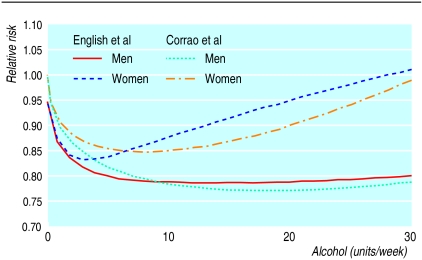
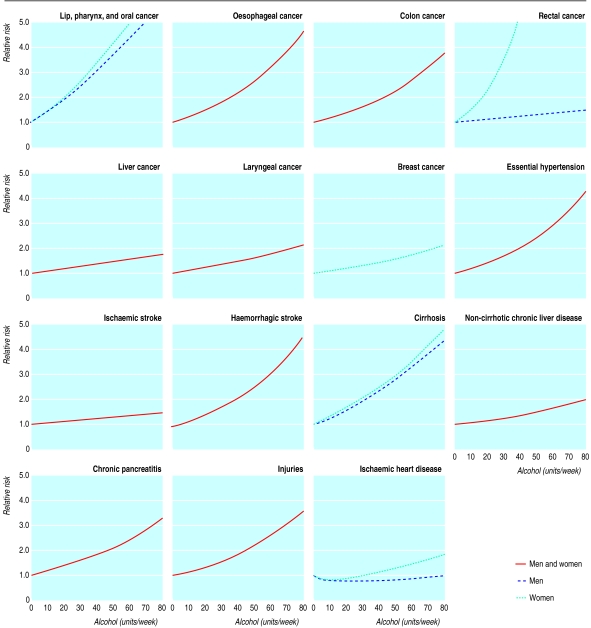
We excluded from our analysis gastric and duodenal ulcer because Corrao and others found a small and non-significant protective effect. They also found a positive association between alcohol consumption and ischaemic stroke, contrary to other reviews.17,18 In a sensitivity analysis we therefore assumed no association. In other sensitivity analyses we excluded breast cancer because its association with alcohol consumption may not be causal, and we used alternative risk functions for ischaemic heart disease and breast cancer, derived from the work of English and others (fig 1).1,19 We did not include other causes of death for which alcohol consumption is necessary, such as alcohol dependence syndrome, because they are unlikely to occur at the levels of consumption considered. Figure 2 shows the cause specific relative risks by alcohol consumption used in our analysis.
Figure 1.
Models for ischaemic heart disease from Corrao and others (used in main analysis) and derived from English and others1 18
Figure 2.
Cause specific relative risks by alcohol consumption. When men and women are not shown separately, same model is used for both
Alcohol consumption
Alcohol consumption was reported by respondents aged 16 and over in the 1996-7 general household survey.20 We computed the proportions of men and women in England and Wales drinking 0 units of alcohol a week, drinking occasionally (taken as 0.25 units a week), drinking from 1 up to 100 in increments of 1 unit a week, and drinking more than 100 units a week, for age bands 16-24, 25-34, 35-44, and so on up to over 85.
Mortality
We obtained data on mortality for England and Wales in 1997 by sex and 5 year age bands from the Office for National Statistics.21 We combined deaths into the same age bands as alcohol consumption.
Routine classification of deaths from stroke as ischaemic or haemorrhagic is unreliable, so we assigned total reported deaths from stroke according to the work of Bamford and others, who found that 67% of all strokes at age below 45 were ischaemic, increasing to 92% at age 85 and over.22 The same authors found that 60% of all deaths from stroke in the first year were ischaemic, and a further sensitivity analysis applied this lower fraction at all ages.
Pooling causes
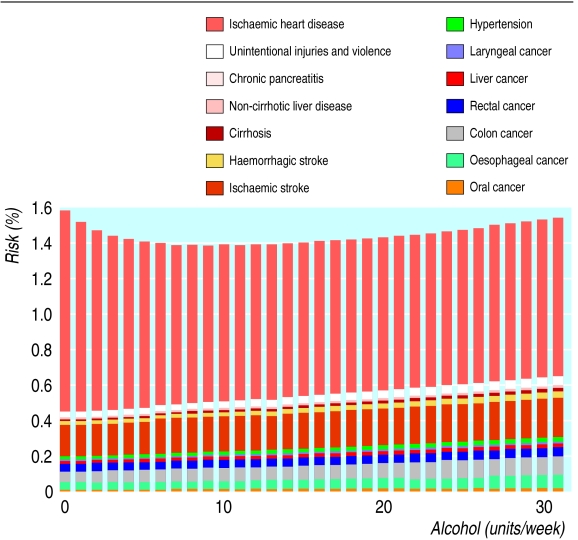
We estimated absolute risk functions from the relative risk functions for each sex, age band, and cause by using the observed number of deaths and the distribution of alcohol consumption (box B1). We summed the absolute cause specific risks to get all cause mortality for each sex and age band (fig 3). Cause specific relative risks were assumed independent of age, so age differences in all cause relative risks reflect differences in distributions of causes of death. The nadir is the level of alcohol consumption at which all cause risk is lowest.16 Uncertainty in the relative risk estimates is a major source of overall uncertainty.23 We derived confidence intervals reflecting this source of uncertainty only (box B2).
Box 1.
Computing all cause risk by alcohol consumption
Figure 3.
Derivation of all cause risks for men aged 65-74. Height of each bar is total risk of all alcohol related causes. Non-alcohol related causes not shown
Box 2.
Standard errors
Results
Alcohol risk relations
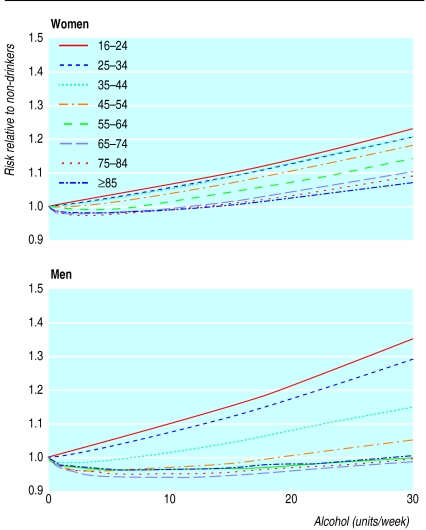
Figure 4 shows the relation between all cause mortality and alcohol consumption, by age and sex. The absolute risks vary widely (table 2), so we show all risks relative to non-drinkers. For women there is a positive relation up to age 35-44, but the U shape appears from age 45-54. For men aged below 35 the curve is steeper than it is for women, but the U shape appears at age 35-44, and the reduction in mortality in the lightest drinkers is larger and is sustained up to higher levels of consumption than for women. Drinking at the royal colleges' recommended limit increases risk by 9% in women aged 16-24 and by 23% in men aged 16-24. For government limits these figures are 15% and 32%, respectively.
Figure 4.
Risk of all cause mortality (relative to non-drinkers) by level of alcohol consumption in women and men
Table 2.
Nadirs and 5% bounds (units a week) with 95% confidence intervals showing uncertainty owing to relative risk functions and percentage annual risk
| Age (years)
|
||||||||
|---|---|---|---|---|---|---|---|---|
| 16-24
|
25-34*
|
35-44
|
45-54
|
55-64
|
65-74
|
75-84
|
⩾85
|
|
| Women | ||||||||
| Nadir | 0 | 0 | 0.2 (0.1 to 0.3) | 0.5 (0.4 to 0.6) | 1.6 (1.3 to 1.9) | 2.7 (2.3 to 3.1) | 3.2 (2.7 to 3.7) | 3.1 (2.4 to 3.8) |
| 5% upper bound | 7.9 (7.2 to 8.6) | 8.7 (7.8 to 9.6) | 9.3 (8.0 to 10.6) | 11.5 (9.8 to 13.2) | 14.5 (12.7 to 16.3) | 17 (14.8 to 19.2) | 18 (15.4 to 20.6) | 20 |
| Annual risk (%): | ||||||||
| Non-drinkers | 0.03 | 0.04 | 0.10 | 0.25 | 0.69 | 2.03 | 5.48 | 15.3 |
| Nadir | 0.03 | 0.04 | 0.10 | 0.25 | 0.68 | 1.98 | 5.35 | 15.0 |
| Men | ||||||||
| Nadir | 0 | 0.1 (0.1 to 0.1) | 1.8 (1.5 to 2.1) | 5.1 (4.5 to 5.7) | 7.2 (6.4 to 8.0) | 8.4 (7.4 to 9.4) | 8.0 (6.7 to 9.3) | 7.7 (6.0 to 9.4) |
| 5% upper bound | 5.3 (4.8 to 5.8) | 6.9 (6.3 to 7.5) | 13.3 (11.9 to 14.7) | 21 (18.6 to 23.4) | 26 (23.3 to 28.7) | 30 (26.4 to 33.6) | 31 (26.5 to 35.5) | 34 (27.5 to 40.5) |
| Annual risk (%): | ||||||||
| Non-drinkers | 0.06 | 0.08 | 0.14 | 0.39 | 1.17 | 3.39 | 8.47 | 19.4 |
| Nadir | 0.06 | 0.08 | 0.14 | 0.37 | 1.10 | 3.21 | 8.05 | 18.6 |
0.025 rounded to 0.
Estimated nadirs
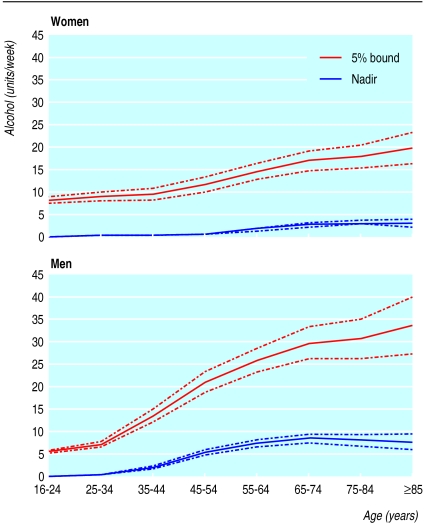
Figure 5 and table 2 show the estimated nadirs. The nadir increases from 0 at ages 16-34 to around 3 units a week in women and around 8 units a week in men aged over 65. The 95% confidence intervals around the estimated nadirs are narrow, but they account only for uncertainty in the relative risks.
Figure 5.
Level of alcohol consumption at which mortality is least (nadir) and level at which risk is raised by 5% above this minimum risk in women and men (95% confidence intervals show uncertainty due to relative risk functions only)
The 5% bounds are the levels of alcohol consumption at which risk is no more than 5% greater than the risk at the nadir. For women the 5% bound increases from 8 units a week at ages 16-24 to around 20 units a week over age 85. For men it increases from only 5 units a week at ages 16-24 (reflecting the steeper slope of the risk curve in young men compared with young women) to 30-35 units a week over age 65.
Sensitivity analyses
The alternative risk function for ischaemic heart disease lowers the nadirs, for example from 8 to 5 units a week in men aged over 65 (table 3). The alternative way of splitting deaths from stroke lowers the nadir for men aged over 75. Assuming ischaemic stroke to be unrelated to alcohol consumption slightly increases the nadirs, whereas assuming breast cancer to be unrelated to alcohol consumption has no appreciable effect.
Table 3.
Sensitivity analysis for nadir (units a week)
| Age
|
Women
|
Men
|
|||||||||||||||
|---|---|---|---|---|---|---|---|---|---|---|---|---|---|---|---|---|---|
| 16-24
|
25-34
|
35-44
|
45-54
|
55-64
|
65-74
|
75-84
|
⩾85
|
16-24
|
25-34
|
35-44
|
45-54
|
55-64
|
65-74
|
75-84
|
⩾85
|
||
| Main analysis | 0 | 0 | 0 | 0 | 2 | 3 | 3 | 3 | 0 | 0 | 2 | 5 | 7 | 8 | 8 | 8 | |
| Sensitivity analyses: | |||||||||||||||||
| Ischaemic heart disease—alternative risk function | 0 | 0 | 0 | 1 | 2 | 2 | 2 | 2 | 0 | 0 | 2 | 4 | 5 | 5 | 5 | 5 | |
| Breast cancer—alternative risk function | 0 | 0 | 0 | 0 | 2 | 3 | 3 | 3 | — | — | — | — | — | — | — | — | |
| Breast cancer excluded | 0 | 0 | 0 | 1 | 2 | 3 | 3 | 3 | — | — | — | — | — | — | — | — | |
| 40% of stroke deaths at all ages are haemorrhagic | 0 | 0 | 0 | 0 | 2 | 3 | 3 | 3 | 0 | 0 | 2 | 5 | 7 | 8 | 7 | 6 | |
| Ischaemic stroke excluded | 0 | 0 | 0 | 1 | 2 | 3 | 4 | 4 | 0 | 0 | 2 | 5 | 8 | 9 | 9 | 10 | |
| Gastroduodenal ulcers included | 0 | 0 | 0 | 0 | 2 | 3 | 3 | 3 | 0 | 0 | 2 | 5 | 7 | 8 | 8 | 8 | |
| Rectal cancer—women's risk function replaced with that of men's | 0 | 0 | 0 | 1 | 2 | 3 | 3 | 3 | — | — | — | — | — | — | — | — | |
All nadirs given to nearest 1 unit a week.
Discussion
By combining models for cause specific relative risks we produced age specific and sex specific estimates. The risk of death from alcohol related diseases increases with increasing alcohol consumption at younger ages, but the U shaped curve appears at age 35-55. The nadir increases with age to a maximum of 3 units a week in women and 8 units a week in men aged over 65.
Strengths and weaknesses
One possible weakness of our study is that our risk curves are averages and may not apply to each individual—for example, people with a history of alcohol misuse. Also, the cause specific relative risks may be biased or confounded. To avoid this Corrao and others excluded low quality studies if they differed systematically from high quality studies, explored publication bias, investigated differences between study designs, and excluded studies unadjusted for important confounders if they differed systematically from adjusted studies.14,15 The results could still be confounded by unmeasured factors. Bias could also have arisen from choice of an incorrect functional form or from wrongly including or excluding particular causes of death. We assumed that relative risk functions derived for all non-Mediterranean countries applied to England and Wales. The nadir for men may be larger in the United Kingdom than it is in the United States, so we may have underestimated the nadirs for England and Wales.16
Bias could arise through under-reporting of alcohol consumption.25,26 If all individuals used in estimating the relative risks or the distribution of alcohol consumption under-report to the same extent, then the nadir is underestimated to this same extent; but heavier drinkers may under-report more. The estimated nadir is therefore the level of reported (rather than actual) alcohol consumption at which risk is minimised. Cohorts with lower mean levels of consumption have lower nadirs for all cause mortality9: this could be due to greater under-reporting because of lower public acceptability of alcohol consumption or it could relate to the drinking cultures of different societies.27 Other possible biases include errors in coding death.
We related risk to average consumption of alcohol. Pattern of drinking is likely to be an important determinant of risk, especially risk of injury. Unfortunately data relating risk to both pattern and amount are minimal.28–30
We assumed that cause specific associations between alcohol and risk do not vary with age. This seems plausible and has some empirical support, but future evidence on age specific relative risks could easily be incorporated.31,32
We assumed that alcohol consumption only affects short term (5-10 year) risk. If, instead, the risk of cancer at age 75 relates to alcohol consumption at age 50, then in a life course perspective, alcohol consumption is more harmful at age 50 than we have estimated and more beneficial at age 75. Further work and evidence are required to explore this complex alternative.
Finally, we used mortality data for England and Wales in 1997. The nadirs are likely to decline over time in England and Wales if mortality from ischaemic heart disease declines for reasons unrelated to alcohol consumption.
Other studies
In systematic reviews of all cause mortality, the risk was lowest for men drinking 7-14 units a week and for women drinking under 7 units a week.16,33 These figures agree with our results for older men and women and presumably reflect the older ages of the populations most commonly studied. Studies of younger people have found a positive relation.34,35
Implications
If our results are not subject to bias or confounding and if the effects of alcohol consumption act over no more than 5-10 years, then the average person can decrease his or her risk of mortality by drinking at a level nearer the nadir.
Possible evidence based guidelines for sensible drinking can be derived from figure 5 and table 2 if no more than a 5% increase in risk of mortality is considered acceptable. Women would be advised to limit their drinking to 1 unit a day up to age 44, 2 units a day up to age 74, and 3 units a day over age 75. Non-drinking men aged 55-84 have a risk slightly more than 5% above the minimum risk, but we would not encourage these men to drink, because this might increase the overall public health burden of heavier drinking. Men would be advised to limit their drinking to 1 unit a day up to age 34, 2 units a day up to age 44, 3 units a day up to age 54, 4 units a day up to age 84, and 5 units a day over age 85. These levels are similar to current limits at older ages but considerably lower at younger ages.
Alternatively, the 9-32% increase in risk for younger people at the current limits of sensible drinking might be considered acceptable because it implies a smaller absolute increase than the same percentage at older ages, even allowing for additional years of life lost through deaths at a younger age. Public health must also take account of morbidity and social harm, which are harder to measure than mortality but much more adversely affected by alcohol consumption.36 Finally, as most deaths attributable to alcohol at younger ages are due to injuries, a greater focus could be placed on avoiding risky patterns of drinking rather than on reducing average alcohol consumption.37,38
Acknowledgments
We thank Gianni Corrao and Vincenzo Bagnardi for helpful discussions and for analysing their data further for us and Annie Britton for helpful discussions.
Footnotes
Funding: Alcohol Education and Research Council (grant No R17/97).
Competing interests: None declared.
References
- 1.English DR, Holman CDJ, Milne E, Winter MG, Hulse GK, Codde JP, et al. The quantification of drug caused morbidity and mortality in Australia 1995. Canberra: Commonwealth Department of Human Services and Health; 1995. [Google Scholar]
- 2.Anderson P, Cremona A, Paton A, Turner C, Wallace P. The risk of alcohol. Addiction. 1993;88:1493–1508. doi: 10.1111/j.1360-0443.1993.tb03135.x. [DOI] [PubMed] [Google Scholar]
- 3.Marmot M, Brunner E. Alcohol and cardiovascular disease: the status of the U shaped curve. BMJ. 1991;303:565–568. doi: 10.1136/bmj.303.6802.565. [DOI] [PMC free article] [PubMed] [Google Scholar]
- 4.Maclure M. Demonstration of deductive meta-analysis: ethanol intake and risk of myocardial infarction. Epidemiol Rev. 1993;15:328–351. doi: 10.1093/oxfordjournals.epirev.a036124. [DOI] [PubMed] [Google Scholar]
- 5.Klatsky AL. Epidemiology of coronary heart disease—influence of alcohol. Alcohol Clin Exp Res. 1994;18:88–96. doi: 10.1111/j.1530-0277.1994.tb00886.x. [DOI] [PubMed] [Google Scholar]
- 6.Chick J. Alcohol, health, and the heart: implications for clinicians. Alcohol Alcohol. 1998;33:576–591. doi: 10.1093/alcalc/33.6.576. [DOI] [PubMed] [Google Scholar]
- 7.Beaglehole R, Jackson R. Alcohol, cardiovascular diseases and all causes of death: a review of the epidemiological evidence. Drug Alcohol Rev. 1992;2:275–290. doi: 10.1080/09595239200185811. [DOI] [PubMed] [Google Scholar]
- 8.Poikolainen K. Alcohol and mortality: a review. J Clin Epidemiol. 1995;48:455–465. doi: 10.1016/0895-4356(94)00174-o. [DOI] [PubMed] [Google Scholar]
- 9.Rehm J, Bondy S Novartis Foundation Symposium, editors. Alcohol and cardiovascular diseases. Chichester: Wiley; 1998. Alcohol and all-cause mortality: an overview. [DOI] [PubMed] [Google Scholar]
- 10.Royal Colleges of Physicians, Psychiatrists, and General Practitioners. Alcohol and the heart in perspective: sensible limits reaffirmed. London: Royal Colleges; 1995. [PMC free article] [PubMed] [Google Scholar]
- 11.Inter-Departmental Working Group. Sensible drinking. London: Department of Health; 1995. [Google Scholar]
- 12.Holman CDJ, Armstrong BK. The quantification of alcohol-caused morbidity and mortality in Australia: the authors respond. Med J Aust. 1992;157:560–561. doi: 10.5694/j.1326-5377.1992.tb137360.x. [DOI] [PubMed] [Google Scholar]
- 13.Holman CDJ, Armstrong BK, Arias LN, Martin CA, Hatton WM, Hayward LD, et al. The quantification of drug caused morbidity and mortality in Australia (appendix 1). Canberra: Commonwealth Department of Community Services and Health; 1988. [Google Scholar]
- 14.Corrao G, Bagnardi V, Zambon A, Arico S. Exploring the dose-response relationship between alcohol consumption and the risk of several alcohol-related conditions: a meta-analysis. Addiction. 1999;94:1551–1573. doi: 10.1046/j.1360-0443.1999.9410155111.x. [DOI] [PubMed] [Google Scholar]
- 15.Corrao G, Rubbiata L, Bagnardi V, Zambon A, Poikolainen K. Alcohol and coronary heart disease: a meta-analysis. Addiction. 2000;95:1505–1523. doi: 10.1046/j.1360-0443.2000.951015056.x. [DOI] [PubMed] [Google Scholar]
- 16.White IR. The level of alcohol consumption at which all-cause mortality is least. J Clin Epidemiol. 1999;52:967–975. doi: 10.1016/s0895-4356(99)00076-1. [DOI] [PubMed] [Google Scholar]
- 17.van Gijn J, Stampfer MJ, Wolfe C, Algra A. The association between alcohol and stroke. In: Vershuren PM, editor. Health issues related to alcohol consumption. Washington DC: ILSI press; 1993. pp. 43–80. [Google Scholar]
- 18.Grobbee DE, Rimm EB, Keil U, Renaud S. Alcohol and the cardiovascular system. In: MacDonald I, editor. Health issues related to alcohol consumption, 2nd ed. Oxford: Blackwell Science; 1999. pp. 126–179. [Google Scholar]
- 19.McPherson K, Cavallo F, Rubin E. Alcohol and breast cancer. In: MacDonald I, editor. Health issues related to alcohol consumption, 2nd ed. Oxford: Blackwell Science; 1999. pp. 215–242. [Google Scholar]
- 20. Office for National Statistics, Social Survey Division. General household survey, 1996-1997 (computer file SN 3804), 2nd edn. Colchester, Essex: Data Archive [distributor], 5 Oct 1998.
- 21.Office for National Statistics. Twentieth century mortality: 95 years of mortality data in England and Wales by age, sex, year and underlying cause. [CD Rom and 1997. Update disk]. London: ONS; 1997. [Google Scholar]
- 22.Bamford J, Sandercock P, Dennis M, Burn J, Warlow C. A prospective study of acute cerebrovascular disease in the community: the Oxfordshire Community Stroke Project—1981-86. 2. Incidence, case fatality rates and overall outcome at one year of cerebral infarction, primary intracerebral and subarachnoid haemorrhage. J Neurol Neurosurg Psychiatry. 1990;53:16–22. doi: 10.1136/jnnp.53.1.16. [DOI] [PMC free article] [PubMed] [Google Scholar]
- 23.White IR, Nanchahal K. The number of deaths and person-years of life lost attributable to alcohol consumption in England and Wales in 1995. London: London School of Hygiene and Tropical Medicine; 1997. . [Technical report.] [Google Scholar]
- 24.Davison AC, Hinkley DV. Bootstrap methods and their application. Cambridge: Cambridge University Press; 1997. [Google Scholar]
- 25.Pernanen K. Validity of survey data on alcohol use. In: Gibbins RJ, editor. Research advances in alcohol and drug problems, vol 1. New York: Wiley; 1974. [Google Scholar]
- 26.Dawson DA. Measuring alcohol consumption: limitations and prospects for improvement. Addiction. 1998;93:965–968. doi: 10.1080/09652149835143. [DOI] [PubMed] [Google Scholar]
- 27.Rehm J. Alcohol consumption and mortality. What do we know and where should we go? Addiction. 2000;95:989–995. doi: 10.1046/j.1360-0443.2000.9579891.x. [DOI] [PubMed] [Google Scholar]
- 28.Rehm J, Ashley MJ, Room R, Single E, Bondy S, Ferrence R, et al. On the emerging paradigm of drinking patterns and their social and health consequences. Addiction. 1996;91:1615–1621. [PubMed] [Google Scholar]
- 29.Bondy SJ. Overview of studies on drinking patterns and consequences. Addiction. 1996;91:1663–1674. [PubMed] [Google Scholar]
- 30.Puddey IB, Rakic V, Dimmitt SB, Beilin LJ. Influence of pattern of drinking on cardiovascular disease and cardiovascular risk factors—a review. Addiction. 1999;94:649–663. doi: 10.1046/j.1360-0443.1999.9456493.x. [DOI] [PubMed] [Google Scholar]
- 31.Doll R, Peto R, Hall E, Wheatley K, Gray R. Mortality in relation to consumption of alcohol: 13 years observations on male British doctors. BMJ. 1994;309:911–918. doi: 10.1136/bmj.309.6959.911. [DOI] [PMC free article] [PubMed] [Google Scholar]
- 32.Fuchs CS, Stampfer MJ, Colditz GA, Giovannucci EL, Manson JE, Kawachi I, et al. Alcohol consumption and mortality among women. N Engl J Med. 1995;332:1245–1250. doi: 10.1056/NEJM199505113321901. [DOI] [PubMed] [Google Scholar]
- 33.Holman CDJ, English DR, Milne E, Winter MG. Meta-analysis of alcohol and all-cause mortality: a validation of NHMRC recommendations. Med J Aust. 1996;164:141–145. doi: 10.5694/j.1326-5377.1996.tb122011.x. [DOI] [PubMed] [Google Scholar]
- 34.Andreasson S, Romelsjo A, Allerbeck P. Alcohol, social factors and mortality among young men. Br J Addiction. 1991;86:877–887. doi: 10.1111/j.1360-0443.1991.tb01843.x. [DOI] [PubMed] [Google Scholar]
- 35.Rehm J, Sempos CT. Alcohol consumption and all-cause mortality. Addiction. 1995;90:471–480. doi: 10.1046/j.1360-0443.1995.9044712.x. [DOI] [PubMed] [Google Scholar]
- 36.Murray JL, Lopez AD, editors. The global burden of disease: a comprehensive assessment of mortality and disability from diseases, injuries and risk factors in 1990 and projected to 2020. Cambridge, MS: Harvard University Press; 1996. [Google Scholar]
- 37.White IR, Altmann DR, Nanchahal K. ‘Optimal’ levels of alcohol consumption for men and women at different ages, and the all-cause mortality attributable to drinking. London: London School of Hygiene and Tropical Medicine; 2000. . [Technical report.] [Google Scholar]
- 38.Britton A, McPherson K. Mortality in England and Wales attributable to current alcohol consumption. J Epidemiol Community Health. 2001;55:383–388. doi: 10.1136/jech.55.6.383. [DOI] [PMC free article] [PubMed] [Google Scholar]


