Abstract
Objective: Charting systems with decision support have been developed to assist with medication charting, but many of the features of these programs are not properly used in their clinical application. An analysis of medication error reports at LDS Hospital revealed the occurrence of errors that should have been detected and prevented by decision support features if real-time entry at the bedside had taken place. The aim of this study was to increase the real-time bedside charting behavior of nurses.
Design: A quasiexperimental before and after design was used. The study took place in two 40-bed surgical units, one of which served as the study unit, the other as control unit. The study unit received educational intervention about error avoidance through real-time bedside charting, and 12 weeks of monitoring and performance feedback. The real-time and bedside charting rates for the study and control units were measured before and after the intervention.
Results: Before the intervention on the study unit, the real-time charting rate was 59% and the bedside rate was 40%. At the conclusion of a 12-week intervention period, the real-time rate increased to 73% and the bedside rate increased to 63%. Postintervention real-time rates were 75% after eight weeks and remained at 75% after one year. Equivalent control unit real-time rates varied from 53% to 57%, and bedside rates varied from 34% to 44% during the same intervals.
Conclusion: Targeted educational intervention and monitored feedback yielded measurable improvements in the effective use of the computerized medication charting system and must be an ongoing process.
Medication administration and charting may occupy up to 33% of nursing time in the hospital setting.1 The medication and charting aspect of nursing practice have been greatly affected by advances in medicine and technology. New drugs, new devices for administration, and computerized systems for documenting the medication administration process present an ever-changing reality for nurses. Improving patient safety through the use of information technology has long been a goal of clinical information systems.2 One aspect of information technology, computerized charting programs to assist with the medication administration process, has proven to be effective in reducing medication errors.1 While information technology has become an important factor in the improvement of patient safety, there is still a great deal to be learned about which technologies and methodologies will be most effective in improving patient safety.3 An aspect that should not be overlooked is monitoring the technology after the initial implementation. Much effort goes into implementing new programs and products without subsequent and continued assessment of whether they are being used as originally anticipated.
Recent studies reveal that medication administration errors account for from 19% to 28% of medication errors in hospitalized patients.4,5,6,7,8,9,10 While failure to comply with procedure has been a factor in medication administration error,8 failure to properly use the information system, or to ignore alerts or warnings, have also resulted in preventable errors.2,11,12 Nurses may not follow system instructions, may fail to maintain equipment, may intentionally misuse equipment, and may bypass required training. Discrepancies between anticipated system use and actual use can result in preventable system errors.11 Although much has been written about how information technology can help reduce medication errors,10,11,12,13,14,15,16 little has been written about how information technology relates to errors in nursing medication charting systems.11,17,18 Detection and prevention of medication errors require investigating their causes13; looking at the way a system is used or not used is a first step in understanding.
During a quality improvement process at LDS Hospital, it became apparent that many medication errors that were occurring were those that the computer system was designed to prevent. Further, it was determined that workflow processes did not support the original system design because nurses bypassed many of the built-in alerts and warnings. A further study addressed whether educational intervention and monitoring could change the charting practices of nurses. The study examined medication charting by nurses using a computerized medication charting program and sought to determine whether educational intervention and charting performance feedback could influence real-time charting at the bedside.
Background
The HELP (Health Evaluation through Logical Processing) hospital information system at LDS Hospital has been in operation since 1977.19,20 Although HELP handles financial and administrative functions, it is best known for its clinical applications. In its clinical role, the system has become an integral part of the patient care process and is used by a wide variety of clinicians (physicians, nurses, respiratory and physical therapists) for clinical data entry and review. A distinguishing feature of the HELP system is its ability to provide clinical decision support,20 such as the nursing medication charting module that has been in use since 1986 and was designed to provide alerts and reminders to assist nurses with the medication administration and charting process. The system was designed to encourage real-time (at the time of administration) charting at the bedside on terminals placed at the head of each patient's bed. The medication charting program is part of a fully integrated menu-driven clinical information system that documents all medications given. The medication charting data captured includes patient identifier, room number, terminal identifier, medication name, dose, route, time of administration, computer system time of charting, reason for early or late administration (if applicable), and the identification of the nurse giving the medication. Alerts such as early administration warning, late administration warning, missed medication warning, and drug order discontinued warning are examples of features designed to prevent errors. Medication administration data are also made available in the HELP system to optimize other patient care and decision-making applications.19
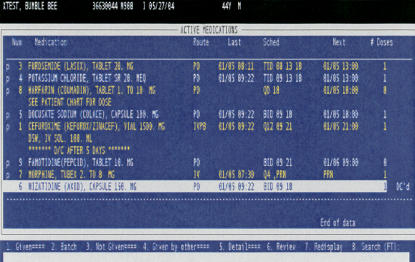
The intended workflow for which the medication program was designed begins with the nurse reviewing the medication list from the terminal screen or printed worksheet at the beginning of the shift. Any questions or discrepancies regarding medications are to be clarified by reviewing the written physician order. At the time of administration, medications are removed from the medication cart at the medication station and taken to the patient bedside. Nurses then log onto the bedside terminal after which they are presented with the record for the patient assigned to that bed. The nurse retrieves the active medication profile (▶), selects from the profile the medications being administered, verifies medications to be given against those on the medication profile, checks patient armband identification, documents the administration time, and administers the medication. This workflow allows for the provision of any alerts or warnings before administration of the medication.
Figure 1.
Active medication profile.
For purposes of this study, an entry was considered to be real-time if the time that the nurse chose to attach to the administration occurred within 1 minute of the computer system storage time for each medication. A medication charting event was considered to be a bedside entry if the terminal on which the charting occurred matched the terminal at the patient's bedside. The ability to study the timeliness and location of the charting episode in comparison to the administration episode is not feasible with manual methods of charting because manual charting captures only the administration time written by the nurse, and there is no way to determine when or where the charting actually occurred. Computerization of the medication administration process provides the data needed to study the medication charting process in greater detail.
The medication data captured in the HELP system are valuable sources of information for quality improvement studies. The Medication Error Team (MET) is a multidisciplinary group of clinicians led by the Quality Improvement Department. Its task is to improve medication error reporting, provide trending of medication errors, and facilitate process improvements to reduce medication error. An important assignment of the MET is the analysis of medication errors.
Much of the data available for this analysis come from the HELP system medication charting data and from medication event reports completed by nurses. Medication event reports are completed using a locally developed computer program available on the HELP system. The reports contain information about the event that occurred or had the potential to occur. The nursing staff is instructed to complete a medication event report for every administration error or “near-miss” event that they encounter. Efforts have been made toward educating the nursing staff that event reports are tools to improve patient care, to facilitate institutional learning, and to improve the medication processes.
The MET reviews medication event reports looking for areas for improvement of the entire medication administration process. The MET reviewed 829 medication event reports that occurred during the nine-month period between April and December 2000. These data were used for quality improvement purposes and were not published. From an analysis of these reports, it became evident that 240 or 29% of the errors seen were those that the HELP system medication module was designed to prevent. Errors such as early administration, late administration, missed doses, wrong drug, and administration after discontinuation should have been prevented if the HELP system had been used to chart the medication in real-time at the bedside.
Examples of Preventable Medication Errors
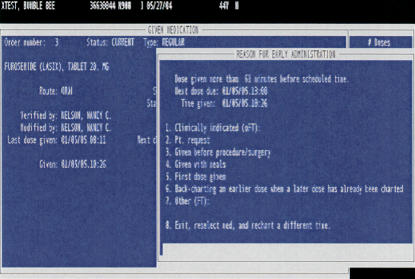
The following are examples of errors seen and a description of how the HELP system should have prevented them if real-time bedside charting had been carried out. As illustrated in ▶, there were event reports describing medications being administered early, before the scheduled dose time, or, with prn (as needed) medications, being given before the next allowed time. The HELP system has a warning that alerts the documenting clinician that the dose is being given early. The early warning parameters will alert if a dose is documented 60 minutes before the next dose due time. The early dose warning is based on the documented administration time of the previously charted dose, or in the case of a first dose, the scheduled first dose start time. If the medication is charted for a time that is earlier than the due time, an alert warns the nurse that the administration is early and requires a reason be entered for the early administration.
Figure 2.
Early administration warning.
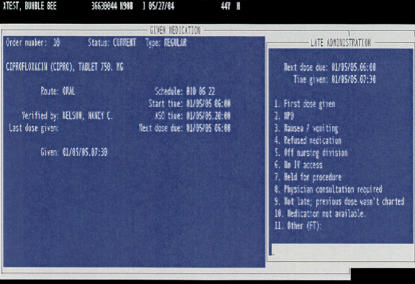
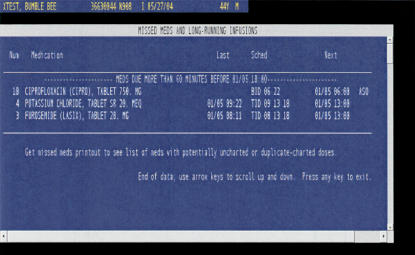
There were event reports of late and/or missed doses. As shown in ▶, the HELP system screen display lists medications in the order of the administration due time. The medication displayed on the top of the list should visually cue the nurse and indicate the sequence of administration. Charting a medication other than the one at the top of the display list should prompt the nurse that medications are being given out of sequence and might possibly be late. The charting program detects and provides a late warning, as shown in ▶, if a medication is charted more than one hour after the scheduled due time and requires the nurse to enter a reason and update the next dose due time. ▶ shows how the charting program also detects and provides a missed medication warning for any medications that have not been documented before an end-of-shift report is generated, making discovery of errors of omission possible before the shift is over.
Figure 3.
Computer-detected late administration warning.
Figure 4.
Computer-detected missed medication warning.
There were event reports of wrong medications being administered to patients. The HELP system medication charting program is available at bedside terminals in patient rooms. Through the admission/discharge/transfer program of the HELP system, patients are linked to the bedside terminal in the patients' room. When the nurse logs into a bedside terminal, the patient-identifying information for that patient is presented on the screen. If the medications are charted at the patient's bedside before they are administered, the nurse has the opportunity to be alerted to a possible wrong drug error since only medications for the patient registered to that bed appear on the patient's computer profile, making it very difficult to chart a medication that is not on the patient's active medication profile (▶).
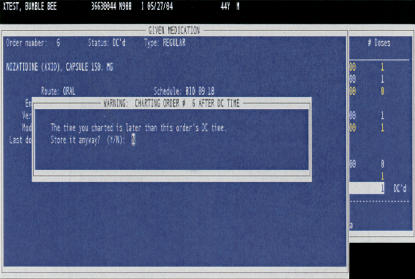
There were event reports describing medications being administered after the medication had been discontinued. The HELP system provides a visual display indicating, in reverse video highlight, that a medication has been discontinued and provides a pop-up warning, as ▶ shows, if the medications are charted after the medication has been discontinued.
Figure 5.
Charting after discontinue warning.
Of the 829 event reports analyzed, we found that 240 or 29% of the medication errors could have been prevented by the HELP system alerts and warnings described if the medication charting had taken place at the bedside before administration. We then asked “why did these preventable errors occur?”
Analysis of the preventable errors led to the discovery of workflow processes that subverted the intended safety features of the HELP system. Although charting medications in real-time (immediately before administration) at the bedside terminal was the workflow process taught to nurses when the charting program was first implemented (and is currently taught at new nurse orientation), it became clear that these workflow processes were not routinely followed. A convenience sample of 3,900 medication charting instances from throughout LDS Hospital took place between July 2001 and September 2001 and compared the nurse-assigned time of medication administration to the computer system time of entry. The results revealed that only 52% of medications were documented in real-time (administration time within 1 minute of the computer system storage time).
Observations of the medication charting process revealed a discrepancy between the desired workflow for which the system was designed and the actual workflow. The observations were made by the investigator before the initiation of this study as part of three times weekly rounding done on nursing units while in the role of Clinical Information Systems Coordinator. Observations of the workflow process showed that nurses frequently charted medications at nursing station terminals remote from the bedside after the medications had been administered and frequently administered medications by referring to a printed medication work sheet (that was originally intended to be used only as a beginning-of-shift organizing tool) rather than using the active medication screen in real-time at the bedside terminal.
We then asked “what could be done to influence charting practice so that it occurred nearer the time of medication administration and occurred at the bedside terminal?” Clinical education was chosen as the key mechanism to promote change. Providing instruction on patient safety and its relationship to quality improvement may be beneficial to achieving the intended behavioral change.21 Continuous Quality Improvement (CQI) theory teaches that the practitioners will use information and their own best intentions to improve their care processes. CQI methods involving performance feedback have been used successfully as an approach to quality management in medical domains.22
A study was proposed to measure the medication charting practice and attempt, by providing educational intervention and performance feedback, to encourage real-time bedside medication charting.
Methods
Study Proposal
The objective of this study was to improve the study unit's charting practice through the use of educational intervention, performance monitoring, and feedback. The following steps were taken:
Collection of baseline data to determine the percentage of real-time and bedside medication administration on a study and control unit. The data collected included patient identifier, room number, terminal identifier, medication name, dose, route, time of administration, computer system time of charting, reason for early or late administration (if applicable), and nurse name.
An educational intervention on the study unit was initiated to increase the nurses' awareness of the benefits of computerized real-time bedside medication charting, effective use of the HELP computer system for medication charting, and general medication error detection and prevention strategies.
Collection of data on the percentage of real-time medication administration and bedside charting for a study and a control unit after the study unit educational intervention.
Monitoring and provision of weekly feedback on the study unit real-time and bedside charting performance.
Monitoring of the real-time and bedside charting rates for eight weeks after completing the intervention to determine whether charting behavior changes were maintained in the absence of additional feedback.
Monitoring of the real-time and bedside charting rates one-year post-intervention to determine whether any improvements in real-time charting were sustained.
The findings reported here are based on these data collections, interventions, and analyses.
Study Site and Participants
The study took place at LDS Hospital, a 525-bed tertiary-care hospital. Two surgical nursing units were selected for the medication charting study. A 40-bed surgical unit caring for population of orthopedic, plastic surgery, ear-nose-throat, and general medical/surgical patients was selected as the intervention unit. A 40-bed surgical unit caring for a population of gynecology, urology, bone marrow, medical and surgical oncology, gastric bypass, and general surgery patients was selected as the control unit because it most closely matched the study unit in size and patient type. Both nursing units have similar nurse-patient ratios and nurse staffing patterns. The nursing units are similar in physical layout and terminal placement, with terminals available at each patient bedside, at the central nursing stations, and at each of two hallway substations. Medications are administered and documented by registered nurses and licensed practical nurses on both units. Medication technicians are not used in the facility. The study unit nurse manager agreed to the educational intervention plan and volunteered the unit for participation. The control unit was not made aware of the study and simply served as a passive control against which the effects of changes due to nonspecific factors taking place during the study period could be measured.
Preintervention Phase
The LDS Hospital Institutional Review Board approved the study in 2001. Medication charting data were collected daily on the intervention and control units for eight weeks beginning in October 2001. Real-time percentage charting rates were calculated for each day. For example, if there were 337 medication entries for a given day and 166 of those entries had a system time within 1 minute or less than the administration time, the real-time rate calculated for that day was 49%. The charting performance of individual nurses was known only to the investigator and was not used as part of the study; only the collective nursing team percentage rates were used, eliminating the need to identify individual nurses. The preintervention data served as the baseline with which comparisons were later made to determine the effect of the intervention. The manager on the intervention unit was aware of the baseline data collection, but the nursing staff members were not told of the study during the time that baseline charting rates were determined.
Intervention Phase
The intervention phase began January 15, 2002, with presentations to the nursing staff on the intervention unit during both the early morning and late afternoon sessions of their department staff meeting. The 30-minute presentations included a review of LDS Hospital nursing medication charting policies, information on error detection and prevention through the use of real-time bedside medication charting, and the decision support features of the HELP medication module. The discussion focused on the decision support features built into the HELP system to prevent errors and how, by subverting the intended process, preventable errors may be occurring. Examples of errors preventable through charting of medications at the bedside terminal in real-time were presented using screen shots from the HELP system and data from event reports that had actually occurred on the unit in 2001. The preventable errors discussed included early dose, late dose, missed dose, wrong medication, and medication given after discontinue order. The five “rights” of medication administration (right patient, right medication, right time, right dose, and right route) were discussed and renamed the “six Rs” by adding real-time to the list. The study unit real-time charting rate, determined from the data collected October and November 2001, was presented to the staff and was used as the baseline from which we measured change. The real-time charting rate for the preintervention phase was 59%. The goal set by the unit nurse manager and staff was to document 90% of the medications in real-time, and the monitoring of progress commenced the day after the staff meeting presentations.
The educational presentations were attended by 76% of the study unit nursing staff. Staff who did not attend either presentation were required to review and sign the staff meeting minutes. Copies of the PowerPoint presentation were included in the minutes as was a detailed description of the project. A large poster summarizing the presentation given in the staff meetings was also placed in the staff report room. Stickers with the slogans “chart the med at the bed,” “real time all the time,” and “real time saves time” were placed on terminals throughout the unit. A newsletter explaining the project was also sent to the homes of each staff member by the unit nurse manager the week after the study began.
To help the staff see progress toward the goal, the unit rates of real-time charting were posted each week. The weekly real-time charting rates were posted in the staff report room so as to be conspicuous, were posted at the same time and place each week, and included provision of doughnuts for all three shifts on the day of posting. A bar graph with the percentage rates of real-time charting was updated and included with each posting so the ongoing progress from the outset could be observed. The investigator made rounds each day to determine whether staff had any questions or comments about the project. The intervention phase of the study continued for 12 weeks, ending April 9, 2002. The intervention phase was originally planned for eight weeks, but results from the first six weeks showed a steady increase in the real-time charting rate and it was felt that an additional four weeks would give time to see whether the rate of real-time bedside charting had plateaued.
Postintervention Phase
The postintervention phase began on April 10, 2002, and ran for eight weeks. At the same time, the conspicuous monitoring, reporting, and discussion were discontinued. A poster summarizing the 12 weeks of progress toward the goal was presented to the nursing staff. The staff was thanked for its participation, and staff members were approached by the investigator and given the opportunity to offer comments on the study process. Data collection actually continued for another eight weeks to determine the level of continued compliance once the active intervention was withdrawn. In August 2002, the study unit staff were given a final debriefing on the entire project.
One-Year Follow-up Phase
For one week (February 25 to March 3, 2003) at the one-year anniversary of the intervention phase, categorically identical data were again collected using the same procedure on the intervention and control units to determine level of change in charting behavior over time.
Results
A total of 118,612 medication charting instances were included in the study; 55,080 of those were from the study unit and 63,532 were from the control unit (▶). While the original study was designed to look at the real-time charting rate, it became evident that we should also examine the rate at which the charting was actually being performed at the bedside terminal. While the ideal workflow was real time at the bedside, there were other workflows that fit the criteria originally set for real time but not actually occurring at the bedside. For example, it was possible to chart medications in real time remotely from the bedside by completing the charting process at a nonbedside terminal and then taking the medication to the patient room for administration. It was also possible to complete the charting process in real time after administration of the medication by accepting the computer system time as the documented administration time. While both of these behaviors would fit the criteria of real-time charting, both have the possibility of bypassing safety features and the possibility of wrong medication and/or wrong time. When charting occurs at the bedside terminal before administration, the likelihood of administering an incorrect medication is minimized since the medication does not appear on the patient's medication profile and the nurse is not able to continue the charting process.
Table 1.
Real-time and Bedside Charting Data for the Study and Control Unit for All Study Phases
| Study unit real-time charting rate phase | N | % Real time | 95% CI | χ2 (df1) | p | N | Odds ratio | 95% CI |
| Preintervention | 16,372 | 59.5 | 0.587–0.602 | |||||
| Intervention | 20,751 | 72.5 | 0.719–0.732 | 706.04 | <0.001 | 37,123 | 1.80 | 1.72–1.88 |
| Postintervention | 15,421 | 75.8 | 0.751–0.765 | 964.95 | <0.001 | 31,793 | 2.14 | 2.04–2.24 |
| Follow-up | 2,536 | 75.2 | 0.735–0.769 | 230.26 | <0.001 | 18,908 | 2.07 | 1.88–2.27 |
| Control unit real-time charting rate phase | N | % Real time | 95% CI | χ2 | p | N | Odds ratio | 95% CI |
| Preintervention | 18,453 | 53.5 | 0.528–0.542 | |||||
| Intervention | 24,245 | 59.2 | 0.586–0.598 | 139.20 | <0.001 | 42,698 | 1.26 | 1.21–1.31 |
| Postintervention | 18,231 | 56.9 | 0.562–0.576 | 43.00 | <0.001 | 36,684 | 1.15 | 1.10–1.20 |
| Follow-up | 2,603 | 57.2 | 0.552–0.591 | 12.38 | <0.001 | 21,056 | 1.16 | 1.07–1.26 |
| Study unit bedside charting rate phase | N | % Bedside | 95% CI | χ2 | p | N | Odds ratio | 95% CI |
| Preintervention | 16,372 | 40.6 | 0.399–0.414 | |||||
| Intervention | 20,751 | 63.0 | 0.623–0.636 | 1,837.60 | <0.001 | 37,123 | 2.48 | 2.38–2.59 |
| Postintervention | 15,421 | 66.6 | 0.659–0.673 | 2,152.58 | <0.001 | 31,793 | 2.91 | 2.78–3.05 |
| Follow-up | 2,536 | 58.5 | 0.565–0.604 | 285.80 | <0.001 | 18,908 | 2.05 | 1.89–2.24 |
| Control unit bedside charting rate phase | N | % Bedside | 95% CI | χ2 | p | N | Odds ratio | 95% CI |
| Preintervention | 18,453 | 33.6 | 0.329–0.343 | |||||
| Intervention | 24,245 | 41.0 | 0.404–0.417 | 246.21 | <0.001 | 42,698 | 1.38 | 1.32–1.43 |
| Postintervention | 18,231 | 38.5 | 0.378–0.393 | 96.81 | <0.001 | 36,684 | 1.24 | 1.19–1.29 |
| Follow-up | 2,603 | 43.8 | 0.419–0.458 | 104.05 | < 0.001 | 21,056 | 1.54 | 1.42–1.68 |
Chi-square, p, N, odds ratio, and confidence interval calculated from comparisons to the preintervention data for each phase.
Intervention Phase
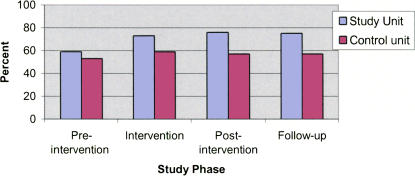
The baseline real-time charting average observed for the eight-week period immediately before the beginning of the study was 59% for the intervention unit and 53% for the control unit (▶). During the 12-week intervention phase, the study unit real-time medication charting rate increased to 72% while the control unit rate was 59%. ▶ presents the results for the confidence intervals, χ2 statistic, odds ratio, and corresponding confidence intervals for the study and control units compared to the baseline data. While differences in the proportion of change for both units were significant, the χ2 statistic was much larger on the study unit and the magnitude of the effect, as demonstrated by the odds ratio, was also stronger. Because of the large number, χ2 had power to detect small changes. The odds ratio was a way to express magnitude of association and provided an indicator of the likelihood of the difference in proportion being attributed to chance.23
Figure 6.
Real-time charting by study phase.
The real-time charting rates on the study unit show weeks one through three settling in the low 60% range. After week four, the rates stay above 70% and then peak at 81% during week six. The real-time charting rates for the study unit are shown for comparison in ▶, and no rate is higher than 63%.
Figure 7.
Real-time charting weeks 1–20.
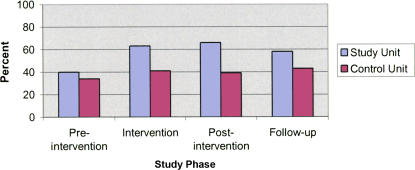
The baseline for bedside charting, calculated from the two months of preintervention data, was 40% for the study unit and 34% for the control unit. The bedside charting rate for the study unit increased to 63% during the intervention phase, while the control unit was 41% (▶).
Figure 8.
Bedside charting by study phase.
The increase in real-time charting and bedside charting seen on the control unit could have been caused by “contamination” by float pool nurses who may have worked on both units. It was not possible to control the movement of staff who “float” to all units. When the rates for real-time charting were recalculated using only the study unit staff, the real-time rate increased by an average of only 3% for all phases. When the rates for real-time charting were recalculated using only the control unit staff, the rate increased by only 1% for all phases.
Postintervention Phase
The postintervention results showed that the real-time charting behavior was maintained 75% for the eight-week period immediately following the withdrawal of the monitoring and feedback intervention. The control unit average for real-time charting for the same time period was 57%. The bedside charting rate for the study unit increased from 63% to 66% during the eight-week postintervention phase while the control unit dropped from 41% to 39%.
One-Year Follow-up Phase
The data collected at the one-year anniversary of the intervention phase showed the study unit average for real-time charting at 75%, while the control unit average was 57%. The bedside charting rate for the study unit was 58%, while the control unit rate was 43%.
Discussion
In this study, we examined whether an educational intervention followed by 12 weeks of monitoring, feedback, and reminders influenced the charting behavior of nurses toward real-time and bedside charting. The results showed a statistically significant increase in both real-time charting and bedside charting on the study unit after the intervention was provided. While the χ2 test of association showed statistically significant changes for both the study unit and the control unit, these associations were much stronger for the study unit. The odds ratio for comparing the study unit to the control unit showed the magnitude of the effect to be much greater on the study unit than on the control unit.
While the nurses on the study unit were the target of the intervention, we did not control the movement of the float and prn staff, which could have led to contamination and could explain some of the behavior changes on the control unit. Contamination must be considered a possibility as the poster explaining the project was available in the report room on the study unit and the stickers reminding the staff to chart in real-time and at the bedside could have easily been seen by float and prn staff who might have worked on the study unit.
Although medication error data were the impetus for this study, a known limitation surrounding voluntary error reporting is the fact that the true error frequency is many times greater than that measured by voluntary reporting15 and medication error rates are inherently difficult to determine accurately.9 The numbers of error reports during the study period were not of sufficient number to provide the power needed to determine statistical significance, and therefore the relationship between the timeliness of medication charting and medication error rates was not able to be quantified by this study.
One of the most encouraging findings of the study was the data at the one-year follow-up. While it was expected that the real-time and bedside charting behavior of the nurses would improve during the intervention period with the continuous reminders, posting of data, and the general “in-your-face” presence, the expectation was that the behavior change might not be sustained during the eight-week postintervention phase and might drop off even more dramatically by the one-year anniversary. The finding that the study unit real-time charting rate and the bedside charting rate actually increased during the postintervention phase and remained above the preintervention baseline measure by the one-year anniversary of the study was encouraging.
A future study might evaluate which of the interventions provided the impetus for the behavior change; the educational intervention or the monitoring and performance feedback steps. Is it possible that the staff as a whole never fully understood the important safety features being subverted by not charting in real time at the bedside and only needed the educational intervention as impetus for the change, or was it also possible that the performance feedback was all that was needed to drive the behavior change? A study in which the interventions are provided separately may help to determine which of these interventions is more effective.
Computerized medication charting has the potential to increase the safety of the medication administration process by structuring actions and providing decision support feedback to clinicians at the point of care; however, careful attention must be paid to the actual use of these systems to obtain the maximum intended benefit in the clinical environment.
Nurses can be instrumental in implementing changes to improve patient safety. Targeted interventions can yield improvements. This study demonstrates that educational interventions along with performance monitoring and feedback can have an impact on real-time and bedside medication charting.
References
- 1.Pepper GA. Errors in drug administration by nurses. Am J Health Syst Pharm. 1995;52:390–5. [DOI] [PubMed] [Google Scholar]
- 2.Bates DW, Gawande MD. Improving safety with information technology. N Engl J Med. 2003;348:2526–34. [DOI] [PubMed] [Google Scholar]
- 3.Patel VL, Bates DW. Cognition and measurement in patient safety research. J Biomed Inform. 2003;36:1–3. [DOI] [PubMed] [Google Scholar]
- 4.Barker KN, Flynn EA, Pepper GA, Bates DW, Mikeal RL. Medication errors observed in 36 health care facilities. Arch Intern Med. 2002;162:1897–903. [DOI] [PubMed] [Google Scholar]
- 5.Benjamin DM. Reducing medication errors and increasing patient safety: case studies in clinical pharmacology. J Clin Pharmacol. 2003;43:768–83. [PubMed] [Google Scholar]
- 6.Douglas J, Larrabee S. Bring barcoding to the bedside. Nurs Manage. 2003;34:36–40. [DOI] [PubMed] [Google Scholar]
- 7.Ball MJ, Douglas JV. Redefining and improving patient safety. Methods Inf Med. 2002;41:271–6. [PubMed] [Google Scholar]
- 8.Leape LL, Bates DW, Cullen DJ, Cooper J, Demonaco HJ, Gallivan T, et al. Systems analysis of adverse drug events. ADE Prevention Study Group. JAMA. 1995;274:35–43. [PubMed] [Google Scholar]
- 9.Low DK, Belcher JV. Reporting medication errors through computerized medication administration. Comput Inform Nurs. 2002;20:178–83. [DOI] [PubMed] [Google Scholar]
- 10.Greenly M, Gugerty B. How bar coding reduces medication errors. Nursing. 2002;32:70. [DOI] [PubMed] [Google Scholar]
- 11.Tribble DA. How automated systems can (and do) fail. Am J Health Syst Pharm. 1996;53:2622–7. [DOI] [PubMed] [Google Scholar]
- 12.Igboechi CA, Ng CL, Yang CS, Buckner AN. Impact of computerized prescriber order entry on medication errors at an acute tertiary care hospital. Hosp Pharm. 2003;39:227–31. [Google Scholar]
- 13.Leape LL. Preventing adverse drug events. Am J Health Syst Pharm. 1995;52:379–82. [DOI] [PubMed] [Google Scholar]
- 14.Leape LL, Epstein AM, Hamel MB. A series on patient safety. N Engl J Med. 2002;347:1272–4. [DOI] [PubMed] [Google Scholar]
- 15.Cox PM Jr, D'Amato S, Tillotson DJ. Reducing medication errors. Am J Med Qual. 2001;16:81–6. [DOI] [PubMed] [Google Scholar]
- 16.Davis NM. Can computers stop errors? Am J Nurs. 1994;94:14. [PubMed] [Google Scholar]
- 17.Marr PB, Duthie E, Glassman KS, Janovas DM, Kelly JB, Graham E, et al. Bedside terminals and quality of nursing documentation. Comput Nurs. 1993;11:176–82. [PubMed] [Google Scholar]
- 18.Willson D. Survey of nurse perceptions regarding the utilization of bedside computers. Proc Annu Symp Comput Appl Med Care. 1994:553–7. [PMC free article] [PubMed]
- 19.Kuperman GJ, Gardner RM, Pryor TA. HELP: a dynamic hospital information system. New York: Springer-Verlag, 1991.
- 20.Gardner RM, Pryor T, Warner H. The HELP hospital information system: update 1998. Int J Med Inf. 1999;54:169–82. [DOI] [PubMed] [Google Scholar]
- 21.Kohn LT, Corrigan JM, Donaldson MS, editors. To err is human. Washington, DC: National Academy Press, 1999.
- 22.Kuperman G, James B, Jacobsen J, Gardner RM. Continuous quality improvement applied to medical care: experiences at LDS Hospital. Med Decis Making. 1991;11(4 Suppl):S60–5. [PubMed] [Google Scholar]
- 23.Bland J, Altman D. Statistics notes. The odds ratio. BMJ. 2000;320:1468. [DOI] [PMC free article] [PubMed] [Google Scholar]


