

Abstract
Potatoes are a critical staple crop worldwide, yet their yield is significantly constrained by salt stress. Understanding and enhancing salt tolerance in potatoes is crucial for ensuring food security. This study evaluated the salt tolerance of 17 diverse potato varieties using principal component analysis, membership function analysis, cluster analysis, and stepwise regression analysis. Comprehensive evaluation based on morphological, physiological, and biochemical indicators divided the varieties into three categories, identifying Z1264-1, Z700-1, Z943-1, Z1266-1, Z510-1, and Z1076-1 as having strong salt tolerance. Regression equations established stem thickness, root length, and catalase activity as rapid identification markers for salt tolerance in tetraploid potatoes. Transcriptome analysis of the highly tolerant variety Z1076-1 identified 68 differentially expressed miRNAs (DE miRNAs). qRT-PCR validation for eight randomly selected DE miRNAs confirmed consistent expression trends with transcriptome data. Predicted target genes of these miRNAs are involved in calcium channel signaling, osmotic regulation, plant hormone signaling, and reactive oxygen species clearance. Our findings provide valuable insights for the identification and screening of salt-tolerant potato germplasms. The findings also lay the foundation for studying molecular mechanisms of salt tolerance and advancing genetic breeding efforts to cultivate more resilient potato varieties.
Supplementary Information
The online version contains supplementary material available at 10.1038/s41598-025-86276-5.
Keywords: Potato, Salt tolerance, Comprehensive evaluation, MiRNA-Seq, Differential expression
Subject terms: Plant stress responses, Non-coding RNAs, Transcriptomics, Plant physiology
Introduction
Soil salinization seriously affects crop yield and has become one of the main environmental factors restricting the sustainable development of global agriculture. The low organic matter content, low soil fertility, and poor physical and chemical properties in saline alkali soil restrict the normal growth and development of crops1. Globally, more than 800 million hectares of land (approximately 6% of the world’s total land area) are subjected to salt stress, which reduces crop yields by approximately 20%2. High concentration salt stress forces cells to undergo osmotic stress, ion toxicity, and oxidative stress, ultimately leading to nutritional imbalance and dehydration induced death in crops3. Therefore, exploring the response of crops to salt stress and improving their tolerance to saline-alkali soil is of great significance for enhancing the utilization of saline alkali land and promoting global soil environment improvement.
Potatoes (Solanum tuberosumL.) belong to the Solanaceae family of annual herbaceous plants, and are the fourth largest food crop after rice, wheat and corn4. Potatoes contain essential proteins, sugars, minerals, and a variety of vitamins with high nutritional value and are widely used in the food, starch, feed, and pharmaceutical industries5,6. Salt stress can affect the morphology and physiology of potato plants, resulting in plant dwarfism, leaf clustering, increased content of osmoregulatory substances, enhanced antioxidant enzyme activity, and ultimately leading to a decrease in potato yield7,8. Recent studies have shown that salt stress causes an average decrease of 14.49%, 8.88%, and 38.75% in plant height, stem number, and tuber yield of potatoes. Some salt tolerant potato varieties perform better under salt stress due to their strong antioxidant defense system, manifested by high activities of superoxide dismutase (SOD), ascorbate peroxidase (APX), catalase (CAT), and peroxidase (POD), as well as good osmotic regulation ability (accumulation of proline)9. Therefore, conducting salt tolerance evaluation of potatoes, screening and cultivating salt tolerant potato strains, is a key task in achieving efficient potato cultivation in saline-alkali soil10.
Evaluating the salt tolerance of crops requires not only appropriate morphological and physiological indicators, but also suitable evaluation methods11. Previous studies compared the physiological responses of ‘Longshu 5’ and ‘Qingshu 9’ to salt stress, and evaluated their salt tolerance using principal component analysis (PCA)12. Researchers analyzed 15 morphological indicators of potatoes under in vitro culture conditions using principal component analysis to preliminarily evaluate the salt tolerance of 12 potato varieties13. Although multiple studies have been conducted on the evaluation methods of potato salt tolerance both domestically and internationally, there is still a lack of unified understanding and standards, which hinders the in-depth development of potato salt tolerance research. Therefore, combining methods such as membership function analysis, cluster analysis, and principal component analysis with multiple indicators to comprehensively evaluate potato salt tolerance will have important theoretical and practical significance, laying the foundation for further exploration of the molecular mechanism of potatoes salt tolerance.
MicroRNAs (miRNAs) are a class of non-coding RNA molecules, approximately 20–24 nucleotides in length, that regulate gene expression at the post-transcriptional level. MiRNAs regulate the expressions of target genes by promoting the degradation of mRNAs or inhibiting their translation through complementary pairing with the 3’untranslated region (3’UTR) of target mRNAs. Therefore, miRNAs are negative regulators of gene expressions that are mainly regulated through the RNA interference (RNAi) pathway14–16. MiRNAs strongly influence plant growth and development, metabolic regulation, and responses to adversity17–19. For example, 14 conserved and 109 novel miRNAs in Solanum lycopersicumshowed significant changes in expression under salt stress20. The 150 conserved miRNAs and 348 new miRNAs were discovered in salt-treated Oryza glaberrima(African rice)21. An overexpression of miR1861h significantly improved the survival rate of rice (Oryza sativaL.) under salt stress, suggesting that miR1861h is a positive regulator of plant tolerance to salt stress22. Researchers previously investigated the roles of 40 miRNAs belonging to 19 different families in superfruit guava (Psidium guajavaL.) affected by salinity stress23. In potatoes, researchers identified 168 differentially expressed miRNAs under alkali stress using miRNA-Seq analysis, including 21 existing miRNAs, 37 known miRNAs from 47 families, and 110 new miRNAs. They also identified a total of 33 of miRNA-target gene pairs that respond to alkaline stress and were involved in key pathways such as ‘plant hormone signal transduction’, ‘phenylpropanoid biosynthesis’ and ‘starch and sucrose metabolism’24. So far, research on the involvement of miRNAs in response to salt stress in potatoes is not extensive enough and still need be further in-depth exploration.
In the present study, under in vitro conditions, multiple statistical analysis methods were used to comprehensively evaluate the salt tolerance of 17 tetraploid potato germplasm resources using four morphological indicators (plant height, root length, fresh weight and stem thick) and five physiological and biochemical indicators (MDA, Pro, CAT, SOD and POD). The indicators that can accurately evaluate potato salt tolerance were screened, and a mathematical evaluation model for potato salt tolerance under in vitro conditions was established. Furthermore, the selected salt tolerant varieties were treated in MS medium containing NaCl (80 mm/L) for 0 h, 3 h, 12 h, and 2 weeks, and the samples were collected to construct 12 small RNA sequencing libraries. Differentially expressed miRNAs in potatoes under salt stress were screened, and the functions of their target genes were also analyzed. This study aims to provide germplasm resources for salt tolerant breeding of potatoes and lay a foundation for studying the molecular mechanisms of potato salt stress tolerance.
Results
Screening optimal concentration of potato tolerance to salt stress
The plant height (PH), root length (RL), fresh weight (FW), stem thickness (ST), and effective growth rate of the five potato varieties were measured under salt stress. The results showed that with an increase in salt stress concentration, all indices except stem thickness decreased gradually (Table 1.). When the NaCl concentration was 80 mM, the five potatoes showed significant differences, and Z1266-1 grew significantly better than the other materials. However, at NaCl concentrations of 100 and 120 mM, the growth rates of the potato varieties were inhibited (Fig. 1). Therefore, the PH, RL, and FW of the five potato samples were significantly different at 80 mM, and the PH was more sensitive to salt concentration.
Table 1.
Phenotypes of potato plantlets under different concentrations of NaCl.
| Index | Variety | NaCl concentration (mM) | ||||
|---|---|---|---|---|---|---|
| CK | 40 | 80 | 100 | 120 | ||
| PH * | Z1076-1 | 6.48 ± 0.78c | 6.36 ± 2.25b | 1.51 ± 0.18c | 1.89 ± 0.12a | 1.71 ± 0.43a |
| Z494 | 11.11 ± 9.82a | 6.79 ± 6.84b | 2.24 ± 1.94b | - | - | |
| Z1264-1 | 10.54 ± 1.64b | 8.65 ± 1.6a | 1.49 ± 0.12c | 1.11 ± 0.24c | - | |
| Z1266-1 | 10.32 ± 0.61b | 8.61 ± 0.51a | 3.41 ± 0.42a | 1.52 ± 0.04b | 1.6 ± 0.2a | |
| Z1268-1 | 4.53 ± 0.65d | 4.39 ± 0.29c | 1.34 ± 0.24d | 0.93 ± 0.41c | - | |
| Mean | 8.60 | 6.96 | 2.00 | 1.36 | 1.66 | |
| SD | 2.92 | 1.77 | 0.86 | 0.43 | 0.08 | |
| CV | 0.34 | 0.25 | 0.43 | 0.32 | 0.05 | |
| P | 0.00 | 0.00 | 0.01 | 0.01 | 0.02 | |
| RL * | Z1076-1 | 13.15 ± 1.68b | 14.35 ± 0.15a | 7.71 ± 1.92b | 6.48 ± 1.31a | 3.57 ± 1.35a |
| Z494 | 13.38 ± 1.73b | 10.64 ± 0.36c | 1.21 ± 0e | - | - | |
| Z1264-1 | 18.83 ± 0.72a | 12.99 ± 4.89b | 9.64 ± 0.43a | 1.99 ± 0.15c | - | |
| Z1266-1 | 10.9 ± 1.44c | 5.86 ± 1.76d | 5.47 ± 1.06c | 1.59 ± 0d | 0.59 ± 0b | |
| Z1268-1 | 4.55 ± 0.63d | 3.67 ± 1.1e | 3.94 ± 0.57d | 5.72 ± 0.07b | - | |
| Mean | 12.16 | 9.50 | 5.59 | 3.95 | 2.08 | |
| SD | 5.16 | 4.59 | 3.27 | 2.51 | 2.11 | |
| CV | 0.42 | 0.48 | 0.58 | 0.64 | 1.01 | |
| P | 0.01 | 0.01 | 0.02 | 0.05 | 0.40 | |
| ST * | Z1076-1 | 0.66 ± 0.05c | 0.71 ± 0.07c | 0.77 ± 0.07d | 0.73 ± 0.02d | - |
| Z494 | 1.24 ± 0.14a | 1.31 ± 0.13a | 1.94 ± 0.31a | - | - | |
| Z1264-1 | 0.52 ± 0.06d | 0.71 ± 0.08c | 1.19 ± 0.18c | 1.07 ± 0.15c | - | |
| Z1266-1 | 0.98 ± 0.02b | 0.91 ± 0.03b | 1.61 ± 0.09b | 1.52 ± 0.12a | 1.64 ± 0.07a | |
| Z1268-1 | 0.86 ± 0.02b | - | 1.27 ± 0.1c | 1.35 ± 0.07b | - | |
| Mean | 0.85 | 0.91 | 1.36 | 1.17 | 1.64 | |
| SD | 0.28 | 0.28 | 0.44 | 0.35 | - | |
| CV | 0.33 | 0.31 | 0.33 | 0.30 | - | |
| P | 0.00 | 0.06 | 0.00 | 0.01 | 0.23 | |
| FW * | Z1076-1 | 0.09 ± 0c | 0.12 ± 0.01b | 0.04 ± 0.01c | 0.03 ± 0b | - |
| Z494 | - | - | - | - | - | |
| Z1264-1 | 0.28 ± 0.04b | 0.21 ± 0.07a | 0.1 ± 0.02b | 0.11 ± 0a | - | |
| Z1266-1 | 0.35 ± 0.07a | 0.22 ± 0.03a | 0.25 ± 0a | 0.12 ± 0a | 0.13 ± 0a | |
| Z1268-1 | 0.23 ± 0b | - | 0.2 ± 0.08a | 0.11 ± 0.01a | - | |
| Mean | 0.24 | 0.18 | 0.15 | 0.09 | 0.13 | |
| SD | 0.11 | 0.06 | 0.10 | 0.04 | - | |
| CV | 0.46 | 0.30 | 0.64 | 0.45 | - | |
| P | 0.10 | 0.18 | 0.23 | 0.02 | 0.48 | |
*CK: Control check, PH: Plant height, RL: Root length, ST: Stem thickness, FW: Fresh weight, CV: Coefficient of variation. Different lowercase means significant difference among five materials(P<0.05). If P value 0.01<P<0.05, the difference is significant; if P<0.01, the difference is extremely significant.
Fig. 1.

Phenotype of five potato materials under different salt concentrations.
The coefficient and total coefficient variations of the PH, RL, FW, ST, and other indicators were calculated under different NaCl concentrations (Fig. 2A). When the salt concentration was 80 mM, the total coefficient of variation reached its highest level. Thus, the salt concentration was used to distinguish the salt tolerances of different materials. Statistics on the effective growth rate of the five materials showed that when the salt concentration reached 120 mM, potato plantlets did not grow effectively. At a concentration of 100 mM, the effective growth rate was 40%, and at 80 mM, the effective growth rate reached 80% (Fig. 2B). In summary, 80 mM of NaCl was selected as the optimal concentration for determining the potato salt tolerance.
Fig. 2.

(A) Coefficient variation of salt tolerance indexes of the five studied potato varieties. (B) The effective growth rates of five materials.
Descriptive statistics of potato plantlets under salt stress
After 21 d of treatment with 80 mM NaCl, the morphological and physiological indices of the 17 potato samples were measured and the statistical analysis was performed (Table S1 and S2). Under salt stress treatment, the coefficient variation of traits ranged from 25.96 to 111.33%, whereas the coefficient variation of the indices under CK ranged from 21.37 to 91.82%. Compared with CK, the statistical values of PH, RL, and FW under the salt stress treatment were all lower, indicating that salt stress inhibited the growth of potato plants and roots. Interestingly, salt stress promoted thick stem growth to a certain extent. The ST, MDA, Pro, POD, and SOD contents were all higher than those in the CK, indicating that salt stress had an important effect on stem growth, potato osmotic regulation, oxidative stress, and other pathways.
A correlation analysis of the morphological and physiological indices of the 17 potato varieties under salt stress was performed (Fig. 3). The results showed that under the CK, MDA was significantly positively correlated with SOD and POD levels, whereas POD was significantly positively correlated with the SOD levels. Under salt stress, FW was significantly positively correlated with PH, and significantly negatively correlated with SOD. RL was positively correlated with Pro and significantly positively correlated with SOD levels. Pro was significantly positively correlated with SOD and MDA levels, and the comprehensive evaluation S value was significantly positively correlated with FW. Direct use of a single indicator cannot accurately evaluate potato salt tolerance, and multiple indicators must be used for a comprehensive evaluation using multivariate statistical methods.
Fig. 3.

Correlation analysis of potato materials under salt stress. (A) CK, (B) 80 mM NaCl.
PCA of potato salt stress
According to the standard of eigenvalues greater than 1 and the principal component loading matrix, PCA simplified the nine morphological, physiological, and biochemical indices into four independent comprehensive indices (Table 2), with a cumulative contribution rate of 78.36%. Based on the analysis of the eigenvalue loads, the four largest principal components were FW, PH, ST, and SOD. These four new independent comprehensive indices represent the information determined by the nine original indices.
Table 2.
PCA Data statistics.
| Comprehensive indicator | Eigen value |
Cumulative contribution rate (%) | Eigenvector | ||||||||
|---|---|---|---|---|---|---|---|---|---|---|---|
| FW | PH | ST | SOD | RL | POD | Pro | MDA | CAT | |||
| PC1 | 2.53 | 28.15 | 0.84 | 0.82 | 0.64 | −0.55 | 0.19 | 0.01 | −0.35 | 0.39 | 0.37 |
| PC2 | 1.94 | 49.65 | −0.06 | −0.15 | −0.05 | 0.41 | 0.78 | 0.73 | 0.30 | 0.42 | 0.58 |
| PC3 | 1.57 | 67.06 | 0.30 | −0.32 | 0.52 | −0.32 | 0.25 | 0.07 | 0.74 | −0.61 | −0.14 |
| PC4 | 1.02 | 78.36 | 0.09 | 0.26 | 0.26 | 0.50 | 0.21 | 0.29 | −0.27 | −0.22 | −0.61 |
Comprehensive evaluation, cluster analysis and regression analysis of potato salt tolerance
The S values of the nine indexes were calculated according to the formula, and these S values were used to comprehensively evaluate the salt tolerance of each potato material. Z1264-1 had the highest S value, indicating the strongest salt tolerance, whereas Z440-1 had the lowest S value, indicating its high salt tolerance. The order of tolerance was Z1264-1 > Z700-1 > Z943-1 > Z1266-1 > Z510-1 > Z1076-1 > Z456-2 > Z494 > Z1219-1 > Z1268-1 > Z1074-1 > Z1045 > Z850-1 > Z1184-1 > Z965 > Z1277-1 > Z440-1.
The inter-group connection method was used to perform a cluster analysis on the comprehensive evaluation of the S values of morphological, physiological, and biochemical indicators, and the 17 potato varieties were divided into three groups, named I-III (Fig. 4). Group I contained six potato varieties with S values greater than 0.80 and a strong salt tolerance, Group II contained seven potato varieties with S values between 0.40 and 0.80 and a moderate salt tolerance, and Group III contained four potato varieties with S values less than 0.40, indicating sensitivity to salt stress. Salt-tolerant varieties accounted for 29.4% of the total number evaluated in this study, indicating that salt-tolerant potato germplasm resources were relatively scarce.
Fig. 4.
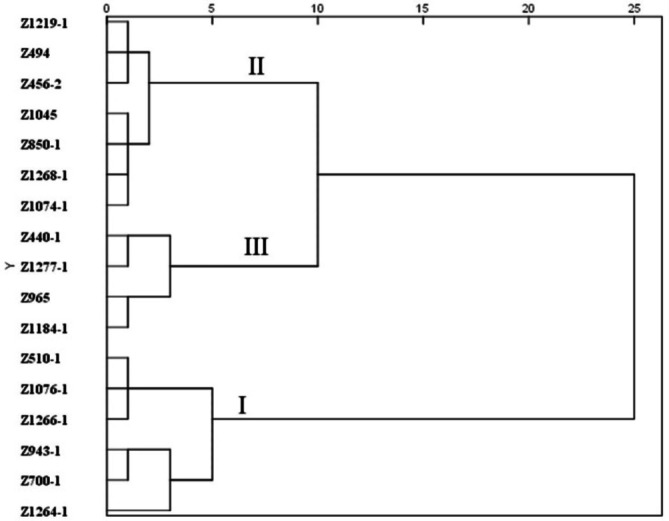
Cluster dendrogram of S values for comprehensive evaluation of salt tolerance indicators of 17 potato plantlets.
To facilitate the comprehensive evaluation of salt tolerance in other potato varieties, a multiple linear regression model was established using stepwise regression analysis. The S-value of the comprehensive evaluation of morphological and physiological indicators was used as the dependent variable, and the relative value of each indicator was used as the independent variable. The regression equation of salt tolerance-related indicators was obtained as S = 0.641 X1−0.861X2 + 0.346X3, where X1 is the ST, and X2 is CAT, and X3 is the RL. Coefficients of determination for the equation were R2 = 0.960 and F = 0.029. The three indicators ST, CAT, and RL were more sensitive to salt stress, and it was easiest to use this regression equation to evaluate potato salt tolerance.
High-throughput RNAs sequencing and quality control
To investigate the molecular mechanism of the miRNA response to salt stress, 12 samples were collected from potato plantlets treated with 80 mM NaCl for 0 h (control check, CK_1, CK_2, CK_3), 3 h (S_1, S_2, S_3), 12 h (M_1, M_2, M_3) and two weeks (L_1, L_2, L_3) to construct 12 small RNA libraries, and were sequenced using the Illumina NovaSeq 6000 platform. A total of 10.25–16.53 million raw reads were generated from 12 samples, and the sequencing error rate for the base positions did not exceed 0.01%. The Q30 base rate of all the samples was greater than 96.52% (Table 4). After filtering low-quality readings, the proportion of clean readings in all samples exceeded 95.7%. The Bowtie package was used to locate the length of the screened sRNA onto the reference sequence, and the matching rate of all samples exceeded 66%.
Table 4.
Summary of known miRNAs and novel miRNAs.
| Sample | Known miRNA | Novel miRNA | ||
|---|---|---|---|---|
| Mapped mature | Mapped hairpin | Mapped mature | Mapped hairpin | |
| Total | 189 | 155 | 173 | 178 |
| CK_1 | 131 | 124 | 163 | 170 |
| CK_2 | 120 | 113 | 156 | 162 |
| CK_3 | 129 | 118 | 159 | 163 |
| S_1 | 135 | 130 | 159 | 164 |
| S_2 | 121 | 115 | 152 | 160 |
| S_3 | 109 | 99 | 139 | 151 |
| M_1 | 120 | 113 | 150 | 157 |
| M_2 | 131 | 119 | 155 | 162 |
| M_3 | 135 | 121 | 149 | 162 |
| L_1 | 142 | 131 | 166 | 169 |
| L_2 | 123 | 111 | 149 | 154 |
| L_3 | 125 | 111 | 147 | 156 |
Table 3.
Summary of the small RNA sequencing data.
| Sample | Raw Reads | Error rate | Q30 | Clean reads | Mapped sRNA |
|---|---|---|---|---|---|
| CK_1 | 10,255,895 | 0.01% | 96.52% | 10,144,472 (98.91%) | 5,626,801 (66.56%) |
| CK_2 | 11,316,358 | 0.01% | 97.18% | 11,167,200 (98.68%) | 6,838,580 (78.22%) |
| CK_3 | 14,100,889 | 0.01% | 97.78% | 13,910,969 (98.65%) | 6,872,804 (69.71%) |
| S_1 | 15,498,982 | 0.01% | 97.15% | 14,984,427 (96.68%) | 7,672,520 (85.01%) |
| S_2 | 13,674,015 | 0.01% | 97.19% | 13,174,600 (96.35%) | 6,403,532 (86.09%) |
| S_3 | 11,867,484 | 0.01% | 97.16% | 11,612,244 (97.85%) | 6,151,324 (79.18%) |
| M_1 | 12,842,374 | 0.01% | 97.30% | 12,508,722 (97.40%) | 6,984,643 (87.36%) |
| M_2 | 14,563,600 | 0.01% | 97.41% | 14,257,291 (97.90%) | 9,620,245 (86.32%) |
| M_3 | 16,530,040 | 0.01% | 97.41% | 15,977,691 (96.66%) | 9,668,174 (84.76%) |
| L_1 | 12,179,643 | 0.01% | 97.58% | 12,039,646 (98.85%) | 7,276,468 (67.06%) |
| L_2 | 11,833,905 | 0.01% | 97.75% | 11,684,526 (98.74%) | 6,716,719 (69.41%) |
| L_3 | 14,664,462 | 0.01% | 97.85% | 14,037,513 (95.72%) | 8,411,916 (68.00%) |
Analysis of miRNAs
To identify known miRNAs in each sample, the mapped reads were aligned with specified range sequences in miRBase. In total, 189 mapped matures and 155 mapped hairpins were identified (Table 4). A total of 173 mapped matures and 178 mapped hairpins of novel miRNAs were obtained through integrating the analysis results from software programs such as miREvo and mirdeep2. Based on sequence similarity, a family analysis was performed on known and novel miRNAs, and 51 miRNA families were identified, with the miR171_1 and miR5303 families having the highest numbers of members. In addition, the distribution of these miRNA families in other species was analyzed, as shown in Table S3.
Analysis of differential expression miRNAs (DE miRNAs)
In this study, the expression levels of 362 miRNAs in each sample were quantified using TPM. DESeq2 was used for differential expression analysis between plantlets treated with NaCl for 0, 3, and 12 h, and 2 weeks. Fold Change ≥ 1.5 and p-value < 0.01 were used as the screening criteria. With increasing NaCl treatment time, the number of DE miRNAs gradually increased compared to that in CK (Fig. 5A). After 3 h of salt treatment, 7 DE miRNAs were identified, of which 57.1% were upregulated and 42.9% were downregulated. At 12 h, eight DE miRNAs were identified, with upregulation accounting for 62.5%, and downregulation accounting for 37.5%. After 12 h, the number of DE miRNAs significantly increased. After two weeks, 37 DE miRNAs were identified, with up-regulation accounting for 51.4% and downregulation accounting for 48.6%. A total of 68 DE miRNAs were subjected to expression level clustering analysis by integrating the TPM values of the DE miRNA sets from all comparison groups mentioned above (Fig. 5B).
Fig. 5.

Differential expression pattern of miRNAs in four kinds of tissue-cultured seedlings after salt treatment. (A) The number of DE miRNAs in all comparison groups. CK represents a salt treatment for 0 h, S represents 3 h, M represents 12 h, and L represents 2 weeks. (B) Hierarchical clustering heatmap of DE miRNAs, with red representing high expression miRNAs and blue representing low expression miRNAs. (C) qRT-PCR analysis of DE miRNAs selected by transcriptome data. The standard deviation is represented by the error bars.
Eight DE miRNAs were randomly selected to validate their expression using quantitative RT-PCR (Fig. 5C). The qRT-PCR expression profiles of these miRNAs were consistent with the RNA-Seq results, confirming the effectiveness of the RNA-Seq data.
Functional annotation of target genes of DEmiRNAs
In this study, we predicted the potential target genes of 68 DE miRNAs using the TargetFinder software (Table S4). A total of 5484 potential target genes were predicted, of which 3977 were functionally explained in the SwissProt database (Table S5). Some target genes of the DE miRNAs encoded proteins related to calcium channel signaling pathways, such as calcineurin B-like protein (CBL), CBL-interacting protein kinase (CIPK), calcium-dependent protein kinase (CDPK), and calcium-binding protein (CBP). Some target genes may be related to osmotic regulation activity in potatoes, such as potassium (K+) transporters, potassium channels, sodium/hydrogen exchangers, and cation/H (+) antiporters. In addition, there are some target genes that encode proteins related to hormone signaling pathways, such as Auxin-responsive proteins, Auxin-induced proteins, the Auxin response factor (ARF), Gibberellin 20-oxidase-like proteins, DELLA proteins, ABSCISIC ACID-INSENSITIVE 5-like proteins (ABI5), Aldehyde oxidase (AOX), 1-aminocyclopropane-1-carboxylate synthase (ACS), 1-aminocyclopropane-1-carboxylate oxidase (ACO), Pyridoxine/pyridoxamine 5’-phosphate oxidase (PPOX), and Jasmonic acid-amido synthetase (JAR). Some target genes encode antioxidant system enzymes such as superoxide dismutase (SOS), Peroxidase (POD) and Glutathione S-transferase (GST) were possibly related to the clearance activity of reactive oxygen species (ROS). Several target genes encode key enzymes influencing the phenylpropane metabolism pathway, such as phenylalanine ammonia-lyase (PAL) and 4-coumarate-CoA ligase (4CL). There are also some proteins related to cell wall synthesis, such as expansin and the receptor-like kinase FERONIA. In addition, several target genes were annotated as members of various transcription factor families, including WRKY, MYB, NAC, AP2/ERF, bHLH, and bZIP.
Gene Ontology(GO) enrichment analysis showed that the target genes of DE-miRNAs should be classified into 20 biological processes (BPs), 20 molecular functions (MFs), and six cellular component (CCs) terms after 3 h of stress treatment. Among them, “membrane,” “intrinsic component of membrane,” and “integral component of membrane” in the CCs were the three terms with the highest number of enriched genes (Figure. S1A). After 12 h, the most abundant BPs were single-organism cellular processes, cell communication, and “signal transduction.” The most relevant MFs were “protein binding,” “purine nucleotide binding” and “ribonucleotide binding.” In the CC group, the targets were enriched in terms of the membrane part “membrane part,” “membrane” and “integral component of membrane” (Figure. S1B). At 2 weeks, the main enriched GO terms were “single-organism cellular process,” “cellular process” and “transport” in BPs; “membrane part,” “membrane” and “protein complex” in CCs; with “ADP binding,” “adenyl ribonucleotide binding,” and “adenyl nucleotide binding” in MFs (Figure. S1C).
Based on the KEGG database, all target genes of the DE miRNAs were subjected to pathway significance enrichment analysis. After 3 h of stress treatment, the enrichment pathway of targets gene mainly included “zeatin biosynthesis,” “nitrogen metabolism,” “porphyrin and chlorophyll metabolism,” “peroxisome,” and so on (Figure. S2A). After 12 h, the “metabolic pathways,” “splicesome,” and “RNA degradation” pathways contain the most target genes (Figure. S2B). At 2 weeks, the main enriched pathways were “zeatin biosynthesis,” “terpenoid backbone biosynthesis,” “RNA degradation,” “metabolic pathways,” and “ABC transporters” (Figure. S2C).
Discussion
In general, the most direct method for screening salt-tolerant materials is field testing on saline soil; however, this method requires a long operating period, heavy workload, and high investment, and cannot meet the requirements of high-efficiency screening in large quantities. Therefore, in vitro nodal segment culturing has been effectively used to evaluate and screen for salt tolerance in potatoes, tomatoes, and sweet potatoes25–27. In vitro screening of potato varieties is the most appropriate short-term practice that can be carried out in the laboratory throughout the year13. Therefore, this study identified the salt tolerance of stem segments of potato variety tissue culture seedlings using this methodology.
Morphological indicators are widely used in the identification of salt tolerance in crops because they can directly reflect the degree of salt stress on crops13. Salt stress can affect the root length, stem thickness, plant height, number of branches, fresh root and dry root weight, and seedling weight of potatoes, which has an adverse effect on the growth and development traits of potatoes and ultimately leads to a decrease in potato tuber yields28. In the present study, we randomly selected five potato varieties and set different salt concentrations to explore the salt sensitivity of potato plantlets based on four morphological indicators: plant height (PH), root length (RL), fresh weight (FW), stem thickness (ST). Our results confirmed that with the increase of salt stress concentration, all indicators except for ST showed varying degrees of decrease. Under salt stress at 80 mM, the growth status of potato plantlets showed significant differences, with PH, RL, and FW decreasing by 77.80, 63.40, and 53.33%, respectively. Interestingly, the ST increased significantly compared to the control group. This may be due to the accumulation of osmoregulatory substances in plants under high salt environments, such as soluble sugars and prolines, which induce an increase in cell turgor pressure, accompanied by an increase in cell wall strength, ultimately leading to stem thickening29,30. The four morphological indicators selected in this study (PH, RL, ST and FW) can accurately evaluate potato salt tolerance under in vitro conditions, but the field salt tolerance of the selected germplasms still needs further research.
Plants typically accumulate excessive reactive oxygen species (ROS) in response to stress, leading to oxidative stress within cells, which inhibits the normal metabolic activities of plants. The superoxide dismutase (SOD), peroxidase (POD), catalase (CAT), and malondialdehyde (MDA) are all important components of the plant’s antioxidant system31. The content of intracellular proline affects the water retention of cells. As an osmoprotectant for plant cells, it plays a role in protecting cell structure and regulating cell acidity, and is an important indicator for measuring the degree of plant stress32,33. Recent reports have shown that the levels of lipid peroxidation and enzymatic antioxidants in potato leaves subjected to high levels of salt stress (7 g kg−1of soil) significantly increase, with increased activities of enzymes such as SOD (134.97%), POD (101.02%), and CAT (28.87%), which are negatively correlated with NaCl concentration35. Under salt stress, the proline content in oat seedlings significantly increased, and more accumulated in salt tolerant varieties34. In the present study, under salt stress, the antioxidant enzymes POD and SOD and the content of Pro showed an upward trend, which is consistent with previously reported results.
Crops respond to salt stress through multiple metabolic pathways, resulting in complex tolerance mechanisms36,37. Therefore, a single indicator cannot accurately reflect the salt tolerance of crops, and selecting multiple indicators can effectively distinguish salt tolerance between different genotypes38. There have been some reports on the identification of salt tolerance in potatoes. Previous studies compared the physiological responses of ‘Longshu 5’ and ‘Qingshu 9’ to salt stress, and evaluated their salt tolerance using principal component analysis (PCA)12. Researchers analyzed 15 morphological indicators of potatoes under in vitro culture conditions using principal component analysis to preliminarily evaluate the salt tolerance of 12 potato varieties13. However, there is no unified evaluation standard for potato salt tolerance in existing research, and the evaluation methods lack the application of multivariate analysis methods, the potato salt tolerance evaluation system has not yet been established. Based on a comprehensive evaluation of other abiotic stresses39, this study measured nine morphological, physiological, and biochemical indices in 17 potato varieties and conducted a comprehensive evaluation of the salt tolerance of each potato variety using the membership function method, cluster analysis, principal component analysis, and other methods. The results showed that the comprehensive salt tolerance coefficient S value was closely related to the membership function value, which considered the weight of each trait index, and that different trait indices made different contributions to salt resistance. Therefore, it was more accurate and objective to use the comprehensive salt tolerance coefficient S value to evaluate salt resistance comprehensively. The research results provide germplasm resources reference for potato salt tolerance breeding, and provide reference basis for accurate in vitro evaluation of potato salt tolerance, laying the foundation for further exploration of potato salt tolerance mechanism.
Bioinformatics techniques such as transcriptome sequencing analysis have been widely used in the study of salt tolerance mechanisms in potatoes10. MiRNAs can negatively regulate the expression of target genes at the post-transcriptional level, thereby enhancing plant salt tolerance, as has been confirmed in several species40,41. Potatoes are moderately salt-tolerant crops. However, there is limited research on the molecular mechanisms of miRNA regulation in response to salt stress of potato25. In this study, twelve samples from potato plantlets subjected to salt treatment for different durations were collected for small RNA sequencing analysis. Finally, as many as 10.14–15.98 million clean reads were obtained, with a high sequencing quality. These results will contribute to enriching the potato miRNA database. Using sequence alignment, we identified 189 known and 173 novel miRNAs from 51 families. Some members of the miRNA family, such as miR156, miR169, miR390, miR393, miR396, miR397, and miR408, have reportedly influenced salt stress responses42-46. Transgenic alfalfa plants overexpressing Osa-MIR156have more branches and leaves, and exhibit better salt and drought tolerance40. The miR169q-ZmNF-YA8module enhance maize’s salt tolerance by activating peroxidase1 expression in response to ROS41. The ghr-mir390 negatively regulated the expression of cotton peptide receptor 2 (GhCEPR2) gene that mediated salt tolerance in cotton and Arabidopsis42. The SvMIR397 can inhibit the expression of three LACCASE(LAC) genes in Arabidopsis, leading to a decrease in lignin content and an increase in salt stress sensitivity45. Overexpression of MIR408b can increase the net outflow rate of Na+ from leaves, localize Na+in intercellular spaces, reduce lignin accumulation and the number of vascular bundle cells under salt stress, and thus reduce salt tolerance of maize46. Our results will provide a basis for further exploration of the molecular mechanism of miRNA regulation of potato salt tolerance in the future.
Research has shown that plants develop complex physiological and molecular mechanisms in response to salt stress, indicating that several types of genes may influence the responses to salt stress47. We identified 68 DE miRNAs and functionally annotated their target genes through analyzing the expression levels of miRNAs at different salt treatment times. In this study, some target genes of the DE miRNAs encoded proteins related to calcium ion channels, such as calcineurin B-like protein(CBL)and CBL-interacting protein kinase (CIPK). Previous studies have shown that the CBL4 protein interacts with serine/threonine protein kinase 24 (CIPK24), activating a Na+/H+ antiporter protein (SOS1) that causes Na+to flow out of the cytoplasm, thereby controlling the ion balance of cells and ultimately regulating salt tolerance in Arabidopsis48. In addition, CBL10 also plays a key role in salt tolerance, possibly by activating Na+ into vacuoles49. Our results suggested that these miRNAs respond to salt stress by mediating the calcium ion signaling pathway. In addition, some target genes, such as ABSCISIC ACID-INSENSITIVE 5-like proteins (ABI5), encode enzymes or proteins influencing endogenous hormone synthesis and metabolism. The abscisic acid (ABA), as one of the most important stress response hormones, can regulate water balance and resist osmotic stress through various signaling networks, playing an irreplaceable role in salt stress defense50. ABI5 typically interacts with other transcription regulatory factors such as ABI3, DELLA, and JAZ proteins to regulate the ABA signaling pathway51. Our result suggests that these miRNAs may influence plant hormone signal transduction pathways that regulate water balance and resist osmotic stress. After salt stress, plants maintain a relative balance of Na+/K+ to maintain the stability of intracellular ions52. After 12 h of salt stress, genes related to K+ transporter and K+ channel were upregulated in salt tolerant eggplants. SmAKT1 has been shown to regulate K+ uptake, alter Na+ exclusion and transport under salt stress, thereby maintaining intracellular K+/Na+ ratio in Arabidopsis53. Some target genes of DE miRNAs encode K + transporter proteins (AKT), indicating that DE miRNAs may participate in the ion transport processes of potatoes in response to salt stress. The osmotic stress, ion stress, and nutrient imbalance caused by salt stress collectively led to excessive production of ROS, which have harmful effects on shoot and root tissues. The non-enzymatic and enzymatic components in the antioxidant defense system can inhibit or eliminate excessive ROS, thereby reducing the negative effects of salt induced oxidative stress54. Overexpression of ZmWRKY104 enhances SOD activity by regulating the expression of ZmSOD4, inhibits the increase of O2−accumulation, MDA content, and electrolyte leakage rate under salt stress, and improved the salt tolerance of maize55. Some target genes have been annotated as SOD, POD, GST, indicating that these miRNAs respond to salt stress by mediating the clearance of intracellular ROS. In addition, several target genes encoded key enzymes in phenylpropane biosynthesis and metabolic pathways, indicating that miRNAs resist salt stress by regulating the synthesis and metabolism of secondary metabolites, such as lignin in plant secondary walls. Recent reports indicate that miR4243-x and novel m064-5p are involved in the response of potatoes to alkaline stress by negatively regulating the genes of O-hydroxycinnamoyl transferase (HCT) and sucrose phosphate synthase (SPS), respectively22. After salt stress, salt-tolerant Chinese cabbage varieties accumulated more secondary metabolites such as lignin and abscisic acid, indicating that the crosstalk of phenylpropanoid biosynthesis with hormone signaling jointly promotes the salt tolerance of Chinese cabbage56. As the first barrier against external stress, the cell wall strongly influences plant growth, development, and stress resistance. The transcription factor SmMYB1R1-L can regulate the expression of the expansion gene SmEXPA13, a salt-resistant gene, which enhances salt tolerance in willow57. FERONIA (FER) is one of the receptor like kinases (RLKs) subfamily members located on the cell membrane, playing an important role in response to biotic and abiotic stress of plants. Researchers discovered that overexpression of FERONIA (MdFER) can significantly enhance the resistance to salt stress in apple callus. The ectopic expression of MdFERin Arabidopsis can increase the activity of enzymes such as SOD and CAT, reduce the accumulation of reactive oxygen species in cells, and significantly improve the salt tolerance of Arabidopsis58. In the study, several target genes encode expansin and the receptor-like protein kinase FERONIA, indicating that miRNAs may be involved in the synthesis of potato cell wall and membrane in response to salt stress. In summary, these miRNAs and their target genes may play important roles in the response of potatoes to salt stress, providing new insights into the molecular mechanisms of potato response to salt stress.
Overall, the results of this study showed that the morphological and physiological indexes of potato under salt stress would be affected. Due to the limitation of experimental materials and indexes, the established regression equation of salt tolerance may not involve all potato varieties. Combined with transcriptome analysis of salt-tolerant varieties, we can provide some theoretical references for salt-tolerant miRNAs. Further studies are needed to truly understand the mechanism of salt tolerance in potato.
Materials and methods
Plant materials and growth conditions
All tested materials were tetraploid-cultivated potatoes from the National Engineering Research Center for Potatoes (Table S6). The materials used to determine the appropriate concentration for salt tolerance screening were Z1076-1, Z494, Z1264-1, Z1266-1, and Z1268-1. The potato variety ‘Xisen No. 6’ (Z1076-1) was widely cultivated in saline-alkali land in China because of its high yield, high quality and anti-barren59. Plantlets of the potato variety Z1076-1 used in the miRNA-Seq experiment were grown in a glass bottle with a diameter of 10 cm and a height of 40 cm. The stem segments with axillary buds were cultured in vitro on a base MS medium for 20 d under 16 h light/8 h dark photoperiod conditions at 25℃, and then transferred to MS medium containing 80 mM NaCl for salt stress treatment. The tissue cultured seedlings were collected at 0, 3, 12 h and two weeks of stress treatment, immediately frozen in liquid nitrogen and stored at −80℃ for further experimentation. Three biological replicates were used for each time point.
Treatments and measurements of salt tolerance indexes
The experiments were conducted in a potato tissue culture room at the Institute of Biophysics. A single-factor, completely randomized design was used to detect the effects of different salt stress concentrations on the potato growth phenotypes. NaCl was added to the MS solid medium to induce salt stress, and five concentration gradients (0, 40, 80, 100, and 120 mM) were established. Fresh potato plantlets grown for three weeks were divided into 1 cm-long stem segments, each containing one leaf, and inserted into an MS solid medium at different salt concentrations. Each sterile glass bottle containing at least five fresh stem segments was used as a replicate and three replicates were performed. The culture conditions were temperature (25 ± 2) ℃, light intensity 2000–3000 lx, and light intensity 16 h/d. After three weeks of treatment, plant height, root length, fresh weight, stem thickness, and effective growth rate were measured. The coefficient of variation (CV) for each parameter was subsequently calculated.
The selected medium with an appropriate concentration of NaCl was used to treat the plantlets of the 17 tetraploid potato cultivars. After a treatment period of three weeks, various morphological indices, including plant height, root length, fresh weight, stem thickness, and physiological and biochemical indices, such as SOD, POD, CAT, MDA, and proline (Pro), were measured. To eliminate the inherent differences among the indices of the materials, all indices were transformed into salt-tolerance coefficients and subsequently converted into membership functions. The comprehensive evaluation values for potato salt tolerance were obtained based on the membership function value and principal component analysis, and a cluster analysis was subsequently performed on these values9.
The measurement method was slightly modified from those of Gelmesa et al60. and Zaman et al.30. Plant height (cm) was measured using Vernier calipers from the base of the stem to the growing point at the top of the seedling. The plants were rinsed with water, dried, and cut off from the root-stem junction, and the fresh weight of the buds was measured with a 1/1000 electronic balance (g). On culture media with different concentration gradients, plantlets with regenerated buds greater than 1 cm, a normal leaf color, and a lack of clustering were designated as having effective growth, whereas plants with regenerated buds less than 1 cm or clustering were designated as having ineffective growth. The percentage of effective plantlet growth compared with the total number of test plantlets was the effective growth rate61. Physiological and biochemical indices, including CAT, MDA, POD, Pro, and SOD, were determined using appropriate kits (Beijing Solarbio Science & Technology Co., Ltd., China). Samples weighing 0.1 g were stored in a 1.5 ml centrifuge tube at −80 °C in a refrigerator.
Comprehensive evaluation of salt tolerance of potato plantlets
The salt tolerance of the potato varieties was determined by calculating the membership function value (MFV) of all tested traits. The weights of the comprehensive indices were calculated through principal component analysis (PCA). The comprehensive salt tolerance coefficient, S, was calculated using the following equation:
 |
 |
 |
 |
 |
Where F(Xj) is the jth comprehensive index value, aij represents the factor load corresponding to the characteristic value of each single index, and Xij denotes the standardized processing value of each index. U (Xj) constitutes the membership function value of the jth indicator, Xj represents the jth salt tolerance coefficient, Xmin denotes the minimum value of the jth indicator salt tolerance coefficient, and Xmax is the maximum value of the jth indicator salt tolerance coefficient. Wj represents the weight of the jth indicator among all indicators, and Pj is the contribution rate of the jth indicator.
Microsoft Excel 2019 was used to analyze and organize the data, and the above equations were used to calculate the comprehensive salt tolerance coefficient. The correlation analysis, PCA, stepwise regression analysis, and cluster analysis were performed using the SPSS statistical software (Ver. 25.0, SPSS Inc., Chicago, IL, USA).
Small RNA sequencing
RNA samples were extracted using the TRIzol reagent. RNA degradation and contamination were monitored using 1% agarose gel electrophoresis. The RNA purity was assessed using a the NanoPhotometer® spectrophotometer (IMPLEN, CA, USA). RNA integrity was assessed using an RNA Nano 6000 Assay Kit on an Agilent Bioanalyzer 2100 system (Agilent Technologies, CA, USA). The small RNA libraries were prepared from a total of 2 µg total RNA isolated from each sample using NEBNext® Multiplex Small RNA Library Prep Set for Illumina® (NEB, USA.) in accordance with manufacturer’s instructions. Briefly, purified RNA was mixed with the NEB 3’ SR Adapter, then the SR RT Primer hybridized to the excess of 3’ SR Adapter (that remained free after the 3’ ligation reaction) and transformed the single-stranded DNA adapter into a double-stranded DNA molecule. A 5’ ends adapter was ligated to 5’ ends of miRNAs, siRNA and piRNA. First-strand cDNA was synthesized using M-MuLV Reverse Transcriptase (RNase H). PCR amplification was performed using LongAmp Taq 2X Master Mix, SR Primer (Illumina), and an index (X) primer. The PCR products were purified on an 8% polyacrylamide gel (100V, 80 min). DNA fragments corresponding to 140–160 bp (the length of small RNA plus the 3’ and 5’ adapters) were recovered and dissolved in 8 µL of elution buffer. Finally, library quality was assessed using an Agilent Bioanalyzer 2100 system with DNA high-sensitivity chips.
Clustering of the index-coded samples was performed on a cBot Cluster Generation System using the TruSeg SR Cluster Kit v3-cBot-HS (Illumina), according to the manufacturer’s instructions. Following cluster generation, library preparations were sequenced on a NovaSeq 6000 platform and 50 bp single-end reads were generated. Raw data (raw reads) in the fastq format were first processed using custom Perl and Python scripts. In this step, clean data (clean reads) were obtained by removing reads containing poly-N, poly A or T or G or C, or with 5’ adapter contaminants, or without a 3’adapter or the insert tag. The 3’ adapter sequences were trimmed. Simultaneously, Q20, Q30, and GC contents of the raw data were calculated. Clean reads with a certain length range were chosen for downstream analyses. Processed small RNA reads were used in Bowtie62 for read mapping to the reference sequence63. This approach allowed for one mismatched base.
Known miRNA alignment, novel miRNA prediction, and miRNA family analysis
Processed reads with lengths of 18–35 nt were mapped to the potato reference genome (DM v4.04) and analyzed using the Bowtie package (no mismatch)63. To identify conserved miRNAs, the predicted miRNA hairpins were compared with miRNA precursor sequences from miRBase22.0 using mirDeep2 and srna-tools-cli to identify potential miRNAs and draw secondary structures64. The available software, miREvo, and mirDeep2, were integrated to predict novel miRNAs by exploring the secondary structure, Dicer cleavage site, and minimum free energy of the small RNA reads that were unannotated in the former steps65. The mirDeep2 quantifier.pl package was used to obtain the miRNA counts, and custom scripts were used to obtain the base bias on the first position of the identified miRNA with a certain length and on each position of all identified miRNAs. The distribution of known and novel miRNA families in various species was determined using miFam.dat (http://www.mirbase.org/ftp.shtml) and Rfam (http://rfam.sanger.ac.uk/search/).
Quantification and differential expression of miRNA
The miRNA expression levels were estimated by transcript per million (TPM) using the following criteria. Normalization formula: normalized expression = mapped read count/total reads*1,000,00066. A differential expression analysis between the two groups was performed using the DESeq R package (version 1.24.0). P-values were adjusted using the Benjamini-Hochberg method. A corrected P-value of < 0.05 was set as the threshold for screening differentially expressed genes.
Target gene prediction, GO and KEGG enrichment analysis
The target gene prediction of miRNA was performed by Targetfinder67. A GO enrichment analysis was used to identify candidate target genes of the differentially expressed miRNAs. A GOseq-based Wallenius non-central hypergeometric distribution, which can adjust for gene-length bias, was implemented to perform the GO enrichment analysis. The KOBAS software was used to test the statistical enrichment of target gene candidates in the KEGG pathways.
Validation by quantitative real-time polymerase chain reaction (qRT-PCR)
To verify the accuracy of the transcriptome sequencing data, eight DE miRNAs were selected for use in the expression analysis using qRT-PCR. A minimum of 1 µg total RNA was used to synthesize cDNA via the miRNA 1st Strand cDNA Synthesis Kit (by tailing A) (Vazyme, Nanjing, China) according to the manufacturer’s instructions. cDNA products (2 µL) were used as templates in a 20 µL qPCR reaction system. qRT-PCR was performed on a LightCycler96 (Roche Applied Science, Basel, Switzerland) using the ChamQ Universal SYBR qPCR Master Mix (Vazyme, Nanjing, China). U6 snRNA was used as an endogenous control to normalize expression values. Forward primers were designed using a fully mature miRNA sequence and synthesized by Sangon Biotech Co., Ltd. Primers used in this study are listed in Table S7. The relative expression level of the DE miRNAs was calculated by the comparative CT method (2−ΔΔCt)68.
Conclusion
In summary, this study evaluated the salt tolerance of 17 diverse potato varieties based on morphological, physiological, and biochemical indicators and identified Z1264-1, Z700-1, Z943-1, Z1266-1, Z510-1, and Z1076-1 as having strong salt tolerance. Regression equations established stem thickness, root length, and catalase activity as rapid identification markers for salt tolerance in tetraploid potatoes. Transcriptome analysis was performed on Z1076-1. We screened 68 differentially expressed miRNAs, and eight related miRNAs were verified using RT-qPCR. Predicted target genes of these miRNAs are involved in calcium channel signaling, osmotic regulation, plant hormone signaling, and reactive oxygen species clearance. This study provides a strong reference for identifying and screening salt-tolerant potato germplasms.
Electronic supplementary material
Below is the link to the electronic supplementary material.
Acknowledgements
This work was supported by funding from the following projects: Key R&D Program of Shandong Province of China (grant number 2022LZGC017), National Natural Science Foundation of China (grant number 32201714 and 32301777), Natural Science Foundation of Shandong of China (ZR2023QC102), Talent Introduction Project of Dezhou University of China (grant number 2021xjrc303, 2022xjrc414 and 2023xjrc121), and Project of Shandong Province Higher Educational Science and Technology Program (grant number 2023KJ270).
Author contributions
X.Z. and Q.C. conceived and designed the study. X.Z., C.L., S.Z. and K.L. performed the experiments and analysis. C.L., S.Z., K.L., L.J. and M.S. helped in data analysis, software standardization. X.Z., C.L., and S.Z. write the original draft. R.Y., P.G., G.H., B.H., and Q.C. provided technical expertise, revised the article and helped in funding acquisition. All authors reviewed and edited the manuscript.
Data availability
All data generated or analyzed during this study are included in this article (and its additional files) The raw sequence data reported in this paper have been deposited in the Genome Sequence Archive in National Genomics Data Center, China National Center for Bioinformation / Beijing Institute of Genomics, Chinese Academy of Sciences (GSA: CRA019254) that are publicly accessible at https://ngdc.cncb.ac.cn/gsa/browse/CRA019254.
Declarations
Competing interests
The authors declare no competing interests.
Footnotes
Publisher’s note
Springer Nature remains neutral with regard to jurisdictional claims in published maps and institutional affiliations.
These authors contributed equally.
Contributor Information
Qingshuai Chen, Email: qingschen_dzu@dzu.edu.cn.
Xia Zhang, Email: zhangxia@dzu.edu.cn.
References
- 1.Zhao, C., Zhang, H., Song, C., Zhu, J. K. & Shabala, S. Mechanisms of plant responses and adaptation to soil salinity. Innovation1 (1), 100017. 10.1016/j.xinn.2020.100017 (2020). [DOI] [PMC free article] [PubMed] [Google Scholar]
- 2.Munns, R. & Tester, M. Mechanisms of salinity tolerance. Annu. Rev. Plant. Biol.59, 651–681. 10.1146/annurev.arplant.59.032607.092911 (2008). [DOI] [PubMed] [Google Scholar]
- 3.Shabala, L. et al. Cell-type-specific H+-ATPase activity in root tissues enables k+ retention and mediates acclimation of barley (Hordeum vulgare) to salinity stress. Plant. Physiol.172 (4), 2445–2458. 10.1104/pp.16.01347 (2016). [DOI] [PMC free article] [PubMed] [Google Scholar]
- 4.Zaheer, K. (ed Akhtar, M. H.) Potato production, usage, and nutrition-A review. Crit. Rev. Food Sci. Nutr.56 5 711–772 10.1080/10408398.2012.724479 (2016). [DOI] [PubMed] [Google Scholar]
- 5.Gebrechristos, H. Y. & Chen, W. Utilization of potato peel as eco-friendly products: a review. Food Sci. Nutr.6 (6), 1352–1356. 10.1002/fsn3.691 (2018). [DOI] [PMC free article] [PubMed] [Google Scholar]
- 6.Kang, Y. et al. Furrow-ridge mulching managements affect the yield, tuber quality and storage of continuous cropping potatoes. Plant. Soil. Environ.66 (11), 576–583. 10.17221/316/2020-PSE (2020). [Google Scholar]
- 7.Akrimi, R. et al. Electromagnetic water enhanced metabolism and agrophysiological responses of potato (Solanum tuberosum L.) under saline conditions. J. Agron. Crop Sci.207 (1), 44–58. 10.1111/jac.12449 (2021). [Google Scholar]
- 8.Katerji, N., Van Hoorn, J. W., Hamdy, A. & Mastrorilli, M. Salinity effect on crop development and yield, analysis of salt tolerance according to several classification methods. Agric. Water Manag. 62 (1), 37–66. 10.1016/S0378-3774(03)00005-2 (2003). [Google Scholar]
- 9.Sanwal, S. K. et al. Salinity stress tolerance in potato cultivars: evidence from physiological and biochemical traits. Plants11 (14), 1842. 10.3390/plants11141842 (2022). [DOI] [PMC free article] [PubMed] [Google Scholar]
- 10.Li, Q. et al. Transcriptome analysis uncovers the gene expression profile of salt-stressed potato (Solanum tuberosum L). Sci. Rep.10, 5411. 10.1038/s41598-020-62057-0 (2020). [DOI] [PMC free article] [PubMed] [Google Scholar]
- 11.Tang, Y. et al. Salt tolerance evaluation and mini-core collection development in Miscanthus sacchariflorus and M. Lutarioriparius. Front. Plant. Sci.15, 1364826. 10.3389/fpls.2024.1364826 (2024). [DOI] [PMC free article] [PubMed] [Google Scholar]
- 12.Li, Q. et al. Physiology and gene expression analysis of potato (Solanum tuberosum L.) in salt stress. Plants11, 1565. 10.3390/plants11121565 (2022). [DOI] [PMC free article] [PubMed] [Google Scholar]
- 13.Ahmed, H. A. A. et al. Variability in salinity stress tolerance of potato (Solanum tuberosum L.) varieties using in vitro screening. Cienc. Agrotec. 44, e004220. 10.1590/1413-7054202044004220 (2020). [Google Scholar]
- 14.Iwakawa, H. & Tomari, Y. The functions of microRNAs: mRNA decay and translational repression. Trends Cell. Biol.25 (11), 651–665. 10.1016/j.tcb.2015.07.011 (2015). [DOI] [PubMed] [Google Scholar]
- 15.Chorostecki, U. et al. Evolutionary footprints reveal insights into plant microRNA biogenesis. Plant. Cell.29 (6), 1248–1261. 10.1105/tpc.17.00272 (2017). [DOI] [PMC free article] [PubMed] [Google Scholar]
- 16.Deng, F. et al. Molecular evolution and functional modification of plant miRNAs with CRISPR. Trends Plant Sci.27 (9), 890–907. 10.1016/j.tplants.2022.01.009 (2022). [DOI] [PubMed] [Google Scholar]
- 17.Zhang, B. H. MicroRNA: a new target for improving plant tolerance to abiotic stress. J. Exp. Bot.66 (7), 1749–1761. 10.1093/jxb/erv013 (2015). [DOI] [PMC free article] [PubMed] [Google Scholar]
- 18.Yang, W. et al. Overexpressing osa-miR171c decreases salt stress tolerance in rice. J. Plant. Biol.60, 485–492. 10.1007/s12374-017-0093-0 (2017). [Google Scholar]
- 19.Islam, W., Tauqeer, A., Waheed, A. & Zeng, F. MicroRNA mediated plant responses to nutrient stress. Int. J. Mol. Sci.23(5), 2562. 10.3390/ijms23052562 (2022). [DOI] [PMC free article] [PubMed]
- 20.Zhao, G., Yu, H., Liu, M., Lu, Y. & Ouyang, B. Identification of salt-stress responsive microRNAs from Solanum lycopersicum and Solanum pimpinellifolium. Plant. Growth Regul.83, 129–140. 10.1007/s10725-017-0289-9 (2017). [Google Scholar]
- 21.Mondal, T. K., Panda, A. K., Rawal, H. C. & Sharma, T. R. Discovery of microRNA-target modules of African rice (Oryza glaberrima) under salinity stress. Sci. Rep.8(1), 1–11. https://doi.org/10.1038%2Fs41598-017-18206-z (2018). [DOI] [PMC free article] [PubMed] [Google Scholar]
- 22.Ai, B. et al. Overexpression of miR1861h increases tolerance to salt stress in rice (Oryzasativa L.). Genet. Resour. Crop Evol.68(1), 87–92. 10.1007/s10722-020-01045-9 (2021). [Google Scholar]
- 23.Sharma, A. et al. Identification of microRNAs and their expression in leaf tissues of guava (Psidium guajava L.) under salinity stress. Agronomy10(12), 1920. 10.3390/agronomy10121920 (2020). [Google Scholar]
- 24.Kang, Y. et al. Integration of mRNA and miRNA analysis reveals the molecular mechanism of potato (Solanum tuberosum L.) response to alkali stress. Int. J. Biol. Macromol.182, 938–949. 10.1016/j.ijbiomac.2021.04.094 (2021). [DOI] [PubMed] [Google Scholar]
- 25.Šimko, I. Effects of Kinetin, paclobutrazol and their interactions on the microtuberization of potato stem segments cultured in vitro in the light. Plant. Growth Regul.12, 23–27. 10.1007/BF00144578 (1993). [Google Scholar]
- 26.Latif, A. et al. Novel halotolerant rhizobacterial strains mitigated the salt stress in-vitro and in-vivo and improved the growth of tomato plants. Sci. Hort.319, 112115. 10.1016/j.scienta.2023.112115 (2023). [Google Scholar]
- 27.Luo, Y., Wang, K., Zhu, L., Zhang, N. & Si, H. StMAPKK5 positively regulates response to drought and salt stress in potato. Int. J. Mol. Sci.25(7), 3662. 10.3390/ijms25073662 (2024). [DOI] [PMC free article] [PubMed] [Google Scholar]
- 28.Abdelsalam, Z. K. M., Ezzat, A. S., Tantawy, I. A. A., Youssef, N. S. & Gad El-Hak, S. H. Effect of NaCl salinity stress on potato (Solanum tuberosum L.) plantlets grown and development under in vitro conditions. Sci. J. Agric. Sci.3(2), 1–12. 10.21608/sjas.2021.84222.1125 (2021). [Google Scholar]
- 29.Colin, L. et al. The cell biology of primary cell walls during salt stress. Plant. cell.35(1), 201–217. 10.1093/plcell/koac292 (2023). [DOI] [PMC free article] [PubMed] [Google Scholar]
- 30.Zaman, M. S., Ali, G. M., Muhammad, A., Farooq, K. & Hussain, I. Vitro screening of salt tolerance in potato (Solanum tuberosum L.) varieties. Sarhad J. Agric.31(2), 106–113. 10.13140/RG.2.2.20287.87200 (2015). [Google Scholar]
- 31.Hanin, M., Ebel, C., Ngom, M., Laplaze, L. & Masmoudi, K. New insights on plant salt tolerance mechanisms and their potential use for breeding. Front. Plant. Sci.7(1787). 10.3389/fpls.2016.01787 (2016). [DOI] [PMC free article] [PubMed]
- 32.Boughalleb, F., Abdellaoui, R., Mahmoudi, M. & Bakhshandeh, E. Changes in phenolic profile, soluble sugar, proline, and antioxidant enzyme activities of Polygonum equisetiforme in response to salinity. Turk. J. Bot.44(1), 25–35. 10.3906/bot-1908-2 (2020). [Google Scholar]
- 33.Mehta, D. & Vyas, S. Comparative bio-accumulation of osmoprotectants in saline stress tolerating plants: a review. Plant. Stress. 9, 100177. 10.1016/j.stress.2023.100177 (2023). [Google Scholar]
- 34.Wang, H. et al. Variability in morpho-biochemical, photosynthetic pigmentation, enzymatic and quality attributes of potato for salinity stress tolerance. Plant. Physiol. Bioch. 203, 108036. 10.1016/j.plaphy.2023.108036 (2023). [DOI] [PubMed] [Google Scholar]
- 35.Sharma, M. et al. Inroads into saline-alkaline stress response in plants: unravelling morphological, physiological, biochemical, and molecular mechanisms. Planta259(6). 10.1007/s00425-024-04368-4 (2024). ,130, DOI. [DOI] [PubMed]
- 36.Zhang, M. et al. Evaluation of salt tolerance of oat cultivars and the mechanism of adaptation to salinity. J. Plant Physiol.273, 153708. 10.1016/j.jplph.2022.153708 (2022). [DOI] [PubMed] [Google Scholar]
- 37.Abbas, A. et al. Genome-wide analysis of Invertase Gene Family, and expression profiling under Abiotic stress conditions in Potato. Biology11(4), 539. 10.3390/biology11040539 (2022). [DOI] [PMC free article] [PubMed] [Google Scholar]
- 38.Chen, Z. et al. An optimized protocol for comprehensive evaluations of salt tolerance in crop germplasm accessions: a case study of tomato (Solanum lycopersicum L). Agronomy14(4), 842. 10.3390/agronomy14040842 (2024). [Google Scholar]
- 39.Zhang, S. et al. Multivariate analysis compares and evaluates heat tolerance of potato germplasm. Plants13(1), 142. 10.3390/plants13010142 (2024). [DOI] [PMC free article] [PubMed] [Google Scholar]
- 40.Wang, K. et al. Heterogeneous expression of Osa-MIR156bc increases abiotic stress resistance and forage quality of alfalfa. Crop J.9(5), 1135–1144. 10.1016/j.cj.2020.11.009 (2021). [Google Scholar]
- 41.Xing, L. et al. miR169q and NUCLEAR FACTOR YA8 enhance salt tolerance by activating PEROXIDASE1 expression in response to ROS. Plant. Physiol.188(1), 608–623. 10.1093/plphys/kiab498 (2022). [DOI] [PMC free article] [PubMed] [Google Scholar]
- 42.Chu, Y. et al. The mir390-GhCEPR2 module confers salt tolerance in cotton and Arabidopsis. Ind. Crops Prod.190, 115865. 10.1016/j.indcrop.2022.115865 (2022). [Google Scholar]
- 43.Denver, J. B. & Ullah, H. miR393s regulate salt stress response pathway in Arabidopsis thaliana through scaffold protein RACK1A mediated ABA signaling pathways. Plant. Signal. Behav.14(6), 1600394. 10.1080/15592324.2019.1600394 (2019). [DOI] [PMC free article] [PubMed] [Google Scholar]
- 44.Liu, X. et al. Transgenic Chrysanthemum indicum overexpressing cin-miR396a exhibits altered plant development and reduced salt and drought tolerance. Plant. Physiol. Biochem.168, 17–26. 10.1016/j.plaphy.2021.09.035 (2021). [DOI] [PubMed] [Google Scholar]
- 45.Nguyen, D. Q., Brown, C. W., Pegler, J. L., Eamens, A. L. & Grof, C. P. L. Molecular manipulation of microRNA397 abundance influences the development and salt stress response of Arabidopsis thaliana. Int. J. Mol. Sci.21(21), 7879. 10.3390/ijms21217879 (2020). [DOI] [PMC free article] [PubMed] [Google Scholar]
- 46.Qin, R. et al. MicroRNA408 negatively regulates salt tolerance by affecting secondary cell wall development in maize. Plant. Physiol.192(2), 1569–1583. 10.1093/plphys/kiad135 (2023). [DOI] [PMC free article] [PubMed] [Google Scholar]
- 47.Zhou, H. et al. Insights into plant salt stress signaling and tolerance. J. Genet. Genomics. 51(1), 16–34. 10.1016/j.jgg.2023.08.007 (2024). [DOI] [PubMed] [Google Scholar]
- 48.Yang, Y. et al. Calcineurin B-like proteins CBL4 and CBL10 mediate two independent salt tolerance pathways in Arabidopsis. Int. J. Mol. Sci.20(10), 2421. 10.3390/ijms20102421 (2019). [DOI] [PMC free article] [PubMed] [Google Scholar]
- 49.Ren, H. et al. Calcium signaling-mediated transcriptional reprogramming during abiotic stress response in plants. Theor. Appl. Genet.136(10), 210. 10.1007/s00122-023-04455-2 (2023). [DOI] [PubMed] [Google Scholar]
- 50.Yu, Z. et al. How plant hormones mediate salt stress responses. Trends Plant. Sci.25(11), 1117–1130. 10.1016/j.tplants.2020.06.008 (2020). [DOI] [PubMed] [Google Scholar]
- 51.Yang, C. et al. ABI5-FLZ13 module transcriptionally represses growth-related genes to delay seed germination in response to ABA. Plant. Commun.4(6), 100636. 10.1016/j.xplc.2023.100636 (2023). [DOI] [PMC free article] [PubMed] [Google Scholar]
- 52.Zhang, H. et al. Emerging crosstalk between two signaling pathways coordinates K+ and Na+ homeostasis in the halophyte Hordeum Brevisubulatum. J. Exp. Bot.71(14), 4345–4358. 10.1093/jxb/eraa191 (2020). [DOI] [PubMed] [Google Scholar]
- 53.Li, J. et al. Comparative transcriptome analysis reveals K+ transporter gene contributing to salt tolerance in eggplant. BMC Plant. Biol.19, 67. 10.1186/s12870-019-1663-8 (2019). [DOI] [PMC free article] [PubMed] [Google Scholar]
- 54.Hasanuzzaman, M. et al. Regulation of reactive oxygen species and antioxidant defense in plants under salinity. Int. J. Mol. Sci.22(17), 9326. 10.3390/ijms22179326 (2021). [DOI] [PMC free article] [PubMed] [Google Scholar]
- 55.Yan, J., Li, J., Zhang, H., Liu, Y. & Zhang, A. ZmWRKY104 positively regulates salt tolerance by modulating ZmSOD4 expression in maize. Crop J.10(2), 555–564. 10.1016/j.cj.2021.05.010 (2022). [Google Scholar]
- 56.Cao, B., Li, N. & Xu, K. Crosstalk of phenylpropanoid biosynthesis with hormone signaling in Chinese cabbage is key to counteracting salt stress. Environ. Exp. Bot.179, 104209. 10.1016/j.envexpbot.2020.104209 (2020). [Google Scholar]
- 57.Zhang, J. et al. Regulation of SmEXPA13 expression by SmMYB1R1-L enhances salt tolerance in Salix matsudana Koidz. Int. J. Biol. Macromol.270(Pt 1). 10.1016/j.ijbiomac.2024.132292 (2024). 132292, DOI. [DOI] [PubMed]
- 58.Xie, Y. et al. Apple receptor-like kinase FERONIA regulates salt tolerance and ABA sensitivity in Malus domestica. J. Plant. Physiol.270, 153616. 10.1016/j.jplph.2022.153616 (2022). [DOI] [PubMed] [Google Scholar]
- 59.Wang, Z. et al. One year and multipoint comparative test of ‘Xisen 6’. J. Agric.11(6), 13–18. 10.11923/j.issn.2095-4050.cjas20191200312 (2021). [Google Scholar]
- 60.Gelmesa, D. et al. Vitro screening of potato genotypes for osmotic stress tolerance. Open. Agric.2, 308–316. 10.1515/opag-2017-003 (2017). [Google Scholar]
- 61.Howlader, O. & Hoque, M. A. Growth analysis and yield performance of four potato (Solanum tuberosum L.) varieties. Bangladesh J. Agril Res.43(2), 267–280. 10.3329/bjar.v43i2.37330 (2018). [Google Scholar]
- 62.Langmead, B., Trapnell, C., Pop, M. & Salzberg, S. L. Ultrafast and memory-efficient alignment of short DNA sequences to the human genome. Genome Biol.10(3). 10.1186/gb-2009-10-3-r25 (2009). R25, DOI. [DOI] [PMC free article] [PubMed]
- 63.Hardigan, M. A. et al. Genome reduction uncovers a large dispensable genome and adaptive role for copy number variation in asexually propagated Solanum tuberosum. Plant. Cell.28(2), 388–405. 10.1105/tpc.15.00538 (2016). [DOI] [PMC free article] [PubMed] [Google Scholar]
- 64.Friedländer, M. R., Mackowiak, S. D., Li, N., Chen, W. & Rajewsky, N. miRDeep2 accurately identifies known and hundreds of novel microRNA genes in seven animal clades. Nucleic Acids Res.40(1), 37–52. 10.1093/nar/gkr688 (2012). [DOI] [PMC free article] [PubMed] [Google Scholar]
- 65.Wen, M., Shen, Y., Shi, S. & Tang, T. miREvo: an integrative microRNA evolutionary analysis platform for next-generation sequencing experiments. BMC Bioinform.13, 140. 10.1186/1471-2105-13-140 (2012). [DOI] [PMC free article] [PubMed] [Google Scholar]
- 66.Zhou, L. et al. Integrated profiling of microRNAs and mRNAs: microRNAs located on Xq27.3 associate with clear cell renal cell carcinoma. PLoS One. 5(12). 10.1371/journal.pone.0015224 (2010). e15224. [DOI] [PMC free article] [PubMed]
- 67.Fahlgren, N. et al. High-throughput sequencing of Arabidopsis microRNAs: evidence for frequent birth and death of MIRNA genes. PLoS One. 2(2), e219. 10.1371/journal.pone.0000219 (2007). [DOI] [PMC free article] [PubMed] [Google Scholar]
- 68.Livak, K. J. & Schmittgen, T. D. Analysis of relative gene expression data using real-time quantitative PCR and the 2 (-Delta Delta C(T)) method. Methods25(4), 402–408. 10.1006/meth.2001.1262 (2001). [DOI] [PubMed] [Google Scholar]
Associated Data
This section collects any data citations, data availability statements, or supplementary materials included in this article.
Supplementary Materials
Data Availability Statement
All data generated or analyzed during this study are included in this article (and its additional files) The raw sequence data reported in this paper have been deposited in the Genome Sequence Archive in National Genomics Data Center, China National Center for Bioinformation / Beijing Institute of Genomics, Chinese Academy of Sciences (GSA: CRA019254) that are publicly accessible at https://ngdc.cncb.ac.cn/gsa/browse/CRA019254.