Abstract
The fatty acid synthase inhibitor, C75, acts centrally to reduce food intake and body weight in mice. Here we report the effects of C75 on the expression of key orexigenic [neuropeptide Y (NPY), agouti-related protein (AgRP), and melanin-concentrating hormone] and anorexigenic [pro-opiomelanocortin (POMC) and cocaine-amphetamine-related transcript (CART)] neuropeptide messages in the hypothalami of lean and obese (ob/ob) mice. In lean mice, C75 rapidly and almost completely blocked food intake and prevented fasting-induced up-regulation of hypothalamic AgRP and NPY mRNAs, as well as down-regulation of CART and POMC mRNAs. Thus, in lean mice C75 seems to interrupt the fasting-induced signals that activate expression of NPY and AgRP and suppression of POMC and CART. In obese mice, C75 rapidly suppressed food intake, reduced body weight, and normalized obesity-associated hyperglycemia and hyperinsulinemia. Like its effect in lean mice, C75 prevented the fasting-induced increase of hypothalamic NPY and AgRP mRNAs in obese mice, but had no effect on the expression of POMC and CART mRNAs. The suppressive effect of C75 on food intake in lean mice seems to be mediated both by NPY/AgRP and POMC/CART neurons, whereas in obese mice the effect seems to be mediated primarily by NPY/AgRP neurons. In both lean and obese mice, C75 markedly increased expression of melaninconcentrating hormone and its receptor in the hypothalamus.
Keywords: AgRP‖CART‖MCH‖NYP‖POMC
Energy balance is monitored by the hypothalamus, which responds to peripheral status signals by releasing neuropeptides that regulate energy intake and expenditure. Neuropeptide Y (NPY) and agouti-related protein (AgRP) (orexigenic neuropeptides) and pro-opiomelanocortin (POMC) and cocaine-amphetamine-related transcript (CART) (anorexigenic neuropeptides) produced by the arcuate nucleus of the hypothalamus play important roles in this regulation (1). Recent studies have shown that fatty acid synthase (FAS) inhibitors (notably cerulenin and C75) act centrally, apparently in the hypothalamus, to down-regulate fasting-induced expression of NPY, inhibit food intake, and cause profound weight loss in obese and lean mice (2). These and other findings, including the fact that NPY administered intracerebroventricularly reversed C75-induced inhibition of food intake, suggest that the site of inhibition lies up-stream of NPY.
Cerulenin and C75 have caused the accumulation of malonyl-CoA, the substrate for FAS, in several readily accessible tissues, notably the liver (2, 3). Moreover, a precedent exists for the role of malonyl-CoA as a mediator of energy status in these tissue contexts (4). Considerable circumstantial evidence (2) supports the hypothesis that an increased malonyl-CoA level in the hypothalamus, caused by inhibition of FAS, is responsible for blocking fasting-induced up-regulation of hypothalamic NPY. The purpose of this investigation was to determine whether the FAS inhibitor, C75, affects the expression of other hypothalamic neuropeptides that are known to function in the control of food intake and body weight.
Experimental Procedures
Mice and Treatment.
Six-week-old BALB/cJ and C57BL/6J-Lepob (ob/ob) mice were from The Jackson Laboratory and were acclimated for at least 1 week to a 12-h light (midnight to noon)/12-h dark (noon to midnight) cycle in a chamber at 22°C and were fed a Lab Diet (PROLAB RMH 1000) from PMI Nutrition International Inc. (Brentwood, MO). At the indicated times, hypothalami (ca. ≈20 mg) (defined by the posterior margin of the optic chiasm and the anterior margin of the mamillary bodies to a depth of ≈2 mm) were dissected, quickly frozen in liquid nitrogen, and stored at −80°C. The fatty acid synthase inhibitor, C75 (molecular weight, 254.32) was custom-synthesized and dissolved in RPMI media 1640 (GIBCO/BRL, Life Technologies, Rockville, MD) for i.p. injection.
Cloning of Partial cDNA Fragments and Preparation of Probes.
Partial cDNAs encoding fragments of CART, melanin-concentrating hormone (MCH), MCH receptor (MCHR), NPY, and POMC were obtained by reverse transcription–PCR (with QIAGEN OneStep RT-PCR; Qiagen, Valencia, CA) from the first-strand cDNA with mouse hypothalamic total RNA as a template. Primers used for reverse transcription–PCR were: 5′-1ATG GAG AGC TCC CGC CTG18-3′ (5′ primer) and 5′-159CAG CTC CTT CTC GTG GGA C141-3′ (3′ primer) for CART (GenBank accession no. NM013732), 5′-61TGT TTG GGC ATT CTG GCT GAG G82-3′ (5′ primer) and 5′-265TTC TGG GGG CGT TTT CTG TGC T244-3′ (3′ primer) for NPY (GenBank accession no. AF273768), 5′-261CGG CCC CAG GAA CAG CAG CAG T282-3′ (5′ primer) and 5′-564GGG CCC GTC GTC CTT CTC C546-3′ (3′ primer) for POMC (GenBank accession no. NM008895), and 5′-437TCC ATC CCA TCT CCT CCA CCA A458-3′ (5′ primer) and 5′-820CGT AGT AGG GCG CCC AGC ACA C799-3′ (3′ primer) for MCHR (5). A partial cDNA for mouse MCH was cloned by using primers: 5′ primer, 5′-CAG CTG AGA ATG GAG TTC AG-3′ and 3′ primer, 5′-CAG GTA TCA GAC TTG CCA AC-3′. The amplified sequence was from the conserved sequence region based on an alignment of the sequence information of human (GenBank accession no. M57703) and rat (GenBank accession no. M29712) MCH mRNAs. Each PCR product was cloned into pCR II-TOPO vector by using a TOPO TA Cloning Kit Dual Promoter (Invitrogen) and sequenced. A plasmid DNA with the correct sequence was prepared by using the QIAGEN Plasmid Maxi kit (Qiagen), purified, linearized with HindIII or XbaI, extracted with phenol/chloroform, and stored at −80°C. pT7 Blue plasmid (Novagen) containing a partial sequence of mouse AgRP cDNA (396 bp, 1–396 of GenBank accession no. U89494, gift from Dr. Tina M. Hahn, University of California, Davis, CA) was linearized with EcoRI, amplified with T7 RNA polymerase to make antisense RNA, and used for RNase protection assay.
RNA Isolation.
Frozen hypothalamic tissue (paired hypothalami from each group) was pulverized with a Bio-Pulverizer II (Research Products International) chilled in liquid nitrogen. The fine powder was transferred into 1.5-ml microcentrifuge tube with tethered cap and o-ring (Denville Scientific, Metuchen, NJ) chilled on dry ice. One milliliter of Isogen (Nippon Gene, Tokyo, Japan) was added, vortexed, suspended with a 1-ml Syringe with 25G5/8 needle (Becton Dickinson) and total RNA extracted according to the manufacturer's procedure (Nippon Gene). RNA concentration was determined from A260 nm and a fluorometric assay by using a RiboGreen RNA Quantitation Kit (Molecular Probes), adjusted to a constant concentration (ca. 100 ng/μl) with RNase-free 1× TE buffer (10 mM Tris/1 mM EDTA, pH 8.0) and stored at −80°C before analysis.
RNase Protection Assay.
Antisense RNA was transcribed with [α-32P]UTP by using a MAXIscript SP6/T7 kit (Ambion, Austin, TX). In brief, 20 μl in vitro transcription reaction contains 1 μg of linearized DNA template, 1× transcription buffer, 0.5 mM each ATP, CTP, and GTP, 6 μl of [α-32P]UTP [800 Ci/mmol/20 mCi/ml (1 Ci = 37 GBq); 1 μl UTP for cyclophilin probe synthesis], and 1 μl of 10 μM unlabeled (“cold”) UTP for NPY and CART (4 μl of 200 μM cold UTP for Cyclophilin; 4 μl of 50 μM cold UTP for MCH and MCHR; no addition for AgRP and POMC), and 1 μl of SP6 or T7 RNA polymerase (15 units/μl). At the end of the reaction for 1 h, 1 μl of DNase I (RNase-free, 2 units/μl) was added, incubated for 30 min, and extracted with phenol/chloroform. Each of the ethanol-precipitated probes was gel-purified according to the manufacturer's manual (Ambion) and radioactivity measured. RNase protection assays were performed with a HybSpeed RPA kit (Ambion). Aliquots of hypothalamic total RNA (5 μg) were mixed with 32P-labeled probe mixtures (7 × 10⁴ cpm for each probe) for mouse AgRP, CART, NPY, POMC, and Cyclophilin or MCH, MCHR, and Cyclophilin and ethanol precipitated with yeast RNA (50 μg) and GlycoBlue (50 μg/ml final) at −80°C for 20 min. Pellets were dissolved in a 10-μl HybSpeed buffer and denatured at 95°C for 5 min. Sample was then hybridized at 68°C for 10 min. After digestion with RNase A/T1, protected fragments corresponding to mouse AgRP (396 bp), CART (159 bp), NPY (205 bp), POMC (304 bp), and Cyclophilin (103 bp) or MCH (161 bp), MCHR (384 bp), and Cyclophilin (103 bp) were separated on an 8 M urea/5% polyacrylamide gel. Gels were dried and exposed on Imaging Plate (BAS-IP MP 2040) (Fuji) for 24 h. Relative mRNA levels of neuropeptides were quantified with a Fuji Bio-Imaging analyzer 1500, and the data were normalized with an intensity of signal of cyclophilin mRNA.
Determination of Blood Glucose and Insulin Concentrations.
Tail blood (ca. 30 μl) in a heparinized microcentrifuge tube was centrifuged at 14,000 rpm for 3 min, and plasma was stored at −80°C before analysis. Glucose concentration was determined by using a Glucose (Trinder) 100 kit (Sigma). Insulin concentration was determined with [125I]insulin and antibody of insulin by using an Insulin RIA kit (Linco Research Immunoassay, St. Charles, MO).
Statistical Analysis.
Results were statistically analyzed by the Student's t test and are presented as means ±SEM of multiple determinations.
Results
Quantitation of Neuropeptide mRNAs in Hypothalamus by Multiprobe RNase Protection Analysis.
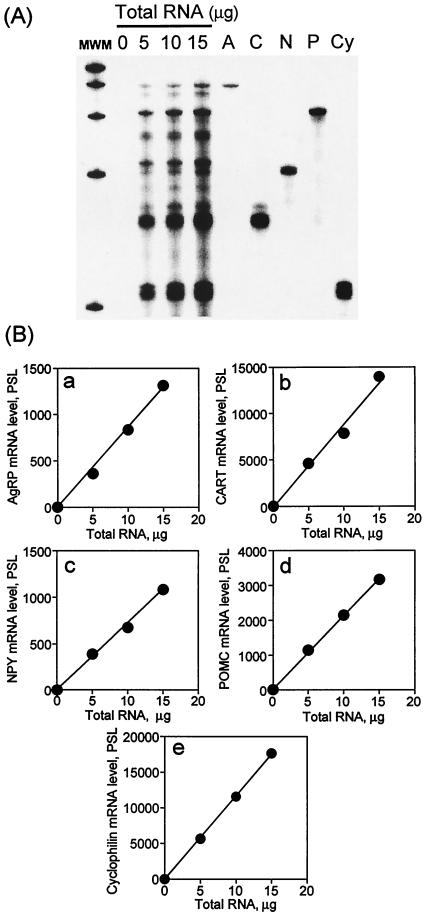
To assess the effect of the FAS inhibitor, C75, on neuropeptide mRNAs in the hypothalamus, a quantitative RNase protection protocol was developed for the concurrent use of multiple cRNA probes. 32P-labeled mouse cRNA probes for AgRP, CART, NPY, POMC, MCH, and MCHR mRNAs were synthesized and gel-purified. To assess quantitation, differing amounts of hypothalamic RNA (0, 5, 10, and 15 μg) were mixed with the 32P-labeled probe mixture and subjected to the protocol. The identity of each protected fragment in the mixture resolved on the gel was assigned on the basis of its predicted size and migration when compared with the fragment protected by each probe tested. Fig. 1A shows the results by using the probe mixture of AgRP, CART, NPY, and POMC. The sizes of the protected fragments were: AgRP, 396 bp; CART, 159 bp; NPY, 205 bp; POMC, 304 bp; and Cyclophilin (normalization control), 103 bp. The relative intensity of each band, determined by phosphorimaging and plotted against the amount of total hypothalamic RNA (i.e., 0, 5, 10, and 15 μg) showed excellent linearity with up to 15 μg of total RNA (Fig. 1B). Similar procedures were used to quantify the levels of MCH and MCHR (protected size, 161 bp and 384 bp, respectively) (data not shown). With this protocol, it was possible to quantitate neuropeptide mRNA levels in the small amount of RNA that can be isolated from mouse hypothalami.
Figure 1.
Linearity of signals for mouse hypothalamic mRNAs in RNase protection analysis. (A) A mixture of 32P-labeled cRNA probes for mouse AgRP, CART, NPY, and POMC was hybridized to total hypothalamic RNA (0, 5, 10, 15 μg) for 10 min at 68°C. The position of migration of each protected fragment is indicated: lane A, AgRP (396 bp); lane C, CART (159 bp); lane N, NPY (205 bp); lane P, POMC (304 bp); lane Cy, cyclophilin (103 bp). Exposure of the phosphorimaging plate was 24 h at room temperature. (B) Results from A quantified by phosphorimager. (a) AgRP; (b) CART; (c) NPY; (d) POMC; (e) cyclophilin. MWM, molecular weight markers. PSL, photostimulated luminescence.
Effect of the Fatty Acid Synthase Inhibitor, C75, on Food Intake, Body Weight, and Blood Glucose and Insulin Levels of Obese Mice.
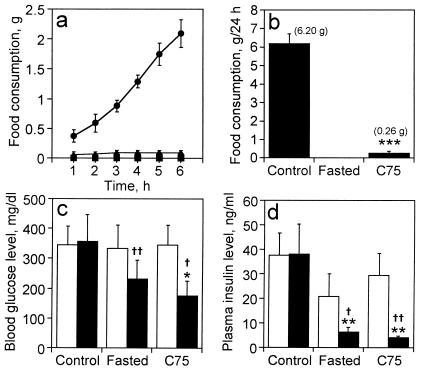
After adapting the obese (ob/ob) mice to a 12-h-light/12-h-dark cycle and ad libitum feeding, C75 (30 mg/kg body weight) or vehicle were injected intraperitoneally. Another group of ob/ob mice was fasted for 26 h after vehicle injection. Food consumption was measured at 1-h intervals for 6 h and again at 24 h after injection. Hypothalamic RNA was isolated and neuropeptide mRNAs quantitated by RNase protection analysis. As shown in Fig. 2a, the effect of C75 on food intake was rapidly (within 1 h) and almost completely blocked. Suppression of food intake by C75 persisted for at least 24 h, at which point there was a 96% reduction relative to that of control mice (Fig. 2b).
Figure 2.
Effect of C75 on food intake and blood glucose and insulin levels in ob/ob mice. ob/ob mice (n = 12) were divided into three groups on the basis of initial blood glucose level. Mice were either fasted (n = 4) (■) or were treated with vehicle (n = 4) (control) (●) or C75 (27 mg/kg body weight) (n = 4) (▴) by i.p. injection and fed ad libitum. After injection (3 h before “lights off”), food consumption was measured at 1-h intervals for 6 h (a). Blood glucose and insulin levels were measured 18 h after injection (c and d, respectively). Food consumption was measured 24 h after injection (b). Values are shown as means ± SEM. The blood glucose and insulin levels of lean (C57BL/6J) mice were 170 ± 6 mg/dl and 1.4 ± 0.7 ng/ml, respectively. In c and d, □ indicates prevalue and ■ indicates after treatment; *, P < 0.05, **, P < 0.01, and ***, P < 0.001 vs. control group; †, P < 0.05 and ††, P < 0.01 vs. prevalue of each group.
ob/ob mice are both hyperglycemic and hyperinsulinemic. By 18 h after administration of C75, hyperglycemia was markedly reduced, blood glucose levels falling from 357 ± 89 mg/dl to 177 ± 47 mg/dl, a decrease of 49%. Fasting also reduced blood glucose levels to 231 ± 62 mg/dl, a decrease of 35% (Fig. 2c). These results are consistent with our previous findings (2). Both C75 treatment or fasting normalized the hyperinsulinemia characteristic of ob/ob mice, plasma insulin levels falling by ≈10-fold (Fig. 2d).
Effect of C75 on the Expression of Hypothalamic Neuropeptide mRNAs in Obese Mice.
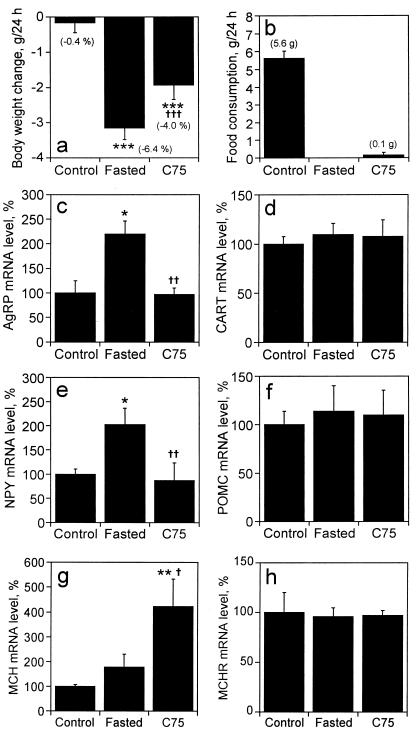
To ascertain whether C75 alters the levels of neuropeptides known to regulate food intake, the levels of the AgRP, CART, NPY, POMC, MCH, and MCHR mRNAs were assessed by quantitative RNase protection analysis. ob/ob mice, fed ad libitum, were injected with C75 (30 mg/kg body weight) or vehicle (Control) by i.p. injection. Ad libitum feeding was then continued, or the vehicle-treated mice were fasted for 24 h. Both fasting and C75 treatment caused a significant decrease in body weight (Fig. 3a) and food intake (Fig. 3b). Although the levels of hypothalamic AgRP and NPY mRNA increased by ≈2-fold in fasted mice (Fig. 3 c and e), they were unchanged by C75 treatment despite the fact that the mice had not eaten and, in effect, had fasted (Fig. 3b). In contrast, the levels of both CART and POMC mRNAs, which are anorexigenic and suppress food intake (6–9), were not altered by fasting or C75 treatment (Fig. 3 d and f). These results strongly suggest that C75 inhibits feeding in obese (ob/ob) mice by blocking the fasting-induced expression of both AgRP and NPY, which is in contrast to the situation with lean mice where C75 prevented the fasting-induced decrease of expression of CART and POMC mRNAs in the hypothalamus (see below). Remarkably, C75 induced the expression of the mRNA encoding MCH (≈4-fold), another orexigenic neuropeptide, but had no effect on the expression of its receptor (Fig. 3 g and h, respectively).
Figure 3.
Effect of C75 on hypothalamic neuropeptide mRNA levels in ob/ob mice. ob/ob mice were fasted (n = 6), injected i.p. with vehicle (n = 6) (control) or injected i.p. with C75 (30 mg/kg body weight) (n = 6) beginning 3 h before “lights off”; the latter two groups were fed ad libitum. Twenty-four hours after injection, body weight change (a) and food consumption (b) were determined and hypothalamic tissue was dissected and quickly frozen. Total hypothalamic RNA (5 μg) was mixed with a probe mixture containing: [32P]UTP-labeled cRNAs for AgRP (c), CART (d), NPY (e), POMC (f), MCH (g), and MCHR (h) mRNAs, and subjected to the RNase protection assay protocol. Protected fragments were separated by urea-PAGE and exposed to an imaging plate for 24 h. Radioactivity in the gel bands was quantified, normalized to the cyclophilin signal, and expressed as percent change relative to the mRNA level of control mice. Values are shown as means ± SEM. *, P < 0.05, **, P < 0.01, and ***, P < 0.001 vs. control group; †, P < 0.05, ††, P < 0.01, and †††, P < 0.001 vs. fasted group.
Effect of C75 on the Expression of Hypothalamic Neuropeptide mRNAs in “Lean” Mice.
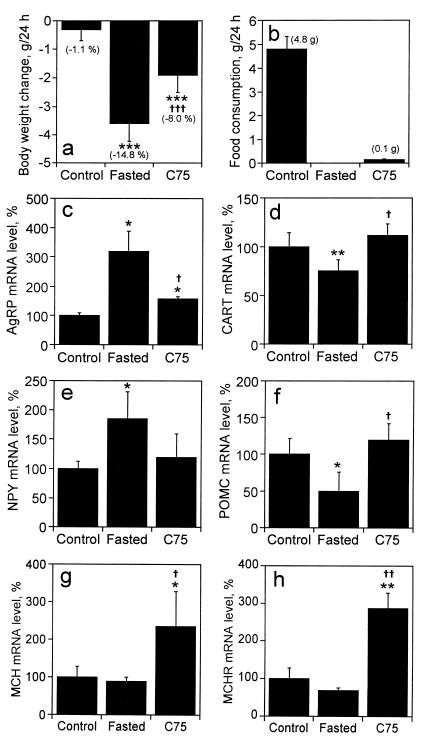
We next examined the effect of C75 on hypothalamic neuropeptide mRNA levels in “lean” (BALBc) mice. Mice were divided into three groups: C75-treated (30 mg/kg body weight), vehicle-treated, or vehicle-treated and fasted for 26 h. Twenty-four hours after injection with C75, body weight and food consumption were measured. Consistent with our previous findings (2), body weight of fasted and C75-treated mice both decreased substantially (Fig. 4a). Cumulative food consumption for 24 h after administration of C75 was decreased by 98% compared with that of controls (Fig. 4b). Both hypothalamic AgRP and NPY mRNAs were increased markedly (320% and 185%, respectively) by fasting, whereas C75 treatment prevented the fasting-induced increase (Fig. 4 c and e). Unlike the failure of fasting or C75 treatment to affect hypothalamic CART and POMC mRNAs in obese mice, the levels of both CART and POMC mRNAs were markedly decreased by fasting in lean mice. Furthermore, C75 treatment blocked the fasting-induced decrease in the levels of these anorexigenic neuropeptide messages and actually caused a small rise (112% and 120% for CART and POMC, respectively) in their levels compared with control mice (Fig. 4 d and f). These results suggest that the decreased food intake (comparable with fasting) provoked by C75 is caused by preventing the fasting-induced increase in the expression of AgRP and NPY and decrease in the expression of CART and POMC. Expression of both the MCH and MCHR messages were both markedly increased by C75 treatment (Fig. 4 g and h, respectively).
Figure 4.
Effect of C75 on hypothalamic neuropeptide mRNA levels in “lean” (BALBc) mice. BALBc mice were weighed and then fasted (n = 6), injected i.p. with vehicle (n = 6) (control) or injected i.p. with C75 (30 mg/kg body weight) (n = 8) 3 h before “lights off”; the latter two groups were fed ad libitum. Twenty-four hours after injection, mice were weighed (a), food consumption was measured (b), and hypothalamic tissue was dissected and frozen quickly. Total RNA (5 μg) extracted from paired hypothalami was mixed with probe mixtures containing [32P]UTP-labeled cRNAs for AgRP (c), CART (d), NPY (e), POMC (f), MCH (g), and MCHR (h) mRNAs, and subjected to the RNase protection protocol. Protected fragments were separated by urea-PAGE and exposed to an imaging plate for 24 h. Radioactivity in the gel bands was quantified, normalized to the cyclophilin signal, and expressed as percent relative to the mRNA level of control mice. Values are shown as means ± SEM. *, P < 0.05, **, P < 0.01, and ***, P < 0.001 vs. control group; †, P < 0.05, ††, P < 0.01, and †††, P < 0.001 vs. fasted group.
Effect of C75 on Hypothalamic AgRP and NPY mRNAs Previously Up-regulated by Fasting Obese Mice.
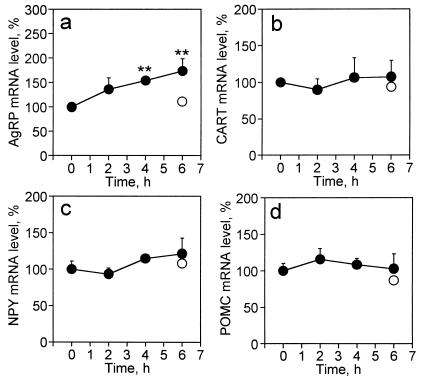
In view of the high levels of NPY and AgRP mRNAs in ob/ob mice, relative to lean wt mice and the additional increase caused by fasting, it was of interest to determine how rapidly these message levels adjust to a new, presumably lower, “steady-state” level after C75 treatment. Therefore, we investigated the effect of C75 on the kinetics of change of the levels of NPY and AgRP mRNAs after treatment of ob/ob obese mice with C75 whose NPY and AgRP levels were already high. ob/ob mice were first fasted for 26 h to elevate their hypothalamic NPY and AgRP mRNAs to levels comparable with those shown in Fig. 3c and at which point C75 (30 mg/kg body weight) or vehicle was administered by i.p. injection (time 0). After 2, 4, and 6 h, hypothalamic RNA was isolated and subjected to RNase protection analysis (Fig. 5). At time 0 (0 h), both AgRP and NPY mRNA levels in 26-h fasted mice were 220% and 204% higher, respectively, than those of nonfasted control ob/ob mice (results shown in Fig. 3 c and e). After i.p. injection of C75, the level of NPY mRNA, up-regulated by fasting, remained relatively constant during the next 6 h (Fig. 5c). In contrast, by the 4-h and 6-h time points, the level of AgRP mRNA had increased significantly (by 154% and 174%, respectively; Fig. 5a). On the other hand, the levels of CART and POMC mRNA in ob/ob mice remained unchanged during the 6-h period after injection with C75 (Fig. 5 b and d). Thus, C75 does not affect the levels of these neuropeptide messages under fasted or nonfasted (Fig. 3 d and f) conditions in ob/ob mice. The fact that the level of AgRP mRNA continued to rise after C75 treatment indicates that transcription of the AgRP gene was not immediately blocked nor was turnover of AgRP mRNA markedly increased under these circumstances. Because the level of the NPY message did not change during the 6-h period after injection of C75, it seems likely that the half-life of NPY mRNA is relatively long in this context, which would be consistent with the interpretation that C75 prevents the fasting-induced transcriptional activation of the NPY gene, but has little effect on the rate of turnover of the NPY message.
Figure 5.
Effect of C75 on hypothalamic neuropeptide mRNA levels in ob/ob mice fasted for 26 h. ob/ob mice were fasted for 26 h. Hypothalami from six mice were dissected at this time (time 0); another group of 26-h fasted mice was either injected i.p. with vehicle (n = 3) or with C75 (30 mg/kg body weight) (n = 18). At 2 h (n = 6), 4 h (n = 6), and 6 h (n = 6) after injection, hypothalamic tissue was dissected (time: 2 h, 4 h, and 6 h). Total RNA (5 μg) extracted from paired hypothalami was mixed with a probe mixture containing [32P]UTP-labeled cRNAs for AgRP (a), CART (b), NPY (c), and POMC (d) mRNAs, and subjected to the RNase protection assay protocol. Protected fragments were separated by urea-PAGE and exposed to an imaging plate for 24 h. Radioactivity in the gel bands was quantified, normalized to the cyclophilin signal, and expressed as percent change relative to the mRNA level of control mice. Neuropeptide mRNA levels in mice fasted for 26 h + 6 (○) were 108% (AgRP), 94% (CART), 106% (NPY), and 80% (POMC). Values are shown as means ± SEM. **, P < 0.01 vs. value of time 0.
Discussion
In a previous paper (2), we demonstrated that the FAS inhibitors, cerulenin and C75, block the fasting-induced increase of hypothalamic NPY mRNA, suppress food intake, and cause dramatic weight loss in both obese (ob/ob) and lean mice. In this report, we show that C75 affects the expression of the mRNAs of other important orexigenic (AgRP and MCH) and anorexigenic (POMC and CART) hypothalamic neuropeptides. In obese (ob/ob) mice C75 prevents the normal fasting-induced increase in expression of the AgRP and NPY messages (Fig. 3 c and e), but not the messages for the anorexigenic neuropeptides, CART and POMC (Fig. 3 d and f). These findings are consistent with the report (10) that unlike NPY mRNA, which is up-regulated by fasting in ob/ob mice, POMC mRNA level is not. Thus, in the context of leptin-deficiency-induced obesity, the action of C75 is focused on the signaling pathway(s) for expression of AgRP and NPY, but not on these for CART or POMC. In lean mice that possess an intact leptin-signaling system C75 not only blocks fasting-induced up-regulation of NPY and AgRP mRNAs, but also fasting-induced down-regulation of POMC and CART mRNAs (Fig. 4). Despite these differences, the suppressive effect of C75 on food intake is the same in both ob/ob obese and wt lean mice. It seems, therefore, that an intact leptin-signaling system is required for the effect of C75 on POMC/CART neurons, but is not essential for the effect of C75 on NPY/AgRP neurons.
Previous studies (2) showed that C75 administered intracerebroventricularly suppressed food intake, indicating that C75 acts centrally. Moreover, the inhibitory effect of C75 (administered i.p.) on food intake was reversed, presumably by-passed, by intracerebroventricular administration of NPY. These findings indicate that the feeding control pathway(s) downstream of NPY is intact and that the site of action of C75 lies upstream of NPY. Taken together these results suggest that the signaling pathway leading to the expression of NPY by NPY/AgRP neurons is a primary site of C75 action in ob/ob mice. The fact that C75 suppresses food intake in leptin-deficient mice (2) suggests that C75 acts at a site downstream of the leptin receptor.
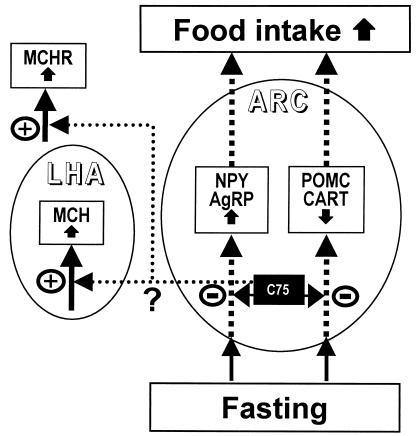
C75 was unexpectedly found to induce a large increase (2.5- to 4.0-fold) in the expression of the mRNAs encoding the orexigenic neuropeptide, MCH, and its receptor, MCHR; fasting per se had little or no effect (Figs. 3g and 4 g and h). Assuming that the site of inhibition by C75 lies downstream of (or parallel to) the MCH-signaling system and that negative feedback by an intermediate (or product) of this system is operative, such increases in MCH and MCHR could be caused by overexpression due to lack of negative feedback. Such feedback could occur through known connections (11) between the arcuate nucleus (ARC) and the lateral hypothalamic area. MCH is expressed only in the lateral hypothalamic area of the hypothalamus, whereas MCHRs are expressed in several regions, notably the ARC (5, 12). In the ARC, the site of action of C75 lies upstream of expression of NPY/AgRP and POMC/CART and thus prevents fasting-induced changes in their expression. We hypothesize that the connection between the ARC and lateral hypothalamic area may link the NPY/AgRP and POMC/CART signaling systems to that of the MCH system and may be responsible, through an unknown intermediary, for the increased expression of MCH caused by C75. A model incorporating these facts and assumptions is shown in Fig. 6.
Figure 6.
A hypothetical model of C75 action in neuropeptide gene regulation in hypothalamic neurons. This schematic represents a model for inhibition of feeding by C75 through actions on both NPY/AgRP and POMC/CART neurons in arcuate nucleus. (−) inhibition or (+) stimulation due to C75. LHA, lateral hypothalamic area.
In considering where C75 might act in both NPY/AgRP and POMC/CART neurons, we suggest that alteration of the phosphorylation status of STAT3 as an attractive possibility. Both leptin (13) and ciliary neurotrophic factor (14), which suppress food intake, increase the level of phospho-STAT3 in the ARC and decrease NPY in the paraventricular nucleus (14–16). Alternatively, C75 might affect the recently described connection between phosphatidylinositol 3-kinase and the leptin-signaling system (17). Whatever the site of C75 action is, it must function in both types of neurons in the “normal” lean mouse, as C75 alters the level of both NPY and AgRP messages, as well as the POMC and CART messages, albeit in an inverse manner. Both types of neurons possess leptin and ciliary neurotrophic factor receptors and both leptin (10, 18) and ciliary neurotrophic factor rapidly activates the phosphorylation of STAT3 in both cell types (19).
Acknowledgments
This research was supported by a research grant from National Institutes of Health and the Yamanouchi USA Foundation (2000).
Abbreviations
- AgRP
agouti-related protein
- CART
cocaine-amphetamine-regulated transcript
- MCH
melanin-concentrating hormone
- MCHR
MCH receptor
- NPY
neuropeptide Y
- POMC
pro-opiomelanocortin
- ARC
arcuate nucleus
- FAS
fatty acid synthase
References
- 1.Schwartz M W, Woods S C, Porte D, Jr, Seeley R J, Baskin D G. Nature (London) 2000;404:661–671. doi: 10.1038/35007534. [DOI] [PubMed] [Google Scholar]
- 2.Loftus T M, Jaworsky DE, Frehywot G L, Townsend C A, Ronnett G V, Lane M D, Kuhajda F P. Science. 2000;288:2379–2381. doi: 10.1126/science.288.5475.2379. [DOI] [PubMed] [Google Scholar]
- 3.McGarry J, Foster D. J Biol Chem. 1979;254:8163–8168. [PubMed] [Google Scholar]
- 4.Ruderman N B, Saha A K, Vavvas D, Witters L A. Am J Physiol. 1999;276:E1–E18. doi: 10.1152/ajpendo.1999.276.1.E1. [DOI] [PubMed] [Google Scholar]
- 5.Kokkotou E G, Tritos N A, Mastaitis J W, Slieker L, Maratos-Flier E. Endocrinology. 2001;142:680–686. doi: 10.1210/endo.142.2.7981. [DOI] [PubMed] [Google Scholar]
- 6.Abbott C R, Rossi M, Wren A M, Murphy K G, Kennedy A R, Stanley S A, Zollner A N, Morgan D G A, Morgan I, Ghatei M A, et al. Endocrinology. 2001;142:3457–3463. doi: 10.1210/endo.142.8.8304. [DOI] [PubMed] [Google Scholar]
- 7.Larsen P J, Vrang N, Petersen P C, Kristensen P. Obes Res. 2000;8:590–596. doi: 10.1038/oby.2000.76. [DOI] [PubMed] [Google Scholar]
- 8.Kawakami S, Bungo T, Ando R, Ohgushi A, Shimojo M, Masuda Y, Furuse M. Eur J Pharmacol. 2000;398:361–364. doi: 10.1016/s0014-2999(00)00344-7. [DOI] [PubMed] [Google Scholar]
- 9.Yaswen L, Diehl N, Brennan M B, Hochgeschwender U. Nat Med. 1999;5:1066–1070. doi: 10.1038/12506. [DOI] [PubMed] [Google Scholar]
- 10.Baskin D G, Breininger J F, Schwartz M W. Diabetes. 1999;48:828–833. doi: 10.2337/diabetes.48.4.828. [DOI] [PubMed] [Google Scholar]
- 11.Elias C F, Saper C B, Maratos-Flier E, Tritos N A, Lee C, Kelly J, Tatro J B, Hoffman G E, Ollmann M M, Barsh G S, et al. J Comp Neurol. 1998;402:442–459. [PubMed] [Google Scholar]
- 12.Tritos N A, Mastaitis J W, Kokkotou E, Maratos-Flier E. Brain Res. 2001;895:160–166. doi: 10.1016/s0006-8993(01)02066-2. [DOI] [PubMed] [Google Scholar]
- 13.Campfield L A, Smith F J, Guisez Y, Devos R, Burn P. Science. 1995;269:546–549. doi: 10.1126/science.7624778. [DOI] [PubMed] [Google Scholar]
- 14.Lambert P D, Anderson K D, Sleeman M W, Wong V, Tan J, Hijarunguru A, Corcoran T L, Murray J D, Thabet K E, Yancopoulos G D, Wiegand S J. Proc Natl Acad Sci USA. 2001;98:4652–4657. doi: 10.1073/pnas.061034298. . (First Published March 20, 2001; 10.1073/pnas.061034298) [DOI] [PMC free article] [PubMed] [Google Scholar]
- 15.Vaisse C, Halaas J L, Horvath C M, Darnell J E, Jr, Stoffel M, Friedman J M. Nat Genet. 1996;14:95–97. doi: 10.1038/ng0996-95. [DOI] [PubMed] [Google Scholar]
- 16.Banks A S, Davis S M, Bates S H, Myers M G., Jr J Biol Chem. 2000;275:14563–14572. doi: 10.1074/jbc.275.19.14563. [DOI] [PubMed] [Google Scholar]
- 17.Niswender K D, Morton G J, Stearns W H, Rhodes C J, Myers M G, Jr, Schwartz M W. Nature (London) 2001;413:794–795. doi: 10.1038/35101657. [DOI] [PubMed] [Google Scholar]
- 18.Cheung C C, Clifton D K, Steiner R A. Endocrinology. 1997;138:4489–4492. doi: 10.1210/endo.138.10.5570. [DOI] [PubMed] [Google Scholar]
- 19.Kalra S P. Proc Natl Acad Sci USA. 2001;98:4279–4281. doi: 10.1073/pnas.091101498. [DOI] [PMC free article] [PubMed] [Google Scholar]


