

Abstract
Purpose
This study aimed to investigate the molecular mechanisms associated with chromosome segregation errors caused by intrinsic oxidative stress during in vitro oocyte maturation (IVM) using oocytes from Sod1‐deficient (Sod1KO) mice.
Methods
Ovulated or in vitro matured cumulus‐cells oocyte complexes (COCs) were collected from wild‐type (WT) and Sod1KO mice and evaluated chromosome alignment, chromosome segregation, meiotic progression, and BUBR1 and REC8 protein expression levels.
Results
In 21% O2 IVM, the Sod1KO had significantly higher frequencies of chromosome misalignment and segregation errors compared to the WT, and they also reached Germinal Vesicle Break Down (GVBD) and M I stages peak earlier and showed a shorter M I stage residence time compared to the WT. These changes were associated with a decrease in the recruitment of BUBR1 to kinetochores at M I stage, but there were no differences in the expression of REC8 between the two genotypes. Furthermore, the addition of L‐ascorbic acid (AsA) or N‐acetyl‐L‐cysteine (NAC) during IVM reduced the frequency of chromosome segregation errors in Sod1KO oocytes.
Conclusions
Oxidative stress caused by Sod1 deficiency during IVM impairs the spindle assembly checkpoint function due to a decrease in the recruitment of BUBR1 to M I stage kinetochores, leading to abnormalities in meiotic progression and chromosome segregation.
Keywords: BUBR1, chromosome segregation errors, oocyte, spindle assembly checkpoint, superoxide dismutase‐1
Intrinsic oxidative stress caused by a Sod1 deficiency during oocyte maturation induces meiotic chromosome segregation errors by reducing its function as a spindle assembly checkpoint as the result of a decreased recruitment of BUBR1 to kinetochores at metaphase I.

1. INTRODUCTION
Although oocytes develop in a lower oxygen environment within the follicle compared to standard in vitro maturation (IVM) conditions, efficient oxygen diffusion is maintained due to the vascularization of the follicle. 1 Cumulus cells provide oocytes with L‐lactate and pyruvate, reducing oxidative stress from reactive oxygen species (ROS) through oxidative phosphorylation in vivo. 2 However, cells are exposed to a hyperoxic environment under normal culture conditions (21% O2). Excess ROS, including superoxide anions, hydrogen peroxide, and hydroxyl radicals, can lead to irreversible cellular damage by modifying proteins, lipids, and nucleic acids, impairing their function. 3 , 4 Cellular damage caused by oxidative stress is not limited to somatic cells but has also been reported in germ cells. Increased mitochondrial dysfunction, meiotic spindle malformation, and granulosa cell apoptosis have been reported as oxidative disorders during the development of oocytes or embryos. 5 , 6 And oxidative stress during embryogenesis induces mitotic arrest and apoptosis. 7 Increased oxidative stress due to maternal aging also increases aneuploidy. 8
Among the known antioxidant proteins, superoxide dismutases (SODs) play a central role in removing superoxide anions, a major ROS that is generated from intracellular molecular oxygen at the initial stage of a radical chain reaction. 9 Three types of mammalian SOD proteins are known 10 : SOD1, localized in the cytosol and mitochondrial intermembrane space; SOD2 is localized in the mitochondrial matrix; and SOD3 is localized in the plasma. Among these, the prominent phenotype of Sod1‐deficient (Sod1KO) mice is female infertility. 11 , 12 Noda et al. reported that increased oxidative stress in the ovaries from Sod1KO mice results in luteal dysfunction, leading to miscarriage. 13 We also previously reported that the development of Sod1KO embryos under conventional culture conditions (21% O2) is arrested at the 2‐cell stage without mitochondrial dysfunction. 14 On the other hand, the effects of intrinsic oxidative stress caused by Sod1 deficiency on mouse oocyte maturation are still unclear.
Oxidative stress during oocyte maturation disturbs meiotic progression, ultimately arresting the cell cycle and activating apoptosis. 15 It has been reported that IVM under atmospheric conditions results in the formation of larger metaphase I (M I) and M II spindles compared to in vivo matured oocytes. 16 When oocytes from aged females and in vitro matured oocytes are exposed to excessive oxidative stress, 17 , 18 , 19 their aneuploidy is increased. 8 , 20 Moreover, studies have shown that the mRNA levels of Sod1 in oocytes at both the germinal vesicle (GV) and M II stages are significantly lower in aged mice compared to young mice, 21 further supporting the link between aging, oxidative stress, and increased aneuploidy. Since SOD1 is localized in the nucleoplasm as well as in the cytoplasm in oocytes, 22 it is possible that it regulates chromosome segregation. In fact, oxidative stress from a Sod1 deficiency in midprophase drosophila oocytes induces a premature loss of cohesion and chromosome segregation errors. 23 Thus, oxidative stress during oocyte maturation affects meiotic progression, cytoskeletal architecture, and gene expression, 24 which may affect chromosome segregation, but the details of the molecular mechanisms responsible for this are unclear.
Previous reports have shown that most of the chromosome segregation errors in the oocyte maturation process occur during the first meiotic division. 25 Chromosome segregation during the meiotic process of oocytes is appropriately regulated by factors localized to centromeres, kinetochores, and chromosome arms, such as spindle assembly checkpoint (SAC), chromosomal passenger complex (CPC), and cohesin complex. 26 Among these, the SAC ensures accurate chromosome segregation by delaying anaphase onset until all chromosomes are correctly attached to the spindle apparatus. 27 , 28 , 29 Among SAC components, BUBR1 plays a critical role in this process. It helps monitor kinetochore‐microtubule attachment and suppresses anaphase‐promoting complex/cyclosome (APC/C) activity by forming a complex with other SAC proteins, such as BUB3 and Mad2, thereby preventing premature chromosome segregation in mitotic metaphase as well as in meiosis I and meiosis II. 30 , 31 , 32 Previous studies have shown that the mRNA levels of BubR1 in mouse oocytes decrease with aging, 33 suggesting that the effectiveness of the SAC may diminish in aged oocytes. The depletion of BUBR1 disrupts this checkpoint function, resulting in accelerated meiotic progression and chromosome misalignment. 29 Given its pivotal role in ensuring accurate chromosome segregation during meiosis, we focused on BUBR1 to better understand the mechanisms behind the segregation errors observed under oxidative stress. The cohesin complex, composed of proteins such as SMC1, SMC3, and the meiosis‐specific REC8, is essential for maintaining cohesion between sister chromatids. 34 , 35 This cohesion is resolved in two stages: sister chromatid arm cohesion is released during anaphase of meiosis I, while centromere cohesion is typically released during meiosis II. 36 REC8 plays a critical role in ensuring proper segregation by preventing premature separation of sister chromatids (PSSC), a disruption that can lead to aneuploidy. In aged oocytes, reduced expression of REC8 has been linked to increased chromosome segregation errors, making it an important target for studying the effects of oxidative stress in this context. 36 , 37 , 38
Therefore, this study focused on BUBR1 and REC8, which play important roles in chromosome segregation. Our goal is to clarify the mechanism responsible for the induced chromosome segregation errors caused by oxidative stress during oocyte maturation.
In this study, we first investigated the effects of intrinsic oxidative stress caused by a Sod1 deficiency on chromosome alignment and chromosome segregation during IVM. We also examined the dynamics of the expression of BUBR1 and REC8 to clarify the cause of the chromosome segregation abnormalities that occur in Sod1KO oocytes. In addition, the effects of the chromosome segregation error rate of Sod1KO oocytes in the presence of antioxidants during IVM were evaluated.
2. MATERIALS AND METHODS
2.1. Animals
C57BL/6 Sod1+/− mice, originally established by Matzuk et al., 12 were purchased from The Jackson Laboratories (Bar Harbor, ME, USA) and bred at our institute, giving rise to Sod1+/+ and Sod1−/− littermates. They were genotyped by PCR amplification as described previously. 39 Mice that had been backcrossed to CD1 (ICR) mice (The Jackson Laboratories, Kanagawa, Japan) more than eight times were used in this study. Three‐ to four‐week‐old female mice were used to maximize the yield of oocytes in response to hormone stimulation. The animal room climate was maintained under specific pathogen‐free conditions at a constant temperature of 20–22°C with 12‐h alternating light–dark cycle; food and water were available ad libitum.
2.2. Oocyte collection and culture
To collect ovulated oocytes, Sod1KO and ICR background genetic controls (wild‐type; WT) females were treated with 5 IU of equine chorionic gonadotropin (Sankyo‐elu, Tokyo, Japan), followed by 5 IU of human chorionic gonadotropin after 48 h (Asuka‐seiyaku, Tokyo, Japan) administered intraperitoneally. Cumulus cells surrounding vivo matured M II oocytes were collected from the oviducts of the mice after cervical dislocation.
To collect immature oocytes, Sod1KO and WT females were superovulated by treatment with 5 IU of equine chorionic gonadotropin. After 48 h, the ovaries were removed from the mice after cervical dislocation, and the large follicles were ruptured to release COCs at the GV stage in Leibovitz's L‐15 medium (Invitrogen, Paisley, UK), supplemented with 0.1% polyvinyl alcohol (PVA; Sigma‐Aldrich, St. Louis, MO, USA), 50 mg/L hypoxanthine (Sigma‐Aldrich), and 1 μL/mL amikamycin. These COCs were cultured for 18 h to obtain in vitro matured M II oocytes in Waymouth's MB752/1 medium (Invitrogen), supplemented with 5% fetal calf serum (Invitrogen), 0.23 mM pyruvic acid (Sigma‐Aldrich), 4 mM hypoxanthine, 10 IU/L follicle stimulation hormone (Sigma‐Aldrich), and 1 μL/mL amikamycin. Oocyte maturation was defined as the polar body I emission. To investigate the issue of whether antioxidants affect the frequency of chromosome segregation errors due to a Sod1 deficiency, some GV stage COCs were cultured with either 500 μM AsA or 500 μM NAC being added to the culture medium. IVM was conducted at 37°C under a humidified atmosphere of either 21% O2 (5% CO2 in air) or 5% O2 (5% O2/5% CO2/90% N2).
2.3. Immunofluorescent staining of the whole oocytes
Oocytes were fixed with 2% paraformaldehyde/phosphate‐buffered saline (PBS) at room temperature (20–26°C) for 1 h, followed by permeabilization by treatment with 0.5% Triton X‐100 for 20 min, blocking in 3% bovine serum albumin (BSA)‐supplemented PBS for 1 h. They were then reacted with a polyclonal anti‐BUBR1 antibody (Abcam, Cambridge, UK), or anti‐α‐tubulin antibody (Sigma‐Aldrich) overnight (12–15 h) at 4°C. Each antibody and its dilution rate are shown in Table S1. After three, 5 min washes with 3% BSA‐supplemented PBS, the oocytes were labeled with fluorescein isothiocyanate (FITC)‐anti‐sheep IgG (Sigma‐Aldrich) or FITC‐anti‐mouse IgG (Sigma‐Aldrich) for 1 h at room temperature and then washed three times with 3% BSA‐supplemented PBS. The oocytes were co‐stained with propidium iodide (PI). Finally, the oocytes were mounted on glass slides and observed under a confocal laser scanning microscope (Zeiss LSM 700 Laser Scanning Microscope; Carl Zeiss, Baden‐Württemberg, Germany).
2.4. Detection of BUBR1 and REC8 in in vitro matured oocytes by western blotting
To detect BUBR1 and REC8 proteins, COCs derived from each genotype (Sod1KO and WT) were denuded by a hyaluronidase treatment (300 mg/mL in potassium simplex‐optimized medium, type IVs, Sigma‐Aldrich) and GV, GVBD, proM I, M I, anaphase I‐telophase I (A I‐T I) and M II oocytes were collected 0, 2, 4, 6, 8, 10, 18 h, respectively. Each sample of 60 oocytes was washed with PBS containing 3 mg/mL PVA (Sigma‐Aldrich), sonicated for 1 s, and then lysed in 2% sodium dodecyl sulfate (SDS) and 60 mM Tris–HCl‐based sampling buffer (pH 6.8). The lysates were separated by electrophoresis by 12% SDS–polyacrylamide gel electrophoresis (PAGE) and electrically transferred onto polyvinylidene fluoride membranes (Millipore, Billerica, MA, USA). After blocking for 1 h with 5% (w/v) skim milk in 0.1% (v/v) Tween‐20‐tris‐buffered saline (T‐TBS), the membrane was immersed in polyclonal anti‐BUBR1 antibody (Abcam) or polyclonal anti‐REC8 antibody (Bioss, Woburn, MA, USA) diluted with Can Get Signal® solution I (Toyobo, Osaka, Japan) overnight (12–15 h) at 4°C. Each antibody and its dilution rate are shown in Table S1. After three 5 min washes with T‐TBS, the membrane was incubated with horseradish peroxidase‐conjugated secondary antibodies diluted with Can Get Signal® solution II (Toyobo) for 1 h at room temperature. After three washes in T‐TBS, the blots were visualized using an ECL detection kit (Amersham™ ECL™ Prime Western Blotting Detection Reagent). The membrane was next incubated for 15 min at 50°C in stripping buffer (2% SDS, 100 mM β‐mercaptoethanol, and 60 mM Tris–HCl) for antibody removal. Similarly, glyceraldehyde‐3‐phosphate dehydrogenase (GAPDH, Sigma) was detected using anti‐rabbit secondary antibodies (Sigma‐Aldrich). At least three independent experiments were performed using other samples for each experimental group. The protein expression level was estimated based on the intensity of staining of each membrane band using an image analysis software (ImageJ 1.38u; Wayne Rasband National Institutes of Health, USA).
2.5. Chromosome spreading of the oocytes for chromosome analysis
Oocytes collected at the M I or M II stage were exposed to Tyrode buffer (pH 1.8) for an appropriate number of seconds at room temperature (20–26°C) to remove the zona pellucida. After a few minutes of hypotonic treatment, the oocytes were fixed with a spreading solution (1% paraformaldehyde, 0.15% Triton X‐100, and 3 mM dithiothreitol in double distilled water; pH 9.2) and dropped onto glass slides. After fixation, Giemsa staining or fluorescent immunostaining was performed.
2.6. Counting of oocyte chromosome numbers by Giemsa staining
After fixation, the slides were air‐dried and transferred to 5% Giemsa solution (Sigma‐Aldrich) in PBS, stained for 20 min, washed in Milli‐Q water, and then air‐dried again. Images of Giemsa‐stained oocyte chromosomes were taken with a confocal laser scanning microscope (Zeiss LSM 700 Laser Scanning Microscope; Carl Zeiss). The number of chromosome pairs was evaluated.
2.7. Immunofluorescence staining of oocyte chromosomes
After fixation, the slides were blocked with 3% BSA in PBS, and reacted with a polyclonal anti‐BUBR1 antibody (Abcam) or a polyclonal anti‐REC8 antibody (provided by Dr. Jibak Lee, Kobe University, Japan) at 4°C overnight (12–15 h). Each antibody and its dilution rate are shown in Table S1. The primary antibodies were then washed off and incubated with FITC‐conjugated secondary antibodies for 1 h at 4°C, following which the chromosomes were stained with PI. Images of the immunofluorescence stained chromosomes were collected using a confocal laser scanning microscope (Zeiss LSM 700 Laser Scanning Microscope; Carl Zeiss).
2.8. Measurement of BUBR1 signal intensity by immunofluorescence staining
Images were acquired using the Zen2009 light version software (Carl Zeiss), and the immunofluorescence was quantitatively analyzed. To quantify the fluorescence intensity of BUBR1 on the kinetochore, a circular area surrounding each centromere area was determined and the average pixel intensity within that area was calculated using the attached image analysis software. The intensity of the BUBR1 signals was calculated by subtracting the background signal in the chromosomal arm regions from the BUBR1 signals on the centromere.
2.9. Measurement of distances between sister kinetochores at the M II stage
The distance between sister kinetochores was measured from the center of one BUBR1 signal localized to the kinetochore to the center of the other BUBR1 signal. Images were acquired using the Zen2009 light version software (Carl Zeiss), and the distances were quantified using the attached image analysis software.
2.10. Statistical analyses
Fisher's exact test or the chi‐squared test was used to compare the rate of oocyte maturation, chromosome alignment, chromosome segregation error, and meiotic progression. Bonferroni's correction was used as needed. Welch's T‐test was used to compare the intensity of DHE fluorescence, kinetochore BUBR1 fluorescence, the expression level of BUBR1 or REC8, and the distance between sister kinetochores. These analyses were performed using the EZR software Ver. 1.55 (Saitama Medical Center, Jichi Medical University, Saitama, Japan). 40 A p‐value of <0.05 was considered to be statistically significant.
3. RESULTS
3.1. Sod1 deficiency during IVM increases superoxide levels and chromosome misalignment in oocytes
The rate of in vivo oocyte maturation was significantly lower in the Sod1KO mice compared with that for the WT mice (Figure 1; p < 0.01). On the other hand, in 21% O2 IVM, there was no significant difference between the two genotypes (Figure 1A), but in 5% O2 IVM the extent of maturation was significantly higher in Sod1KO mice than that in the WT mice (Figure 1A; p < 0.05). The rate of chromosome misalignment at the M II stage in vivo and in 5% O2 IVM were not significantly different between the two genotypes (Figure 1B,C). In contrast, the rate of chromosome misalignment at the M II stage in 21% O2 IVM was significantly higher in the Sod1KO mice as compared with the WT mice (Figure 1C; p < 0.01). As a complementary study, we attempted to detect superoxide in the oocyte cytoplasm by dihydroethidium (DHE) staining and assessed oxidative stress from their staining intensity. The staining intensity of the oocyte cytoplasm at the M II stage in 21% O2 IVM was significantly higher in the Sod1KO mice than that in the WT mice (Figure S1; p < 0.05).
FIGURE 1.
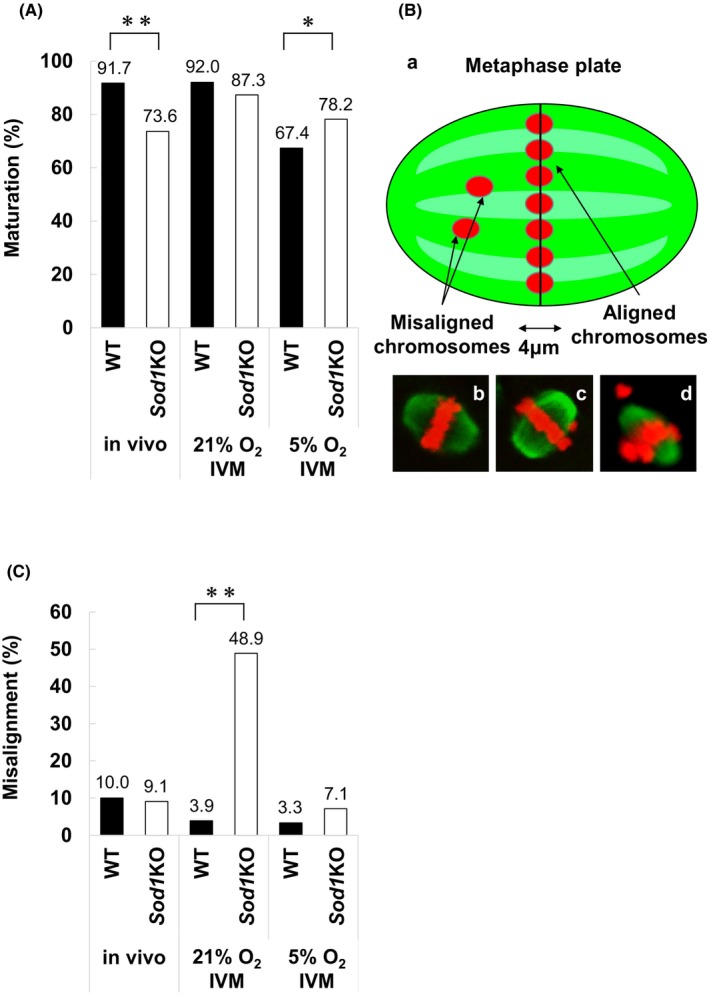
Evaluation of the rates of oocyte maturation, chromosome alignment, and staining intensity in M II oocytes matured from WT and Sod1KO mice. (A) Oocyte maturation rates in WT and Sod1KO. Oocyte maturation was defined as the polar body I emission. The figure shows the maturation rates of in vivo and in vitro matured (21% O2 and 5% O2) oocytes. The asterisk indicates a statistically significant difference (**: p < 0.01, *: p < 0.05; chi‐squared test). Number of oocytes: In vivo WT = 121, in vivo Sod1KO = 144, 21% O2 IVM WT = 138, 21% O2 IVM Sod1KO = 134, 5% O2 IVM WT = 193, 5% O2 IVM Sod1KO = 156. (B) Evaluation of and representative images of chromosome alignment of M II stage oocytes. a: A method for the evaluation of chromosome alignment. The area within 4 μm from the center of the spindle, including the chromosome alignment, was defined as the metaphase plate. The chromosome alignment was considered to be normal if all chromosomes were aligned within the metaphase plate. If most of the chromosomes aligned within the metaphase plate, but one or two chromosomes were located far from the metaphase plate, they were classified as mildly misaligned. If three or more chromosomes were out of the metaphase plate, they were classified as severe misaligned. b: Representative image of normal chromosome alignment. c: Representative image of chromosome misalignment (Mild). d: Representative image of chromosome misalignment (Severe). (C) Chromosome alignment in M II stage oocytes from WT and Sod1KO. The figure shows chromosome misalignment rates of in vivo matured and in vitro matured (21% O2 and 5% O2) M II stage oocytes from WT and Sod1KO. The double‐asterisk indicates a statistically significant difference (p < 0.01; Fisher's exact test). Number of oocytes: In vivo WT = 20, in vivo Sod1KO = 22, 21% O2 IVM WT = 51, 21% O2 IVM Sod1KO = 47, 5% O2 IVM WT = 30, 5% O2 IVM Sod1KO = 28.
3.2. Sod1 deficiency during IVM increases the frequency of chromosome segregation errors
To investigate the effect of endogenous oxidative stress on oocyte chromosome segregation errors during oocyte maturation, M II oocytes from WT and Sod1KO mice were matured in vivo or in vitro (21% O2, 5% O2), and the rate of chromosome segregation errors and pattern were evaluated. The rate of 20 chromosomes in vivo and in 5% O2 IVM was not significantly different between the two genotypes (Figure 2). In contrast, the rate of 20 chromosomes in 21% O2 IVM was significantly lower in the case of the Sod1KO mice than in the WT mice (p < 0.05). There was no difference in the rate of ≤19 chromosomes in each experiment between the two genotypes in vivo and in 21% O2 IVM. In contrast, the rate of ≤19 chromosomes in 5% O2 IVM was significantly higher in the case of the Sod1KO mice than that in the WT mice (p < 0.05). There was no difference in the rate of 21 ≤ chromosome in each experiment between the two genotypes. There was no difference in the rate of PSSC in each experiment between the two genotypes in vivo and in 21% O2 IVM. In contrast, the rate of PSSC in 5% O2 IVM was significantly higher in the case of the WT mice than that in the Sod1KO mice (p < 0.05).
FIGURE 2.
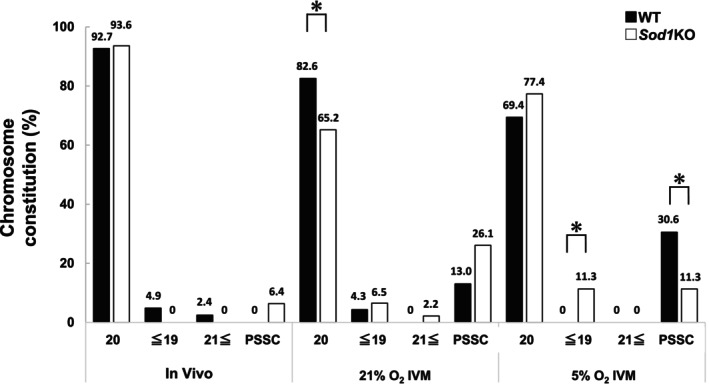
Evaluation of the rate of and pattern for chromosome segregation errors of M II oocytes from WT and Sod1KO mice. The figure shows the rate of chromosome segregation errors in vivo matured and in vitro matured (21% O2 and 5% O2) M II oocytes from WT and Sod1KO. An asterisk indicates a statistically significant difference (p < 0.05; Fisher's exact test). Number of oocytes: In vivo WT = 41, in vivo Sod1KO = 47, 21% O2 IVM WT = 46, 21% O2 IVM Sod1KO = 46, 5% O2 IVM WT = 36, 5% O2 IVM Sod1KO = 53.
3.3. Sod1 deficiency during IVM accelerates the progress of meiosis
To evaluate the rate of meiotic progression in 21% O2 IVM, oocytes were fixed at 2 h intervals from 0 to 18 h. The rate of GV oocytes at 2 and 4 h was significantly lower in the Sod1KO mice than those in the WT mice (Figure 3A; p < 0.01). The rate of formation of M I oocytes was significantly higher at 4 and 18 h but significantly lower at 8 and 10 h in the Sod1KO mice , as compared with those in the WT mice (Figure 3B; p < 0.01). The peak M I stage was 8 h in WT mice, whereas in the Sod1KO mice, it was 6 h. Furthermore, the rate of M II oocytes was significantly higher at 10 and 12 h but significantly lower at 18 h in the Sod1KO mice, compared with those in the WT mice (Figure 3C). Although not statistically significant, the time required for the transition from M I to A I‐T I stage appeared to be shorter in the case of Sod1KO mice compared with those in the WT mice (Figure S2; WT:Sod1KO = 4.0 h:1.7 h).
FIGURE 3.
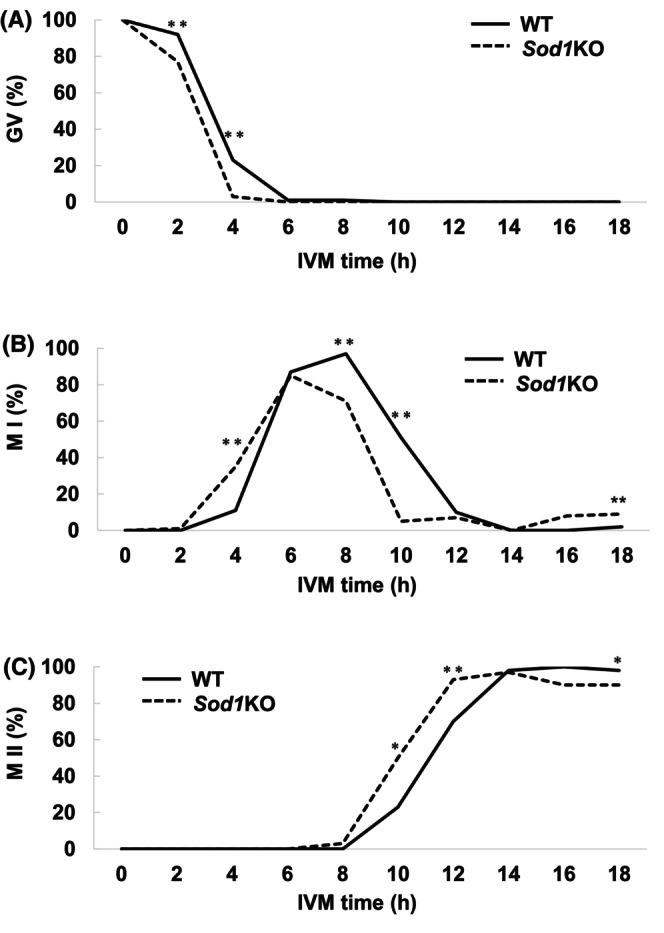
Evaluation of meiotic progression in 21% O2 IVM of oocytes from WT and Sod1KO mice. Oocytes were collected at 0, 2, 4, 6, 8, 10, 12, 14, 16 and 18 h. (A) The rate of GV stage oocytes. (B) The rate of M I stage oocytes. (C) The rate of M II stage oocytes. The asterisks indicate a statistically significant difference (**: p < 0.01, *: p < 0.05; Fisher's exact test). Number of oocytes: WT 0 h = 94, WT 2 h = 92, WT 4 h = 108, WT 6 h = 92, WT 8 h = 108, WT 10 h = 39, WT 12 h = 40, WT 14 h = 43, WT 16 h = 41, WT 18 h = 123, Sod1KO 0 h = 99, Sod1KO 2 h = 82, Sod1KO 4 h = 101, Sod1KO 6 h = 54, Sod1KO 8 h = 94, Sod1KO 10 h = 40, Sod1KO 12 h = 41, Sod1KO 14 h = 39, Sod1KO 16 h = 40, Sod1KO 18 h = 109.
3.4. Sod1 deficiency during IVM decreases kinetochore localization of BUBR1 at the M I stage
To determine the cause of the higher chromosome segregation error rate of Sod1KO oocytes in 21% O2 IVM, the localization of the BUBR1 protein in WT and Sod1KO oocytes was investigated. Signals for BUBR1 were detected in the cytoplasm at all stages of the oocyte and were also observed on the spindle and the kinetochore after the GVBD stage (Figure 4A). Next, the expression levels of the BUBR1 protein in oocytes from both genotypes were evaluated. The expression of BUBR1 was lowest at 0 h of IVM in oocytes from both genotypes and then increased with the progression of meiosis, reaching a peak at 6–8 h. Thereafter, the expression of BUBR1 decreased until 18 h. Although there was no significant difference between the two genotypes, the peak for the expression level of BUBR1 appeared to be accelerated by approximately 2 h in Sod1KO oocytes, probably due to the progress of meiosis (Figure 4B,C).
FIGURE 4.
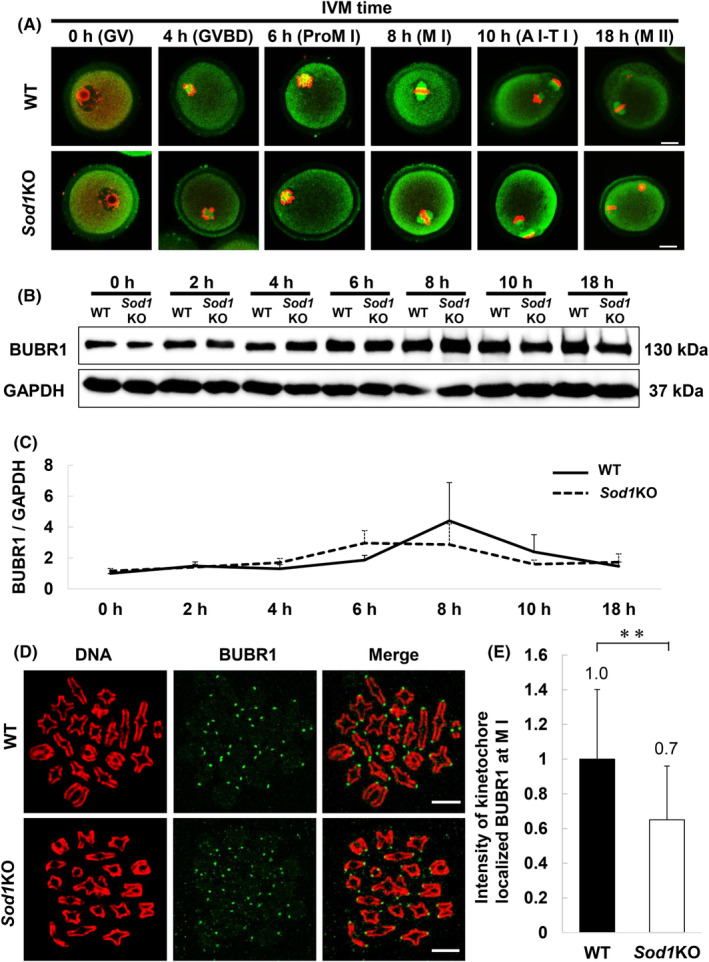
Expression dynamics of the BUBR1 protein in oocytes during IVM. (A) Representative images of BUBR1 localization in WT and Sod1KO oocytes during meiosis. Oocytes were collected at 0, 4, 6, 8, 10 and 18 h. Confocal microscopy shows the immunostaining of BUBR1 (green) and DNA (red) in oocytes. The scale bar represents 20 μm. (B, C) Expression levels of BUBR1 in WT and Sod1KO oocytes during meiosis. The molecular mass of BUBR1 is 130 kDa, and that of GAPDH is 37 kDa. GAPDH as a loading control. Oocytes were collected at 0, 2, 4, 6, 8, 10 and 18 h. Values obtained for the WT at 0 h were set as 1, and data are expressed as the mean ± standard error (SE). At least experiments were performed in triplicate (n = 60 oocytes/lane). Statistical analysis was performed using Welch's t‐test. (D) Representative images of BUBR1 localization on M I stage chromosomes from WT and Sod1KO oocytes. Oocytes were collected at 5–6 h, corresponding to the M I stage. Confocal microscopy showing immunostaining of BUBR1 (green) and DNA (red) in oocytes. The scale bar represents 10 μm. (E) The fluorescence intensity of kinetochore localized BUBR1 at M I stage from WT and Sod1KO oocytes. Data are expressed as the mean ± standard deviation (SD). Number of kinetochores analyzed: WT = 595/600, Sod1KO = 595/600 (Number of oocytes: WT = 15, Sod1KO = 15). All possible kinetochores were measured. The double‐asterisk indicates a statistically significant difference (p < 0.01; Welch's t‐test).
In subsequent experiments, the localization of BUBR1 expression on chromosomes was analyzed. BUBR1 was localized on the kinetochore in both genotypes at the M I stage (Figure 4D). The fluorescence intensity of BUBR1 at the M I stage was significantly lower in the Sod1KO oocytes than that in the WT oocytes (Figure 4E; p < 0.01).
3.5. Sod1 deficiency during IVM increases the kinetochore distance at the M II stage
The BUBR1 protein was also localized on the kinetochore in both genotypes at the M II stage (Figure 5A). No significant differences in the intensity of the kinetochore localized BUBR1 fluorescence were observed between the two genotypes (Figure 5B). On the other hand, the sister kinetochore distance, measured based on kinetochore localized BUBR1 signals, was significantly higher in the Sod1KO oocytes than those in the WT oocytes (Figure 5C; p < 0.01).
FIGURE 5.
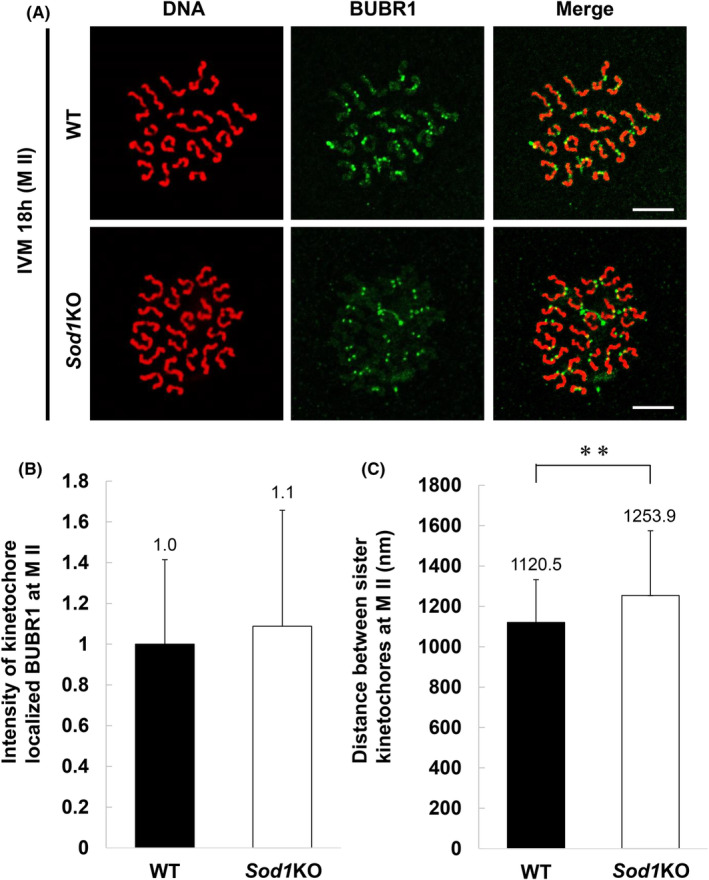
Localization of the BUBR1 protein and sister kinetochore distance at M II stage oocytes matured in vitro. (A) Representative images of BUBR1 localization on M II stage chromosomes from WT and Sod1KO oocytes. Oocytes were collected at 18 h, corresponding to the M II stage. Confocal microscopy showing immunostaining of BUBR1 (green) and DNA (red) in oocytes. The scale bar represents 10 μm. (B) The fluorescence intensity of kinetochore localized BUBR1 at M II stage from WT and Sod1KO oocytes. Data are expressed as the mean ± SD. Number of kinetochores analyzed: WT = 168/200, Sod1KO = 332/400 (Number of oocytes: WT = 5, Sod1KO = 10). All measurable kinetochores were measured. Statistical analysis was performed using Welch's t‐test. (C) Sister kinetochore distance on M II stage chromosomes from WT and Sod1KO oocytes. Data are expressed as mean ± SD. Number of kinetochores analyzed: WT = 84/100, Sod1KO = 166/200 (Number of oocytes: WT = 5, Sod1KO = 10). All measurable sister kinetochore distances were measured. The double‐asterisk indicates a statistically significant difference (p < 0.01; Welch's t‐test).
3.6. Sod1 deficiency during IVM has no significant effect on REC8 expression dynamics
To determine the cause of the higher chromosome segregation error rate of Sod1KO oocytes in 21% O2 IVM, the expression levels of the REC8 protein in WT and Sod1KO oocytes were evaluated. There were no significant genotype‐based differences in the expression of REC8 at the M I stage (Figure 6A,B). The expression levels of REC8 on chromosomes were next evaluated. Signals corresponding to REC8 were detected on chromosome arms and centromeres of each oocyte genotype at the M I stage, but there was no significant difference in their signal intensity between the two genotypes (Figure 6C).
FIGURE 6.
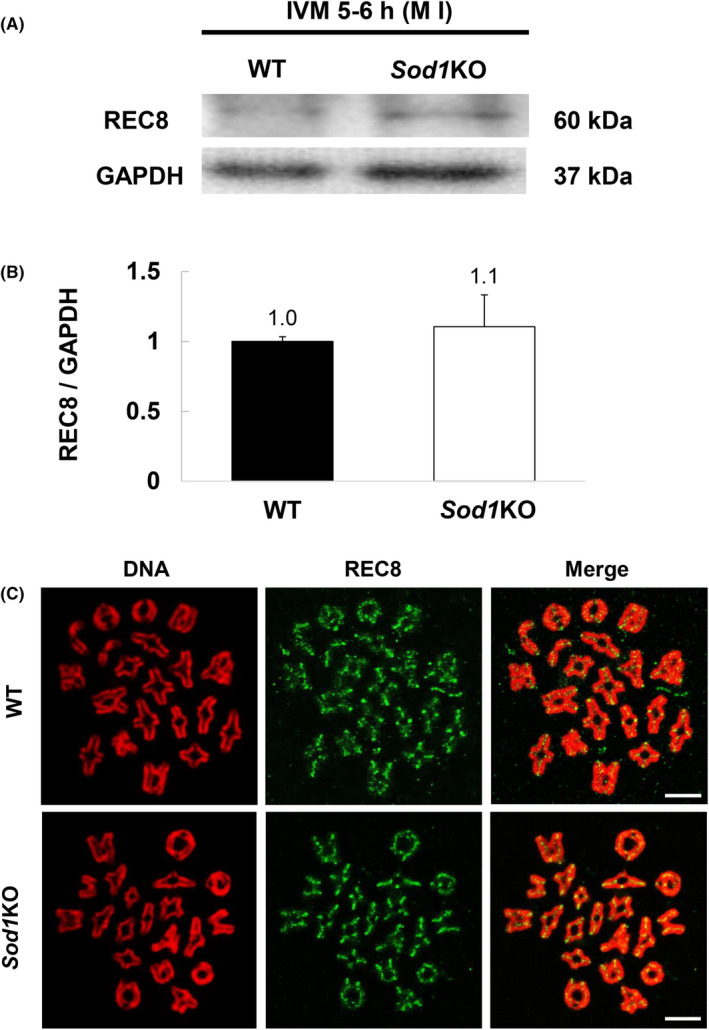
Expression of REC8 protein in M I stage oocytes that had been matured in vitro. (A, B) Expression of REC8 in M I stage oocytes from WT and Sod1KO. The molecular mass of REC8 is 60 kDa, and that of GAPDH is 37 kDa. GAPDH as a loading control. Values obtained for the WT were set as 1, and the data are expressed as the mean ± SE. Experiments were performed in triplicate (n = 60 oocytes/lane). Statistical analysis was performed using Welch's t‐test. (C) Representative images of REC8 localization on M I stage chromosomes from WT and Sod1KO oocytes. Oocytes were collected at 5–6 h, corresponding to the M I stage. Confocal microscopy showing immunostaining of REC8 (green) and DNA (red) in oocytes. The scale bar represents 10 μm.
3.7. The addition of 500 μM AsA or 500 μM NAC to the IVM medium reduces the rate of chromosome segregation errors in Sod1KO oocytes
Finally, we investigated the issue of whether the higher rate of chromosome segregation errors of the Sod1KO M II oocytes in 21% O2 IVM could be suppressed by adding antioxidants to the culture medium. The rate of oocyte maturation was significantly increased by treatment with 500 μM AsA or 500 μM NAC as compared with controls (Figure 7A; p < 0.05).
FIGURE 7.
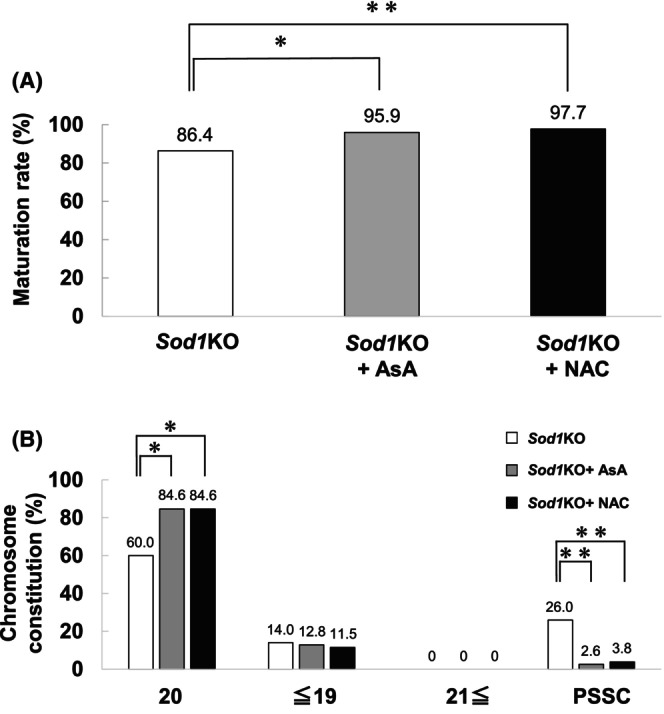
Effect of 500 μM L‐ascorbic acid (AsA) or 500 μM N‐acetyl‐L‐cysteine (NAC) on oocyte maturation and the rate of chromosome segregation errors in vitro matured (21% O2) M II oocytes from Sod1KO. (A) The figure shows the rates of oocyte maturation. Oocyte maturation was defined as the polar body I emission. Number of oocytes: Sod1KO = 50, Sod1KO + AsA = 39, Sod1KO + NAC = 52. The asterisks indicate a statistically significant difference (**: p < 0.01, *: p < 0.05; Fisher's exact test with Bonferroni correction). (B) The figure shows the rate of chromosome segregation errors of the M II oocytes. Number of oocytes: Sod1KO = 50, Sod1KO + AsA = 39, Sod1KO + NAC = 52. The asterisks indicate a statistically significant difference (**: p < 0.01, *: p < 0.05; Fisher's exact test with Bonferroni correction).
In addition, the rate of 20 chromosomes in Sod1KO M II oocytes was significantly increased by AsA or NAC treatment compared with controls (Figure 7B; p < 0.05). The rates of oocytes with ≤19 or ≥21 chromosomes were not significantly different among the three groups. However, the rate of PSSC was significantly lower in AsA or NAC treatment compared with controls (Figure 7B; p < 0.01).
4. DISCUSSION
The findings reported herein indicate that: (1) In 21% O2 IVM, chromosome misalignment and chromosome segregation errors were significantly increased in Sod1KO M II oocytes compared to WT M II oocytes. (2) In 21% O2 IVM, Sod1KO oocytes accelerated the progression through first meiotic division and oocytes significantly decreased the localization of BUBR1 on the kinetochore at the M I stage, as compared to WT oocytes. (3) In 21% O2 IVM, the sister kinetochore distances at the M II stage were significantly increased in the Sod1KO oocytes compared to WT oocytes. (4) In 21% O2 IVM, no difference in the expression level of REC8 at the M II stage between the two genotypes was found. (5) In 21% O2 IVM, the additions of AsA or NAC to the IVM medium reduced chromosome segregation errors in Sod1KO M II oocytes.
In this study, we compared the effects of Sod1 deficiency on oocyte maturation capacity in vivo and under different oxygen concentrations during IVM. The results showed that maturation rates in vivo were significantly lower in Sod1KO mice compared with WT mice (Figure 1A), suggesting that Sod1 deficiency may impair oocyte maturation capacity. In contrast, WT oocytes matured under 5% O2 IVM showed significantly lower maturation rates than those matured in vivo or in 21% O2 IVM. Previous studies have examined the impact of oxygen concentration during IVM; for example, Tkachenko et al. demonstrated that 20% O2 IVM significantly improved maturation rates in marmoset oocytes compared to 8% O2 IVM, 41 while Banwell et al. observed a trend toward lower maturation rates in mouse oocytes cultured in 5% O₂ IVM compared to 20% O2 IVM, though without statistical significance. 42 In preovulatory follicles, the LH surge induces genes linked to inflammation, increasing ROS during the inflammatory response. 43 Additionally, enhanced steroidogenesis in growing follicles upregulates P450 enzymes, which promote ROS production. 44 Therefore, a heightened oxidative stress state appears necessary for ovulation. in vivo, vascularization maintains an optimal redox balance; however, in 5% O2 IVM, the lack of vascular support might create hypoxia, potentially resulting in insufficient oxidative stress stimuli for maturation and leading to decreased maturation rates.
The rate of chromosome misalignment and chromosome segregation errors were both lower in vivo matured M II oocytes from the two genotypes, whereas in 21% O2 IVM, these values were significantly increased in Sod1KO oocytes compared to those in WT oocytes (Figures 1C and 2). Oxidative stress on oocytes is lower in 5% O2 IVM compared to in 20% O2 IVM. 45 In fact, the level of superoxide in the Sod1KO oocyte cytoplasm was significantly higher in 21% O2 IVM than that of the WT oocyte cytoplasm (Figure S1). These results clearly indicate that the intrinsic oxidative stress caused by Sod1 deficiency during oocyte maturation induces abnormal meiotic chromosome segregation and also suggest that the alignment of M II stage chromosomes could be an indicator linked to chromosome segregation errors of oocytes, as was reported in a previous study. 46 In 21% O₂ IVM, there was no significant difference in the maturation rate between Sod1 KO and WT oocytes (Figure 1A); however, marked differences were observed in chromosome misalignment (Figure 1C) and segregation errors (Figure 2). While first polar body extrusion (PBE) serves as a key indicator of oocyte maturation, it does not guarantee accurate chromosome segregation. For example, in aged oocytes, PBE rates may appear normal, yet chromosome segregation errors occur more frequently, leading to a higher incidence of aneuploidy. In the study by Suebthawinkul et al., no significant difference was observed in PBE rates between young and aged mouse oocytes during in vitro maturation (IVM); however, M II oocytes derived from aged mice exhibited a significant decrease in chromosomal euploidy. 47 In 5% O₂ IVM, no significance was found in the rate of chromosome misalignment and normal chromosome segregation between the two genotypes (Figures 1C and 2). However, WT oocytes showed a higher rate of PSSC compared to Sod1KO oocytes (Figure 2). Therefore, while the imbalance between ROS and antioxidants can cause oxidative damage, the physiological levels of ROS would be expected to be essential for oocyte maturation, ovulation, and early embryonic growth, where they act as signaling molecules. 48 Hypoxic cultures are suitable for oocytes with reduced antioxidant capacity but may not be ideal for use in conjunction with oocytes with standard antioxidant capacity. Whitty et al. suggested that oocyte developmental competence is negatively impacted following IVM in low oxygen when glucose availability is limited. 2 It will be necessary to consider the physical culture conditions such as oxygen concentration and each component of the medium that are commensurate with the quality and characteristics of oocytes, if valid is to be obtained.
To clarify the mechanism responsible for this increased chromosome segregation errors observed in Sod1KO oocytes, the progress of meiosis at each maturation time was analyzed. This is because the SAC regulates the timing of chromosome segregation in oocytes, and the loss of SAC function could contribute to the increased rate of chromosome misalignment and chromosome segregation errors with accelerated meiosis. 27 , 28 , 29 Sod1KO oocytes showed an earlier termination of the GV stage and an accelerated rate of reaching the M I and M II stages compared to the WT oocytes (Figures 3 and S2). These results indicate that intrinsic oxidative stress that occurs during oocyte maturation accelerates the progression of the first meiotic division, suggesting that SAC function may be abnormal. An accelerated first meiotic division and reduced SAC integrity were observed in aged oocytes. 49 , 50 Thus, these abnormalities in aged oocytes may also be due to intrinsic oxidative stress. In addition, the decreased expression of BUBR1 accelerates GVBD, 29 , 51 suggesting that SAC may be involved in the regulation of GVBD in addition to the regulation of anaphase entry timing.
We then analyzed the expression of BUBR1. No significant differences were observed between the two genotypes in the localization and expression level of BUBR1 in oocytes at each meiotic stage (Figure 4A–C). However, the signal intensity of BUBR1 that was localized to the kinetochore at the M I stage was significantly reduced in the case of the Sod1KO oocytes compared to WT oocytes (Figure 4D,E). These results suggest the possibility that the decreasing recruitment of BUBR1 to kinetochores at the M I stage by intrinsic oxidative stress during oocyte maturation reduces the function of the spindle assembly checkpoint, thereby inducing chromosome segregation errors. Compared to young oocytes, the amount of BUBR1 recruited to the kinetochore at the M I stage is reduced in aged oocytes. 52 Our results support the hypothesis that the chromosome segregation abnormalities observed in aged oocytes are caused by increased oxidative stress.
In Sod1KO oocytes, the chromosome segregation error patterns appeared to be mainly due to PSSC, and in fact, the sister kinetochore distance at the M II stage was significantly increased (Figure 5C). The PSSC phenotype is often observed in aneuploidy in aged oocytes, 53 and a decreased expression of the cohesin protein REC8 has been reported to cause this. 37 For the termination of the first meiotic division, phosphorylated REC8 is cleaved by separase, whereas phosphorylated REC8 at centromeres is retained until the anaphase II stage. 54 Therefore, REC8 is localized on only centromeres at the M II stage. In addition, in oocytes with reduced the persistence of REC8 levels, the distance between sister kinetochores at the M II stage increases. 38 Furthermore, oxidative stress from a Sod1 deficiency in midprophase drosophila oocytes induces the premature loss of cohesion and chromosome segregation errors. 23 In the present study, we evaluated the levels of expression of REC8 in oocytes from Sod1KO mice based on the hypothesis that the increased chromosome segregation errors observed in Sod1KO oocytes might be due to the loss of cohesion. Contrary to our expectations, no significant differences between the two genotypes were found in the chromosomal localization of REC8 or its expression levels in oocytes (Figure 6). In addition, the rate of PSSC at the M I stage was not significantly different between the two genotypes (WT:Sod1KO = 2/595:1/595; Table S2). These results suggest that increased oxidative stress due to a Sod1 deficiency does not significantly affect the persistence of REC8 in oocytes. The decreased density of centromeres observed in Sod1KO oocytes may not be due to a decrease in REC8 levels but instead could occur through other pathways. Other studies have shown a correlation between a reduced kinetochore localization of SAC proteins BUB1 and BUBR1 and reduced centromere cohesion. 52 There is no substantial evidence to show that SAC proteins regulate centromere cohesion in Sod1KO oocytes, but further analyses of these relationships would be required.
Finally, the IVM in the presence of 500 μM AsA or 500 μM NAC reduced chromosome segregation errors in the case of Sod1KO oocytes (Figure 7). AsA can directly scavenge superoxide molecules and reduce H2O2 to H2O via the ascorbate peroxidase reaction. 55 Ishii et al. reported that 2‐cell embryos derived from Sod1KO oocytes that had been fertilized with WT sperm in vitro developed to the 4‐cell stage on supplementation with AsA. 56 Our results suggest that AsA may also be effective in rescuing meiotic abnormalities associated with a Sod1 deficiency. The rate constants for the reactions of NAC with superoxide are relatively low under physiological conditions. 57 Thus, we initially expected that the addition of NAC would not have a measurably effect on the high rate of chromosome segregation errors of Sod1KO oocytes in IVM. However, we observed that both AsA and NAC improved the higher rate of chromosome segregation errors of Sod1KO oocytes. Interestingly, the rate for ≤19 chromosomes and below was not significantly different among the three groups, but the rate of PSSC was significantly lower in the case of AsA and NAC compared to the Control (Figure 7B). This result suggests that the reduction of oxidative stress during oocyte maturation suppresses chromosome segregation errors. We also as a preliminary examined the effects of glutathione ethyl ester (GSH‐Oet) and 2‐mercaptoethanol (β‐ME) on chromosome segregation errors rate accompany Sod1 deficiency, but more potent effects were not detected compared with AsA or NAC (data not shown).
In this study, Sod1 KO oocytes were cultured in a complex with cumulus cells. SOD1 expression in mammalian cumulus cells has been confirmed in several studies in human, 58 bovine, 22 and porcine. 59 Given that interaction with the cumulus cells is important for oocyte maturation, SOD1 expression in cumulus cells may contribute to oocyte quality. Therefore, a comprehensive analysis of SOD1 expression in mammals cumulus cells would be desirable. In 21% O2 IVM, a high rate of chromosome segregation errors was observed in Sod1 KO M II stage oocytes, but we have not yet determined how this abnormality affects fertilization and embryonic development.
To the best of our knowledge, this is the first report to examine the effects and molecular mechanisms of increased intrinsic oxidative stress caused by a Sod1 deficiency during oocyte maturation. Further studies modeled on Sod1KO oocytes would be useful in elucidating the molecular mechanisms that control the chromosome segregation errors induced by intrinsic oxidative stress. The relevance of the results obtained in this study to the aneuploidy of aged oocytes will need to be clarified in the future. It will help improve the culture system if in vitro matured oocytes could be obtained with a high developmental potential that could contribute to the rescue culture of low‐quality oocytes/embryos for livestock production, endangered and rare species animal preservation and human reproductive medicine.
FUNDING INFORMATION
This work was supported by Japan Society for the Promotion of Science KAKENHI Grant Numbers 21580342 and 24580405.
CONFLICT OF INTEREST STATEMENT
The authors have declared that there are no competing interests.
ETHICS STATEMENT
Animal experiments were performed by the Declaration of Helsinki under the protocol approved by the Animal Research Committee of Yamagata University.
HUMAN RIGHTS
This article does not contain any studies with human subjects performed by the any of the authors.
ANIMAL STUDIES
All institutional and national guidelines for the care and use of laboratory animals were followed.
Supporting information
Table S1.
Table S2.
Figure S1.
Figure S2.
ACKNOWLEDGMENTS
We wish to express our deepest gratitude to Dr. Jibak Lee for providing us with the anti‐REC8 antibody.
Nago M, Yanai M, Ishii M, Sato Y, Odajima K, Kimura N. Sod1 deficiency in mouse oocytes during in vitro maturation increases chromosome segregation errors with a reduced BUBR1 at kinetochore. Reprod Med Biol. 2025;24:e12622. 10.1002/rmb2.12622
REFERENCES
- 1. Robinson RS, Woad KJ, Hammond AJ, Laird M, Hunter MG, Mann GE. Angiogenesis and vascular function in the ovary. Reproduction. 2009;138(6):869–881. [DOI] [PubMed] [Google Scholar]
- 2. Whitty A, Kind KL, Dunning KR, Thompson JG. Effect of oxygen and glucose availability during in vitro maturation of bovine oocytes on development and gene expression. J Assist Reprod Genet. 2021;38(6):1349–1362. [DOI] [PMC free article] [PubMed] [Google Scholar]
- 3. Ray PD, Huang BW, Tsuji Y. Reactive oxygen species (ROS) homeostasis and redox regulation in cellular signaling. Cell Signal. 2012;24(5):981–990. [DOI] [PMC free article] [PubMed] [Google Scholar]
- 4. Juan CA, Pérez de la Lastra JM, Plou FJ, Pérez‐Lebeña E. The chemistry of reactive oxygen species (ROS) revisited: outlining their role in biological macromolecules (DNA, lipids and proteins) and induced pathologies. Int J Mol Sci. 2021;22(9):4642. [DOI] [PMC free article] [PubMed] [Google Scholar]
- 5. Zhang X, Wu XQ, Lu S, Guo YL, Ma X. Deficit of mitochondria‐derived ATP during oxidative stress impairs mouse MII oocyte spindles. Cell Res. 2006;16(10):841–850. [DOI] [PubMed] [Google Scholar]
- 6. Khan A, Khan MZ, Dou J, Xu H, Liu L, Zhu H, et al. SOD1 gene silencing promotes apoptosis and suppresses proliferation of heat‐stressed bovine granulosa cells via induction of oxidative stress. Vet Sci. 2021;8(12):326. [DOI] [PMC free article] [PubMed] [Google Scholar]
- 7. Liu L, Trimarchi JR, Keefe DL. Involvement of mitochondria in oxidative stress‐induced cell death in mouse zygotes. Biol Reprod. 2000;62(6):1745–1753. [DOI] [PubMed] [Google Scholar]
- 8. Zhang M, Lu Y, Chen Y, Zhang Y, Xiong B. Insufficiency of melatonin in follicular fluid is a reversible cause for advanced maternal age‐related aneuploidy in oocytes. Redox Biol. 2020;28:101327. [DOI] [PMC free article] [PubMed] [Google Scholar]
- 9. Fridovich I. Superoxide radical and superoxide dismutases. Annu Rev Biochem. 1995;64:97–112. [DOI] [PubMed] [Google Scholar]
- 10. Valentine JS, Doucette PA, Zittin PS. Copper‐zinc superoxide dismutase and amyotrophic lateral sclerosis. Annu Rev Biochem. 2005;74:563–593. [DOI] [PubMed] [Google Scholar]
- 11. Ho YS, Gargano M, Cao J, Bronson RT, Heimler I, Hutz RJ. Reduced fertility in female mice lacking copper‐zinc superoxide dismutase. J Biol Chem. 1998;273(13):7765–7769. [DOI] [PubMed] [Google Scholar]
- 12. Matzuk MM, Dionne L, Guo Q, Kumar TR, Lebovitz RM. Ovarian function in superoxide dismutase 1 and 2 knockout mice. Endocrinology. 1998;139(9):4008–4011. [DOI] [PubMed] [Google Scholar]
- 13. Noda Y, Ota K, Shirasawa T, Shimizu T. Copper/zinc superoxide dismutase insufficiency impairs progesterone secretion and fertility in female mice. Biol Reprod. 2012;86(1):1–8. [DOI] [PubMed] [Google Scholar]
- 14. Kimura N, Tsunoda S, Iuchi Y, Abe H, Totsukawa K, Fujii J. Intrinsic oxidative stress causes either 2‐cell arrest or cell death depending on developmental stage of the embryos from SOD1‐deficient mice. Mol Hum Reprod. 2010;16(7):441–451. [DOI] [PubMed] [Google Scholar]
- 15. Tripathi A, Khatun S, Pandey AN, Mishra SK, Chaube R, Shrivastav TG, et al. Intracellular levels of hydrogen peroxide and nitric oxide in oocytes at various stages of meiotic cell cycle and apoptosis. Free Radic Res. 2009;43(3):287–294. [DOI] [PubMed] [Google Scholar]
- 16. Sanfins A, Lee GY, Plancha CE, Overstrom EW, Albertini DF. Distinctions in meiotic spindle structure and assembly during in vitro and in vivo maturation of mouse oocytes. Biol Reprod. 2003;69(6):2059–2067. [DOI] [PubMed] [Google Scholar]
- 17. Khazaei M, Aghaz F. Reactive oxygen species generation and use of antioxidants during in vitro maturation of oocytes. Int J Fertil Steril. 2017;11(2):63–70. [DOI] [PMC free article] [PubMed] [Google Scholar]
- 18. Yamada‐Fukunaga T, Yamada M, Hamatani T, Chikazawa N, Ogawa S, Akutsu H, et al. Age‐associated telomere shortening in mouse oocytes. Reprod Biol Endocrinol. 2013;11:108. [DOI] [PMC free article] [PubMed] [Google Scholar]
- 19. Igarashi H, Takahashi T, Nagase S. Oocyte aging underlies female reproductive aging: biological mechanisms and therapeutic strategies. Reprod Med Biol. 2015;14(4):159–169. [DOI] [PMC free article] [PubMed] [Google Scholar]
- 20. Requena A, Bronet F, Guillén A, Agudo D, Bou C, García‐Velasco JA. The impact of in‐vitro maturation of oocytes on aneuploidy rate. Reprod Biomed Online. 2009;18(6):777–783. [DOI] [PubMed] [Google Scholar]
- 21. Muhammad T, Wan Y, Sha Q, Wang J, Huang T, Cao Y, et al. IGF2 improves the developmental competency and meiotic structure of oocytes from aged mice. Aging. 2020;13(2):2118–2134. [DOI] [PMC free article] [PubMed] [Google Scholar]
- 22. Combelles CM, Holick EA, Paolella LJ, Walker DC, Wu Q. Profiling of superoxide dismutase isoenzymes in compartments of the developing bovine antral follicles. Reproduction. 2010;139(5):871–881. [DOI] [PMC free article] [PubMed] [Google Scholar]
- 23. Perkins AT, Das TM, Panzera LC, Bickel SE. Oxidative stress in oocytes during midprophase induces premature loss of cohesion and chromosome segregation errors. Proc Natl Acad Sci USA. 2016;113(44):E6823–E6830. [DOI] [PMC free article] [PubMed] [Google Scholar]
- 24. Combelles CM, Gupta S, Agarwal A. Could oxidative stress influence the in‐vitro maturation of oocytes. Reprod Biomed Online. 2009;18(6):864–880. [DOI] [PMC free article] [PubMed] [Google Scholar]
- 25. Hassold T, Hall H, Hunt P. The origin of human aneuploidy: where we have been, where we are going. Hum Mol Genet. 2007;16:R203–R208. [DOI] [PubMed] [Google Scholar]
- 26. Wasielak‐Politowska M, Kordowitzki P. Chromosome segregation in the oocyte: what goes wrong during aging. Int J Mol Sci. 2022;23(5):2880. [DOI] [PMC free article] [PubMed] [Google Scholar]
- 27. Homer HA, McDougall A, Levasseur M, Yallop K, Murdoch AP, Herbert M. Mad2 prevents aneuploidy and premature proteolysis of cyclin B and securin during meiosis I in mouse oocytes. Genes Dev. 2005;19(2):202–207. [DOI] [PMC free article] [PubMed] [Google Scholar]
- 28. Li M, Li S, Yuan J, Wang ZB, Sun SC, Schatten H, et al. Bub3 is a spindle assembly checkpoint protein regulating chromosome segregation during mouse oocyte meiosis. PLoS One. 2009;4(11):e7701. [DOI] [PMC free article] [PubMed] [Google Scholar]
- 29. Wei L, Liang XW, Zhang QH, Li M, Yuan J, Li S, et al. BubR1 is a spindle assembly checkpoint protein regulating meiotic cell cycle progression of mouse oocyte. Cell Cycle. 2010;9(6):1112–1121. [DOI] [PubMed] [Google Scholar]
- 30. McGuinness BE, Anger M, Kouznetsova A, Gil‐Bernabé AM, Helmhart W, Kudo NR, et al. Regulation of APC/C activity in oocytes by a Bub1‐dependent spindle assembly checkpoint. Curr Biol. 2009;19(5):369–380. [DOI] [PubMed] [Google Scholar]
- 31. Vogt E, Kirsch‐Volders M, Parry J, Eichenlaub‐Ritter U. Spindle formation, chromosome segregation and the spindle checkpoint in mammalian oocytes and susceptibility to meiotic error. Mutat Res. 2008;651(1–2):14–29. [DOI] [PubMed] [Google Scholar]
- 32. Meraldi P, Draviam VM, Sorger PK. Timing and checkpoints in the regulation of mitotic progression. Dev Cell. 2004;7(1):45–60. [DOI] [PubMed] [Google Scholar]
- 33. Pan H, Ma P, Zhu W, Schultz RM. Age‐associated increase in aneuploidy and changes in gene expression in mouse eggs. Dev Biol. 2008;316(2):397–407. [DOI] [PMC free article] [PubMed] [Google Scholar]
- 34. Nasmyth K, Haering CH. Cohesin: its roles and mechanisms. Annu Rev Genet. 2009;43:525–558. [DOI] [PubMed] [Google Scholar]
- 35. Wassmann K. Separase control and cohesin cleavage in oocytes: should I stay or should I go. Cells. 2022;11(21):3399. [DOI] [PMC free article] [PubMed] [Google Scholar]
- 36. Lee J, Okada K, Ogushi S, Miyano T, Miyake M, Yamashita M. Loss of Rec8 from chromosome arm and centromere region is required for homologous chromosome separation and sister chromatid separation, respectively, in mammalian meiosis. Cell Cycle. 2006;5(13):1448–1455. [DOI] [PubMed] [Google Scholar]
- 37. Chiang T, Duncan FE, Schindler K, Schultz RM, Lampson MA. Evidence that weakened centromere cohesion is a leading cause of age‐related aneuploidy in oocytes. Curr Biol. 2010;20(17):1522–1528. [DOI] [PMC free article] [PubMed] [Google Scholar]
- 38. Chiang T, Schultz RM, Lampson MA. Age‐dependent susceptibility of chromosome cohesion to premature separase activation in mouse oocytes. Biol Reprod. 2011;85(6):1279–1283. [DOI] [PMC free article] [PubMed] [Google Scholar]
- 39. Iuchi Y, Okada F, Onuma K, Onoda T, Asao H, Kobayashi M, et al. Elevated oxidative stress in erythrocytes due to a SOD1 deficiency causes anaemia and triggers autoantibody production. Biochem J. 2007;402(2):219–227. [DOI] [PMC free article] [PubMed] [Google Scholar]
- 40. Kanda Y. Investigation of the freely available easy‐to‐use software ‘EZR’ for medical statistics. Bone Marrow Transplant. 2013;48(3):452–458. [DOI] [PMC free article] [PubMed] [Google Scholar]
- 41. Tkachenko OY, Delimitreva S, Wedi E, Scheerer‐Bernhard JU, Valle RR, Nayudu PL. Effects of oxygen concentration in IVM/IVF on marmoset monkey oocyte maturation and embryo development. Anim Reprod. 2017;14(4):1170–1178. [Google Scholar]
- 42. Banwell KM, Lane M, Russell DL, Kind KL, Thompson JG. Oxygen concentration during mouse oocyte in vitro maturation affects embryo and fetal development. Hum Reprod. 2007;22(10):2768–2775. [DOI] [PubMed] [Google Scholar]
- 43. Shkolnik K, Tadmor A, Ben‐Dor S, Nevo N, Galiani D, Dekel N. Reactive oxygen species are indispensable in ovulation. Proc Natl Acad Sci USA. 2011;108(4):1462–1467. [DOI] [PMC free article] [PubMed] [Google Scholar]
- 44. Hanukoglu I. Antioxidant protective mechanisms against reactive oxygen species (ROS) generated by mitochondrial P450 systems in steroidogenic cells. Drug Metab Rev. 2006;38(1–2):171–196. [DOI] [PubMed] [Google Scholar]
- 45. Hardy MLM, Day ML, Morris MB. Redox regulation and oxidative stress in mammalian oocytes and embryos developed in vivo and in vitro. Int J Environ Res Public Health. 2021;18(21):11374. [DOI] [PMC free article] [PubMed] [Google Scholar]
- 46. Cheng JM, Li J, Tang JX, Hao XX, Wang ZP, Sun TC, et al. Merotelic kinetochore attachment in oocyte meiosis II causes sister chromatids segregation errors in aged mice. Cell Cycle. 2017;16(15):1404–1413. [DOI] [PMC free article] [PubMed] [Google Scholar]
- 47. Suebthawinkul C, Babayev E, Lee HC, Duncan FE. Morphokinetic parameters of mouse oocyte meiotic maturation and cumulus expansion are not affected by reproductive age or ploidy status. J Assist Reprod Genet. 2023;40(5):1197–1213. [DOI] [PMC free article] [PubMed] [Google Scholar]
- 48. von Mengden L, Klamt F, Smitz J. Redox biology of human cumulus cells: basic concepts, impact on oocyte quality, and potential clinical use. Antioxid Redox Signal. 2020;32(8):522–535. [DOI] [PMC free article] [PubMed] [Google Scholar]
- 49. Koncicka M, Tetkova A, Jansova D, Del Llano E, Gahurova L, Kracmarova J, et al. Increased expression of maturation promoting factor components speeds up meiosis in oocytes from aged females. Int J Mol Sci. 2018;19(9):2841. [DOI] [PMC free article] [PubMed] [Google Scholar]
- 50. Blengini CS, Nguyen AL, Aboelenain M, Schindler K. Age‐dependent integrity of the meiotic spindle assembly checkpoint in females requires Aurora kinase B. Aging Cell. 2021;20(11):e13489. [DOI] [PMC free article] [PubMed] [Google Scholar]
- 51. Homer H, Gui L, Carroll J. A spindle assembly checkpoint protein functions in prophase I arrest and prometaphase progression. Science. 2009;326(5955):991–994. [DOI] [PMC free article] [PubMed] [Google Scholar]
- 52. Lagirand‐Cantaloube J, Ciabrini C, Charrasse S, Ferrieres A, Castro A, Anahory T, et al. Loss of centromere cohesion in aneuploid human oocytes correlates with decreased kinetochore localization of the sac proteins Bub1 and Bubr1. Sci Rep. 2017;7:44001. [DOI] [PMC free article] [PubMed] [Google Scholar]
- 53. Sakakibara Y, Hashimoto S, Nakaoka Y, Kouznetsova A, Höög C, Kitajima TS. Bivalent separation into univalents precedes age‐related meiosis I errors in oocytes. Nat Commun. 2015;6:7550. [DOI] [PMC free article] [PubMed] [Google Scholar]
- 54. Kudo NR, Wassmann K, Anger M, Schuh M, Wirth KG, Xu H, et al. Resolution of chiasmata in oocytes requires separase‐mediated proteolysis. Cell. 2006;126(1):135–146. [DOI] [PubMed] [Google Scholar]
- 55. Noctor G, Foyer CH. ASCORBATE AND GLUTATHIONE: keeping active oxygen under control. Annu Rev Plant Physiol Plant Mol Biol. 1998;49:249–279. [DOI] [PubMed] [Google Scholar]
- 56. Ishii N, Homma T, Lee J, Mitsuhashi H, Yamada KI, Kimura N, et al. Ascorbic acid and CoQ10 ameliorate the reproductive ability of superoxide dismutase 1‐deficient female mice. Biol Reprod. 2020;102(1):102–115. [DOI] [PubMed] [Google Scholar]
- 57. Pei Y, Liu H, Yang Y, Yang Y, Jiao Y, Tay FR, et al. Biological activities and potential Oral applications of N‐acetylcysteine: Progress and prospects. Oxid Med Cell Longev. 2018;2018:2835787. [DOI] [PMC free article] [PubMed] [Google Scholar]
- 58. Donabela FC, Meola J, Padovan CC, de Paz CC, Navarro PA. Higher SOD1 gene expression in cumulus cells from infertile women with moderate and severe endometriosis. Reprod Sci. 2015;22(11):1452–1460. [DOI] [PubMed] [Google Scholar]
- 59. Zhu T, Guan S, Lv D, Zhao M, Yan L, Shi L, et al. Melatonin modulates lipid metabolism in porcine cumulus‐oocyte complex via its receptors. Front Cell Dev Biol. 2021;9:648209. [DOI] [PMC free article] [PubMed] [Google Scholar]
Associated Data
This section collects any data citations, data availability statements, or supplementary materials included in this article.
Supplementary Materials
Table S1.
Table S2.
Figure S1.
Figure S2.