

Abstract
Current classification of chronic kidney disease (CKD) into stages using indirect systemic measures (estimated glomerular filtration rate (eGFR) and albuminuria) is agnostic to the heterogeneity of underlying molecular processes in the kidney thereby limiting precision medicine approaches. To generate a novel CKD categorization that directly reflects within kidney disease drivers we analyzed publicly available transcriptomic data from kidney biopsy tissue. A Self-Organizing Maps unsupervised artificial neural network machine-learning algorithm was used to stratify a total of 369 patients with CKD and 46 living kidney donors as healthy controls. Unbiased stratification of the discovery cohort resulted in identification of four novel molecular categories of disease termed CKD-Blue, CKD-Gold, CKD-Olive, CKD-Plum that were replicated in independent CKD and diabetic kidney disease datasets and can be further tested on any external data at kidneyclass. org. Each molecular category spanned across CKD stages and histopathological diagnoses and represented transcriptional activation of distinct biological pathways. Disease progression rates were highly significantly different between the molecular categories. CKD-Gold displayed rapid progression, with significant eGFR-adjusted Cox regression hazard ratio of 5.6 [1.01–31.3] for kidney failure and hazard ratio of 4.7 [1.3–16.5] for composite of kidney failure or a 40% or more eGFR decline. Urine proteomics revealed distinct patterns between the molecular categories, and a 25-protein signature was identified to distinguish CKD-Gold from other molecular categories. Thus, patient stratification based on kidney tissue omics offers a gateway to non-invasive biomarker-driven categorization and the potential for future clinical implementation, as a key step towards precision medicine in CKD.
Keywords: gene expression, kidney biopsy, machine learning, patient stratification, precision medicine, tissue transcriptomics
Lay Summary
A variety of biological and environmental factors lead to chronic kidney disease. Current disease-stage classifications are based on indirect measures of kidney function such as blood creatinine and albumin levels in urine. This study provides a new method for classifying kidney diseases, based on individual differences in molecular profiles of kidney biopsies, and novel insights into disease biology that could lead to personalized treatments.
Chronic kidney disease (CKD) is a global health burden affecting more than 850 million people worldwide,1 with a high cost of care and an increased incidence of morbidity and mortality.2,3 Biologically, CKD is a highly heterogeneous group of disorders characterized by sustained alterations in kidney structure and function arising from a wide range of etiologies and associated with a multitude of underlying molecular processes in the kidney.4 Even within the same diagnostic group, individual disease presentation, histopathologic features, progression rates, and treatment responses are variable, reflecting the underlying biological heterogeneity.
According to the KDIGO (Kidney Disease: Improving Global Outcomes) guidelines, CKD is classified into 5 stages (CKD 1–5), based on gradations of glomerular filtration rate estimated (eGFR) from serum creatinine level and degree of albuminuria.4 This classification system, now widely accepted, was a major achievement in the field, as it provided a common vocabulary and standardized approach for disease management.5–8 However, the classification relies on systemic, indirect measures and therefore is agnostic to the local kidney pathophysiology. As a result, biologically diverse cases presenting with the same GFR or albuminuria values are classified under the same CKD-stage category, thereby precluding personalized prognosis and treatment options.9 Thus, a novel molecular dimension to use to categorize CKD is needed urgently, to fuel diagnostic, prognostic, and therapeutic development toward precision medicine.10–12
Histopathologic assessment of kidney biopsies provides direct insights into the intrarenal state.13 However, also subject to heterogeneity, tissue morphologic features and molecular signatures can overlap among various histopathologic diagnoses.14 In contrast, using CKD kidney molecular profiles reflecting underlying disease biology for an unbiased reclassification, independent of clinical diagnosis, may circumvent the shortcomings of both GFR- and histopathology-based groupings.
The overarching goal of this study was to develop a biologically meaningful disease categorization based on individual kidney molecular characteristics, as a critical step toward developing personalized treatment approaches for CKD. Individual transcriptomics profiles from kidney biopsies were used to group patients in an unbiased, data-driven manner, leveraging an extensive collection of kidney transcriptomics data across diverse CKD patient cohorts from North America and Europe. These data encompass a broad range of kidney function and a wide spectrum of etiologies, including diabetic kidney disease (DKD). Focusing on the tubulointerstitial compartment—the most abundantly available tissue fraction in kidney biopsies, closely linked to long-term outcomes of CKD15—an unsupervised artificial neural network machine-learning algorithm called Self-Organizing Maps (SOM)16,17 was used to reveal inherent, molecularly aligned, patient subgroups. The SOM methodology was chosen due to its intuitively understandable visualizations and straightforward framework for external data validation, which enable rapid generalizability and scaling up to broader patient populations. Each patient subgroup subsequently was characterized according to differentiating gene expression patterns and biological pathway enrichment. The clinical relevance of such categorization was substantiated by assessing its association with disease progression rates and outcomes, as well as urinary proteomics profiles and kidney histopathology.
To make the results easily accessible, we developed a web-based application (kidneyclass.org), and we encourage investigators to explore the stratification approach and test predictions in external data.
METHODS
Study cohorts and data
Publicly available kidney tubulointerstitial transcriptomics data for 314 CKD patients from 3 cohorts, 55 DKD patients, and 46 living kidney donors as healthy controls were analyzed. Consent was obtained from individual patients at enrollment, and the studies were approved by the institutional review boards of participating institutions.
The European Renal cDNA Bank (ERCB) is a European multicenter CKD study established to collect kidney biopsy tissue for gene expression analysis at the time of a clinically indicated biopsy.18 Affymetrix U133 array data were available for 165 participants (GSE104954).
NEPTUNE (Nephrotic Syndrome Study Network) is a multicenter, prospective study of children and adults with nephrotic-range proteinuria (>500 mg/d), recruited at the time of first clinically indicated baseline kidney biopsy.19 Affymetrix Human Gene 2.1 ST Array data from 107 adult NEPTUNE participants were included in the analysis (GSE108112), with longitudinal clinical data and quantitative histopathologic data available for 90 participants.
C-PROBE (Clinical Phenotyping Resource and Biobank Core) is a multicenter longitudinal observational CKD cohort.20 Affymetrix Human Genome U133 Plus 2.0 Array data and longitudinal clinical data were available for 42 patients (GSE69438). SomaLogic SOMAscan affinity-based aptamer proteomics21 data for 1300 proteins measured in urine were available for 38 patients.
DKD transcriptomics data were included from GSE30122 (N = 10, microarray), GSE142025 (N = 26, RNA-seq), and Levin et al.22 (N = 19, RNA-seq).
SOM algorithm implementation
All analyses and visualizations were run using R version 4.2.1 (R Foundation). SOM functions implemented in the packages kohonen,16 popsom, and oposSOM23 were used. Briefly, after filtering out uninformative low-variance features, the resulting 8454 gene expression variables were centered and scaled and were input to an 8 × 8 SOM map with hexagonal topology. Ward’s hierarchical clustering of the SOM codebook vectors was used to isolate units with similar profiles. The optimal number of clusters was guided by the “elbow method.” For validation analyses, new transcriptomics data for the same genes were scaled using the discovery cohort scaling parameters and were presented to the trained SOM. The primary analysis code can be accessed at https://github.com/AstraZeneca/CKD_molecular_stratification.
Model parameters optimization (see Supplementary Figures S1–S3 for diagnostic plots) and the downstream analyses are presented in detail in the Supplementary Methods.
RESULTS
CKD patient population map reveals inherent segmentation
A total of 415 individuals, including patients with CKD, patients with DKD, and healthy controls, with available genome-wide transcriptomics data from kidney biopsy tubulointerstitial fraction, were included in this study. Baseline (at kidney biopsy) clinical characteristics of the CKD participants from the ERCB,24 C-PROBE,20 and NEPTUNE25 cohorts are summarized in Table 1. Based on the largest sample size, as well as the broadest range of kidney function and spectrum of histopathologic diagnoses, the ERCB dataset was selected as the discovery dataset, to maximize the pattern detection potential in the data. The independent datasets from the C-PROBE and NEPTUNE cohorts, contributing complementary eGFR ranges and etiologies, and external data from 55 DKD subjects, were then used for validation.
Table 1|.
Patient clinical characteristics at kidney biopsy for discovery and validation cohorts
| Parameter | ERCBa | C-PROBEb,c | NEPTUNEb,c | Living donorsd |
|---|---|---|---|---|
|
| ||||
| N | 165 | 42 | 107 | 46 |
| Age, yr | 47 ± 18 | 40 ± 16 | 48 ± 16 | 48 ± 12 |
| % Male | 56 | 38 | 65 | 50 |
| eGFR, ml/min per 1.73 m2 | 66 ± 37 | 74 ± 41 | 74 ± 32 | 104 ± 30 |
| Proteinuria, g per 24 h | 3.1 [0.7–4.2] | 5.9 [5.1–6.5] | 3.5 [1.6–6.95] | |
|
| ||||
| Histopathologic diagnosis | ||||
|
| ||||
| DN | 17 (10) | 1 (2) | NA | |
| FSGS | 13 (8) | 11 (26) | 46 (43) | |
| HTN | 20 (12) | 1 (2) | NA | |
| IgAN | 25 (15) | 1 (2) | NA | |
| MGN | 18 (11) | 2 (5) | 43 (40) | |
| MCD | 13 (8) | 1 (2) | 18 (17) | |
| RPGN | 21 (13) | 2 (5) | NA | |
| LN | 32 (19) | 16 (38) | NA | |
| TMD | 6 (4) | NA | NA | |
| Other | NA | 7 (17) | NA | |
C-PROBE, Clinical Phenotyping Resource and Biobank Core; DN, diabetic nephropathy; eGFR, estimated glomerular filtration rate; ERCB, European Renal cDNA Bank; FSGS, focal segmental glomerulosclerosis; HTN, hypertensive nephrosclerosis; IgAN, IgA nephropathy; LN, lupus nephritis; MCD, minimal change disease; MGN, membranous glomerulonephritis; NA, not applicable; NEPTUNE, Nephrotic Syndrome Study Network; RPGN, rapidly progressive glomerulonephritis; TMD, thin basement membrane disease.
Quantitative variables are presented as means ± SD or medians (interquartile range).
Other values are n (%).
Discovery cohort.
Validation cohort.
Outcome association cohort.
Control group for differential expression analyses.
An unsupervised SOM of the ERCB CKD population was constructed based solely on patient kidney transcriptomics profiles comprised of scaled gene expression values. The algorithm mapped 165 patients onto the 8 × 8 SOM grid, resulting in 1 to 8 individuals (median of 2) for each of the 64 SOM units (Figure 1a), positioned in a topological order based on the relative similarities of their transcriptional profiles. Hierarchical clustering of SOM units delineated strata of individuals with similar gene expression profiles. Four inherent patient clusters were thus identified within the discovery CKD population; these were named “molecular categories,” and were assigned arbitrary colors—Blue, Gold, Olive, Plum—reflecting the unbiased nature of their discovery (Figure 1b). Global gene expression levels were not different among the 4 molecular categories (Supplementary Figure S4), indicating absence of technical bias but rather qualitative differences in patterns underlying the subgrouping. These differences were further evident from inspection of the transcriptomics profiles visualization, which showed distinct patterns among the molecular categories (Figure 1c).
Figure 1 |. Unbiased kidney transcriptomics stratification identified 4 inherent subgroups of patients (“molecular categories”) within a chronic kidney disease (CKD) cohort.
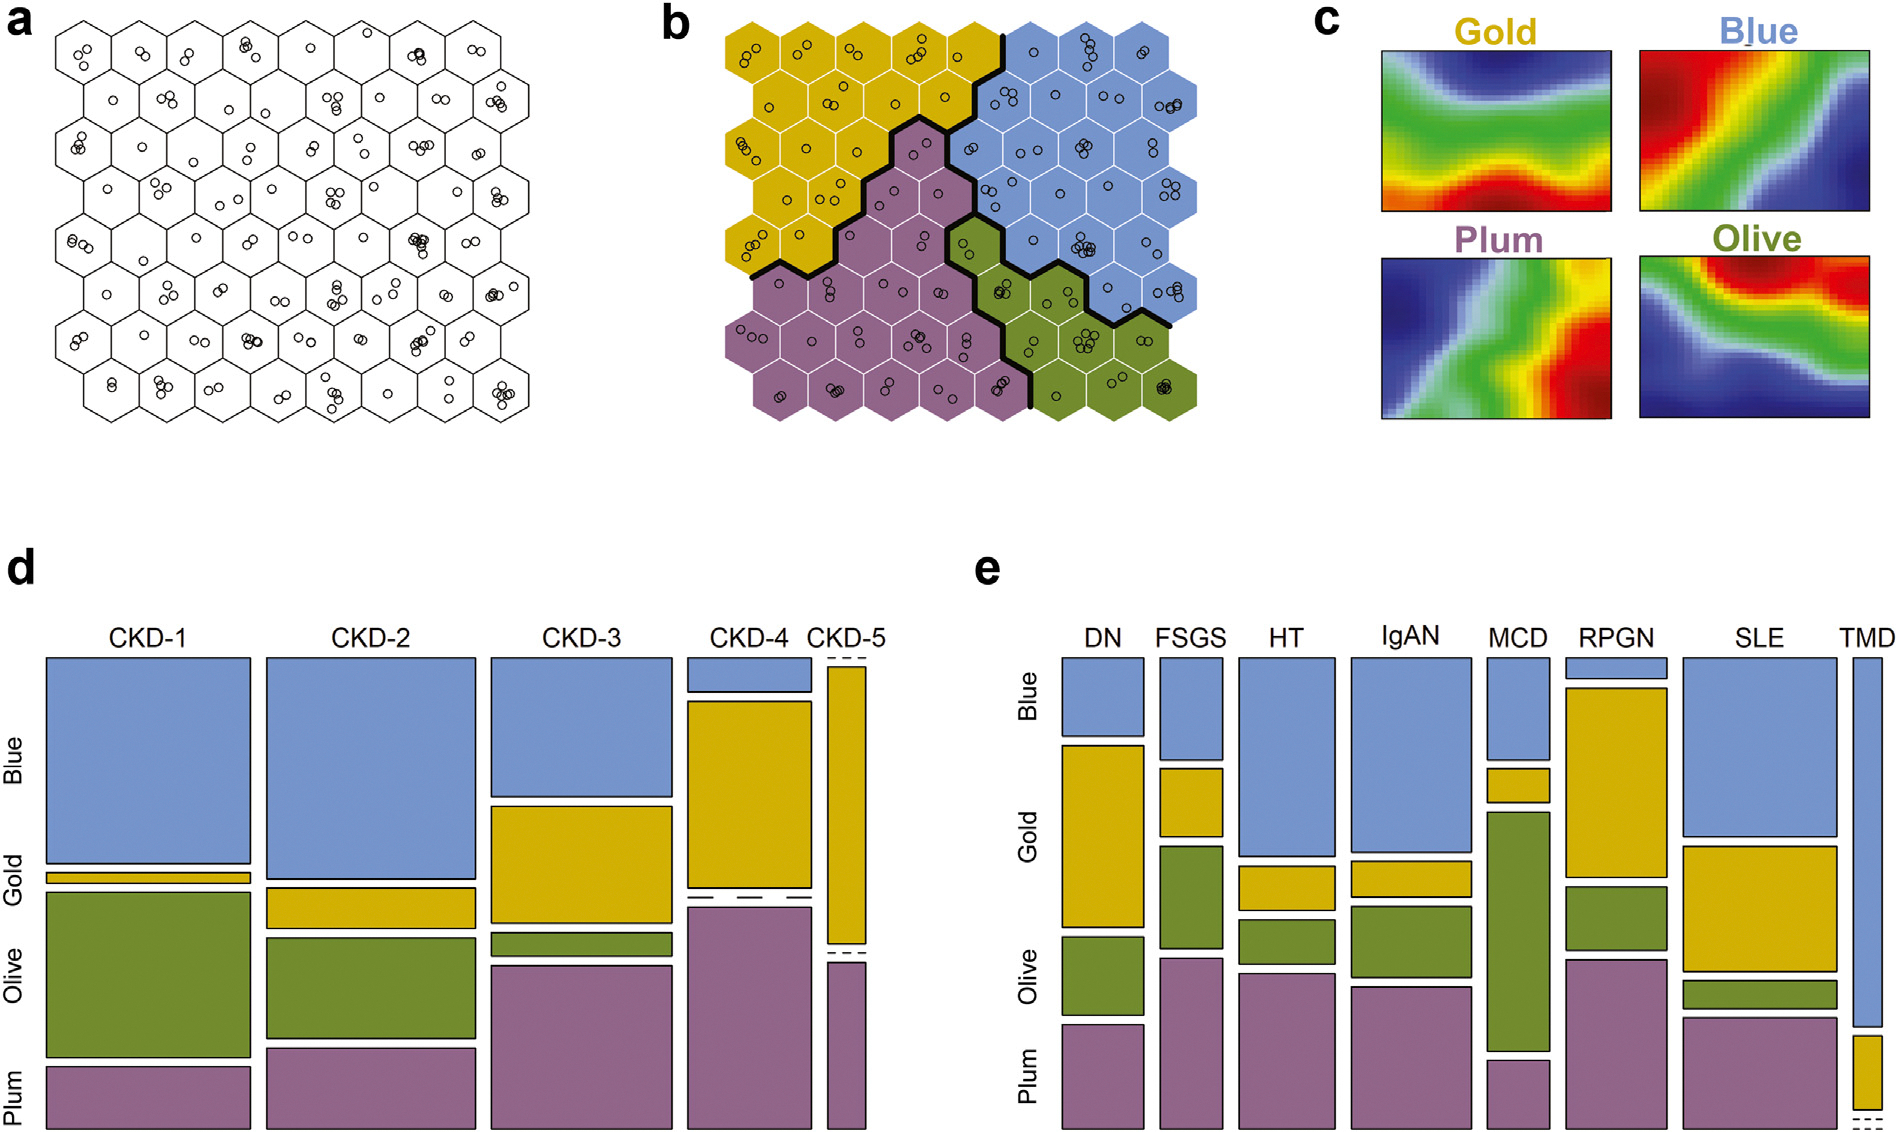
Molecular categories were present at different CKD stages and histopathologic diagnoses, providing orthogonal biomechanistic information regardless of the disease etiology or severity. (a) Self-Organizing Maps (SOM) of a CKD population based on kidney gene expression profiling. Individual patients (shown as open circles) were arranged in a topological order by similarities of their multivariable transcriptomics profiles. (b) Clustering of similar SOM units identified subgroups of similar patients. Thick lines indicate cluster boundaries. Clusters were assigned colors arbitrarily. (c) Group-level summarized transcriptomics profiles (“expression portraits”) show distinct patterns among the molecular categories. The color scale reflects relative gene expression levels (red—high; blue—low; green—average) of 8454 transcripts mapped. (d,e) Mosaic plots show the correspondence between molecular categorization and CKD stages and histopathologic diagnoses, respectively. The width of the bands reflects the relative proportions of cases. DN, diabetic nephropathy; FSGS, focal segmental glomerulosclerosis; HT, hypertensive nephrosclerosis; IgAN, IgA nephropathy; MCD, minimal change disease; RPGN, rapidly progressive glomerulonephritis; SLE, systemic lupus erythematosus; TMD, thin basement membrane disease.
CKD stages consist of molecularly heterogeneous categories
The correspondence between the molecular categories and conventional clinical classifications of CKD was explored next (Figure 1d and e). The molecular categories were present across all CKD stages and histopathologic diagnoses, highlighting the heterogeneity of clinical subgroups at the molecular level. The CKD-Gold and CKD-Plum categories were relatively enriched in advanced disease stages (CKD stages 3–5), whereas CKD patients at stages 1–2 were predominantly mapped to the CKD-Blue and CKD-Olive categories (Figure 1d).
Likewise, each histopathologically defined patient group (Figure 1e) contained multiple molecular categories, highlighting within-group heterogeneity as well as molecular similarities across groups. Figure 2a exemplifies the individual kidney molecular heterogeneity, uncaptured by the histopathologic grouping, and illustrates the unbiased molecular reclassification concept on a sample of 9 patients from 3 CKD diagnosis groups (focal segmental glomerulosclerosis, diabetic nephropathy, and IgA nephropathy).
Figure 2 |. Heterogeneity of individual chronic kidney disease (CKD) transcriptomics profiles and reclassification based on molecular similarity independently from the conventional categories.
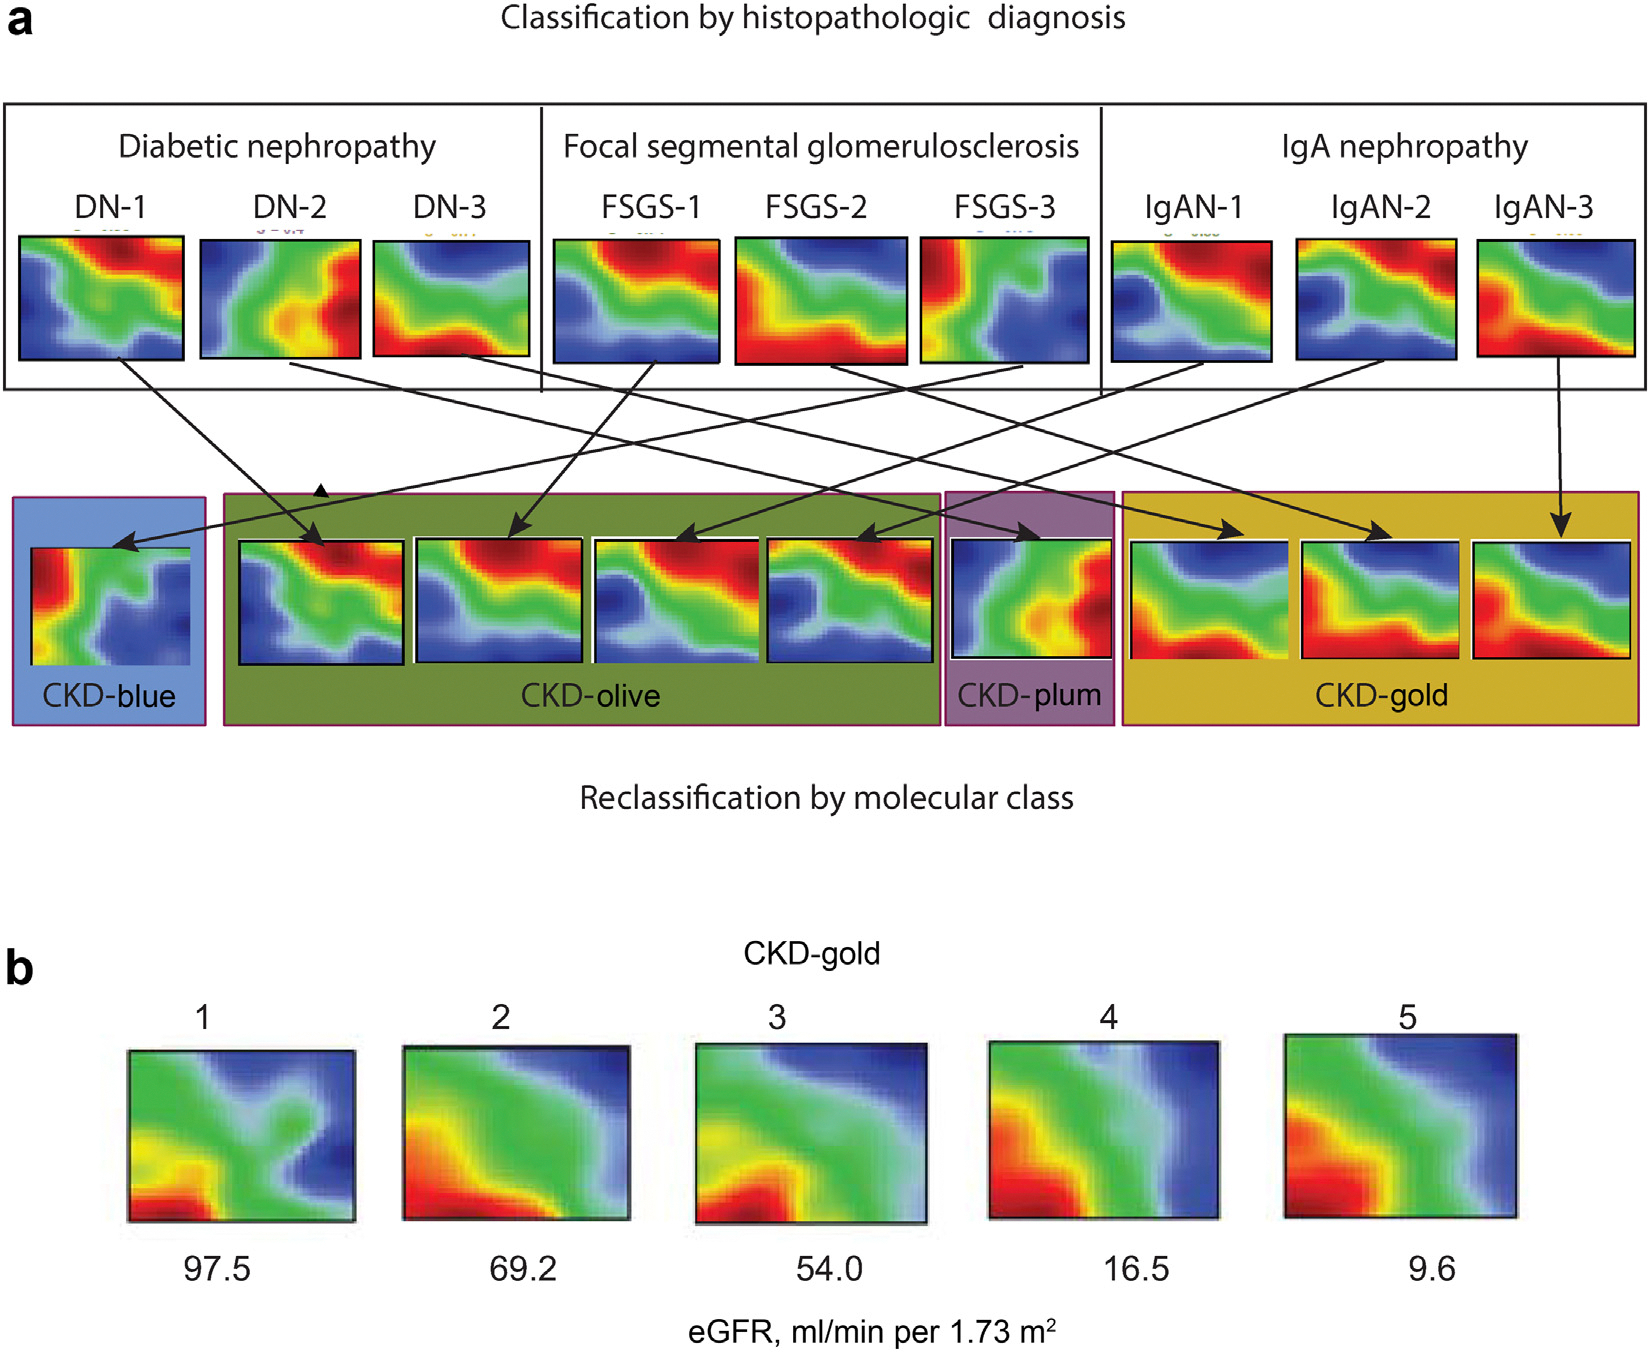
(a) Principle of molecular reclassification illustrated. Individual patients’ kidney gene expression profiles demonstrate marked heterogeneity, even within the same diagnostic groups. Genes are represented in a fixed order on a grid to enable visual comparisons between samples. The color scale reflects gene expression levels relative to the population average (red—high; blue—low; green—average). (b) Examples of individual patients’ kidney gene expression profiles from the CKD-Gold molecular category presenting with different estimated glomerular filtration rate (eGFR) levels. DN, diabetic nephropathy; FSGS, focal segmental glomerulosclerosis; IgAN, IgA nephropathy.
The fact that the same molecular categories were observed at different CKD stages indicates a degree of independence from GFR as a potential confounder (Figure 2b illustrates a range of eGFR values among CKD-Gold cases; likewise, Supplementary Figure S5 shows similar eGFR levels across molecular categories within the same CKD-stages strata).
This finding suggests that CKD molecular categories represent a novel characterization, not captured by existing clinical classifications, and provide orthogonal information, independent of morphologic manifestation and disease severity.
CKD molecular categories are biologically distinct
To obtain functional insights into biological processes underlying the molecular categorization, kidney gene expression profiles of each CKD molecular category were compared to those of healthy controls. The volcano plots (Figure 3a) highlight substantial transcriptomics changes in each of the CKD molecular categories. The full list of significant (at false discovery rate q < 0.0001) differentially expressed genes (DEGs) per CKD molecular category is provided in Supplementary Table S1. An interesting point to note is that the numbers of significant DEGs in each comparison were not driven by the differences in sample size. CKD-Blue, the most common CKD molecular category in this cohort, yielded the fewest DEGs (216), predominantly downregulated. In contrast, the CKD-Plum and CKD-Gold categories revealed a large number of DEGs (3125 and 3472, respectively), proportioned evenly between upregulation and downregulation (Table 2). Finally, when the CKD samples were pooled together and contrasted to the healthy controls in a conventional case–control analysis as a benchmark, the differential expression was much less pronounced (1341 DEGs), despite the sample size advantage, likely dampened by the heterogeneity of cases.
Figure 3 |. Chronic kidney disease (CKD) molecular categories differ from healthy kidney transcriptomics profile and are biologically distinct.
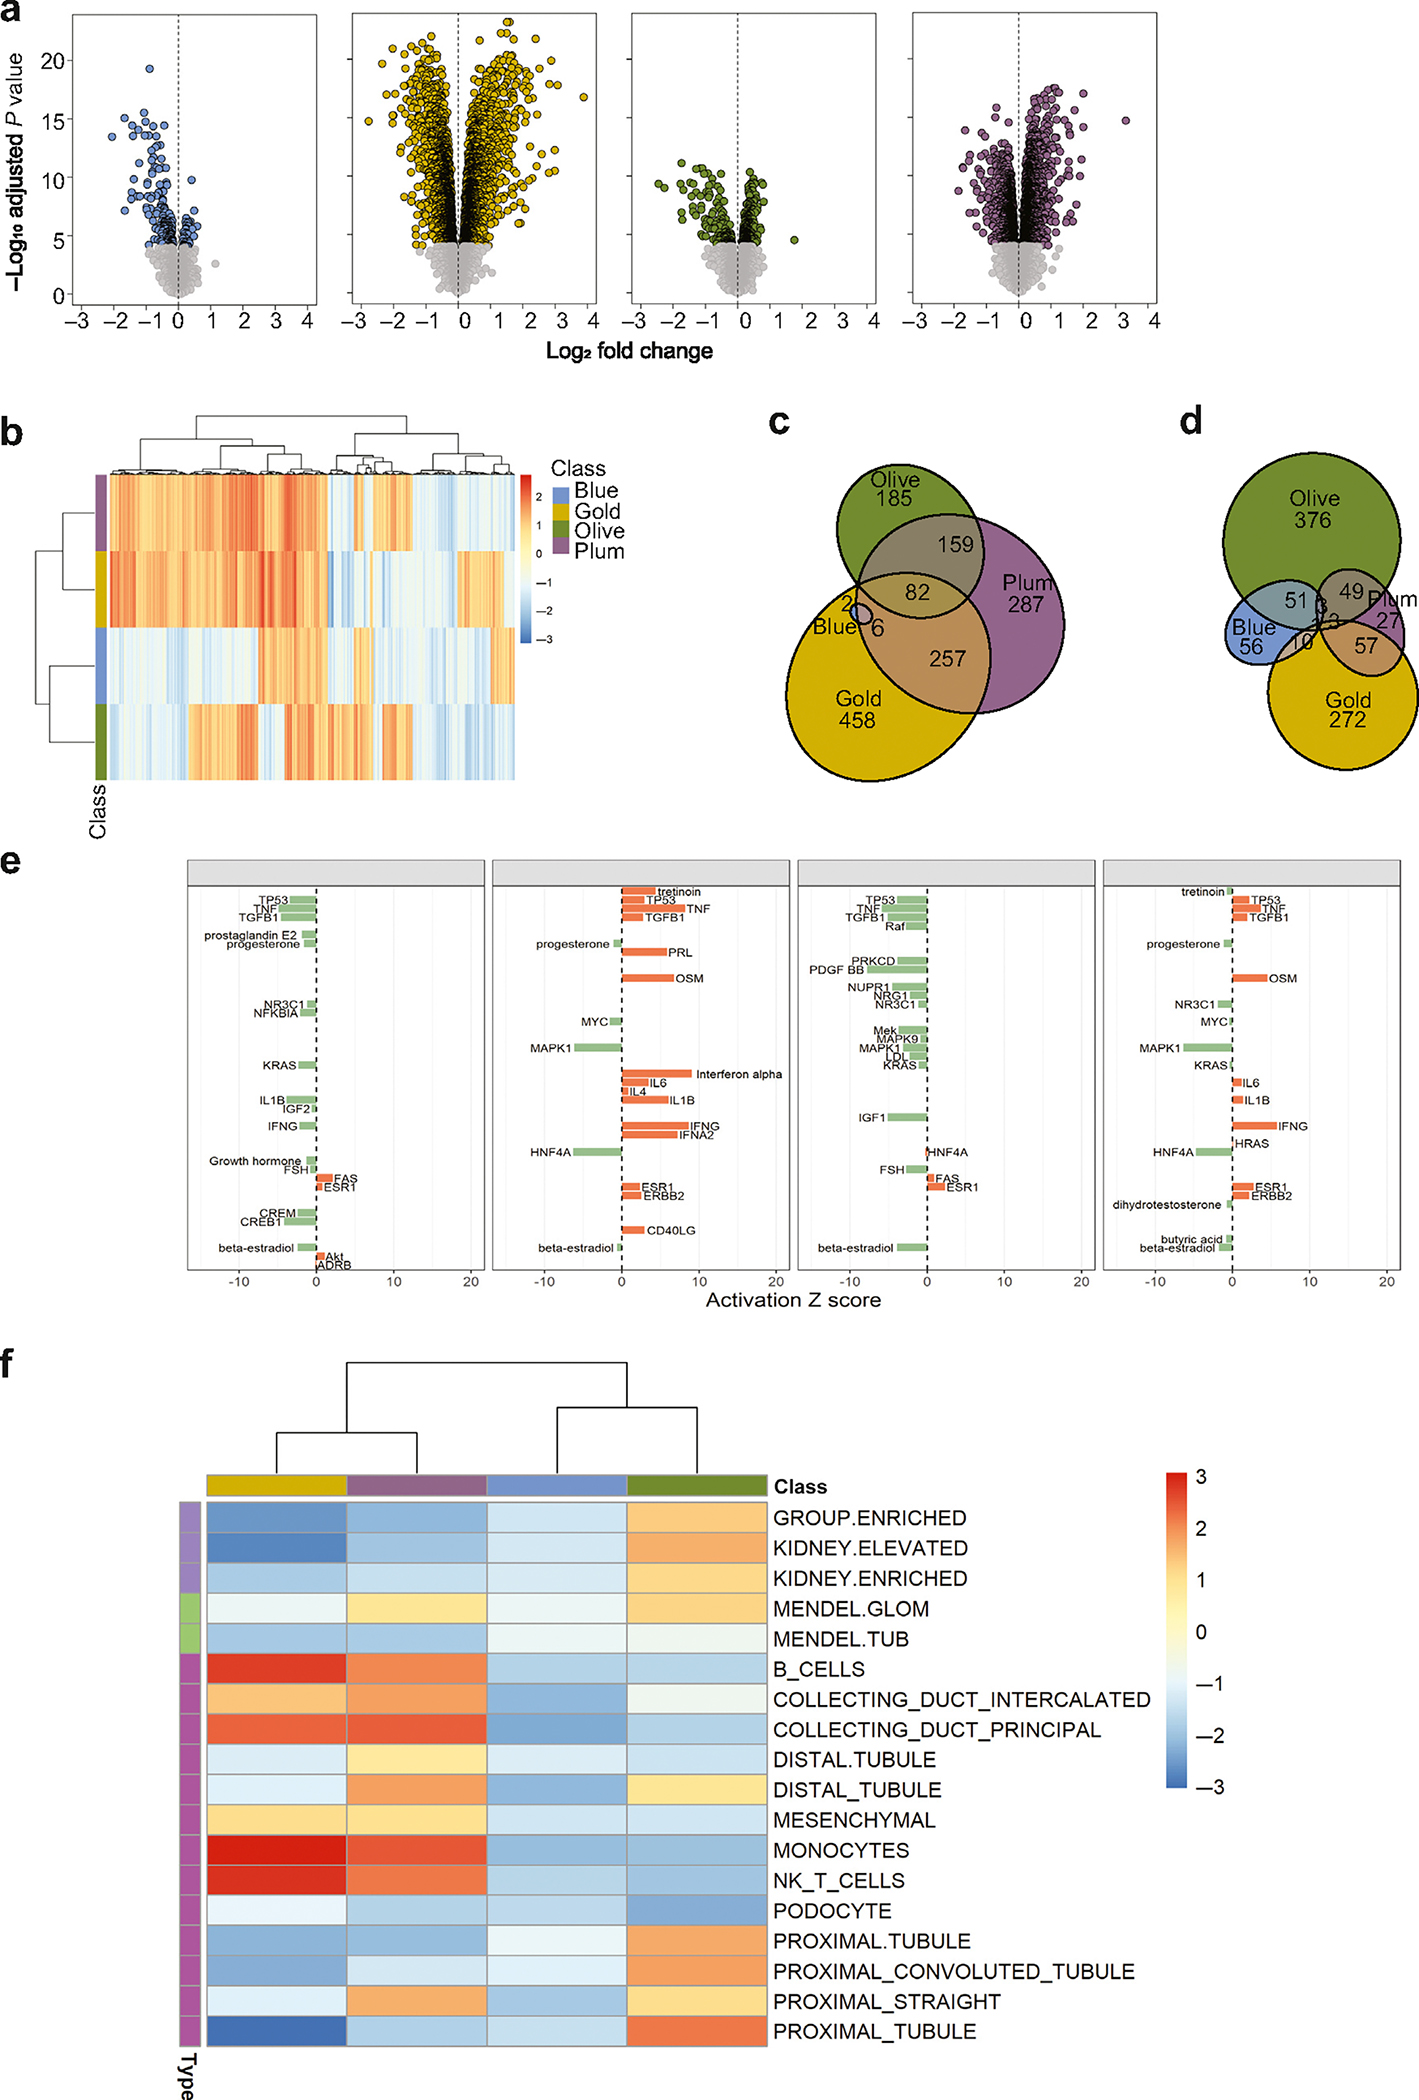
(a) Volcano plots show differential gene expression analysis results (log-fold changes by statistical significance) per each molecular category, contrasted with that of healthy controls (living kidney donors, N = 46). Each point represents a gene. Significantly modulated genes (q < 0.0001) are highlighted in category-specific colors. The vertical dotted lines indicate zero-fold change. (b) Heatmap of gene set–enrichment analysis results. The 5205 gene sets (columns) were tested in each CKD molecular category (rows). The colors reflect normalized enrichment score (NES) values (maroon—positive; blue—negative) per gene set. The color bar indicates the respective molecular category (Olive, Gold, Plum, Blue). Hierarchical clustering groups similar gene sets. (c,d) Venn diagrams show overlaps in significantly enriched (false discovery rate q < 0.05) upregulated and downregulated gene sets, respectively, demonstrating the presence of shared and unique pathways between CKD molecular categories. (e) Transcription regulator analysis. Activation Z-score for the top-20 endogenous upstream regulators per CKD molecular category (orange—activated; green—inhibited). (f) Heatmap of hypothesis-driven enrichment analysis showing enrichment scores for CKD-relevant gene sets (kidney cell–type specific signatures, Mendelian genes known to cause kidney phenotypes, genes with kidney-enriched expression).
Table 2|.
Summary of differential expression and enrichment gene sets by molecular CKD category
| Parameter | CKD-blue | CKD-gold | CKD-olive | CKD-plum |
|---|---|---|---|---|
|
| ||||
| Patients, n | 58 | 33 | 29 | 45 |
| Differentially expressed genes | ||||
| Upregulated | 45 | 1756 | 386 | 1660 |
| Downregulated | 171 | 1716 | 160 | 1465 |
| Significantly enriched gene sets | ||||
| Upregulated | 10 | 807 | 428 | 793 |
| Downregulated | 122 | 343 | 483 | 140 |
| Uniquely enriched gene sets | ||||
| Upregulated | 0 | 458 | 185 | 287 |
| Downregulated | 56 | 272 | 376 | 27 |
| Top-10 uniquely enriched upregulated gene sets | • GO_adaptive_immune_response • GO_extracellular_matrix_structural_constituent • GO_leukocyte_proliferation • GO_regulation_of_leukocyte_proliferation • GO_positive_regulation_of_cell_activation • GO_b_cell_receptor_signaling_pathway • GO_membrane_invagination • GO_humoral_immune_response • Hallmark_inflammatory_response • GO_positive_regulation_of_leukocyte_proliferation |
• GO_mitochondrial_gene_expression • GO_mitochondrial_matrix • GO_peroxisome_organization • GO_mitochondrial_translation • Reactome_peroxisomal_protein_import • GO_peroxisomal_transport • GO_cellular_amino_acid_metabolic_process • GO_mitochondrial_protein_complex • GO_ligase_activity • GO_microbody |
• Reactome_mrna_splicing • GO_nuclear_export • Reactome_downstream_signaling_events_of_b_cell_receptor_bcr • GO_endosome_organization • Reactome_scf_skp2_mediated_degradation_of_p27_p21 • Pid_nectin_pathway • GO_gdp_binding • Reactome_nod1_2_signaling_pathway • GO_pigment_granule • Kegg_spliceosome |
|
| Top 10 uniquely enriched downregulated gene sets | • GO_cellular_response_to_starvation • GO_response_to_starvation • Pid_foxo_pathway • Pid_erbb1_downstream_pathway • GO_kinase_inhibitor_activity • Pid_tap63_pathway • GO_dna_binding_transcription_factor_binding • Hallmark_androgen_response • GO_rna_polymerase_ii_specific_dna_binding_transcription_factor_binding • GO_transcription_factor_binding |
• GO_mitochondrial_matrix • GO_alpha_amino_acid_metabolic_process • GO_coenzyme_binding • Reactome_protein_localization • GO_cofactor_binding • GO_cellular_respiration • GO_cellular_amino_acid_metabolic_process • GO_mitochondrial_protein_complex • GO_cellular_lipid_catabolic_process • Reactome_mitochondrial_fatty_acid_beta_oxidation |
• GO_glomerulus_development • Naba_secreted_factors • Reactome_peptide_ligand_binding_receptors • GO_neuropeptide_signaling_pathway • Pid_fra_pathway • GO_antimicrobial_humoral_immune_response_mediated_by_antimicrobial_peptide • GO_calcium_channel_regulator_activity • Reactome_formation_of_the_cornified_envelope • GO_keratinization • GO_mononuclear_cell_migration |
• GO_voltage_gated_potassium_channel_activity • GO_glutamate_secretion • GO_ligand_gated_ion_channel_activity • GO_sodium_channel_activity • GO_inorganic_ion_import_across_plasma_membrane • Reactome_phase_0_rapid_depolarisation • GO_transmission_of_nerve_impulse • GO_potassium_ion_homeostasis • Reactome_voltage_gated_potassium_channels • GO_ligand_gated_cation_channel_activity |
CKD, chronic kidney disease.
Further, to identify whether qualitative differences were present also, in terms of specific biological pathways in each CKD molecular category, gene set enrichment analysis (GSEA) was used. As the first step, a hypothesis-free GSEA using canonical, CKD-agnostic gene sets (Hallmark, Curated Canonical Pathways, Gene Ontology) was performed. The heatmap visualization of gene set enrichment scores (Figure 3b) shows distinct patterns among the molecular categories, and the presence of both unique and shared pathways (Figure 3c and d). The top 10 uniquely enriched gene sets (Table 2; full list is provided in Supplementary Table S2) indicate that pathways related to transcription, signaling, response to stimuli, and apoptosis were selectively downregulated in the patients in the CKD-Blue category. The CKD-Gold category revealed a strong proinflammatory and profibrotic drive, with the top activated processes including immune-cell proliferation and migration, cytokine production, and extracellular matrix organization, and metabolic pathways were downregulated. In the CKD-Olive category, mitochondrial and peroxisomal metabolic processes were upregulated, whereas immune and membrane transport pathways were inhibited. The CKD-Plum category showed positive enrichment for signaling, protein synthesis, and vesicle transport processes; at the same time, ion transport pathways were downregulated.
In line with the vast transcriptomics differences, upstream transcriptional regulator analysis revealed a diverse array of activated regulatory molecules in each of the CKD molecular categories (Figure 3e; Supplementary Table S3).
As the next step, hypothesis-driven gene sets of CKD relevance, including kidney-specific genes, Mendelian kidney disease genes, and kidney cell type–specific markers, were tested for enrichment across the CKD molecular categories (Figure 3f). All 3 groups of kidney-specific transcriptome were positively enriched in the CKD-Olive category. Mendelian genes known to cause glomerulopathies were enriched in the CKD-Olive and CKD-Plum categories. The CKD-Gold and CKD-Plum molecular categories showed enrichment in markers of immune cells and collecting duct, whereas the CKD-Olive category was specifically enriched for the proximal and distal tubular signatures.
Taken together, these results highlight that CKD molecular categories are distinct in terms of the biological pathways affected in the kidney, supporting the biomechanistic relevance of the molecular-categorization approach.
CKD molecular categories are reproducibly identified in independent cohorts
Principal findings were then validated in 2 independent cohorts, to determine the reproducibility of these newly identified molecular categories in other CKD populations.
Kidney biopsy transcriptomics data from the C-PROBE and NEPTUNE CKD patients were mapped onto the discovery SOM to predict their CKD molecular category (Figure 4a and b). All 4 CKD molecular profiles were recoverable among the C-PROBE and NEPTUNE patients (Figure 4c), and the permuted data tested as a negative control produced a nonsensical result mapping outside of the SOM range (Supplementary Figure S6). A similar pattern for the relative prevalence of the CKD-Gold and CKD-Plum categories at later CKD stages, as observed in ERCB, was reproduced in the validation cohorts (Figure 4d and e). Inspecting individual gene expression levels (TMSB10 as an example is given in Figure 4f) showed conserved patterns across CKD molecular categories in independent cohorts, confirming that the same transcriptomics profiles were captured.
Figure 4 |. Chronic kidney disease (CKD) molecular categorization in independent patient cohorts.
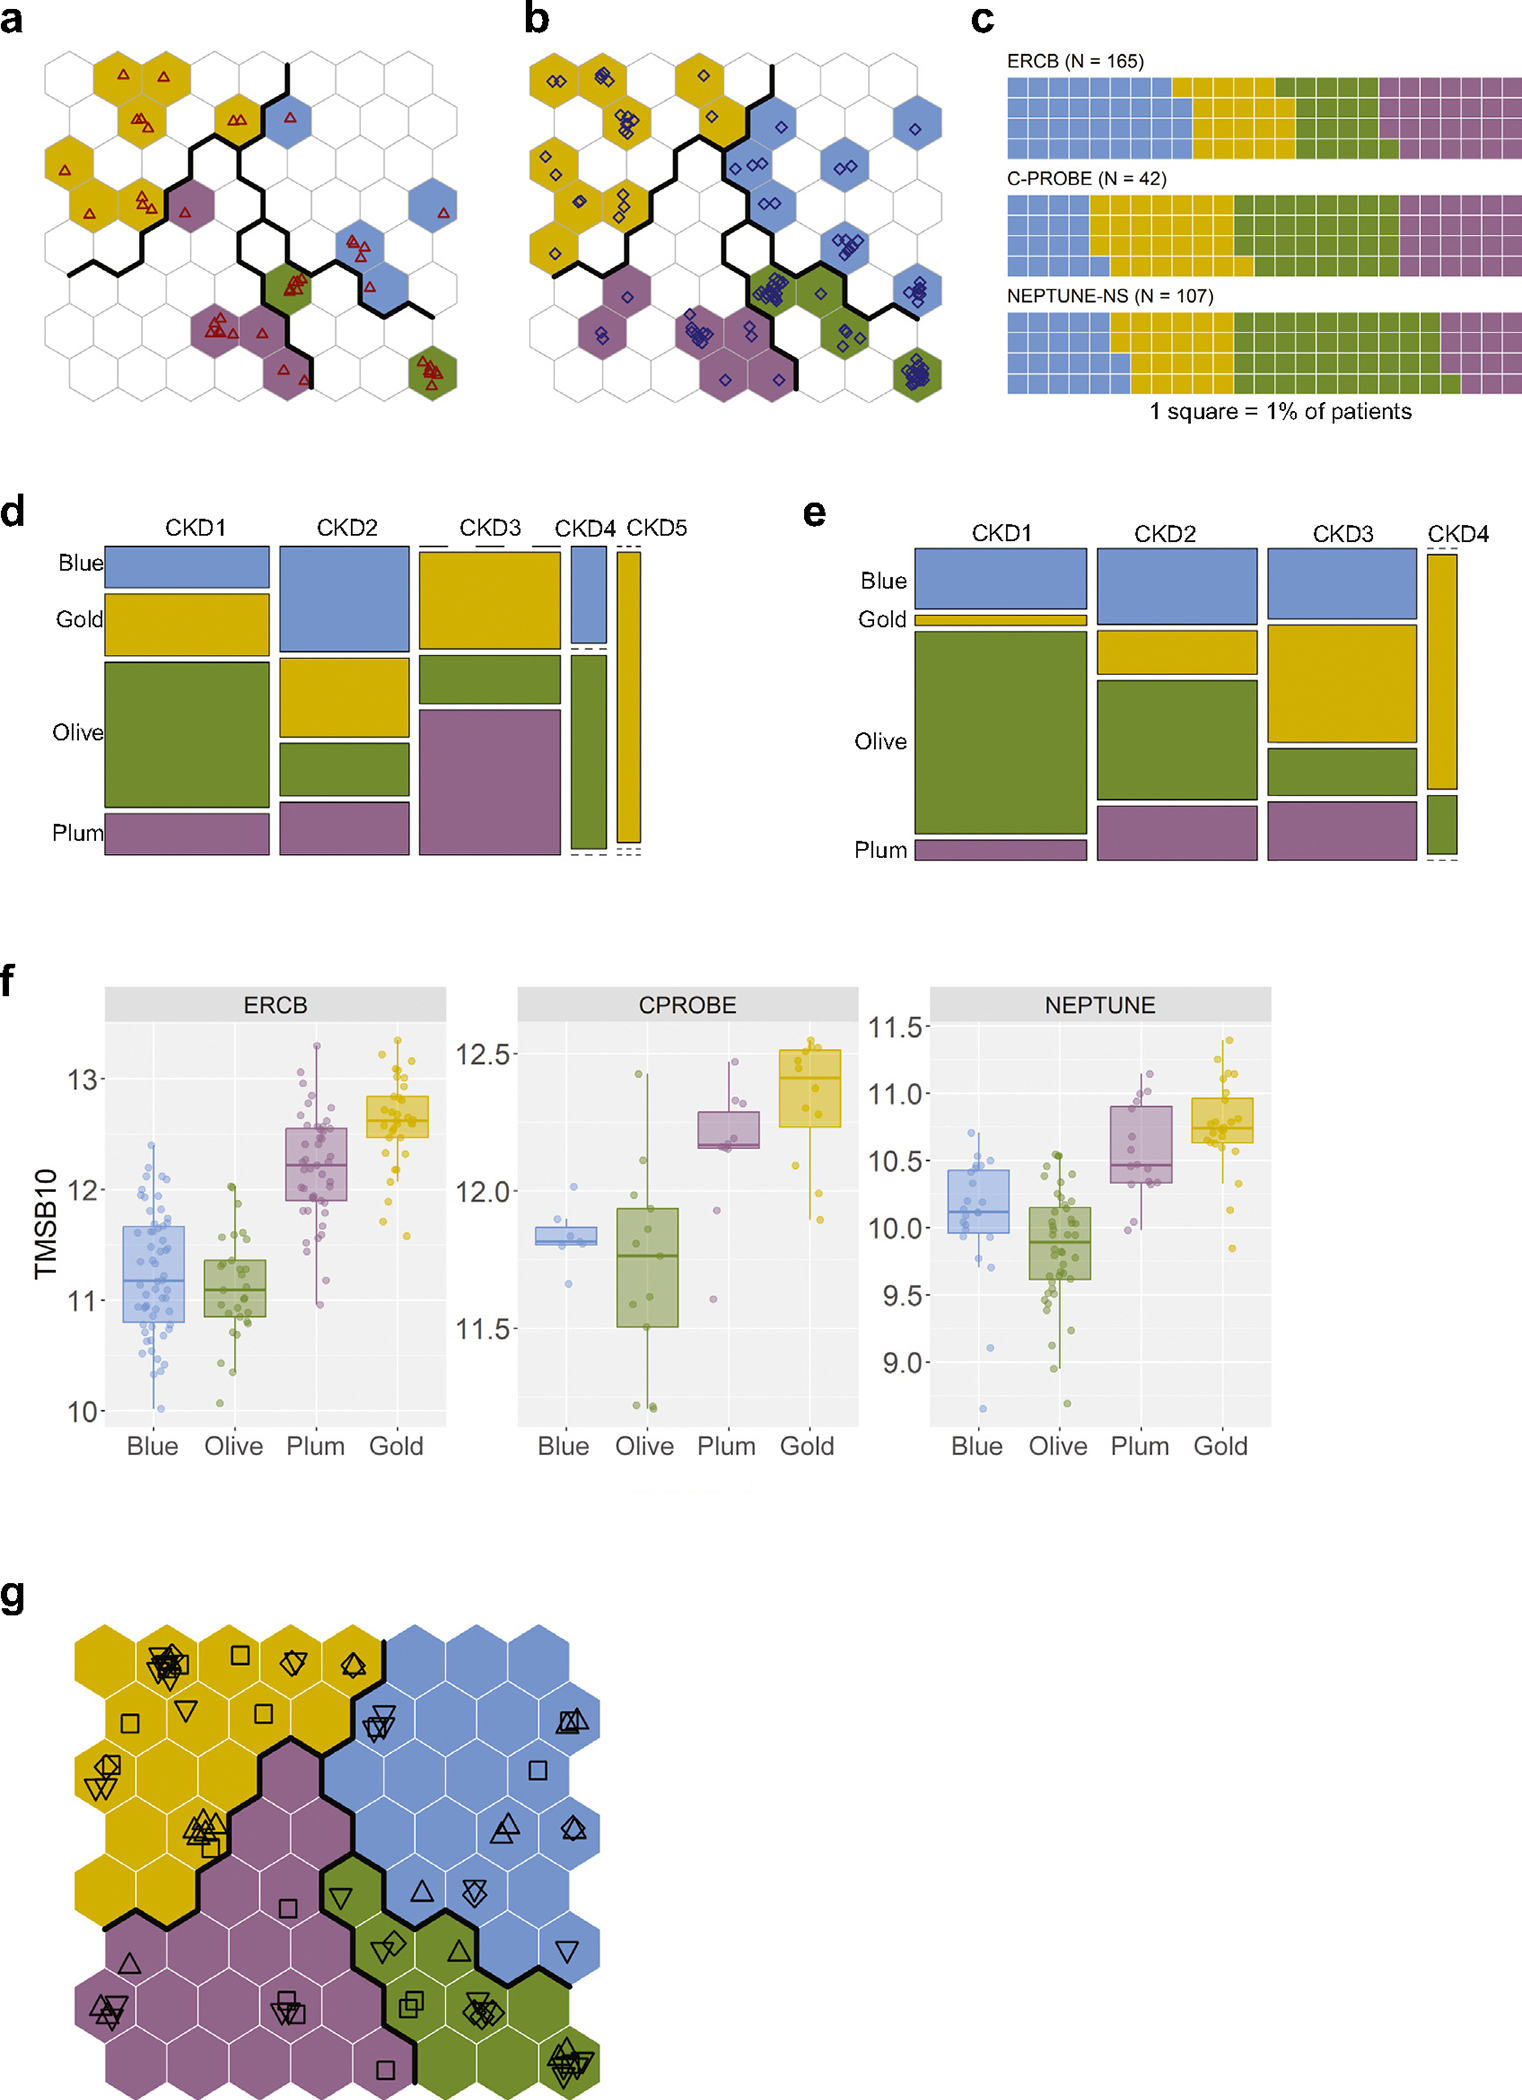
(a) Clinical Phenotyping Resource and Biobank Core (C-PROBE) cohort patients (N = 42) mapped onto the trained, discovery Self-Organizing Maps (SOM); individual patients are shown as red triangles. (b) Nephrotic Syndrome Study Network (NEPTUNE-NS) cohort patients (N = 107) mapped onto the trained, discovery SOM; individual patients are shown as blue diamonds. (c) Waffle charts show relative proportions of patients assigned to the different molecular categories in the validation CKD cohorts (1 square = 1%). (d) Mosaic plot showing the CKD-stage (1–5) breakdown by molecular category in the C-PROBE cohort. (e) Mosaic plot showing the CKD-stage (1–4) breakdown by molecular category in the NEPTUNE-NS cohort. (f) A randomly chosen individual gene example, TMSB10, demonstrating consistency of the expression pattern across CKD molecular categories in independent cohorts. (g) Diabetic kidney disease (DKD) patients (N = 72) mapping onto the discovery SOM; plotting symbol shapes indicate the corresponding studies: square—European Renal cDNA Bank (ERCB) DKD; diamond—GSE30122; triangle pointing up—Levin et al. (2020)22; triangle pointing down—GSE142025.
As DKD is generally underrepresented in indication kidney biopsy cohorts, we additionally included external DKD cases, to corroborate the generalizability to this most common CKD etiology. In total, 72 DKD patient profiles from 4 different studies and diverse transcriptomics platforms (both microarray and RNA-seq, micro-dissected and whole cortex tissues) were stratified into the CKD molecular categories (Figure 4g).
The presence of the molecular categories in fully independent cohorts thus strengthens the generalizability of our findings and provides a conceptual framework for “CKD molecular-category diagnosis” based on kidney biopsy omics profiling.
CKD molecular categories differ in disease progression
To determine whether the underlying biological differences would manifest in disparate disease progression rates, kidney outcomes were analyzed in patients with predicted CKD molecular categories and available long-term clinical follow-up data.
In the C-PROBE cohort, during the follow-up period (median duration, 4.7 years; maximal duration, 9.1 years), 7 patients progressed to end-stage kidney disease (ESKD), defined as initiation of kidney replacement therapy (dialysis or kidney transplantation). Even with this limited sample size, the rate of reaching the endpoint varied significantly depending on the molecular category (log-rank P = 0.028). Kaplan–Meier survival curves stratified by molecular category (Figure 5a) demonstrate the significantly higher ESKD incidence in the CKD-Gold category, with 5 of 7 events occurring in this subgroup of patients. The rate of disease progression was thus faster in patients from the CKD-Gold category, with a median survival probability of 6.8 years. Cox regression hazard ratios (HRs) for ESKD in the CKD-Gold category, compared to the other molecular categories, were 7.9 (95% confidence interval [CI] 1.5–41.1; P = 0.014) in the crude model, and 5.6 (95% CI 1.01–31.3) in the model adjusted for baseline eGFR (P = 0.048). Additional adjustment for baseline urine albumen-to-creatinine ratio resulted in an HR of 6.2 (95% CI 1.0–40.2; P = 0.056). For 37 C-PROBE patients, repeated kidney function values were available over time, from which prospective eGFR slopes were calculated. With directionality consistent with the hard endpoint prediction, the eGFR slopes showed a trend for greater annual loss of kidney function in the CKD-Gold category (Figure 5b).
Figure 5 |. Chronic kidney disease (CKD) molecular (Mol.) categorization and disease progression.

(a) Kaplan–Meier curves of end-stage kidney disease (ESKD) incidence by CKD molecular category in the Clinical Phenotyping Resource and Biobank Core (C-PROBE) study. Statistical significance of differences was tested using the log-rank test. (b) Prospective slope of estimated glomerular filtration rate (eGFR, ml/min per 1.73 m2 per year, by CKD molecular category at baseline in C-PROBE. Boxplots show median values per molecular class; whiskers indicate interquartile range. Dotted horizontal line denotes zero (no change in eGFR over time). (c) Kaplan–Meier curves of composite ESKD or 40% eGFR drop outcome incidence by CKD molecular category in Nephrotic Syndrome Study Network (NEPTUNE). Statistical significance of differences was tested using the log-rank test. (d) Density plots of distributions of correlation coefficients for CKD molecular category enriched gene correlations with interstitial fibrosis and tubular atrophy (IFTA) values in the NEPTUNE cohort. (e) Boxplots of tubular atrophy levels stratified by patients’ CKD molecular category (interstitial fibrosis data show an identical trend—Supplementary Figure S8).
In the NEPTUNE study, in which loss of kidney function was defined as a composite of ESKD or ≥40% eGFR decline, 16 events occurred during the follow-up period (median duration, 4.1 years; maximal duration, 6.0 years). Similar to the pattern observed in the C-PROBE study, the rate of disease progression was significantly different among the molecular categories (log-rank P = 0.00049; Figure 5c), with patients in the CKD-Gold category showing a higher event incidence (9 of 16) and a median kidney survival probability of 4.5 years. The HRs for the CKD-Gold category, compared to other molecular categories, were 6.7 (95% CI 2.4–19.0; P = 0.00032) in the crude model, and 5.2 (95% CI 1.2–22.1; P = 0.024) in the full multivariable model adjusted for baseline eGFR, urinary protein-to-creatinine ratio, primary diagnosis, and interstitial fibrosis value. An interesting finding is that in contrast to the molecular categories, stratification by baseline CKD stage or histopathologic diagnosis (Supplementary Figure S7A and B, respectively), did not achieve significant event rate prediction.
Our results thus demonstrate that clinically meaningful differences are present in disease progression rates among the CKD molecular categories, with a consistent pattern across 2 independent cohorts.
CKD molecular categories are associated with kidney histopathology
To test whether CKD molecular categories also are associated with kidney structural changes, quantitative histologic data were analyzed in the NEPTUNE cohort.
Correlation analysis of the top-50 molecular category–enriched transcripts with interstitial fibrosis and tubular atrophy (IFTA) values was performed. As an overall trend, CKD-Gold–enriched genes showed a strong positive correlation with IFTA, whereas the CKD-Olive–enriched genes were strongly negatively correlated with IFTA, and genes enriched in the CKD-Plum and CKD-Blue molecular categories did not show significant associations with IFTA (Figure 5d; Supplementary Table S4). Of note, some CKD-Gold–enriched genes (HOPX, CFDP1, CRADD) did not correlate with IFTA, indicating a degree of independence of the CKD-Gold profile from structural change.
In an orthogonal analysis, patients from the CKD-Gold and CKD-Plum molecular categories had significantly higher IFTA levels, as compared to those in the CKD-Olive and CKD-Blue categories (Figure 5e; Supplementary Figure S8).
Given the strong association of molecular category with IFTA, we further tested the relationship of the 4-point renal chronicity score,26 which additionally includes variables for glomerulosclerosis and arteriosclerosis, with the outcome prediction. The chronicity score was added to the abovementioned Cox regression model predicting a composite of ESKD and ≥40% eGFR decline. The molecular categorization remained a statistically significant predictor after this adjustment, with an HR for the CKD-Gold category versus other molecular categories of 4.01 (P = 0.028).
CKD molecular categories display distinct urine proteomics profiles
Kidney and urine biomarker profiles of patients from different CKD molecular categories were tested for discriminating patterns.
In a targeted analysis, transcripts encoding known kidney injury biomarkers—lipocalin 2 (LCN2), clusterin (CLU), epidermal growth factor (EGF), fatty acid–binding protein 1 (FABP1), and tissue inhibitor metalloproteinase 2 (TIMP2)—showed diverse distributions across the molecular categories in the ERCB cohort (Figure 6a), as also observed at the protein level in the urine in the C-PROBE cohort (Figure 6b).
Figure 6 |. Biomarker profiles of chronic kidney disease (CKD) molecular categories.

(a) Gradient plots showing kidney expression levels of genes encoding known kidney injury biomarkers overlayed on the discovery Self-Organizing Maps (SOM; European Renal cDNA Bank [ERCB] CKD cohort). Colors reflect the averaged gene expression levels (blue—low; red—high) of the patients mapped to the specific SOM unit. (b) Urine levels of the same kidney injury markers in the Clinical Phenotyping Resource and Biobank Core (C-PROBE) cohort stratified by CKD molecular class. (c) Volcano plot showing differential abundance analysis of urinary proteins in CKD molecular categories versus controls in the C-PROBE cohort. (d) Heatmap of the top-25 urinary proteins differentiating CKD-Gold versus other molecular categories. (e) Sparce partial least-squares scores plot showing clustering of CKD-Gold versus other molecular categories, based on the 25 urinary proteins. (f) Area under the curve (AUC) receiver operating characteristic plot for discrimination of CKD-Gold versus other molecular categories, based on the urine 25-protein signature.
The unbiased analysis of urine proteomics data identified significant differences between CKD molecular categories and healthy controls, as well as among molecular categories, similar to the kidney transcriptomics findings (Figure 6c). A set of the top-25 urinary proteins differentially abundant in the CKD-Gold category (Figure 6d; Supplementary Table S5) was tested in a discriminant analysis, and an area under the curve of 0.83 was achieved for classification of the CKD-Gold category versus other molecular categories (Figure 6e and f). The noninvasively predicted CKD-Gold molecular category retained a pattern of enrichment for outcomes, with 29% of ESKD events, versus 13% in other molecular categories, although this difference did not reach the level of statistical significance in this limited sample size (P = 0.65).
Therefore, CKD molecular categories manifest with distinct urinary biomarker profiles that, conditional on positive external validation in larger cohorts, potentially can be leveraged in the future to achieve noninvasive stratification of patients.
DISCUSSION
This study represents the first kidney transcriptomics-driven approach for molecular reclassification of CKD, as a step toward precision medicine for this complex and heterogeneous condition. Adding a mechanistic, precision, disease-based dimension to a CKD classification has the potential to transform the CKD field with respect to biological understanding, clinical management, and drug development, as well as pave the way toward molecular categorization of other complex diseases. To generate broader value for the research community and enhance accessibility, an R-based Shiny application has been created, freely available for academic purposes, that allows exploration of the results of this study, as well as molecular-category prediction for custom, user-provided kidney transcriptomics data.
This study was motivated by the growing realization in the field that mechanistic categorization of CKD is lacking.9,14,27,28 The call to redefine CKD to boost therapeutic development is becoming increasingly urgent, as its global prevalence is reaching epidemic proportions.29 Integration of molecular features into clinicomorphologic diagnosis promises a more mechanistic framework for classification of CKD patients, as a foundation for development of personalized treatment options based on individual disease biology.30–32
Additive value of molecular characterization on top of clinical parameters has been shown, previously, in studies evaluating the use of circulating or urinary biomarkers to improve disease stratification and prognosis prediction.33–35 However, a fundamental limitation of such systemic phenotyping is that the underlying local molecular changes in the kidney remain unknown. Here, a materially different approach was pursued that leveraged molecular profiles from kidney biopsies, directly reflecting the organ’s biology, as the basis for patient categorization.
The findings from this study highlight the value of using kidney tissue transcriptomics to capture the individual specificity of each patient’s molecular profile at a given time-point, which can be leveraged to group patients by similarity into distinct categories. Pursuing an unbiased molecular data–driven analysis, without imposing clinical information or prior biological knowledge, allowed the identification of inherent patient subgroups present within a CKD population. The fact that the emergent 4 molecular categories were detected orthogonally, at different CKD stages and histopathologic diagnoses, highlights the biological heterogeneity within the conventional clinical classification. We propose that kidney tissue molecular features can, therefore, add a new dimension to the existing framework of CKD classification.
Molecular categorization was able to capture more-nuanced elements of the disease biology, as demonstrated by the stratified case–control analyses, in which the intrinsically more homogeneous CKD molecular categories were more powerful than the conventional case–control analysis using a heterogeneous all-comer CKD group in detecting differential gene expression. The case–control contrast was further enhanced by using living kidney donor biopsies as a more optimal reference group, as compared to tumor nephrectomy or autopsy tissues. Both these factors maximized the contrast with the disease state, thereby enhancing the detection of refined biologically meaningful differences.
Through both hypothesis-free exploration and hypothesis-driven analyses, we found that distinct biological pathways, transcriptional regulators, injury markers, and cell-type context were perturbed in each of the CKD molecular categories. Many of the enriched pathways, such as immunity, apoptosis, and metabolic processes, are well known to be implicated in CKD.36–39 However, the novel contribution of this study is that it highlights the fact that not all pathways are activated equally in each patient; rather, certain pathways are more dominant in specific subgroups and thereby differentially influence disease progression and outcomes. For example, inflammation and fibrosis, conventionally thought of as universal pathophysiological mechanisms in CKD,40 showed uneven distribution within the patient population, with specific enrichment in the CKD-Gold molecular category. This challenges the existing dogma, with implications for disease understanding as well as anti-inflammatory drug development, further emphasizing the importance of precision medicine and mechanistic enrichment approaches to patient selection.
The identified molecular categories were reproducibly detected in fully independent cohorts, including DKD, which strengthens the generalizability of our findings and demonstrates their robustness against many sources of bias, such as patient inclusion, transcriptomics platforms (microarray and RNA-seq), and research-center locations (US and Europe). Important in our findings is that an association with clinical outcomes also was demonstrated. In our analysis, the CKD-Gold subgroup reproducibly stood out for its increased incidence of kidney outcomes, independent of baseline predictors (eGFR, proteinuria, histopathology). Going forward, larger studies are warranted to resolve potential differences in progression rates among the other molecular categories. The association of molecular category with ESKD risk was conserved across several cohorts, which is encouraging, and advocates for further investigation, as molecular categorization might help identify patients at greater risk for rapid disease progression, as well as those who are unlikely to progress.
To realize the vision for CKD molecular categorization, and ultimately enable practical implementation in clinics in the future, identification of noninvasive biomarkers reflecting the characteristics of each subgroup will be crucial to allow for molecular diagnosis in the absence of kidney biopsy. We showed broad differences in urinary proteomes among patients’ molecular categories, and the feasibility of discrimination between the CKD-Gold category and other molecular categories based on 25 urine proteins in a small pilot study. Going forward, larger studies will be needed for external validation of these initial results and to achieve the full 4-group classification. Nonetheless, these initial findings are encouraging and support the feasibility of a biomarker panel–based stratification strategy, thus offering a starting point for developing a noninvasive approach to recognizing CKD molecular categories in the future.
This study has several limitations. We analyzed the largest publicly available kidney transcriptomics datasets from CKD patients. Going forward, more collaborative efforts will be needed to generate additional data to further refine this initial classification and expand the repertoire of “omics” beyond transcriptomics. Biopsy cohorts are subject to an inherent selection bias for patients undergoing a clinically indicated kidney biopsy; therefore, they are not completely representative of the broad CKD population. This study focused on the more abundant tubulointerstitial tissue component or whole cortex biopsy; extending the analysis to the micro-dissected glomerular fraction would be interesting as well. Nevertheless, tubulointerstitial biology is highly relevant for CKD, with tubulointerstitial lesions known to be a strong predictor of CKD progression, even in glomerular disease,15,41–43 and with transcriptomics profiling of the tubulointerstitium having proved informative in deciphering the molecular basis of disease.44–46 In subsequent studies, inclusion of genetics and comorbidities information (not available for ethical reasons in this study) would be beneficial to expand the interpretation of the molecular categories. The single–time-point biopsy precluded exploration of the anticipated molecular changes that occur over time in the kidney and reflect disease-progression processes. However, as repeated kidney biopsies are rarely performed in clinical practice, the temporal trends of molecular changes will need to be ascertained through noninvasive means or through time-course studies in animal models.
Establishing the first framework of molecular categorization in CKD is an important milestone in CKD research, and our results have the potential to take CKD disease classification to the next, mechanistic and precision-medicine level. A transition to an integrated clinical, morphologic, and molecular diagnosis is warranted for development of individualized treatments in CKD, as elucidation of the molecular drivers of different patient subgroups can lead to new biological hypotheses, therapeutic targets, and discovery of biomarkers.
Supplementary Material
Supplementary Table S1. Differentially expressed genes per chronic kidney disease (CKD) molecular category versus healthy controls.
Supplementary Table S2. Enriched pathways per chronic kidney disease (CKD) molecular category.
Supplementary Acknowledgment—NEPTUNE.
Supplementary Methods.
Supplementary References.
Supplementary Figure S1. Data clustering tendency assessment: (A) pairwise Spearman correlation-based distances between samples; (B) VAT, visual assessment of cluster tendency.
Supplementary Figure S2. Self-organizing map model optimization: quantization error versus (A) map size; (B) convergence—embedding accuracy and topographic accuracy; (C) learning progress across 10 independent models.
Supplementary Figure S3. Final model Self-Organizing Maps (SOM) diagnostic plots: (A) counts; (B) mapping quality; (C) neighbor distances; (D) number of clusters.
Supplementary Figure S4. Global gene expression levels across chronic kidney disease (CKD) molecular categories.
Supplementary Figure S5. Levels of estimated glomerular filtration rate (eGFR) per molecular category stratified by chronic kidney disease (CKD) stage.
Supplementary Figure S6. Distributions of mapping distances for study cohorts and permuted data (negative control).
Supplementary Figure S7. Kaplan–Meier survival curves for prediction of end-stage kidney disease (ESKD) outcome stratified by (A) chronic kidney disease (CKD) stage and (B) histopathologic diagnosis.
Supplementary Figure S8. Boxplots of interstitial fibrosis quantitative histopathology values stratified by chronic kidney disease (CKD) molecular category in Nephrotic Syndrome Study Network (NEPTUNE) cohort.
Supplementary Table S3. Upstream transcriptional regulators per chronic kidney disease (CKD) molecular category.
Supplementary Table S4. Correlation between chronic kidney disease (CKD) molecular category gene expression and (A) interstitial fibrosis (IF) and (B) tubular atrophy (TA) values.
Supplementary Table S5. Chronic kidney disease (CKD)-Gold signature in urine.
ACKNOWLEDGMENTS
The authors thank Dr. Lalita Subramanian for the excellent writing assistance and diligent proofreading of this manuscript. See the Supplementary Acknowledgments for NEPTUNE consortium details. ERCB members at the time of the study: Clemens David Cohen, Holger Schmid, Michael Fischereder, Lutz Weber, Matthias Kretzler, Detlef Schlöndorff, Munich/Zurich/AnnArbor/New York; Jean Daniel Sraer, Pierre Ronco, Paris; Maria Pia Rastaldi, Giuseppe D’Amico, Milan; Peter Doran, Hugh Brady, Dublin; Detlev Mönks, Christoph Wanner, Würzburg; Andrew Rees, Aberdeen and Vienna; Frank Strutz, Gerhard Anton Müller, Göttingen; Peter Mertens, Jürgen Floege, Aachen; Norbert Braun, Teut Risler, Tübingen; Loreto Gesualdo, Francesco Paolo Schena, Bari; Gunter Wolf, Jena; Rainer Oberbauer, Dontscho Kerjaschki, Vienna; Bernhard Banas, Bernhard Krämer, Regensburg; Moin Saleem, Bristol; Rudolf Wüthrich, Zurich; Walter Samtleben, Munich; Harm Peters, Hans-Hellmut Neumayer, Berlin; Mohamed Daha, Leiden; Katrin Ivens, Bernd Grabensee, Düsseldorf; Francisco Mampaso (deceased), Madrid; Jun Oh, Franz Schaefer, Martin Zeier, Hermann-Joseph Gröne, Heidelberg; Peter Gross, Dresden; Giancarlo Tonolo, Sassari; Vladimir Tesar, Prague; Harald Rupprecht, Bayreuth; Hermann Pavenstädt, Münster; Hans-Peter Marti, Bern; Peter Mertens, Magdeburg, Jens Gerth, Zwickau.
FUNDING
This work was done as part of the Renal Precompetitive Consortium (RPC2) collaboration47 and was funded jointly by the participating members. This work is supported, in part, by the George M. O’Brien Michigan Kidney Translational Core Center, funded by the National Institutes of Health (NIH)/National Institute of Diabetes and Digestive and Kidney Diseases (NIDDK) grant P30-DK-081943. The Nephrotic Syndrome Study Network Consortium (NEPTUNE), U54-DK-083912, is a part of the NIH Rare Disease Clinical Research Network (RDCRN), supported through a collaboration between the Office of Rare Diseases Research, National Center for Advancing Translational Sciences, and the NIDDK. Additional funding and/or programmatic support for this project has also been provided by the University of Michigan, NephCure Kidney International, and the Halpin Foundation to NEPTUNE.
Footnotes
DISCLOSURE
MK reports receiving grants from the National Institutes of Health (NIH), nonfinancial support from the University of Michigan, funding through the University of Michigan from AstraZeneca, Novo Nordisk, Eli Lilly, Janssen, and Gilead for this study; grants and contracts outside the submitted work through the University of Michigan with the NIH, Chan Zuckerberg Initiative, JDRF, Roche, Goldfinch Bio, Boehringer-Ingelheim, Moderna, European Union Innovative Medicine Initiative, Certa, Chinook, amfAR, Angion Pharmaceuticals, RenalytixAI, Travere Therapeutics, Regeneron, IONIS Pharmaceuticals, and Maze Therapeutics; and consulting fees through the University of Michigan from Astellas, Poxel, Janssen, and Novo Nordisk; and serves on the NIH–National Center for Advancing Translational Sciences Council and the Nephcure Kidney International Board. MK and WJ have a patent— PCT/EP2014/073413 “Biomarkers and methods for progression prediction for chronic kidney disease”—licensed. SE reports receiving funding through the University of Michigan from AstraZeneca, Novo Nordisk, Eli Lilly, Janssen, and Gilead for this study; and unrelated support from Ionis, Moderna, American Foundation for AIDS Research, Certa, and Chinook. UDP reports serving on the Board of Directors of Kidney Health Initiative. WJ reports serving as co-investigator on grants funded by Gilead Sciences, Novo Nordisk, AstraZeneca, Jannsen, and Eli Lilly. UDP reports serving on the Board of Directors of Kidney Health Initiative and Goldfinch Bio, Board of Directors (non-voting member). AR, TS, IH, SM, JMW, and RB report being employees of AstraZeneca, and JMW and UDP report being shareholders of AstraZeneca. SSB, JTL, and UDP report being employees and shareholders of Gilead. JTL reports receiving consulting fees from GyanRx Sciences and Aerovate Therapeutics, unrelated to this work. SSB reports owning stock in Agios Pharmaceuticals. CMQ reports being an employee and shareholder of Vifor Pharma. JDW and AK reports being employees of Novo Nordisk, and JDW reports being a shareholder of Novo Nordisk. KLD reports being an employee of Eli Lilly, and Drs. Breyer and Duffin report being stockholders of Eli Lilly. MDB and MCM report being employees and shareholders of Johnson & Johnson. LB reports receiving funding, outside this work, from NephCure; receiving consulting fees from Vertex, Sangamo, and Protalix; being a member of the steering and clinical trials committees of the International Society of Glomerular Diseases, and being a member of the scientific advisory boards of NephCure and Vertex. JBH reports receiving funding through the NIH, outside of the current work. All the other authors declared no competing interests. All the other authors report having no personal relationships that could have appeared to influence the work reported in this paper.
DATA STATEMENT
The transcriptomic data supporting the findings of this study are available in the public domain in the Gene Expression Omnibus (GEO) repository GSE104954, GSE108112, GSE69438, GSE30122, and GSE142025, and can be downloaded from http://karokidney.org/rna-seq-dn/.22 Access to the SomaLogic SOMAscan affinity-based aptamer proteomics data can be requested from the consortium via an ancillary application at https://kidneycenter.med.umich.edu/clinical-phenotyping-resource-biobank-core. All data resulting from this study are available in the main text or in the Supplementary Materials and can be browsed on kidneyclass.org.
REFERENCES
- 1.Jager KJ, Kovesdy C, Langham R, et al. A single number for advocacy and communication—worldwide more than 850 million individuals have kidney diseases. Nephrol Dial Transplant. 2019;34:1803–1805. [DOI] [PubMed] [Google Scholar]
- 2.Bikbov B, Purcell CA, Levey AS, et al. Global, regional, and national burden of chronic kidney disease, 1990–2017: a systematic analysis for the Global Burden of Disease Study 2017. Lancet. 2020;395:709–733. [DOI] [PMC free article] [PubMed] [Google Scholar]
- 3.Carney EF. The impact of chronic kidney disease on global health. Nat Rev Nephrol. 2020;16:251. [DOI] [PubMed] [Google Scholar]
- 4.Chapter 1: Definition and classification of CKD. Kidney Int Suppl (2011). 2013;3:19–62. [DOI] [PMC free article] [PubMed] [Google Scholar]
- 5.Eckardt K-U, Coresh J, Devuyst O, et al. Evolving importance of kidney disease: from subspecialty to global health burden. Lancet. 2013;382:158–169. [DOI] [PubMed] [Google Scholar]
- 6.Hsu C-y Chertow GM. Chronic renal confusion: insufficiency, failure, dysfunction, or disease. Am J Kidney Dis. 2000;36:415–418. [DOI] [PubMed] [Google Scholar]
- 7.Zoccali C, Vanholder R, Massy ZA, et al. The systemic nature of CKD. Nat Rev Nephrol. 2017;13:344. [DOI] [PubMed] [Google Scholar]
- 8.Levey AS, Levin A. A rebuttal to “The CKD Classification System in the Precision Medicine Era”. Clin J Am Soc Nephrol. 2017;12:1711–1713. [DOI] [PMC free article] [PubMed] [Google Scholar]
- 9.Hall YN, Himmelfarb J. The CKD classification system in the precision medicine era. Clin J Am Soc Nephrol. 2017;12:346–348. [DOI] [PMC free article] [PubMed] [Google Scholar]
- 10.Mariani LH, Pendergraft WF 3rd, Kretzler M. Defining glomerular disease in mechanistic terms: implementing an integrative biology approach in nephrology. Clin J Am Soc Nephrol. 2016;11:2054–2060. [DOI] [PMC free article] [PubMed] [Google Scholar]
- 11.Mariani LH, Kretzler M. Pro: ‘The usefulness of biomarkers in glomerular diseases’. The problem: moving from syndrome to mechanism–individual patient variability in disease presentation, course and response to therapy. Nephrol Dial Transplant. 2015;30:892–898. [DOI] [PMC free article] [PubMed] [Google Scholar]
- 12.Gluck C, Ko YA, Susztak K. Precision medicine approaches to diabetic kidney disease: tissue as an issue. Curr Diab Rep. 2017;17:30. [DOI] [PMC free article] [PubMed] [Google Scholar]
- 13.Luciano RL, Moeckel GW. Update on the native kidney biopsy: core curriculum 2019. Am J Kidney Dis. 2019;73:404–415. [DOI] [PubMed] [Google Scholar]
- 14.Bhavnani SK, Eichinger F, Martini S, et al. Network analysis of genes regulated in renal diseases: implications for a molecular-based classification. BMC Bioinformatics. 2009;10(Suppl 9):S3. [DOI] [PMC free article] [PubMed] [Google Scholar]
- 15.Mariani LH, Martini S, Barisoni L, et al. Interstitial fibrosis scored on whole-slide digital imaging of kidney biopsies is a predictor of outcome in proteinuric glomerulopathies. Nephrol Dial Transplant. 2018;33:310–318. [DOI] [PMC free article] [PubMed] [Google Scholar]
- 16.Kohonen T Exploration of very large databases by self-organizing maps. Proc Int Conf Neural Netw (ICNN’97). 1997;1:PL1–PL6. [Google Scholar]
- 17.Törönen P, Kolehmainen M, Wong G, et al. Analysis of gene expression data using self-organizing maps. FEBS Lett. 1999;451:142–146. [DOI] [PubMed] [Google Scholar]
- 18.Yasuda Y, Cohen CD, Henger A, et al. Gene expression profiling analysis in nephrology: towards molecular definition of renal disease. Clin Exp Nephrol. 2006;10:91–98. [DOI] [PubMed] [Google Scholar]
- 19.Barisoni L, Nast CC, Jennette JC, et al. Digital pathology evaluation in the multicenter Nephrotic Syndrome Study Network (NEPTUNE). Clin J Am Soc Nephrol. 2013;8:1449–1459. [DOI] [PMC free article] [PubMed] [Google Scholar]
- 20.Troost JP, Hawkins J, Jenkins DR, et al. Consent for genetic biobanking in a diverse multisite CKD cohort. Kidney Int Rep. 2018;3:1267–1275. [DOI] [PMC free article] [PubMed] [Google Scholar]
- 21.Shubin AV, Kollar B, Dillon ST, et al. Blood proteome profiling using aptamer-based technology for rejection biomarker discovery in transplantation. Sci Data. 2019;6:314. [DOI] [PMC free article] [PubMed] [Google Scholar]
- 22.Levin A, Reznichenko A, Witasp A, et al. Novel insights into the disease transcriptome of human diabetic glomeruli and tubulointerstitium. Nephrol Dial Transplant. 2020;35:2059–2072. [DOI] [PMC free article] [PubMed] [Google Scholar]
- 23.Löffler-Wirth H, Kalcher M. Binder H. oposSOM: R-package for high-dimensional portraying of genome-wide expression landscapes on bioconductor. Bioinformatics. 2015;31:3225–3227. [DOI] [PubMed] [Google Scholar]
- 24.Cohen CD, Kretzler M. [Gene expression analyses of kidney biopsies: the European renal cDNA bank–Kröner-Fresenius biopsy bank]. Pathologe. 2009;30:101–104 [in German]. [DOI] [PubMed] [Google Scholar]
- 25.Gadegbeku CA, Gipson DS, Holzman LB, et al. Design of the Nephrotic Syndrome Study Network (NEPTUNE) to evaluate primary glomerular nephropathy by a multidisciplinary approach. Kidney Int. 2013;83:749–756. [DOI] [PMC free article] [PubMed] [Google Scholar]
- 26.Sethi S, D’Agati VD, Nast CC, et al. A proposal for standardized grading of chronic changes in native kidney biopsy specimens. Kidney Int. 2017;91:787–789. [DOI] [PubMed] [Google Scholar]
- 27.Muruve DA, Mann MC, Chapman K, et al. The biobank for the molecular classification of kidney disease: research translation and precision medicine in nephrology. BMC Nephrol. 2017;18:252. [DOI] [PMC free article] [PubMed] [Google Scholar]
- 28.Sampson MG, Hodgin JB, Kretzler M. Defining nephrotic syndrome from an integrative genomics perspective. Pediatr Nephrol. 2015;30:51–63. quiz 59. [DOI] [PMC free article] [PubMed] [Google Scholar]
- 29.Braun L, Sood V, Hogue S, et al. High burden and unmet patient needs in chronic kidney disease. Int J Nephrol Renovasc Dis. 2012;5:151–163. [DOI] [PMC free article] [PubMed] [Google Scholar]
- 30.Wyatt CM, Schlondorff D. Precision medicine comes of age in nephrology: identification of novel biomarkers and therapeutic targets for chronic kidney disease. Kidney Int. 2016;89:734–737. [DOI] [PubMed] [Google Scholar]
- 31.De Vriese AS, Sethi S, Van Praet J, et al. Kidney disease caused by dysregulation of the complement alternative pathway: an etiologic approach. J Am Soc Nephrol. 2015;26:2917–2929. [DOI] [PMC free article] [PubMed] [Google Scholar]
- 32.Sun L, Zou LX, Chen MJ. Make precision medicine work for chronic kidney disease. Med Princ Pract. 2017;26:101–107. [DOI] [PMC free article] [PubMed] [Google Scholar]
- 33.Iatropoulos P, Daina E, Curreri M, et al. Cluster analysis identifies distinct pathogenetic patterns in C3 glomerulopathies/immune complex–mediated membranoproliferative GN. J Am Soc Nephrol. 2018;29:283. [DOI] [PMC free article] [PubMed] [Google Scholar]
- 34.Banchereau R, Hong S, Cantarel B, et al. Personalized immunomonitoring uncovers molecular networks that stratify lupus patients. Cell. 2016;165:551–565. [DOI] [PMC free article] [PubMed] [Google Scholar]
- 35.Pozdzik A, Touzani F, Brochériou I, et al. Molecular classification of membranous nephropathy. Curr Opin Nephrol Hypertens. 2019;28:336–344. [DOI] [PubMed] [Google Scholar]
- 36.Mihai S, Codrici E, Popescu ID, et al. Inflammation-related mechanisms in chronic kidney disease prediction, progression, and outcome. J Immunol Res. 2018;2018:2180373. [DOI] [PMC free article] [PubMed] [Google Scholar]
- 37.Ratliff BB, Abdulmahdi W, Pawar R, et al. Oxidant mechanisms in renal injury and disease. Antioxid Redox Signal. 2016;25:119–146. [DOI] [PMC free article] [PubMed] [Google Scholar]
- 38.Apoptosis Portilla D., fibrosis and senescence. Nephron Clin Pract. 2014;127:65–69. [DOI] [PubMed] [Google Scholar]
- 39.Speeckaert MM, Speeckaert R, Laute M, et al. Tumor necrosis factor receptors: biology and therapeutic potential in kidney diseases. Am J Nephrol. 2012;36:261–270. [DOI] [PubMed] [Google Scholar]
- 40.Owens EP, Vesey DA, Kassianos AJ, et al. Biomarkers and the role of mast cells as facilitators of inflammation and fibrosis in chronic kidney disease. Transl Androl Urol. 2019;8(Suppl 2):S175–S183. [DOI] [PMC free article] [PubMed] [Google Scholar]
- 41.Kostadinova-Kunovska S, Petrusevska G, Jovanovic R, et al. Morphological changes in the tubulointerstitial compartment in primary glomerulopathies. Prilozi. 2007;28:61–74. [PubMed] [Google Scholar]
- 42.Srivastava A, Palsson R, Kaze AD, et al. The prognostic value of histopathologic lesions in native kidney biopsy specimens: results from the Boston Kidney Biopsy Cohort Study. J Am Soc Nephrol. 2018;29:2213–2224. [DOI] [PMC free article] [PubMed] [Google Scholar]
- 43.Rodríguez-Iturbe B, Johnson RJ, Herrera-Acosta J. Tubulointerstitial damage and progression of renal failure. Kidney Int Suppl. 2005;(99):S82–S86. [DOI] [PubMed] [Google Scholar]
- 44.Eddy S, Mariani LH, Kretzler M. Integrated multi-omics approaches to improve classification of chronic kidney disease. Nat Rev Nephrol. 2020;16:657–668. [DOI] [PubMed] [Google Scholar]
- 45.Eddy S, Nair V, Mariani LH, et al. Inflammatory and JAK-STAT pathways as shared molecular targets for ANCA-associated vasculitis and nephrotic syndrome. bioRxiv. 2018:427898. [Google Scholar]
- 46.Mariani LH, Eddy S, Martini S, et al. Redefining nephrotic syndrome in molecular terms: outcome-associated molecular clusters and patient stratification with noninvasive surrogate biomarkers. bioRxiv. 2018:427880. [Google Scholar]
- 47.Tomilo M, Ascani H, Mirel B, et al. Renal Pre-Competitive Consortium (RPC(2)): discovering therapeutic targets together. Drug Discov Today. 2018;23:1695–1699. [DOI] [PubMed] [Google Scholar]
Associated Data
This section collects any data citations, data availability statements, or supplementary materials included in this article.
Supplementary Materials
Supplementary Table S1. Differentially expressed genes per chronic kidney disease (CKD) molecular category versus healthy controls.
Supplementary Table S2. Enriched pathways per chronic kidney disease (CKD) molecular category.
Supplementary Acknowledgment—NEPTUNE.
Supplementary Methods.
Supplementary References.
Supplementary Figure S1. Data clustering tendency assessment: (A) pairwise Spearman correlation-based distances between samples; (B) VAT, visual assessment of cluster tendency.
Supplementary Figure S2. Self-organizing map model optimization: quantization error versus (A) map size; (B) convergence—embedding accuracy and topographic accuracy; (C) learning progress across 10 independent models.
Supplementary Figure S3. Final model Self-Organizing Maps (SOM) diagnostic plots: (A) counts; (B) mapping quality; (C) neighbor distances; (D) number of clusters.
Supplementary Figure S4. Global gene expression levels across chronic kidney disease (CKD) molecular categories.
Supplementary Figure S5. Levels of estimated glomerular filtration rate (eGFR) per molecular category stratified by chronic kidney disease (CKD) stage.
Supplementary Figure S6. Distributions of mapping distances for study cohorts and permuted data (negative control).
Supplementary Figure S7. Kaplan–Meier survival curves for prediction of end-stage kidney disease (ESKD) outcome stratified by (A) chronic kidney disease (CKD) stage and (B) histopathologic diagnosis.
Supplementary Figure S8. Boxplots of interstitial fibrosis quantitative histopathology values stratified by chronic kidney disease (CKD) molecular category in Nephrotic Syndrome Study Network (NEPTUNE) cohort.
Supplementary Table S3. Upstream transcriptional regulators per chronic kidney disease (CKD) molecular category.
Supplementary Table S4. Correlation between chronic kidney disease (CKD) molecular category gene expression and (A) interstitial fibrosis (IF) and (B) tubular atrophy (TA) values.
Supplementary Table S5. Chronic kidney disease (CKD)-Gold signature in urine.
Data Availability Statement
The transcriptomic data supporting the findings of this study are available in the public domain in the Gene Expression Omnibus (GEO) repository GSE104954, GSE108112, GSE69438, GSE30122, and GSE142025, and can be downloaded from http://karokidney.org/rna-seq-dn/.22 Access to the SomaLogic SOMAscan affinity-based aptamer proteomics data can be requested from the consortium via an ancillary application at https://kidneycenter.med.umich.edu/clinical-phenotyping-resource-biobank-core. All data resulting from this study are available in the main text or in the Supplementary Materials and can be browsed on kidneyclass.org.