

Abstract
Background
This study aimed to evaluate the service quality in Iranian hospitals from patients' perspectives based on the SERVQUAL model.
Materials and Methods
A thorough exploration of online electronic databases, including Scopus, PubMed, Web of Science, IranMedex, and the Scientific Information Database (SID), was undertaken using keywords extracted from Medical Subject Headings such as “Quality of Health Care,” “Hospital,” and “Patients” spanning from the earliest available records up to August 11, 2023.
Results
In the context of 25 cross‐sectional studies encompassing a collective participant pool of 8021 hospitalized patients in Iranian medical facilities, an assessment of patients' perspectives on the quality of hospital services revealed a mean perception score of 3.54 (SE = 0.08). Concurrently, the mean expectation score for the quality of services was determined to be 4.43 (SE = 0.06). Using the SERVQUAL model, the overall disparity between patients' perceptions and expectations was calculated as −0.89. Subsequent examination of specific dimensions within the SERVQUAL framework revealed gaps between patients' perceptions and expectations in the tangibility dimension (−0.84), reliability dimension (−0.94), responsiveness dimension (−0.91), assurance dimension (−0.89), and empathy dimension (−0.82).
Conclusion
Therefore, healthcare administrators consider the study's findings as a motivating force to initiate measures aimed at improving service quality in Iranian hospitals. Tackling the recognized shortcomings and areas requiring enhancement holds the promise of raising patient satisfaction levels and, consequently, improving overall healthcare outcomes.
Keywords: hospital, meta‐analysis, patients, quality of healthcare, systematic review
1. Introduction
Evaluating the quality of services offered in hospitals, which play a crucial role in the healthcare system, holds significant importance [1, 2]. Hospitals and health centers serve a large number of clients, making it essential to prioritize a patient‐centered approach and improve service quality to effectively address their needs [3, 4].
Traditionally, the evaluation of quality has centered on the attributes inherent to goods and services. However, this conceptualization has evolved to encompass a dual perspective that integrates both technical quality and perceived quality, acknowledging the synergistic relationship between these dimensions [5, 6]. Service quality can be described as the variance between what customers expect and what they perceive [7]. Service quality is assessed based on how effectively a client's expectations and needs are fulfilled, as evaluated and perceived by the client [8].
Among the essential indicators of health service quality, the patient's perspective serves as a fundamental standard for evaluating the quality of hospital services [9]. Patient‐centeredness is a crucial factor for hospitals' success, making patients the key measure for evaluating service quality. if a hospital's services exceed the patients' expectations, it signifies the delivery of high‐quality care [10]. Patients whose perception of service quality is in line with their expectations are more likely to adhere to treatment and care recommendations, which subsequently leads to improved treatment results [11]. Researchers have identified five key factors that clients consider fundamental in determining healthcare quality: friendly relationships, medical staff competence, equipment and technology, service accessibility, and distinctiveness [12].
The SERVQUAL model, introduced by Parasuraman et al. in 1980, is a tool for evaluating service quality based on the differences between customers' expectations and perceptions [13]. Initially used in economics, it is now increasingly applied in healthcare due to its customer‐centric approach. The model is built on the premise that patients can distinguish between their expected service and the actual service received [14]. It encompasses five dimensions: tangibles (facilities, equipment, and staff appearance), reliability (safe and dependable services), responsiveness (prompt handling of inquiries and complaints), assurance (staff competence and trust‐building), and empathy (understanding and addressing client needs). This model aids managers in identifying service gaps and understanding their causes [13].
This article highlights the importance of integrating findings from studies focused on hospital service quality to provide policymakers with informed recommendations. It notes a lack of previous meta‐analyses, specifically investigating service quality in Iranian hospitals from patients' perspectives using the SERVQUAL model. In a prior meta‐analysis, the service quality in Iranian hospitals was assessed only in 13 included studies, and the service quality of Iranian hospitals was not evaluated based on the SERVQUAL model [15]. This study undertakes a comparative analysis of hospital service quality as perceived by patients across various provinces, juxtaposed against Tehran, the capital province. Additionally, it delves into the changes in patients' perceptions and expectations over the years regarding hospital service quality, a facet heretofore overlooked in extant literature. To address this gap, the current systematic review and meta‐analysis aim to provide a comprehensive overview of hospital service quality in Iran, focusing on evaluating service quality through the SERVQUAL model.
2. Methods
The Preferred Reporting Items for Systematic Reviews and Meta‐Analyses (PRISMA) checklist was used to conduct the systematic review and meta‐analysis (Table S1) [16]. This systematic review and meta‐analysis study have been registered in the International Prospective Register of Systematic Reviews (PROSPERO) database (CRD42023457467). Given the nature of this investigation as a systematic review involving the scrutiny of previously published research, it is noteworthy that the acquisition of patient‐informed consent and ethical approval was deemed unnecessary.
2.1. Search Strategy
A thorough exploration of online electronic databases, including Scopus, PubMed, Web of Science, IranMedex, and the Scientific Information Database (SID), was undertaken using keywords extracted from Medical Subject Headings such as “Quality of Health Care,” “Hospital,” and “Patients” spanning from the earliest available records up to August 11, 2023. To illustrate, the search strategy in the PubMed/MEDLINE database encompassed terms such as ((“Service quality”) OR (“Quality of healthcare”) OR (“Quality of care”)) AND ((“SERVQUAL”) OR (“SERVQUAL model”)) AND ((“Patients”) OR (“Patients perception”) OR (“Patients expectation”)) AND ((“Hospital”) OR (“Medical center”)). Keywords were combined using Boolean operators (AND/OR) to merge concepts. For searching electronic Persian databases, Persian keyword equivalents were applied. In each search phase, two researchers conducted the process independently. When differences of opinion arose between the two researchers, a third reviewer was consulted to provide an assessment.
2.2. Inclusion and Exclusion Criteria
This systematic review and meta‐analysis encompassed cross‐sectional studies written in both English and Persian. These studies specifically addressed the evaluation of service quality in Iranian hospitals from the perspectives of patients, using the SERVQUAL model. The SERVQUAL questionnaire comprises five dimensions encompassing a total of 30 items that assess both perceptions and expectations within a specified domain. These dimensions are categorized into two subgroups: perceptions and expectations, each consisting of 15 questions. The Likert scale serves as the foundational scoring mechanism, ranging from 1 to 5, where a score of 1 represents the lowest rank, and a score of 5 denotes the highest rating. Specifically, the questionnaire addresses questions 1–3 about tangibility, questions 4–6 addressing reliability, questions 7–9 focusing on responsiveness, questions 10–13 exploring assurance, and questions 14 and 15 centering on empathy [17]. The review excluded types of literature such as reviews, case reports, conference proceedings, editorials, experiments, and qualitative research designs.
2.3. Study Selection
Data management was facilitated using the EndNote 20 software. Study selection based on inclusion and exclusion criteria involved several steps: (1) initial identification of duplicate articles, using both electronic and manual methods; (2) assessment of the titles and abstracts of the studies; and (3) in‐depth review of the complete texts of the publications. Additionally, a review of the reference lists of relevant research was conducted to prevent any inadvertent omission of significant data.
2.4. Data Extraction and Quality Assessment
Data extraction from the articles included in this systematic review and meta‐analysis encompassed details such as the primary author's name, publication year, geographical location, number and types of hospitals, sample size, gender distribution, age, education level, hospital visit frequency, and utilization of the SERVQUAL model. The assessment of study quality within this review was conducted using the Appraisal tool for Cross‐Sectional Studies (AXIS tool). This evaluation instrument comprises 20 items, each rated on a 2‐point Likert scale denoting “yes” (score of 1) or “no” (score of 0). The tool gauges study quality across three domains: report quality (seven items), study design quality (seven items), and potential bias introduction (six items). The final assessment by AXIS categorizes study quality into three levels: high (70%–100%), fair (60%–69.9%), and low (0%–59.9%) [18]. Both data extraction and quality assessment were independently performed by two researchers. In instances where there was a disparity of opinion between the two researchers, a third reviewer provided an evaluation.
2.5. Statistical Analysis
The analysis utilized version 3 of the CMA program. Each study's weight was determined by its inverse variance. Heterogeneity among the studies was visualized using a forest plot. The forest plots depict the mean perception and expectation of SERVQUAL scores for individual studies and the overall mean score. The heterogeneity level was gauged by I 2 statistics: 25% for mild, 50% for moderate, and 75% for high heterogeneity. Given significant result variability, a random effects model was used. To probe study heterogeneity, subgroup analyses with meta‐regression were conducted. Meta‐regression analyzed the relationship between the SERVQUAL score and study year. For study‐specific variables such as location, subgroup analyses were done to investigate the mean SERVQUAL score.
2.6. Sensitivity Analysis
A sensitivity analysis was conducted to evaluate the impact of excluding each study on the mean perception and expectation of patients on service quality based on the SERVQUAL model.
2.7. Publication of Bias
To evaluate the potential for publication bias, the Egger's test results and a Funnel plot were utilized.
3. Results
3.1. Study Selection
As shown in Figure 1, following an extensive search of electronic resources, a total of 1999 studies were initially identified. Among these, 632 duplicate items were removed. After this process, there were 1367 remaining papers. Of these, 41 studies were deemed ineligible for inclusion in this systematic review because they did not meet the cross‐sectional study criteria, and 1274 articles did not align with the study's objectives and were subsequently excluded. An additional 20 studies were disregarded due to insufficient methodology or results, and seven studies were omitted due to a lack of available data after a thorough evaluation of the full‐text publications. Consequently, the systematic review comprised 25 selected studies [9, 10, 13, 19, 20, 21, 22, 23, 24, 25, 26, 27, 28, 29, 30, 31, 32, 33, 34, 35, 36, 37, 38, 39, 40].
Figure 1.
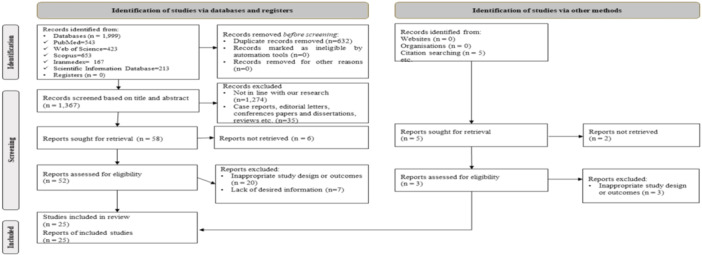
Flow diagram of the study selection process.
3.2. Study Characteristics
As shown in Table 1, in 25 cross‐sectional studies [9, 10, 13, 19, 20, 21, 22, 23, 24, 25, 26, 27, 28, 29, 30, 31, 32, 33, 34, 35, 36, 37, 38, 39, 40], a collective total of 8021 patients who were hospitalized in Iranian hospitals took part. Among the participants, 50.7% were men. The average age of the patients was 40.99 (SD = 0.97).
Table 1.
Basic characteristics of the included studies in this systematic review and meta‐analysis.
| First author/year | Location (province) | Number of hospitals | Type of hospitals | Sample size | M/F ratio (%) | Age (mean ± SD) | Level of education (%) | Hospital visit frequency (%) | SERVQUAL (mean ± SD) | AXIS Score | |||||
|---|---|---|---|---|---|---|---|---|---|---|---|---|---|---|---|
| Tangibility | Reliability | Responsiveness | Assurance | Empathy | Total | ||||||||||
| Mohammadi et al. (2004) [27] | Zanjan | N/A | N/A | 256 | N/A | N/A | N/A | N/A |
Perception: 3.03 Expectation: 4.17 Gap: −1.13 Sig: p < 0.001 |
Perception: 2.91 Expectation: 4.20 Gap: −1.29 Sig: p < 0.001 |
Perception: 2.84 Expectation: 4.08 Gap: −1.23 Sig: p < 0.001 |
Perception: 2.77 Expectation: 4.07 Gap: −1.30 Sig: p < 0.001 |
Perception: 2.74 Expectation: 4.01 Gap: −1.27 Sig: p < 0.001 |
Perception: 2.86 Expectation: 4.11 Gap: −1.25 Sig: p < 0.001 |
Fair |
| Jannaabadi et al. (2011) [26] | Sistan and Baluchistan | N/A | N/A | 200 | 59.00/41.00 | N/A |
Diploma or under diploma: 183 (91.50) Above diploma: 17 (8.50) |
N/A |
Perception: 4.25 Expectation: 4.94 Gap: −0.69 Sig: p < 0.001 |
Perception: 4.19 Expectation: 4.88 Gap: −0.685 Sig: p < 0.001 |
Perception: 4.13 Expectation: 4.92 Gap: −0.79 Sig: p < 0.001 |
Perception: 4.08 Expectation: 4.83 Gap: −0.75 Sig: p < 0.001 |
Perception: 3.97 Expectation: 4.81 Gap: −0.84 Sig: p < 0.001 |
Perception: 4.17 Expectation: 4.95 Gap: −0.77 Sig: p < 0.001 |
High |
| Nekoei‐Moghadam and Amiresmaili (2011) [29] | Kerman | 3 | Government hospital | 385 | 54.29/45.71 | 37.99 (SD = 15.86) |
Under diploma: 176 (45.71) Diploma: 162 (42.08) Above diploma: 47 (12.21) |
N/A |
Perception: 3.29 Expectation: 4.64 Gap: −1.35 Sig: p < 0.05 |
Perception: 3.54 Expectation: 4.74 Gap: −1.20 Sig: p < 0.05 |
Perception: 3.35 Expectation: 4.64 Gap: −1.29 Sig: p < 0.05 |
Perception: 3.67 Expectation: 4.59 Gap: −0.92 Sig: p < 0.05 |
Perception: 3.67 Expectation: 4.64 Gap: −0.97 Sig: p < 0.05 |
Perception: 3.51 Expectation: 4.65 Gap: −1.14 Sig: p < 0.05 |
Fair |
| Hekmatpou et al. (2012) [24] | Markazi | N/A | Government hospital | 260 | 46.15/53.85 | 39.89 (SD = 21.17) |
Under diploma: 116 (44.62) Diploma: 100 (38.46) University: 44 (16.92) |
N/A |
Perception: 3.66 (SD = 1.02) Expectation: 4.96 (SD = 0.15) Gap: −1.30 Sig: p < 0.001 |
Perception: 3.76 (SD = 0.96) Expectation: 4.97 (SD = 0.27) Gap: −1.20 Sig: p < 0.001 |
Perception: 3.65 (SD = 1.07) Expectation: 4.94 (SD = 0.42) Gap: −1.29 Sig: p < 0.001 |
Perception: 3.80 (SD = 0.99) Expectation: 4.96 (SD = 0.29) Gap: −1.16 Sig: p < 0.001 |
Perception: 3.61 (SD = 1.07) Expectation: 4.94 (SD = 0.56) Gap: −1.33 Sig: p < 0.001 |
Perception: 3.70 (SD = 1.02) Expectation: 4.95 (SD = 0.34) Gap: −1.25 Sig: p < 0.001 |
High |
| Razlansari et al. (2012) [31] | Kermanshah | 5 | Government hospital | 400 | 47.75/52.25 | 35.00 (SD = 9.40) | N/A | N/A |
Perception: 3.65 (SD = 0.57) Expectation: 4.48 (SD = 0.43) Gap: −0.83 Sig: p < 0.001 |
Perception: 3.44 (SD = 0.81) Expectation: 4.53 (SD = 0.39) Gap: −1.09 Sig: p < 0.001 |
Perception: 3.62 (SD = 0.67) Expectation: 4.65 (SD = 0.31) Gap: −1.03 Sig: p < 0.001 |
Perception: 3.74 (SD = 0.82) Expectation: 4.64 (SD = 0.30) Gap: −0.90 Sig: p < 0.001 |
Perception: 3.89 (SD = 0.88) Expectation: 4.55 (SD = 0.32) Gap: −0.66 Sig: p < 0.001 |
Perception: 3.67 (SD = 0.51) Expectation: 4.57 (SD = 0.38) Gap: −0.90 Sig: p < 0.001 |
High |
| Tabibi et al. (2012) [38] | Tehran | 6 | N/A | 240 | N/A | N/A | N/A | N/A |
Perception: 3.70 Expectation: 4.57 Gap: −0.87 Sig: p < 0.001 |
Perception: 3.36 Expectation: 4.50 Gap: −1.14 Sig: p < 0.001 |
Perception: 3.39 Expectation: 4.59 Gap: −1.20 Sig: p < 0.001 |
Perception: 3.49 Expectation: 4.24 Gap: −0.75 Sig: p < 0.001 |
Perception: 3.44 Expectation: 4.65 Gap: −1.21 Sig: p < 0.001 |
Perception: 3.48 Expectation: 4.51 Gap: −1.03 Sig: p < 0.001 |
Fair |
| Zarei et al. (2012) [40] | Tehran | 8 | Private hospitals | 983 | 45.98/54.02 | 47.9 (SD = 16.97) | N/A | N/A |
Perception: 4.18 (SD = 0.62) Expectation: 4.95 (SD = 0.18) Gap: −0.77 Sig: p < 0.001 |
Perception: 4.05 (SD = 0.71) Expectation: 4.93 (SD = 0.21) Gap: −0.88 Sig: p < 0.001 |
Perception: 4.06 (SD = 0.74) Expectation: 4.92 (SD = 0.25) Gap: −0.86 Sig: p < 0.001 |
Perception: 4.11 (SD = 0.70) Expectation: 4.94 (SD = 0.20) Gap: −0.83 Sig: p < 0.001 |
Perception: 3.78 (SD = 0.78) Expectation: 4.85 (SD = 0.34) Gap: −1.07 Sig: p < 0.001 |
Perception: 4.02 (SD = 0.63) Expectation: 4.92 (SD = 0.20) Gap: −0.90 Sig: p < 0.001 |
High |
| Gorji et al. (2013) [21] | Tehran | 1 | Government hospital | 116 | 59.48/40.51 | 43.38 |
Under diploma: 49 (42.24) Diploma: 43 (37.07) Above diploma: 24 (20.69) |
1st: 66 (56.90) 2nd or higher: 50 (43.10) |
Perception: 3.63 Expectation: 4.67 Gap: ‐1.04 Sig: p < 0.05 |
Perception: 3.73 Expectation: 4.71 Gap: −0.98 Sig: p < 0.05 |
Perception: 3.64 Expectation: 4.64 Gap: −0.10 Sig: p < 0.05 |
Perception: 4.03 Expectation: 4.72 Gap: −0.69 Sig: p < 0.05 |
Perception: 3.68 Expectation: 4.66 Gap: −0.98 Sig: p < 0.05 |
Perception: 3.74 Expectation: 4.68 Gap: −0.94 Sig: p < 0.05 |
High |
| Aghamolaei et al. (2014) [23] | Hormozgan | 1 | Government hospital | 89 | 64.04/35.94 | 32.90 (SD = 10.50) | N/A | N/A |
Perception: 3.42 (SD = 0.83) Expectation: 4.73 (SD = 0.40) Gap: −1.30 (SD = 0.96) Sig: p < 0.001 |
Perception: 3.49 (SD = 0.72) Expectation: 4.72 (SD = 0.43) Gap: −1.22 (SD = 0.87) Sig: p < 0.001 |
Perception: 3.34 (SD = 0.81) Expectation: 4.76 (SD = 0.38) Gap: −1.42 (SD = 0.91) Sig: p < 0.001 |
Perception: 3.56 (SD = 0.86) Expectation: 4.76 (SD = 0.47) Gap: −1.20 (SD = 0.96) Sig: p < 0.001 |
Perception: 3.39 (SD = 0.80) Expectation: 4.69 (SD = 0.47) Gap: −1.31 (SD = 0.96) Sig: p < 0.001 |
Perception: 3.44 (SD = 0.69) Expectation: 4.73 (SD = 0.34) Gap: −1.29 (SD = 0.81) Sig: p < 0.001 |
High |
| Anbari et al. (2014) [34] | Markazi | 3 | Government hospital | 385 | 54.3/45.7 | 37.99 (SD = 15.86) |
Under diploma: 176 (45.71) Diploma and associated: 162 (42.08) Bachelor's and higher: 47 (12.21) |
N/A |
Perception: 3.31 Expectation: 4.64 Gap: −1.33 Sig: p < 0.05 |
Perception: 3.54 Expectation: 4.74 Gap: −1.20 Sig: p < 0.05 |
Perception: 3.35 Expectation: 4.64 Gap: −1.29 Sig: p < 0.05 |
Perception: 3.67 Expectation: 4.59 Gap: −1.28 Sig: p < 0.05 |
Perception: 3.67 Expectation: 4.64 Gap: −0.97 Sig: p < 0.05 |
Perception: 3.51 Expectation: 4.65 Gap: −1.14 Sig: p < 0.05 |
High |
| Sina et al. (2015) [37] | Mazandaran | 1 | Government hospital | 331 | 55.29/44.71 | N/A |
Under diploma or diploma: 101 (30.51) Above diploma: 230 (69.49) |
N/A |
Perception: 2.98 (SD = 0.57) Expectation: 4.00 (SD = 0.57) Gap: −1.02 Sig: p < 0.001 |
Perception: 2.50 (SD = 0.67) Expectation: 4.17 (SD = 0.59) Gap: −1.67 Sig: p < 0.001 |
Perception: 2.79 (SD = 0.72) Expectation: 4.14 (SD = 0.74) Gap: −1.35 Sig: p < 0.001 |
Perception: 1.91 (SD = 0.77) Expectation: 3.90 (SD = 0.73) Gap: −1.99 Sig: p < 0.001 |
Perception: 3.25 (SD = 0.54) Expectation: 4.30 (SD = 0.49) Gap: −1.05 Sig: p < 0.001 |
Perception: 2.69 (SD = 0.26) Expectation: 4.10 (SD = 0.28) Gap: −1.41 Sig: p < 0.001 |
Fair |
| Bahmei et al. (2016) [35] | Fars | 1 | Government hospital | 582 | 53.61/46.39 | N/A |
Under diploma: 378 (64.95) Diploma:90 (15.46) Above diploma: 114 (19.59) |
N/A |
Perception: 3.39 (SD = 0.65) Expectation: 3.75 (SD = 0.64) Gap: −0.37 (SD = 0.83) Sig: p = 0.013 |
Perception: 3.23 (SD = 0.65) Expectation: 3.55 (SD = 0.62) Gap: −0.32 (SD = 0.83) Sig: p = 0.048 |
Perception: 3.3 (SD = 0.7) Expectation: 3.61 (SD = 0.71) Gap: −0.31 (SD = 0.98) Sig: p = 0.785 |
Perception: 3.23 (SD = 0.6) Expectation: 3.78 (SD = 0.57) Gap: −0.55 (SD = 0.86) Sig: p = 0.346 |
Perception: 3.22 (SD = 0.62) Expectation: 3.62 (SD = 0.72) Gap: −0.40 (SD = 0.96) Sig: p = 0.626 |
Perception: 3.27 (SD = 0.64) Expectation: 3.66 (SD = 0.65) Gap: −0.39 Sig: p > 0.05 |
High |
| Gholami et al. (2016) [20] | Fars | 6 | N/A | 200 | 64.00/36.00 | 49.67 (SD = 16.04) | N/A | N/A |
Perception: 4.21 (SD = 0.55) Expectation: 4.50 (SD = 0.41) Gap: −0.30 (SD = 0.51) Sig: p < 0.001 |
Perception: 4.21 (SD = 0.65) Expectation: 4.81 (SD = 0.38) Gap: −0.60 (SD = 0.65) Sig: p < 0.001 |
Perception: 4.29 (SD = 0.64) Expectation: 4.80 (SD = 0.38) Gap: −0.51 (SD = 0.62) Sig: p < 0.001 |
Perception: 4.41 (SD = 0.58) Expectation: 4.77 (SD = 0.37) Gap: −0.36 (SD = 0.55) Sig: p < 0.001 |
Perception: 4.39 (SD = 0.54) Expectation: 4.61 (SD = 0.44) Gap: −0.22 (SD = 0.54) Sig: p < 0.001 |
Perception: 4.30 (SD = 0.13) Expectation: 4.72 (SD = 0.09) Gap: −0.42 Sig: p < 0.001 |
High |
| Gholami et al. (2016) [13] | Fars | 1 | Government hospital | 100 | 35.00/65.00 | 54.4 (SD = 19.35) |
Under diploma: 43 (43.00) Diploma: 29 (29.00) Above diploma: 28 (28.00) |
1st: 60 (60.00) 2nd or higher: 40 (40.00) |
Perception: 3.45 (SD = 0.86) Expectation: 4.31 (SD = 0.62) Gap: −0.86 (SD = 0.98) Sig: p < 0.001 |
Perception: 3.42 (SD = 0.86) Expectation: 4.36 (SD = 0.61) Gap: −0.94 (SD = 0.91) Sig: p < 0.001 |
Perception: 3.27 (SD = 0.89) Expectation: 4.35 (SD = 1.02) Gap: −1.08 (SD = 1.35) Sig: p < 0.001 |
Perception: 3.55 (SD = 1.04) Expectation: 4.38 (SD = 0.61) Gap: −0.83 (SD = 1.16) Sig: p < 0.001 |
Perception: 3.45 (SD = 0.8) Expectation: 4.39 (SD = 1.2) Gap: −0.94 (SD = 1.42) Sig: p < 0.001 |
Perception: 3.295 (SD = 0.75) Expectation: 4.35 (SD = 0.62) Gap: −0.97 (SD = 0.92) Sig: p < 0.001 |
High |
| Nadi et al. (2016) [28] | Mazandaran | 3 | Government hospital | 600 | 26.83/73.17 | 39.94 |
Under diploma: 115 (19.17) Diploma: 161 (26.83) Above diploma: 324 (54.00) |
N/A |
Perception: 3.93 (SD = 0.43) Expectation: 4.62 (SD = 0.47) Gap: −0.68 (SD = 0.54) Sig: p < 0.001 |
Perception: 4.31 (SD = 0.36) Expectation: 4.62 (SD = 0.47) Gap: −0.30 (SD = 0.52) Sig: p < 0.001 |
Perception: 3.89 (SD = 0.46) Expectation: 4.61 (SD = 0.48) Gap: −0.71 (SD = 0.57) Sig: p < 0.001 |
Perception: 3.82 (SD = 0.48) Expectation: 4.60 (SD = 0.46) Gap: −0.78 (SD = 0.52) Sig: p < 0.001 |
Perception: 3.97 (SD = 0.34) Expectation: 4.61 (SD = 0.47) Gap: −0.63 (SD = 0.54) Sig: p < 0.001 |
Perception: 4.00 (SD = 0.33) Expectation: 4.61 (SD = 0.45) Gap: −0.61 Sig: p < 0.001 |
High |
| Rezaei et al. (2016) [33] | Kermanshah | 7 | Government hospital | 400 | 37.00/63.00 | 38.50 (SD = 23.60) |
Under diploma or diploma: 316 (79.00) Above diploma: 84 (21.00) |
N/A |
Perception: 3.81 (SD = 1.12) Expectation: 4.61 (SD = 0.9) Gap: −0.80 Sig: p < 0.001 |
Perception: 3.65 (SD = 1.21) Expectation: 4.43 (SD = 0.8) Gap: −0.78 Sig: p < 0.001 |
Perception: 3.96 (SD = 1.45) Expectation: 4.52 (SD = 0.51) Gap: −0.56 Sig: p < 0.001 |
Perception: 3.82 (SD = 1.33) Expectation: 4.70 (SD = 0.65) Gap: −0.88 Sig: p < 0.001 |
Perception: 3.78 (SD = 1.60) Expectation: 4.65 (SD = 0.34) Gap: −0.87 Sig: p < 0.001 |
Perception: 3.80 (SD = 1.60) Expectation: 4.58 (SD = 0.59) Gap: −0.78 Sig: p < 0.001 |
High |
| Haghshenas et al. (2017) [22] | Tehran | 14 | Government hospital clinics | 231 | 38.80/61.20 | N/A |
Under diploma: 60 (26.80) Diploma and Associates degree: 69 (30.80) Bachelor: 75 (33.50) Master and higher: 20 (8.90) |
N/A |
Perception: 3.72 (SD = 0.55) Expectation: 4.41 (SD = 0.47) Gap: −0.69 Sig: p < 0.001 |
Perception: 3.59 (SD = 0.61) Expectation: 4.43 (SD = 0.48) Gap: −0.83 Sig: p < 0.001 |
Perception: 3.46 (SD = 0.66) Expectation: 4.43 (SD = 0.46) Gap: −0.97 Sig: p < 0.001 |
Perception: 3.59 (SD = 0.66) Expectation: 4.44 (SD = 0.45) Gap: −0.85 Sig: p < 0.001 |
Perception: 3.54 (SD = 0.64) Expectation: 4.34 (SD = 0.48) Gap: −0.81 Sig: p < 0.001 |
Perception: 3.59 (SD = 0.13) Expectation: 4.41 (SD = 0.10) Gap: −0.82 Sig: p < 0.001 |
High |
| Razmjoee et al. (2017) [32] | Fars | 1 | Government hospital | 98 | 68.37/31.63 | N/A |
Under diploma or diploma: 65 (66.33) Above diploma: 33 (33.67) |
N/A |
Perception: 3.38 (SD = 0.79) Expectation: 4.18 (SD = 0.67) Gap: −0.79 (SD = 1.06) Sig: p < 0.001 |
Perception: 3.26 (SD = 1.03) Expectation: 4.30 (SD = 0.71) Gap: −0.97 (SD = 1.16) Sig: p < 0.001 |
Perception: 3.50 (SD = 0.80) Expectation: 4.30 (SD = 0.69) Gap: −1.03 (SD = 1.07) Sig: p < 0.001 |
Perception: 3.27 (SD = 1.02) Expectation: 4.30 (SD = 0.64) Gap: −0.80 (SD = 1.04) Sig: p < 0.001 |
Perception: 3.23 (SD = 0.23) Expectation: 4.21 (SD = 0.68) Gap: −1.02 (SD = 0.97) Sig: p < 0.001 |
Perception: 3.36 (SD = 0.18) Expectation: 4.26 (SD = 0.14) Gap: −0.90 Sig: p < 0.001 |
High |
| Adhami Mogadam et al. (2017) [19] | Tehran | 3 | Government hospital | 405 | 37.78/62.22 | 40.08 (SD = 12.96) |
Under diploma: 124 (30.62) Diploma: 218 (53.83) Above diploma: 63 (15.55) |
N/A |
Perception: 3.21 (SD = 0.22) Expectation: 4.31 (SD = 0) Gap: −1.18 Sig: p < 0.01 |
Perception: 3.50 (SD = 0.08) Expectation: 4.34 (SD = 0) Gap: −0.84 Sig: p < 0.01 |
Perception: 3.45 (SD = 0.03) Expectation: 4.32 (SD = 0.03) Gap: −0.87 Sig: p < 0.01 |
Perception: 3.72 (SD = 0.05) Expectation: 4.35 (SD = 0) Gap: −0.63 Sig: p < 0.01 |
Perception: 3.31 (SD = 0.07) Expectation: 4.23 (SD = 0) Gap: −0.92 Sig: p < 0.01 |
Perception: 3.45 (SD = 0.24) Expectation: 4.31 (SD = 0.03) Gap: −0.86 Sig: p < 0.01 |
Fair |
| Hoseini Rostami et al. (2018) [25] | Golestan | 5 | Government and private hospitals | 369 | 48.78/51.22 | N/A |
Under diploma and diploma: 325 (88.08) Above diploma: 44 (11.92) |
N/A |
Perception: 4.00 (SD = 0.70) Expectation: 4.55 (SD = 0.56) Gap: −0.55 Sig: p = 0.001 |
Perception: 3.87 (SD = 0.72) Expectation: 4.51 (SD = 0.57) Gap: −0.61 Sig: p = 0.001 |
Perception: 2.38 (SD = 1.02) Expectation: 1.65 (SD = 0.98) Gap: 0.73 Sig: p = 0.001 |
Perception: 3.86 (SD = 0.64) Expectation: 4.32 (SD = 0.65) Gap: −0.46 Sig: p = 0.001 |
Perception: 3.06 (SD = 0.93) Expectation: 2.20 (SD = 1.09) Gap: 0.86 Sig: p = 0.001 |
Perception: 3.52 (SD = 0.27) Expectation: 3.51 (SD = 0.51) Gap: 0.01 Sig: N/A |
High |
| Qolipour et al. (2018) [30] | Khuzestan | N/A | Government and private hospitals | 250 | 69.20/30.80 | 39.00 (SD = 2.20) |
Under diploma: 65 (26.00) Diploma: 83 (33.20) Above diploma: 102 (40.80) |
1st: 131 (52.40) 2nd: 61 (24.40) 3rd: 35 (14.00) 4th or higher: 23 (9.20) |
Perception: 3.92 (SD = 0.67) Expectation: 4.61 (SD = 0.41) Gap: −0.68 Sig: p < 0.001 |
Perception: 3.00 (SD = 0.73) Expectation: 4.73 (SD = 0.38) Gap: −1.73 Sig: p < 0.001 |
Perception: 2.94 (SD = 0.74) Expectation: 4.84 (SD = 0.35) Gap: −1.89 Sig: p < 0.001 |
Perception: 3.26 (SD = 0.73) Expectation: 4.76 (SD = 0.38) Gap: −1.50 Sig: p < 0.001 |
Perception: 3.80 (SD = 0.92) Expectation: 4.82 (SD = 0.33) Gap: −1.02 Sig: p < 0.001 |
Perception: 3.38 (SD = 0.76) Expectation: 4.75 (SD = 0.37) Gap: −1.37 Sig: p < 0.001 |
High |
| Rezaei et al. (2018) [15] | East Azerbaijan | 1 | Government hospitals | 300 | 57.67/42.33 | 44.99 (SD = 17.53) |
Under diploma: 65 (26.00) Diploma: 83 (33.20) Above diploma: 102 (40.80) |
2.91 (SD = 2.75) |
Perception: 3.44 (SD = 0.87) Expectation: 4.39 (SD = 0.61) Gap: −0.95 (SD = 0.97) Sig: p < 0.01 |
Perception: 3.55 (SD = 0.80) Expectation: 4.42 (SD = 0.60) Gap: −0.87 (SD = 0.90) Sig: p < 0.01 |
Perception: 3.38 (SD = 0.90) Expectation: 4.44 (SD = 0.62) Gap: −1.06 (SD = 1.05) Sig: p < 0.01 |
Perception: 3.48 (SD = 0.89) Expectation: 4.48 (SD = 0.62) Gap: −1.00 (SD = 1.03) Sig: p < 0.01 |
Perception: 3.39 (SD = 0.90) Expectation: 4.45 (SD = 0.64) Gap: −1.06 (SD = 1.08) Sig: p < 0.01 |
Perception: 3.45 (SD = 0.80) Expectation: 4.44 (SD = 0.57) Gap: −0.99 (SD = 0.91) Sig: p < 0.01 |
High |
| Vizvari et al. (2018) [39] | Golestan | 1 | Government hospitals | 170 | 0/100 | N/A | N/A | N/A |
Perception: 3.84 (SD = 0.65) Expectation: 4.02 (SD = 0.69) Gap: −0.18 Sig: p < 0.001 |
Perception: 3.81 (SD = 0.85) Expectation: 4.15 (SD = 0.84) Gap: −0.34 Sig: p < 0.001 |
Perception: 3.44 (SD = 0.82) Expectation: 3.80 (SD = 0.83) Gap: −0.36 Sig: p < 0.001 |
Perception: 3.77 (SD = 0.84) Expectation: 4.17 (SD = 0.79) Gap: −0.40 Sig: p < 0.001 |
Perception: 3.63 (SD = 0.93) Expectation: 3.88 (SD = 0.89) Gap: −0.25 Sig: p < 0.001 |
Perception: 3.71 (SD = 0.73) Expectation: 4.01 (SD = 0.72) Gap: −0.30 Sig: p < 0.001 |
High |
| Daghighbin and Abdolmohammadi (2020) [10] | Razavi Khorasan | 2 | Government hospital | 271 | 65.31/34.69 | 38.16 (SD = 14.18) |
Under diploma: 163 (60.15) Diploma: 68 (25.09) Above diploma: 40 (14.76) |
1st: 165 (60.89) 2nd or higher: 106 (39.11) |
Perception: N/A Expectation: N/A Gap: N/A Sig: p < 0.001 |
Perception: N/A Expectation: N/A Gap: N/A Sig: p < 0.001 |
Perception: N/A Expectation: N/A Gap: N/A Sig: p < 0.001 |
Perception: N/A Expectation: N/A Gap: N/A Sig: p < 0.001 |
Perception: N/A Expectation: N/A Gap: N/A Sig: p < 0.001 |
Perception: 2.83 (SD = 0.84) Expectation: 3.82 (SD = 0.33) Gap: −0.99 Sig: p < 0.001 |
High |
| Zarei et al. (2020) [9] | Khuzestan | N/A | Government hospitals | 400 | 46.25/53.75 | 38.50 (SD = 16.80) |
Under diploma and diploma: 272 (68.00) Above diploma: 128 (32.00) |
1st: 173 (43.25) 2nd: 89 (22.25) 3rd: 138 (34.50) |
Perception: 3.67 (SD = 1.00) Expectation: 4.35 (SD = 0.82) Gap: −0.68 Sig: p = 0.001 |
Perception: 3.79 (SD = 0.99) Expectation: 4.42 (SD = 0.51) Gap: −0.63 Sig: p = 0.001 |
Perception: 3.65 (SD = 1.09) Expectation: 4.31 (SD = 0.94) Gap: −0.66 Sig: p = 0.001 |
Perception: 3.80 (SD = 1.07) Expectation: 4.46 (SD = 0.81) Gap: −0.66 Sig: p = 0.001 |
Perception: 3.67 (SD = 1.11) Expectation: 4.33 (SD = 0.84) Gap: −0.66 Sig: p = 0.001 |
Perception: 3.72 (SD = 0.94) Expectation: 4.37 (SD = 0.75) Gap: −0.65 Sig: p = 0.001 |
High |
Abbreviations: SD, standard deviation; SERVQUAL, service quality.
3.3. Methodological Quality of Included Study
As shown in Figure 2, out of the studies included, 20 [9, 10, 13, 20, 21, 22, 23, 24, 25, 26, 28, 30, 31, 32, 33, 34, 35, 36, 39, 40] were deemed to be of high quality, whereas five [19, 27, 29, 37, 38] were rated as fair quality. In 15 [13, 19, 20, 21, 24, 26, 27, 28, 29, 31, 35, 36, 37, 38, 39] of the included studies, there was no mention of limitations, and in 12 studies [19, 21, 24, 26, 27, 29, 31, 33, 37, 38, 39, 40], no information was provided regarding funding sources and potential conflicts of interest.
Figure 2.
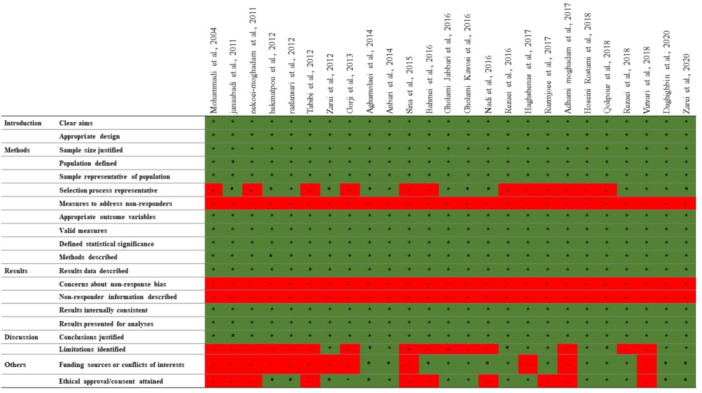
Assessment of the quality of the included articles.
3.4. Service Quality Based on Servqual Model
As shown in Figure 3, in a total of 25 studies, the mean perception of patients about the quality of services in hospitals was 3.54 (SE = 0.08) (95% CI: 3.37–3.70; I 2 = 99.814%; p< 0.001). Also, as shown in Figure 4, the mean expectation of patients about the quality of services in hospitals was 4.43 (SE = 0.06) (95% CI: 4.31–4.54; I 2 = 99.899%; p < 0.001).
Figure 3.
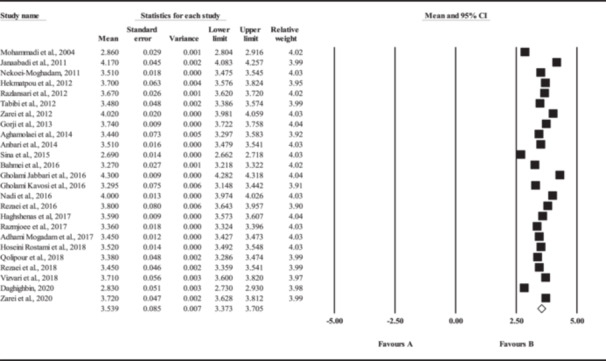
Forest plot of patients' perceptions based on the SERVQUAL model.
Figure 4.
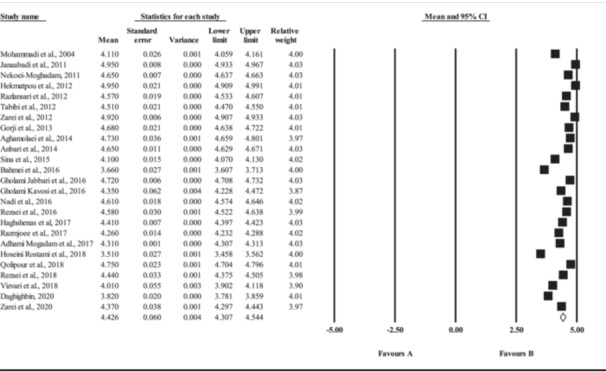
Forest plot of patients' expectations based on the SERVQUAL model.
As shown in Table 2, in a total of 24 studies, the mean perception of patients about the quality of services in hospitals in tangibility dimension was 3.63 (SE = 0.08) (95% CI: 3.46–3.79; I 2 = 99.402%; p < 0.001). Also, the mean expectation of patients about the quality of services in hospitals in the tangibility dimension was 4.47 (SE = 0.07) (95% CI: 4.34–4.61; I 2 = 99.900%; p < 0.001). The mean perception of patients about the quality of services in hospitals in the reliability dimension was 3.57 (SE = 0.08) (95% CI: 3.41–3.74; I 2 = 99.581%; p < 0.001). Also, the mean expectation of patients about the quality of services in hospitals in the reliability dimension was 4.51 (SE = 0.07) (95% CI: 4.38–4.64; I 2 = 99.814%; p < 0.001). The mean perception of patients about the quality of services in hospitals in the responsiveness dimension was 3.46 (SE = 0.07) (95% CI: 3.33–3.60; I 2 = 99.273%; p < 0.001). Also, the mean expectation of patients about the quality of services in hospitals in the responsiveness dimension was 4.37 (SE = 0.08) (95% CI: 4.21–4.53; I 2 = 99.801%; p < 0.001). The mean perception of patients about the quality of services in hospitals in the assurance dimension was 3.60 (SE = 0.08) (95% CI: 3.45–3.75; I 2 = 99.455%; p < 0.001). Also, the mean expectation of patients about the quality of services in hospitals in the assurance dimension was 4.49 (SE = 0.06) (95% CI: 4.37–4.61; I 2 = 99.834%; p < 0.001). The mean perception of patients about the quality of services in hospitals in the empathy dimension was 3.56 (SE = 0.06) (95% CI: 3.45–3.68; I 2 = 99.511%; p < 0.001). Also, the mean expectation of patients about the quality of services in hospitals in the empathy dimension was 4.38 (SE = 0.07) (95% CI: 4.24–4.52; I 2 = 99.756%; p < 0.001).
Table 2.
Perception and expectation of patients based on the SERVQUAL model.
| Dimensions of SERVQUAL | Mean (SE) | Gap | 95% CI | Heterogeneity | Egger's regression | |||||
|---|---|---|---|---|---|---|---|---|---|---|
| Lower limit (mean) | Upper limit (mean) | χ 2 | p value | I 2 | p value | t‐value | ||||
| Tangibility | Perception | 3.63 (SE = 0.08) | −0.84 | 3.46 | 3.79 | 3847.412 | < 0.001 | 99.402 | 0.266 | 1.142 |
| Expectation | 4.47 (SE = 0.07) | 4.34 | 4.61 | 23014.726 | < 0.001 | 99.900 | 0.030 | 2.319 | ||
| Reliability | Perception | 3.57 (SE = 0.08) | −0.94 | 3.41 | 3.74 | 5485.736 | < 0.001 | 99.581 | 0.577 | 0.567 |
| Expectation | 4.51 (SE = 0.07) | 4.38 | 4.64 | 12334.824 | < 0.001 | 99.814 | 0.030 | 2.320 | ||
| Responsiveness | Perception | 3.46 (SE = 0.07) | −0.91 | 3.33 | 3.60 | 3164.817 | < 0.001 | 99.273 | 0.772 | 0.292 |
| Expectation | 4.37 (SE = 0.08) | 4.21 | 4.53 | 11584.461 | < 0.001 | 99.801 | 0.272 | 1.127 | ||
| Assurance | Perception | 3.60 (SE = 0.08) | −0.89 | 3.45 | 3.75 | 4221.925 | < 0.001 | 99.455 | 0.347 | 0.962 |
| Expectation | 4.49 (SE = 0.06) | 4.37 | 4.61 | 13884.317 | < 0.001 | 99.834 | 0.123 | 1.601 | ||
| Empathy | Perception | 3.56 (SE = 0.06) | −0.82 | 3.45 | 3.68 | 4704.577 | < 0.001 | 99.511 | 0.038 | 2.197 |
| Expectation | 4.38 (SE = 0.07) | 4.24 | 4.52 | 9422.992 | < 0.001 | 99.756 | 0.021 | 2.481 | ||
| Total | Perception | 3.54 (SE = 0.08) | −0.89 | 3.37 | 3.70 | 12886.377 | < 0.001 | 99.814 | 0.269 | 1.133 |
| Expectation | 4.43 (SE = 0.06) | 4.31 | 4.54 | 23735.698 | < 0.001 | 99.899 | 0.169 | 1.421 | ||
As shown in Table 2, according to the SERVQUAL model, the overall difference between patients' perceptions and their expectations was −0.89. When examining specific aspects, the gap between patients' perceptions and expectations in the tangibility dimension was −0.84, in the reliability dimension was −0.94, in the responsiveness dimension was −0.91, in the assurance dimension was −0.89, and in the empathy dimension was −0.82.
As shown in Figure 5, the meta‐regression results showed that there was no statistically significant relationship between patients' perceptions and the year of publication (p = 0.969). However, as presented in Figure 6, the meta‐regression findings revealed a statistically significant association between patients' expectations and the year of publication (p = 0.004). The presence of this noteworthy alteration may constitute one of the contributing factors to the observed heterogeneity across the included studies.
Figure 5.
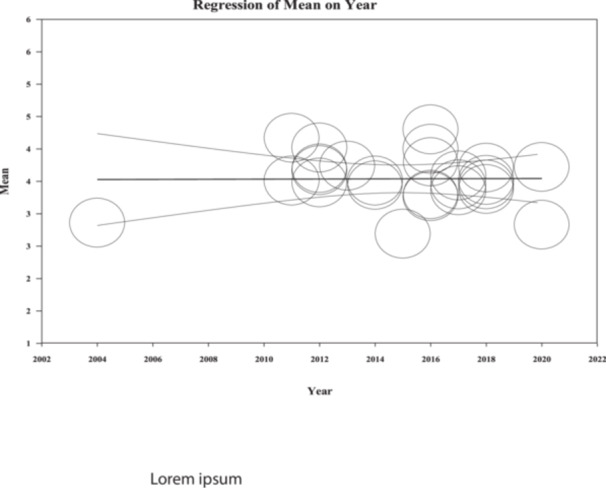
Meta‐regression based on the relationship between the patients' perceptions based on the SERVQUAL and years of publications.
Figure 6.
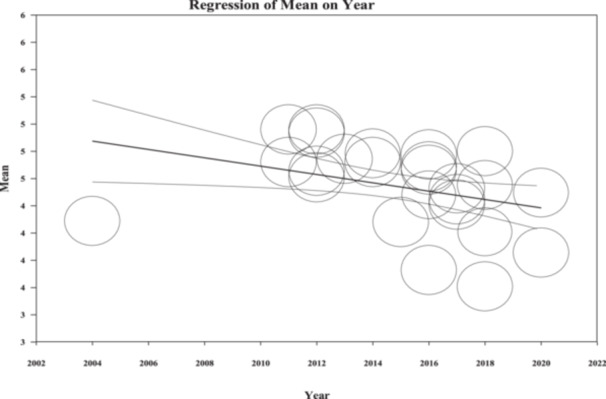
Meta‐regression based on the relationship between the patients' expectations based on the SERVQUAL and years of publications.
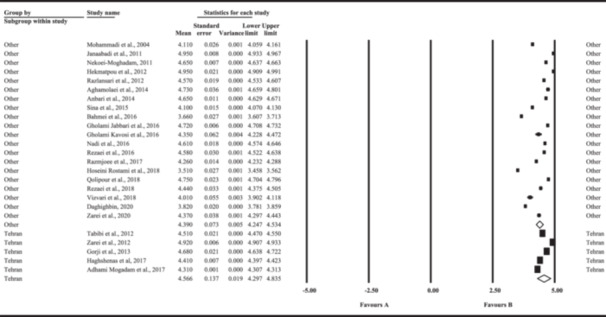
As shown in Figure 7, analyzing the data concerning patients' average perceptions in different subgroups within Iran, it was observed that patients in Tehran province (the capital) had an average perception score of 3.66 (SE = 0.08) (95% CI: 3.50−3.81; I 2 = 99.482%; p < 0.001), whereas patients in other provinces had an average perception score of 3.51 (SE = 0.12) (95% CI: 3.27−3.75; I 2 = 99.843%; p< 0.001). Furthermore, as shown in Figure 8, upon examining the data related to patients' average expectations in various subgroups across Iran, it became evident that patients in Tehran province had an average expectation score of 4.57 (SE = 0.14) (95% CI: 4.30−4.84; I 2 = 99.956%; p < 0.001), whereas patients in other provinces had an average expectation score of 4.39 (SE = 0.07) (95% CI: 4.25−4.53; I 2 = 99.790%; p < 0.001). Following the findings, an additional factor contributing to the observed heterogeneity may be associated with the execution of studies in diverse provinces within Iran. It is noteworthy that discernible distinctions exist in the perceptions and expectations of patients concerning the quality of nursing services between Tehran province and other provinces.
Figure 7.

The mean patient perception based on the SERVQUAL model in the subgroup of location.
Figure 8.
The mean patient expectation based on the SERVQUAL model in the subgroup of location.
3.5. Sensitivity Analysis
As shown in Figures 9 and 10, we performed sensitivity analyses by systematically excluding one study at a time to evaluate how each study influenced the overall outcomes and the degree of heterogeneity among the studies. The findings indicated that the exclusion of any individual study within the scope of this meta‐analysis did not yield a statistically significant alteration in the pooled mean perceptions and expectations of patients regarding hospital services. As evidenced by the results, the removal of any individual study did not yield statistically significant alterations in the levels of patients' expectations and perceptions of hospital services. This observation suggests a high precision in the outcomes of the meta‐analysis, notwithstanding the presence of heterogeneity.
Figure 9.
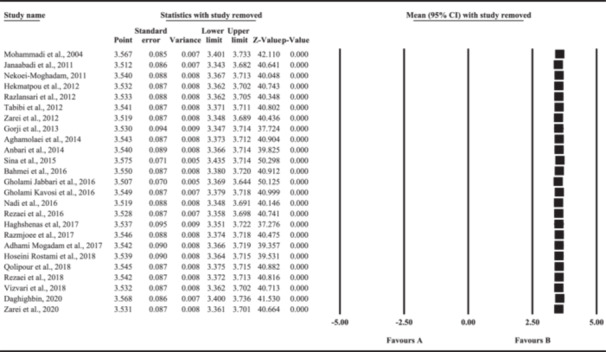
Sensitivity analysis of patients' perceptions based on the SERVQUAL model.
Figure 10.
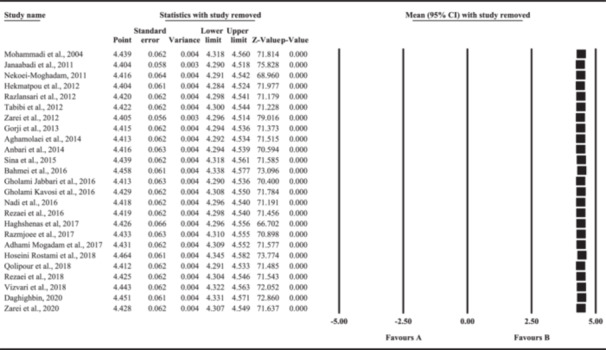
Sensitivity analysis of patients' expectations based on the SERVQUAL model.
3.6. Publication of Bias
As shown in Figures 11 and 12, a funnel plot was used to assess potential publication bias in the assessment of patients' average perceptions and expectations using the SERVQUAL model. No indications of asymmetry were discerned in the funnel plot. The Egger's regression test revealed no evidence of publication bias in the assessment of patients' average perceptions (t = 1.133, p = 0.269) and expectations (t = 1.421, p = 0.169). In the tangibility subscale, Egger's test outcomes indicated the absence of publication bias in the perception section (t = 1.142, p = 0.266), whereas discernible publication bias was evident in the expectations section (t = 2.319, p = 0.030). Concerning the reliability subscale, Egger's test results demonstrated an absence of publication bias in the perception section (t = 0.567, p = 0.577), yet revealed publication bias in the expectations section (t = 2.320, p = 0.030). Within the responsiveness subscale, Egger's test findings denoted the absence of biased publication in both the perception (t = 0.292, p = 0.772) and expectation (t = 1.127, p = 0.272) sections. In the assurance subscale, the Egger's test ascertained the absence of biased publication in both the perception (t = 0.962, p = 0.347) and expectation (t = 1.601, p = 0.123) sections. Lastly, within the empathy subscale, Egger's test results revealed bias in both the perception (t = 2.197, p = 0.038) and expectation (t = 2.481, p = 0.021) sections.
Figure 11.
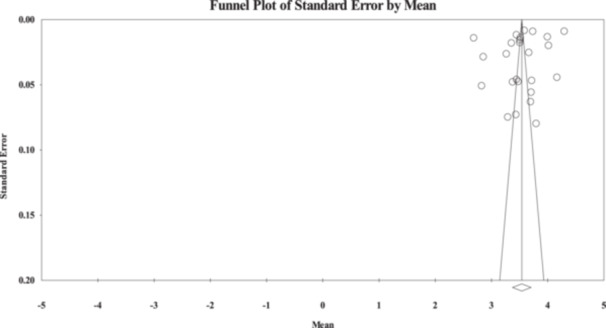
Funnel plot of patients' perceptions based on the SERVQUAL model.
Figure 12.
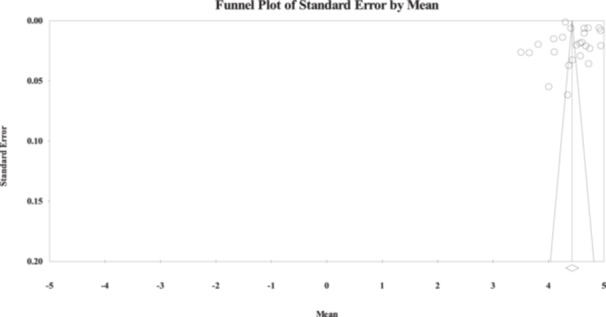
Funnel plot of patients' expectations based on the SERVQUAL model.
4. Discussion
This systematic review and meta‐analysis revealed that, according to the SERVQUAL model, patients' collective perception of service quality in Iranian hospitals averaged 4.43 (SE = 0.06), whereas their average expectation for service quality was 3.54 (SE = 0.08). The study findings indicated a negative gap between patients' perceptions and their expectations of service quality across all dimensions within the SERVQUAL model. This discrepancy underscores a failure to meet patients' anticipated standards for the quality of healthcare services in Iranian hospitals.
The quality of service in hospitals plays a pivotal role in shaping patient satisfaction, healthcare results, and the general perception of the healthcare system. To assess and enhance service quality effectively, it is crucial to consider the perspective of patients, as it offers invaluable insights into their experiences, requirements, and anticipations [41, 42].
The study's outcomes revealed that the most substantial gap between patient perception and expectation existed within the reliability and responsiveness dimensions. In concurrence with the current study, a systematic review and meta‐analysis conducted in Iran in 2018, comprising 12 studies, demonstrated that the most significant disparity between patients' perceptions and expectations of service quality was observed within the reliability and assurance dimensions [43]. In contrast to the current study, a different systematic review and meta‐analysis conducted in 2018, which included 13 studies, indicated that the responsiveness dimension exhibited the least gap between Iranian patients' perception and expectation of service quality. Nonetheless, akin to the present study, the reliability dimension had the most significant gap (Satar [15]). The reliability dimension centers on evaluating a service provider's capacity to consistently deliver services that are precise, dependable, and in line with their commitments. Essentially, it gauges the degree of trust customers have in the service provider's ability to maintain accurate and uninterrupted service delivery [44, 45]. According to the findings of this study, it appears that patients have a lack of trust in the services being offered. The responsiveness dimension centers on evaluating a service provider's readiness and capability to assist customers, offering a service experience that is both personalized and attentive to their specific needs [45]. A negative gap signifies that patients' expectations regarding the responsiveness dimension are not being fulfilled, resulting in reduced patient satisfaction with service quality. Given this, it is recommended that healthcare managers and policymakers scrutinize the deficiencies and disparities within these two dimensions and work toward resolving any potential issues.
Furthermore, the findings of this study indicated that the gap between patients' perceived and expected service quality in the empathy dimension is comparatively smaller than in the other dimensions. These findings aligned with the results of a systematic review and meta‐analysis conducted in 2018, wherein the smallest gap between patients' perception and expectation of service quality in Iranian hospitals was observed within the empathy dimension [43]. The empathy dimension centers on evaluating the service provider's capacity to demonstrate concern, comprehension, and a keen focus on addressing the unique needs and issues of individual customers [45, 46].
The findings from the subgroup location analysis revealed that patients in Tehran province, the capital, have higher expectations and a better perception of service quality in hospitals compared to other provinces [19, 21, 22, 38, 40]. The observed variance may be attributed to lifestyle disparities and cultural distinctions prevalent among inhabitants residing in Iran's capital and other urban centers. These factors likely contribute to nuanced perspectives and expectations regarding hospital service quality among diverse demographic cohorts. This observation implies that as patients' perception of service quality increases, so do their expectations. This observation raises questions about the absence of a consistent standard for hospital services in Iran.
Considering that the studies included in this systematic review and meta‐analysis were conducted in different provinces of the country, cultural differences among different Iranian ethnic groups can be one of the heterogeneity factors in this study. Also, considering that the sampling of studies was done in different departments of hospitals, it can be another factor of high heterogeneity in this meta‐analysis.
4.1. Limitations
One of the limitations worth noting is the high heterogeneity among the studies included in this analysis. The study's conclusions and the results of the meta‐analysis are contingent on the presence and quality of data obtained from the studies that were included. If certain studies lack adequate or complete data, it may affect the precision and reliability of the analysis. It is possible that despite conducting a comprehensive search across multiple databases, some relevant studies on this subject may not have been identified.
4.2. Implications for Health Managers and Policymakers
Healthcare administrators should view the study's findings as a catalyst for taking action to enhance service quality within Iranian hospitals. Addressing the identified deficiencies and areas for improvement has the potential to elevate patient satisfaction and overall healthcare outcomes. Moreover, the study's recognition of the absence of a suitable standard for hospital services in Iran underscores the necessity for creating and implementing explicit quality standards and benchmarks. Collaboration between healthcare administrators and policymakers is essential for establishing and enforcing these standards across healthcare facilities. Policymakers can also play a pivotal role in raising public awareness about the significance of providing feedback on healthcare experiences. Encouraging patients to share their thoughts and concerns can result in more comprehensive data collection and drive ongoing improvements.
4.3. Implication for Future Research
Future research can explore service quality in greater detail by focusing on the particular aspects that hold the most significance for patients. This exploration might entail conducting qualitative studies or surveys to attain a more nuanced comprehension of patient preferences and anticipations. Researchers can also engage in comparative investigations to contrast how patients perceive service quality in Iranian hospitals with those in other global regions. These comparative inquiries can shed light on areas where Iran can draw insights from international best practices. Additionally, the study of the implementation and consequences of patient‐centered care models in Iranian healthcare institutions can serve as a productive avenue for research. This investigation can provide valuable insights into how such models impact service quality and patient outcomes, thereby guiding potential healthcare reforms.
5. Conclusion
In summary, the study's results revealed a consistent gap between what patients perceive and what they expect in terms of service quality across all dimensions outlined in the SERVQUAL model. This dissonance highlights a clear failure to meet the standards of service quality that patients anticipate when it comes to healthcare services in Iranian hospitals. Hence, healthcare administrators should consider the study's findings as a motivating force to initiate measures aimed at improving service quality in Iranian hospitals. Tackling the recognized shortcomings and areas requiring enhancement holds the promise of raising patient satisfaction levels and, consequently, improving overall healthcare outcomes.
Author Contributions
Study concept and design by all authors, data acquisition by all authors, data interpretation by all authors, drafting the manuscript by all authors, revision of the manuscript by all authors, and the final version of the manuscript is approved by all authors.
Ethics Statement
The authors have nothing to report.
Conflicts of Interest
The authors declare no conflicts of interest.
Transparency Statement
The lead authors Kobra Salami Kohan and Pooyan Ghorbani Vajargah affirm that this manuscript is an honest, accurate, and transparent account of the study being reported; that no important aspects of the study have been omitted; and that any discrepancies from the study as planned (and, if relevant, registered) have been explained.
Supporting information
Supporting information.
Acknowledgments
The authors have nothing to report.
Contributor Information
Kobra Salami Kohan, Email: salamikohan@gmail.com.
Pooyan Ghorbani Vajargah, Email: poyan.ghorbani@gmail.com.
Data Availability Statement
The data sets generated and analyzed during the current study are available from the corresponding author upon reasonable request.
References
- 1. Dadmand F., “Effects of the Multiple Dimensions of Hospital Services Quality on Patients Satisfaction: SERVQUAL Model Testing,” Journal of Internal Medicine 98 (2015): 51–57223401. [Google Scholar]
- 2. Latifi N., Roohi G., Mahmoodi‐Shan G. R., and Tatari M., “Nurses' Clinical Decision‐Making Models in the Care of Older Adults: A Cross‐Sectional Study,” Journal of Nursing Reports in Clinical Practice 2, no. 3 (2024): 141–146, 10.32598/JNRCP.23.105. [DOI] [Google Scholar]
- 3. Mohammadi‐Sardo M. R. and Salehi S., “Emergency Department Patient Satisfaction Assessment Using Modified Servqual Model: A Cross‐Sectional Study,” AdvancedJournal of Emergency Medicine 3, no. 1 (2019): 3. [DOI] [PMC free article] [PubMed] [Google Scholar]
- 4. Yaghobi Y., Pouy S., Hosseinzadeh Siboni F., and Falahzade F., “Effect of Orem's Self‐Care Model on the Quality of Life in Adolescents With Diabetes Type 1: A Randomized Clinical Trial,” Journal of Nursing Reports in Clinical Practice 2, no. 4 (2024): 227–233, 10.32598/JNRCP.23.109. [DOI] [Google Scholar]
- 5. Donabedian A., “Evaluating the Quality of Medical Care,” Milbank Quarterly 83, no. 4 (2005): 691–729. [DOI] [PMC free article] [PubMed] [Google Scholar]
- 6. Sabahi‐Bidgoli M., Mousavi S. G. A., Kebriaei A., Seyyedi S. H., Shahri S., and Atharizadeh M., “The Quality of Hospital Services in Kashan Educational Hospitals During 2008‐9: The Patients' Viewpoint,” KAUMS Journal 15, no. 2 (2011): 146–152. [Google Scholar]
- 7. Bermúdez‐Hernández J., Palacios‐Moya L., Valencia‐Arias A., and Brand‐Piedrahita L., “A Proposed Model of User Satisfaction With Medical Emergency Services by Using the Servqual Model,” Journal of Pharmacy & Pharmacognosy Research 9, no. 6 (2021): 859–869. [Google Scholar]
- 8. Zarei E. and Shamsaddini L. A., “Service Quality in Emergency Departments of the Public and Private Hospitals From the Patient's Perspective,” Scientific Information Database 5, no. 1 (2017): 1–8. [Google Scholar]
- 9. Zarei E., Bagheri A., Daneshkohan A., and Khodakarim S., “Patients' Views on Service Quality in Selected Iranian Hospitals: An Importance‐Performance Analysis,” Shiraz E‐Medical Journal 21, no. 9 (2020): e97938, 10.5812/semj.97938. [DOI] [Google Scholar]
- 10. Daghighbin E. and Abdolmohammadi Y., “Comparison Between Expectations and Perceptions of the Patient About Quality Services in Training Centers of Neyshabour University of Medical Sciences With Servqual Model,” Journal of Neyshabur University of Medical Sciences 8, no. 2 (2020): 82–94. [Google Scholar]
- 11. Ahmad E. and Itrat M., “Patient Satisfaction With Medical Services Provided at Unani Medicine Hospital, Bengaluru: A Cross‐Sectional Study,” Journal of Patient Experience 7, no. 6 (2020): 1432–1437. [DOI] [PMC free article] [PubMed] [Google Scholar]
- 12. Hashemi Moghaddam B., Karimi Alavije M. R., Kianoosh Fard N. S., and Ebrahimbabaei S., “Analyzing the Effects of Non‐Medical Services Quality on Caregivers Satisfaction,” Journal of Hospital 20, no. 4 (2021): 64–78. [Google Scholar]
- 13. Gholami M., Kavosi Z., and Khojastefar M., “Services Quality in Emergency Department of Nemazee Hospital: Using SERVQUAL Model,” Journal of Health Management & Information Science 3, no. 4 (2016): 120–126. [Google Scholar]
- 14. Bastani P., Barati O., Sadeghi A., Sharifi S., and Abhari S., “Analysis of the Gap in the Quality of Outpatient Services Using the Servqual Model in Shahid Motahari Clinic in Shiraz in 2013,” Journal of Rafsanjan University of Medical Sciences 14, no. 12 (2016): 1015. [Google Scholar]
- 15. Rezaei S., Hajizadeh M., Zandian H., Fathi A., and Nouri B., “Service Quality in Iranian Hospitals: A Systematic Review and Meta‐Analysis,” Medical Journal of the Islamic Republic of Iran 32 (2018): 344–351, 10.14196/mjiri.32.59. [DOI] [PMC free article] [PubMed] [Google Scholar]
- 16. Page M. J., McKenzie J. E., Bossuyt P. M., et al., “The Prisma 2020 Statement: An Updated Guideline for Reporting Systematic Reviews,” International Journal of Surgery 88 (2021): 105906, 10.1016/j.ijsu.2021.105906. [DOI] [PubMed] [Google Scholar]
- 17. Heidarnia M.‐A., Riazi‐Isfahani S., Abadi A., and Mohseni M., “Cross Cultural Adaptation and Assessing Validity and Reliability of SERVQUAL Questionnaire in Hospital Service Quality,” Research in Medicine 38, no. 2 (2014): 98–105. [Google Scholar]
- 18. Downes M. J., Brennan M. L., Williams H. C., and Dean R. S., “Development of a Critical Appraisal Tool to Assess the Quality of Cross‐Sectional Studies (Axis),” BMJ Open 6, no. 12 (2016): e011458. [DOI] [PMC free article] [PubMed] [Google Scholar]
- 19. Adhami Mogadam F., Sahebalzamani M., and Rouhafza M., “Gap Analysis of Service Quality from Bedridden Patient's Point of View at Hospitals of Tehran Medical Sciences Islamic Azad University,” Journal of Healthcare Management 8, no. 2 (2017): 21–32. [Google Scholar]
- 20. Gholami M., Jabbari A., Kavosi Z., and Chamanpara P., “An Assessment of the Attitudes of Medical Tourists Toward the Quality of the Services Delivered by Hospitals in Shiraz, Iran, Using the SERVQUAL Model,” Health Information Management 13, no. 2 (2016): 145–152. [Google Scholar]
- 21. Gorji H. A., Tabatabaei S., Akbari A., Sarkhosh S., and Khorasan S., “Using the Service Quality Gap's Model (SERVQUAL) in Imam Khomeini Teaching Hospital: 2012,” Journal of Health Administration 16, no. 51 (2013): 7–18. [Google Scholar]
- 22. Haghshenas E., Arab M., Rahimi A., and Movahed E., “Assessing the Quality of Services Provided at Outpatient Clinics Among Hospitals Affiliated to Tehran University of Medical Sciences Based on SERVQUAL Model in 2015,” Journal of Hospital 16, no. 2 (2017): 9–17. [Google Scholar]
- 23. Aghamolaei T., Eftekhaari T. E., Rafati S., et al., “Service Quality Assessment of a Referral Hospital in Southern Iran With SERVQUAL Technique: Patients' Perspective,” BMC Health Services Research 14, no. 1 (2014): 322. [DOI] [PMC free article] [PubMed] [Google Scholar]
- 24. Hekmatpou D., Sorani M., Farazi A. A., Fallahi Z., and Lashgarara B., “A Survey on the Quality of Medical Services in Teaching Hospitals of Arak University of Medical Sciences With Servqul Model in Arak, 2010,” Journal of Arak University of Medical Sciences 15, no. 7 (2012): 1–9. [Google Scholar]
- 25. Hoseini Rostami F., Jahani M. A., and Mahmoudi G, “Analysis of Service Quality Gap Between Perceptions and Expectations of Service Recipients Using SERVQUAL Approach in Selected Hospitals in Golestan Province,” Iranian Journal of Health Sciences 6, no. 1 (2018): 58–67, 10.29252/jhs.6.1.58. [DOI] [Google Scholar]
- 26. Jenaabadi H., Abili K., Nastiezaie N., and Yaghubi N., “The Gap Between Perception and Expectations of Patients of Quality of Treatment Centers in Zahedan by Using the Servqual Model,” Payesh (Health Monitor) 10, no. 4 (2011): 449–457. [Google Scholar]
- 27. Mohammadi A., Eftekhar Ardebffi H., Akbari Haghighi F., Mahmoudi M., and Poorreza A., “Evaluation OF Services Quality Based on the Patients' Expectations and Perceptions in Zanjan Hospitals,” Journal of School of Public Health and Institute of Public Health Research 2, no. 2 (2004): 71–84. [Google Scholar]
- 28. Nadi A., Shojaee J., Abedi G., Siamian H., Abedini E., and Rostami A., “Patients' Expectations and Perceptions of Service Quality in the Selected Hospitals,” Medical Archives 70, no. 2 (2016): 135. [DOI] [PMC free article] [PubMed] [Google Scholar]
- 29. Nekoei‐Moghadam M. and Amiresmaili M., “Hospital Services Quality Assessment: Hospitals of Kerman University of Medical Sciences, as a Tangible Example of a Developing Country,” International Journal of Health Care Quality Assurance 24, no. 1 (2011): 57–66. [DOI] [PubMed] [Google Scholar]
- 30. Qolipour M., Torabipour A., Khiavi F. F., and Malehi A. S., “Assessing Medical Tourism Services Quality Using SERVQUAL Model: A Patient's Perspective,” Iranian Journal of Public Health 47, no. 1 (2018): 103. [PMC free article] [PubMed] [Google Scholar]
- 31. Razlansari M., Teimouri B., AlipourShirsavar H. R., Taleghani M., and Ashtarian H., “Patients' Views on Perceived Services Quality Using SERVQUAL Model at Educational and Medical Centers of Kermanshah University of Medical Sciences 2013,” Journal of Clinical Research in Paramedical Sciences 1, no. 3 (2012): 74. [Google Scholar]
- 32. Razmjoee M., Yadollahi M., and Shamsedini N., “Patients' Satisfaction With Service Quality of a Public Hospital: An Evaluation Study (SERVQUAL Model),” Journal of Health Sciences & Surveillance System 5, no. 2 (2017): 66–71. [Google Scholar]
- 33. Rezaei S., Karami Matin B., Moradi K., et al., “Measurement of Quality of Educational Hospital Services by the SERVQUAL Model: The Iranian Patients' Perspective,” Electronic Physician 8, no. 3 (2016): 2101–2106. [DOI] [PMC free article] [PubMed] [Google Scholar]
- 34. Anbari Z., Mohammadi M., and Taheri M., “Measurement of Quality of Hospital Services via SERVQUAL Model,” Life Science Journal 11, no. 6 (2014): 51–56. [Google Scholar]
- 35. Bahmei J., Rahimi H., Rahgoshay I., and Kavosi Z., “Quality Evaluation of Emergency Department Services of Nemazee Hospital From the Patients' Viewpoint,” Depiction of Health 7, no. 1 (2016): 18–26. [Google Scholar]
- 36. Rezaei T., Ghahramanian A., Abdullahzaed F., Sheikhalipour Z., Asghari‐Jafarabadi M., and Fadaei Z., “Service Quality Gaps in the Provision of Care to Surgical Patients: A Cross‐Sectional Study in the Northwest of Iran,” Journal of Caring Sciences 7, no. 3 (2018): 157–162, 10.15171/jcs.2018.025. [DOI] [PMC free article] [PubMed] [Google Scholar]
- 37. Sina K., Babai Shibabandani M., and Nadi Ghara A., “Factors Influencing the Inpatients' Satisfaction Based on the SERVQUAL Model,” Journal of Mazandaran University of Medical Sciences 24, no. 121 (2015): 299–308. [Google Scholar]
- 38. Tabibi S. J., Gohari M. R., Shahri S., and Aghababa S., “Assessment of Health Care Services in Outpatient Clinics Based on SERVQUAL Model in Hospitals of Tehran,” Payavard Salamat 5, no. 4 (2012): 49–56. [Google Scholar]
- 39. Vizvari P., Moradi M., and Asadi L., “Assessment of Customer Satisfaction With Quality of Services Provided in Maternity Ward of Shahid Sayyad Shirazi Hospital in Gorgan,” Journal of Clinical and Basic Research 2, no. 3 (2018): 39–44. [Google Scholar]
- 40. Zarei E., Ghazi Tabatabai Seyed M., Rahimi Forushani A., Rashidiyan A., and Arab M., "Hospital Services Quality From Patients' Point of View: A Cross‐Sectional Study in Tehran Private Hospitals," Payavard‐Salamat 5 no. 4 (2012): 66–76.
- 41. Andaleeb S. S., “Service Quality Perceptions and Patient Satisfaction: A Study of Hospitals in a Developing Country,” Social Science & Medicine (1982) 52, no. 9 (2001): 1359–1370. [DOI] [PubMed] [Google Scholar]
- 42. Batbaatar E., Dorjdagva J., Luvsannyam A., Savino M. M., and Amenta P., “Determinants of Patient Satisfaction: A Systematic Review,” Perspectives in Public Health 137, no. 2 (2017): 89–101. [DOI] [PubMed] [Google Scholar]
- 43. Teshnizi S. H., Aghamolaei T., Kahnouji K., Teshnizi S. M. H., and Ghani J., “Assessing Quality of Health Services With the SERVQUAL Model in Iran. A Systematic Review and Meta‐Analysis,” International Journal for Quality in Health Care 30, no. 2 (2018): 82–89. [DOI] [PubMed] [Google Scholar]
- 44. Jonkisz A., Karniej P., and Krasowska D., “SERVQUAL Method as an “Old New” Tool for Improving the Quality of Medical Services: A Literature Review,” International Journal of Environmental Research and Public Health 18, no. 20 (2021): 10758. [DOI] [PMC free article] [PubMed] [Google Scholar]
- 45. Ladhari R., “A Review of Twenty Years of SERVQUAL Research,” International Journal of Quality and Service Sciences 1, no. 2 (2009): 172–198. [Google Scholar]
- 46. Muhammad Butt M. and Cyril de Run E., “Private Healthcare Quality: Applying a SERVQUAL Model,” International Journal of Health Care Quality Assurance 23, no. 7 (2010): 658–673, 10.1108/09526861011071580. [DOI] [PubMed] [Google Scholar]
Associated Data
This section collects any data citations, data availability statements, or supplementary materials included in this article.
Supplementary Materials
Supporting information.
Data Availability Statement
The data sets generated and analyzed during the current study are available from the corresponding author upon reasonable request.