

Abstract
Identifying therapeutic genes is crucial for developing treatments targeting genetic causes of diseases, but experimental trials are costly and time-consuming. Although many deep learning approaches aim to identify biomarker genes, predicting therapeutic target genes remains challenging due to the limited number of known targets. To address this, we propose HIT (Hypergraph Interaction Transformer), a deep hypergraph representation learning model that identifies a gene’s therapeutic potential, biomarker status, or lack of association with diseases. HIT uses hypergraph structures of genes, ontologies, diseases, and phenotypes, employing attention-based learning to capture complex relationships. Experiments demonstrate HIT’s state-of-the-art performance, explainability, and ability to identify novel therapeutic targets.
Keywords: therapeutic gene target prediction, hypergraph representation learning, disease–gene association
Graphical Abstract
Graphical Abstract.

Introduction
Identifying therapeutic gene targets is crucial for developing personalized medicine that improve treatment efficacy and reduce side effects by tailoring treatment decisions into the individual characteristics of each patient [1]. Traditional methods for identifying therapeutic gene targets in diseases often involve a combination of experimental and clinical approaches. For example, candidate genes are examined for therapeutic potential in affected individuals compared to controls using experiments [2]. Functional genomics techniques such as RNA interference (RNAi) or CRISPR-Cas9 to silence or edit the candidate genes in cell lines or animal models are also applied to observe the effects on disease phenotypes [3]. These traditional methods have been instrumental in understanding the specific gene’s potential as a therapeutic target and in the development of personalized medicines [4].
However, the approaches are often resource- and time-intensive [5, 6]. To make the methods efficient, increasing their success rate by focusing on high-potential therapeutic candidates is essential. Currently, several methods such as biological study of the disease and genome-wide association studies provide hypothesis of therapeutic potential on known disease-associated genes [7]. Unfortunately, these processes themselves are also time consuming and costly, further complicating the overall efficiency of therapeutic gene target discovery.
Deep learning-based computational methods can alleviate the bottleneck by identifying high-potential therapeutic candidates based on insights from massive datasets [8]. There are a few methods that have been proposed for solving this issue. For example, Ferrero et al. introduce the use of deep learning for predicting candidate therapeutic gene targets using known disease–gene association information [9]. These approaches have some limitations. They do not consider the biological ontologies of diseases and genes, which are important for determining the therapeutic potential of genes [10].
Deep graph representation learning methods provide good precedents for extracting insights from disease-gene associations effectively, while leveraging disease-gene and their biological ontologies. The methods have identified high-potential genetic markers of diseases. For example, Han et al. propose a method using dual graph convolution networks and matrix factorization to process disease-gene networks, identifying unknown genetic markers [11]. Li et al. identify disease-associated genes by applying a graph convolution network on disease–disease, gene–gene, and disease–gene networks [12]. He et al. incorporate gene–gene ontology annotations and disease–disease symptom associations into the disease–gene network, predicting the unknown markers using subgraph factorization and aggregation with graph attention networks [13]. Li et al. incorporate gene–gene ontology annotations and gene-human phenotype ontology associations into the disease-gene network, and predict the unknown markers using parallel graph transformer networks [14]. Although deep graph representation learning methods show a capability for predicting genetic markers of diseases, they have struggled to capture one-to-many relationships between biological entities, where a disease is associated with multiple genes, each linked to multiple gene ontologies [15]. This is because an edge in a graph can only represent a one-to-one relationship between nodes.
To address the aforementioned issues, we propose HIT (Hypergraph Interaction Transformer), which is a deep hypergraph representation learning model that identifies therapeutic genes of a specific disease using hypergraphs of disease-gene and their biological ontologies. HIT learns node and hyperedge embeddings. A hyperedge represents a common relationship among multiple nodes, allowing a hypergraph to capture one-to-many relationships among biological entities such as shared gene ontologies among multiple genes.
We construct model input hypergraphs as heterogeneous entity types using biological entity association data from HumanNet [16], gene ontology (GO) resource [17], disease ontology (DO) [18], human phenotype ontology (HPO) [19], and DisGeNET [20]. We create HIT to represent the relationships among different types of entities in a group using hypergraph attention mechanisms. HIT identifies the role of a gene to a disease as therapeutic, biomarker, and NA (not associated), using the curated aspects of therapeutic genes represented in the biological networks (note that we use terms defined in DisGeNET for the classification of disease–gene relationships).
We rigorously validate and compare the performance of our HIT model with existing deep graph representation learning methods which have been developed for determining disease-gene associations. HIT outperforms all baselines across the metrics used. In addition, HIT learns well-clustered embeddings and shows higher performance than baselines even with less biological association information than others.
HIT is more resource- and time-efficient than traditional experimental methods. For example, CRISPR and RNAi methods for in vitro functional genomics screening each generally take about 2 to 4 weeks each to identify candidate therapeutic gene targets [21, 22]. In contrast, the total training and inference time for HIT is up to 1 hour 40 min on a single NVIDIA RTX A6000 GPU (see Supplementary Material Table S1 for more information). Therefore, using the HIT model accelerates the process of searching for high-potential therapeutic gene target candidates. The source code for HIT is available at https://github.com/tigerkey10/HIT. The HIT model web server is available at http://mlblabhit.org/.
Method
0.1 Datasets description
We use five public biological association datasets from the HumanNet, GO Resource, HPO, DO, and DisGeNET v7.0 databases, to construct the input networks for the HIT model. The GO provides a standardized vocabulary for describing gene attributes across species, focusing on biological processes, molecular functions, and cellular components. The HPO standardizes terms for human phenotypic abnormalities, linking them to genes and diseases for genetic diagnosis. The DO offers a standardized framework for classifying and describing human diseases, enabling unified disease annotation. Further explanations on GO, HPO, and DO are provided in Supplementary Material Text S1.
On the networks, disease-gene links sourced from the DisGeNET dataset are labeled as therapeutic or biomarker. Both labels annotate the type of a relationship between the disease and the gene. We also select negative disease-gene pairs from the networks based on the TBGA dataset [23]. The selected negative pairs are marked as NA. The statistics for the datasets are summarized in Table 1.
Table 1.
Statistics of the used datasets
| Database | Association | Biological entities | Relationships | Address |
|---|---|---|---|---|
| HumanNet | Gene – gene | 18 656 genes | 675 069 relationships | https://www.inetbio.org/humannet/ |
| 17 737 genes | ||||
| Gene Ontology Resource | Gene – GO | 18 584 genes | 218 336 relationships | https://geneontology.org/ |
| 14 204 GOs | ||||
| Disease Ontology | Disease – DO | 6853 disease | 6898 relationships | https://disease-ontology.org/ |
| 6293 DOs | ||||
| Human Phenotype Ontology | Disease – HPO | 5423 diseases | 99 086 relationships | https://hpo.jax.org/app/ |
| 6540 phenotypes | ||||
| DisGeNET | Disease – gene | 2942 diseases | 2857 relationships (therapeutic) | https://www.disgenet.org/ |
| 3621 genes | 6356 relationships (biomarker) | |||
| TBGA | Disease – gene | 2658 diseases | 13 990 relationships (NA) | https://bmcbioinformatics.biomedcentral.com/ |
| 4934 genes | articles/10.1186/s12859-022-04646-6 |
0.2 The proposed model architecture
The proposed model, HIT, is a deep hypergraph representation learning model and consists of four parts: (i) construction of gene and disease hypergraphs, (ii) gene hypergraph encoder (GHE), (iii) disease hypergraph encoder (DHE), and (iv) disease–gene pair embedding classification. The Supplementary Material Text S2 explains the concept of a hypergraph and the model architecture is illustrated in Fig. 1.
Figure 1.
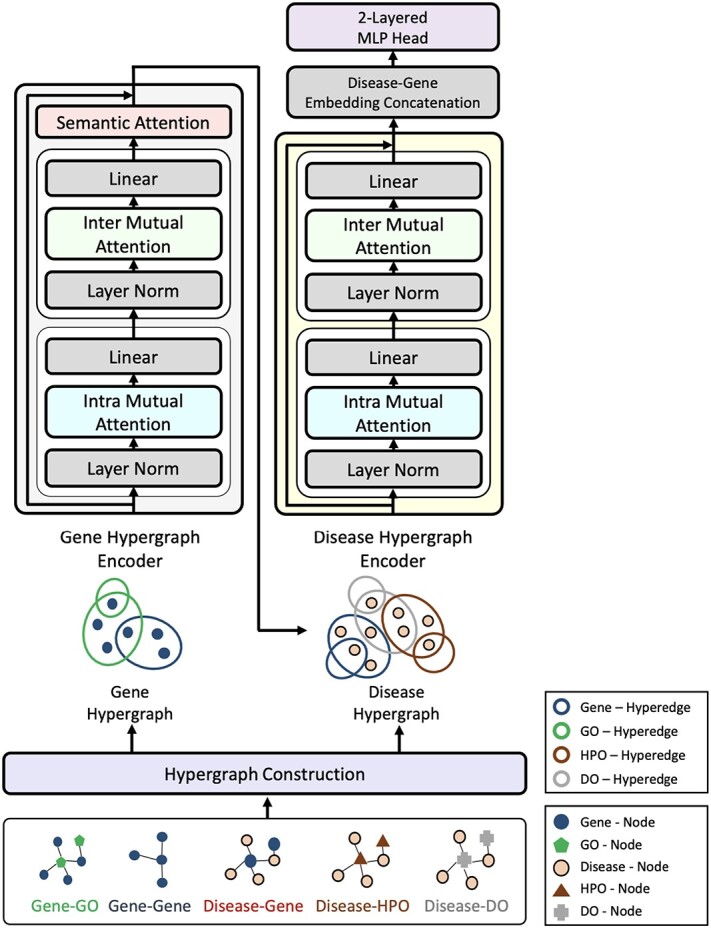
Illustration of the proposed HIT model. GHE (left) takes the gene hypergraph as input and produces gene embeddings enriched by incorporating relevant GO information. DHE (right) produces disease and gene embeddings using the disease hypergraph as input.
0.2.1 Construction of gene and disease hypergraphs
1) Gene hypergraph construction Gene hypergraph is a combination of gene-GO hypergraph and gene–gene hypergraph. First, we construct the gene-GO hypergraph using genes as nodes and their GO annotations as hyperedges representing the  -ary relationship between
  gene nodes. The gene-GO association data, obtained from the GO Resource database, provide information on the associated genes for each GO annotation. Gene-GO incidence matrix
  , given in Equation 1, represents the network structure of the gene-GO hypergraph.
  denotes the set of gene nodes and
  the set of GO hyperedges. In the following Equation 1,
  denotes a single gene node and
  a single GO hyperedge.
 |
(1) |
Second, we construct a gene–gene hypergraph using gene–gene association data from the HumanNet database. From the HumanNet dataset, about half of the genes that have a higher degree than the others are used as hyperedges of the gene–gene hypergraph, and the remaining half are used as gene nodes. This strategy increases the number of available gene node representations than that of hyperedges. We adopt the strategy because the goal of hypergraph representation learning is primarily to learn node representations rather than that of hyperedges.
Gene–gene incidence matrix  , formulated in Equation 2, represents the network structure of the gene–gene hypergraph (note that
  represents the set of gene nodes and
  denotes the set of gene hyperedges). In Equation 2 below,
  represents a single gene node and
  represents a single gene hyperedge.
 |
(2) |
The statistics of the gene-GO and gene–gene hypergraphs are described in Table 2.
Table 2.
Statistics of gene-GO and gene–gene hypergraphs
| Hypergraph | Hypergraph component | Component type | Number |
|---|---|---|---|
| Gene - GO | Node | Gene | 18 584 |
| Hyperedge | GO | 14 204 | |
| Gene - gene | Node | Gene | 18 656 |
| Hyperedge | Gene | 17 737 |
After constructing the gene-GO and gene–gene hypergraphs, we integrate the two networks and produce the gene hypergraph using incidence matrix concatenation. How the concatenation works is illustrated in Fig. 2. The concatenation of two matrices is performed row by row, preserving the uniqueness of each biological entity represented as a node and hyperedge. The concatenation causes the combined incidence matrix to contain more composite, multi-modal node relationships [24].
Figure 2.
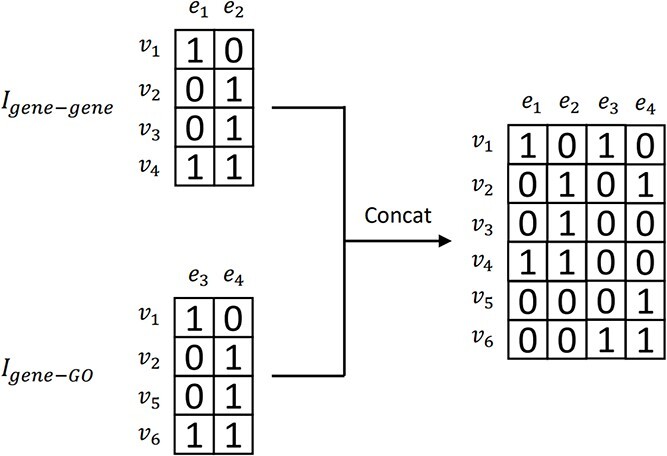
Illustration of concatenating two example incidence matrices:  and
and  are concatenated, resulting in the combined incidence matrix
  . To preserve the uniqueness of each entity, the overlapping entities are integrated.
The combined incidence matrix  is formulated in Equation 3 (note that
  is a union set of the gene nodes of the two hypergraphs and
  is a union set of the gene and GO hyperedges). The concatenated matrix represents the network structure of the gene hypergraph.
 |
(3) |
In the above Equation 3,  is a gene node from the set
  and
and  is a gene hyperedge from the set
  .
.
Some genes can sometimes be represented as both a node and a hyperedge at the same time. For these genes, we add a semantic attention layer in GHE to integrate the two representations of a single gene, taking into account the different importance of each representation. The details of the attention mechanism are described in the section “Gene semantic attention”.
2) Disease hypergraph construction We construct the disease hypergraph using the same strategy and logic that we use to construct the gene hypergraph. First, we construct the disease-DO, disease-HPO, and disease-gene hypergraphs using association datasets sourced from the DO, HPO, and the DisGeNET database. For each of the three hypergraphs, diseases are used as nodes of the network and their associated DO, HPO, and genes are used as hyperedges connecting  disease nodes. The details of each hypergraph are described in Table 3.
Table 3.
Statistics of disease-HPO, disease-DO, and disease-gene hypergraphs
| Hypergraph | Hypergraph component | Component type | Number |
|---|---|---|---|
| Disease - HPO | Node | Disease | 5423 |
| Hyperedge | HPO | 6540 | |
| Disease - DO | Node | Disease | 6853 |
| Hyperedge | DO | 6293 | |
| Disease - gene | Node | Disease | 2942 |
| Hyperedge | Gene | 3621 |
Second, we concatenate the incidence matrices  ,
,  , and
, and  row by row, while respecting the uniqueness of each biological entity. The concatenated matrix
  represents the network structure of the disease hypergraph and is formulated in Equation 4.
  is the disease node union set which includes all unique disease nodes, while
  denotes a hyperedge union set, which includes the DO, HPO, and gene hyperedges. In Equation 4,
  is a disease node from the set
  , and
, and  is a hyperedge from the set
  .
.
 |
(4) |
The statistics of the gene and disease hypergraphs are summarized in Table 4.
Table 4.
Statistics of the gene and disease hypergraphs
| Hypergraph | Hypergraph component | Component type | Number |
|---|---|---|---|
| Gene hypergraph | Node | Gene | 21 149 |
| Hyperedge | Gene, GO | 31 941 | |
| Disease hypergraph | Node | Disease | 12 152 |
| Hyperedge | HPO, DO, Gene | 16 454 |
0.2.2 Gene hypergraph encoder
GHE produces the contextual embeddings of a target gene node by incorporating its gene–gene and gene-GO association information. The gene hypergraph is the GHE’s input, and a set of the gene embeddings associated with disease is the output of the GHE. The GHE uses intra- and inter-mutual attention mechanisms, originally proposed by Liu et al. [25] to learn hypergraph representations. The mutual attentions used in our approach are some variations of scaled-dot product attention [26].
1) Intra-mutual attention The intra-mutual attention mechanism aggregates the information of nodes connected by hyperedges based on the relative attention weights of the nodes to each target hyperedge, and defines the hyperedge embedding by combining the information of the nodes. Specifically, the hyperedge representations of the gene hypergraph form the attention query matrix  . The node representations of the hypergraph form the attention key matrix
  and the value matrix
  .
.
 |
(5) |
In Equation 6,  denotes an initial hyperedge embedding matrix, and
  is an initial node embedding matrix.
  denotes an entity type. If a hyperedge
  represents a gene, then its corresponding query weight matrix will be
  . Otherwise, the weight matrix will be
  . The differentiation of the weight matrices allows the model to handle entity type heterogeneity [25].
 |
(6) |
The intra-mutual attention is formulated in the above Equation 7. For the softmax input, elements are masked, i.e. we assign the value of  to the elements if their corresponding entries in the transposed incidence matrix of the gene hypergraph, denoted as
  , are zero. This masking process ensures that the hypergraph connectivity is maintained. A SiLU activation function is implemented on the output of the masked scaled dot-product attention.
  denotes row-wise matrix concatenation.
 |
(7) |
The final result  is the updated hyperedge embeddings. Figure 3 (left) depicts the intra-mutual attention mechanism.
Figure 3.
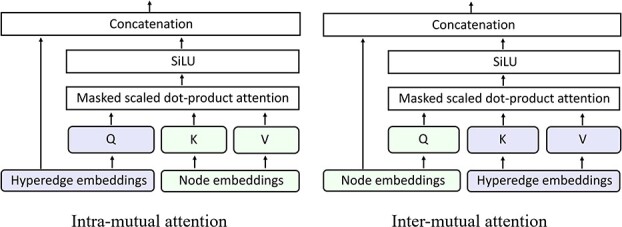
Illustrations of the intra (left) and inter (right) mutual attentions.
2) Inter-mutual attention The inter-mutual attention mechanism aggregates gene and GO hyperedge embedding information and reflects the  -ary relationship information to a hyperedge-connected target gene node embedding. The attention mechanism is formulated in the following Equation 10, where
  ,
,  , and
, and  are as follows in Equation 9.
 |
(8) |
 |
(9) |
In Equation 10, elements of the softmax input are set to a value of  if the corresponding elements in the incidence matrix of the gene hypergraph, denoted as
  , are zero.
 |
(10) |
In Equation 11, the final outcome  is the updated node embeddings. Figure 3 (right) illustrates the inter-mutual attention mechanism.
3) Gene semantic attention As mentioned concisely in Gene hypergraph construction, instances occur where a node and a hyperedge represent the same gene. We develop a semantic attention mechanism to merge these two representations of the same gene by leveraging attention weights.
 represents a set of genes that appear simultaneously as a hyperedge and as a node. The matrix
  denotes a set of representations of the overlapping genes extracted from the node embedding matrix
  .
.  provides another representation of these overlapping genes, sourced from the hyperedge embedding matrix
  . Mean pooling is applied along the vertical axis to the embedding matrices
  and
and  , to obtain representative views of the node and hyperedge for the genes, respectively.
 |
(11) |
 denotes the representative embedding for the node genes, and
  denotes the representative embedding for the hyperedge genes. We define our semantic attention mechanism as a single-layer feedforward neural network, parameterized by the weight vector
  .
.
 |
(12) |
Equation 13 illustrates the calculation of the semantic attention scores  . The feedforward network
  calculates the attention coefficients using
  and
and  as inputs. These coefficients are then normalized by a softmax function, yielding the attention scores for the node and hyperedge genes,
  and
and  , respectively.
 |
(13) |
The above Equation 14 shows  , the integrated view of the overlapping genes. From the updated gene embeddings, those related to diseases are selected as the final output of GHE and used as the initial embeddings for the corresponding genes in the disease hypergraph, as illustrated in Fig. 4.
Figure 4.
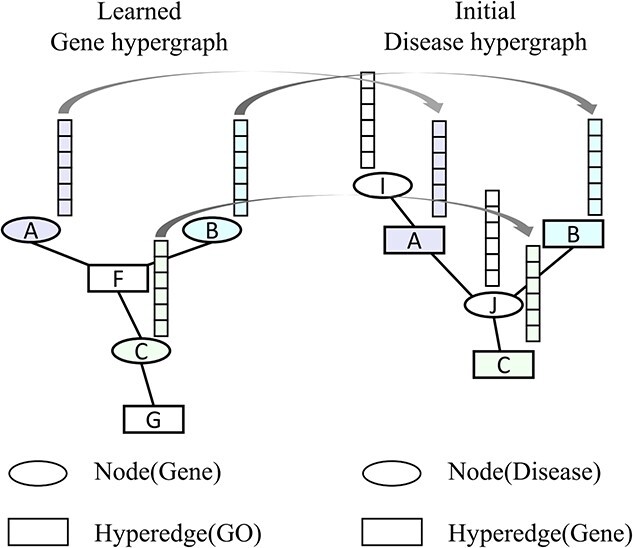
Illustration of the gene embedding transfer. The embeddings of the genes associated with disease learned from the gene hypergraph are used as the initial embeddings for the corresponding genes in the disease hypergraph.
0.2.3 Disease hypergraph encoder
The DHE produces contextual embeddings for a given disease node by integrating information from its disease-DO, disease-HPO, and disease-gene associations. The DHE consists of the intra- and inter-mutual attention mechanisms, as does the GHE. Although both DHE and GHE use intra- and inter-mutual attention mechanisms, the DHE and the GHE are independent modules, so different parameters are used.
1) Intra-mutual attention Following equations 15 and 16 describe the intra-mutual attention of the DHE, where  ,
,  , and
, and  . In Equation 15,
  is the hyperedge embedding matrix, and
  is the node embedding matrix of the disease hypergraph. For Equation 16, elements in the softmax input are set to a value of
  if the corresponding positions in the transposed disease hypergraph incidence matrix
  are zero.
 |
(14) |
 |
(15) |
 |
(16) |
The final result  in Equation 17 denotes the updated hyperedge embeddings of the disease hypergraph.
2) Inter-mutual attention
 |
(17) |
 |
(18) |
Equation 18 shows  ,
,  , and
, and  matrices of inter-mutual attention of DHE. In Equation 19, in the softmax input, elements are set to a value of
  if the corresponding positions in the disease hypergraph incidence matrix
  are zero.
 |
(19) |
In Equation 20,  is the updated disease node embeddings of the disease hypergraph.
0.2.4 Disease-gene pair embedding classification
The disease and gene embeddings learned from the disease hypergraph are concatenated to form “pair embeddings”. They are either concatenated by referencing the  connections or concatenated without known connections. A two-layer feedforward network categorizes these pair embeddings into three categories: therapeutic, biomarker, and NA.
Experiments
0.3 Experimental settings
0.3.1 Dataset split
Disease-gene pairs are split 80% for training (18 562 pairs), 10% for validation (2320 pairs), and 10% for testing (2321 pairs), maintaining the class distribution. Splits and experiments are synchronized and repeated five times with different seeds 1 to 5.
0.3.2 HIT hyperparameter configuration
For the HIT configuration, we set the embedding dimensions to 32 and the attention dimensions to 64. The model is trained with a batch size of 5000 over 50 epochs. We include a dropout rate of 0.1 in the attention mechanisms. We use the AdamW optimizer [27] with a learning rate of 0.01 and the cross-entropy loss function.
0.3.3 Performance metrics and baseline model selection
To evaluate models in a multi-class classification with uneven target distribution, we use Macro-F1, Macro-Precision, and Macro-Recall for balanced evaluation across all classes and provide specific class F1 scores (therapeutic, biomarker, and NA) for detailed comparisons. For overall performance, which shows the impact of larger classes, we use Accuracy and Micro-F1.
We also selected seven major baseline models: DGP-PGTN, HOGCN, HOGCN-S, GCN, GCN-S, gGATLDA, and HGNN [14, 24, 28–30] for performance comparison with our HIT model. We constructed biological association graphs as the baseline inputs, using the same datasets as HIT. The hyperparameters of all these models are set to their optimal settings for the comparison. (For further explanation of the baselines, see Supplementary Text S3).
0.4 Performance comparison
Table 5 shows the results of the performance comparison between the models. All metrics are measured at the best model state, averaging five random seed results. HIT achieves best and statistically significant performance against baselines (see Supplementary Material Text S4 for the statistical significance test). These results suggest that HIT performs exceptionally well to determine disease-gene associations in all three types, with a notable strength in the minority type “therapeutic” (see Supplementary Material Text S5 for HIT sensitivity and specificity scores for individual association types). This demonstrates the effectiveness of HIT in distinguishing potential therapeutic genes from biomarker genes.
Table 5.
The performance comparison between HIT and the baselines
| Method | Macro F1 | Precision | Recall | F1(therapeutic) | F1(biomarker) | F1(NA) | Accuracy | Micro F1 |
|---|---|---|---|---|---|---|---|---|
| GCN-S | 0.7470 0.016 0.016 |
0.7482 0.018 0.018 |
0.7482 0.015 0.015 |
0.6808 0.018 0.018 |
0.6915 0.029 0.029 |
0.8687 0.006 0.006 |
0.7982 0.013 0.013 |
0.7982 0.013 0.013 |
| HOGCN-S | 0.5497 0.187 0.187 |
0.6047 0.168 0.168 |
0.5569 0.173 0.173 |
0.4798 0.224 0.224 |
0.3768 0.303 0.303 |
0.7926 0.066 0.066 |
0.6873 0.101 0.101 |
0.6873 0.101 0.101 |
| GCN | 0.7613 0.011 0.011 |
0.7651 0.012 0.012 |
0.7589 0.012 0.012 |
0.6862 0.012 0.012 |
0.7194 0.019 0.019 |
0.8783 0.005 0.005 |
0.8125 0.008 0.008 |
0.8125 0.008 0.008 |
| HOGCN | 0.3377 0.077 0.077 |
0.4508 0.179 0.179 |
0.3846 0.047 0.047 |
0.2079 0.158 0.158 |
0.0487 0.091 0.091 |
0.7565 0.007 0.007 |
0.6151 0.016 0.016 |
0.6151 0.016 0.016 |
| DGP-PGTN |
0.772
 0.007
0.007 |
0.7757
 0.011
0.011 |
0.7706 0.012 0.012 |
0.7021 0.024 0.024 |
0.7384
 0.014
0.014 |
0.8754 0.008 0.008 |
0.8165 0.008 0.008 |
0.8165 0.008 0.008 |
| gGATLDA | 0.7561 0.009 0.009 |
0.7493 0.011 0.011 |
0.7655 0.01 0.01 |
0.7022
 0.016
0.016 |
0.6966 0.018 0.018 |
0.8694 0.006 0.006 |
0.8013 0.008 0.008 |
0.8013 0.008 0.008 |
| HGNN | 0.7696 0.009 0.009 |
0.7639 0.009 0.009 |
0.7801
 0.012
0.012 |
0.6941 0.022 0.022 |
0.7293 0.017 0.017 |
0.8854
 0.004
0.004 |
0.8189
 0.006
0.006 |
0.8189
 0.006
0.006 |
| HIT |
0.8431
 0.01
0.01 |
0.8373
 0.014
0.014 |
0.85
 0.008
0.008 |
0.7385
 0.013
0.013 |
0.8418
 0.015
0.015 |
0.9491
 0.002
0.002 |
0.8926
 0.007
0.007 |
0.8926
 0.007
0.007 |
The top results are highlighted in bold.
0.5 Embedding visualization
0.5.1 Comparing gene and disease embeddings using UMAP
Our proposed model produces highly expressive embeddings by reflecting the group semantics of multiple heterogeneous network components to a target component’s representation. Figure 5a–f demonstrates the model’s capacity by comparing the gene and disease embeddings of HIT with those of DGP-PGTN, which uses the sequential semantics of nodes while considering node type heterogeneity. Using the sequential semantics of nodes remains the main approach to deep graph representation learning models for processing heterogeneous information networks [31]. Also, we compare the capacity with HGNN, which is a hypergraph representation learning model. We visualize the standardized embeddings of three models using UMAP with the following hyperparameters: n_components = 2, n_neighbors = 25, min_dist = 0.1, and random_state = 42.
Figure 5.

UMAP visualizations of (a) gene embeddings in HIT, (b) gene embeddings in DGP-PGTN, and (c) gene embeddings in HGNN; (d) disease embeddings in HIT, (e) disease embeddings in DGP-PGTN, and (f) disease embeddings in HGNN; and (g) disease–gene pair embeddings in HIT, (h) disease–gene pair embeddings in DGP-PGTN, and (i) disease–gene pair embeddings in HGNN. Cluster labels are defined as follows: 0 indicates NA, 1 indicates biomarker, and 2 indicates therapeutic.
In Fig. 5a–c, yellow dots denote genes that are potential therapeutic targets for diseases, turquoise dots denote biomarker genes, and purple dots denote genes with unknown disease associations. HIT (Fig. 5a) displays more pronounced clustering, demonstrating that HIT achieves more expressive gene embeddings compared to DGP-PGTN (Fig. 5b) and HGNN (Fig. 5c).
Similarly, in Fig. 5d–f, yellow dots represent diseases with established therapeutic targets, turquoise dots represent diseases with confirmed biomarkers, and purple dots represent diseases with unresolved gene associations. The clustering observed in the HIT results (Fig. 5d) is more defined, indicating that HIT provides more expressive disease embeddings than DGP-PGTN (Fig. 5e) and HGNN (Fig. 5f).
0.5.2 Disease-gene pair embedding comparison using UMAP
HIT shows expressive gene and disease embeddings. The result implies that HIT also effectively separates the embeddings of disease-gene pairs into three distinct categories. To demonstrate these distinctions, we use UMAP to compare the embeddings of pairs from HIT with those from DGP-PGTN, the latter being the second best model in terms of Macro-F1. Also, we compare the embeddings with HGNN, which is a model learning hypergraph representations. UMAP hyperparameters are configured as follows: n_components = 2, n_neighbors = 100, min_dist = 1, and random_state = 42. The comparative results are shown in Fig. 5g–i.
In Fig. 5g–i, yellow dots represent disease-therapeutic gene pairs, turquoise dots represent disease-biomarker pairs, and purple dots represent the pairs that disease-gene relationship remains unidentified. HIT (Fig. 5g) shows distinct embedding clusters, especially between therapeutic and biomarker categories. In contrast, DGP-PGTN (Fig. 5h) and HGNN (Fig. 5i) show less separation between clusters, indicating less effective clustering. HIT demonstrates its ability to perform effective pair embedding clustering.
0.6 Ablation experiments
To train HIT, we consider several biological ontologies of diseases and genes to help HIT to make predictions with multifaceted considerations, inspired by Domingo et al. [10] and recent trends in predicting disease-gene associations [14]. We perform ablation experiments on HIT to find out how the respective biological ontologies affect the performance of the model. We also find out which ablation setting is most appropriate for HIT to perform the task. We perform the same ablation experiments on DGP-PGTN and GCN to compare the results with HIT. Table 6 contains the results of all ablation experiments and Fig. 6 is derived from it.
Table 6.
Results of ablation experiments. Each value is the average Macro F1 score on five random seeds.
| HIT | DGP-PGTN | GCN | |
|---|---|---|---|
| w/o GO |
0.8435
 0.01
0.01 |
0.7737
 0.009
0.009 |
0.7525 0.012 0.012 |
| w/o DO |
0.846
 0.013
0.013 |
0.7641
 0.007
0.007 |
0.7515 0.017 0.017 |
| w/o HPO |
0.8447
 0.012
0.012 |
0.7586
 0.008
0.008 |
0.7384 0.012 0.012 |
| w/o HPO & GO |
0.8482
 0.007
0.007 |
0.7576
 0.01
0.01 |
0.7397 0.015 0.015 |
| w/o GO & DO |
0.8436
 0.01
0.01 |
0.769
 0.012
0.012 |
0.7558 0.01 0.01 |
| w/o DO & HPO |
0.8497
 0.012
0.012 |
0.7626
 0.007
0.007 |
0.7412 0.017 0.017 |
| w/o GO & DO & HPO |
0.8477
 0.016
0.016 |
0.7616
 0.013
0.013 |
0.7403 0.011 0.011 |
| Original |
0.8431
 0.01
0.01 |
0.772
 0.007
0.007 |
0.7613 0.011 0.011 |
The top results are highlighted in bold.
Figure 6.

HIT performance on different ablation settings (left) and representational efficiency of HIT (right).
Figure 6 (left) illustrates the results of HIT’s ablation experiments. Overall, the performance of HIT tends to increase slightly as the amount of the ontology information decreases. Hypergraph pruning reduces the complexity of the model and increases the generalization performance of HIT. HIT adding GO annotation to the disease-gene network achieves the highest performance, showing the importance of adding GO to the disease-gene network.
The ablation result also shows that HIT always achieves better performance than the best versions of DGP-PGTN and GCN using less amount of association information. The result shows the representational efficiency of HIT and Fig. 6 (right) illustrates it.
0.7 Explainability of HIT
HIT can explain its final decisions based on attention scores derived from intra- and inter-mutual attention mechanisms, which indicate the influence of neighboring network components on a central component. For example, a high attention score to a neighboring GO annotation of a gene highlights the influence of the GO on the classification of the gene as a therapeutic target.
We represent gene nodes of hypergraphs as complete graphs of their neighbors, visually illustrating the influence of neighboring genes and GOs on the node. The size and color of the nodes in these graphs indicate their importance, with larger, yellower nodes being more influential.
Figure 7 illustrates this approach using six known disease-associated genes correctly classified as therapeutic targets. For example, SLA gene has the strongest influence on classifying THEMIS2 gene as a therapeutic target for breast cancer, while TANK gene has the strongest influence on classifying IFNA2 gene. This visualization aids in explaining HIT’s decisions.
Figure 7.

Complete graph-based attention score visualization. The gene names and GO ids are used to annotate the corresponding biological entities. Referring to the DisGeNET dataset, FGF21 is identified as a therapeutic gene target for Steatohepatitis, IFNA2 for Thyroid carcinoma, THEMIS2 for Malignant neoplasm of the breast, NQO1 for Diabetic Nephropathy, CSF3 for Familial Non-Hodgkin Lymphoma, and NECTIN2 for Ovarian neoplasm.
0.8 Case study on heart failure disease
We perform case study on heart failure to validate whether HIT can find previously unknown, but promising therapeutic gene candidates leveraging the evidences in the curated biological associations. Among several diseases in the disease hypergraph, HIT accurately predicts all of heart failure’s known therapeutic targets (see Supplementary Table S3).
We posit the result as HIT gains remarkable level of knowledge in heart failure’s therapeutic mechanisms from the given datasets. We set heart failure as a test case and rank heart failure’s known associated biological entities based on their attention scores from Heart failure assigned by HIT. From the ranking, we select top five therapeutic genes (GRK2, TNF, UCN2, HMGB1, and MYOD1 from Fig. 8) and investigate therapeutic potential of their associated genes based on the HumanNet gene–gene associations and HIT’s inference on them.
Figure 8.

Heart failure’s top five associated therapeutic genes ranked by HIT.
We thoroughly restrict the investigations to the associated genes which have model confidence for determining as therapeutic genes higher than 0.95, while having strict supporting references. As a result, we propose six genes as promising therapeutic candidates. Table 7 lists the candidates.
Table 7.
Potential therapeutic gene candidates for Heart failure identified by HIT. Model confidence is the probability or certainty level that the model assigns to its predicted class label for a given input during the inference stage.
IFNB1 gene is associated with TNF gene. The therapeutic potential of the IFNB1 gene, encoding interferon-beta (IFN- ), for heart failure is strongly evidenced by following two studies. Schultheiss et al. showed that IFN-
 treatment in chronic viral cardiomyopathy patients led to significant virus elimination, improved NYHA functional class, and better quality of life, demonstrating its safety and efficacy [33]. Additionally, Bazzon et al. found ADAM9 vital for MDA5-mediated IFN-
 production, crucial for preventing virus-induced cardiac damage [32]. Mice lacking ADAM9 had increased susceptibility to viral myocarditis due to weakened IFN-
 responses. These findings highlight IFNB1’s promise as a therapeutic target for heart failure, especially in viral cardiomyopathy.
IL-18 gene is associated with TNF gene. O’Brien et al. present robust evidence that IL-18 is a promising target for heart failure therapy [34]. IL-18 plays a key role in cardiomyocyte hypertrophy, contractile dysfunction, and extracellular matrix remodeling, with elevated levels associated with higher cardiovascular disease risk and severity. Approaches utilizing IL-18 binding protein and neutralizing antibodies have yielded positive outcomes in animal studies and early clinical trials. In mouse models of acute myocardial infarction (MI), inhibiting IL-18 reduced infarct size and enhanced cardiac function, underscoring its potential to address both acute and chronic cardiac dysfunction and remodeling.
CDK4 gene is associated with MYOD1 gene. According to Knight et al., the therapeutic promise of CDK4 for heart failure lies in its role in cell cycle regulation and proliferation [35]. The study identifies a redox-regulated disulfide bond in cyclin D-CDK4 that inhibits kinase activity, inducing cell cycle arrest in hyperproliferative pulmonary vascular cells. Hyperactive CDK4 in pulmonary arterial hypertension leads to vascular remodeling and increased resistance, suggesting that targeting CDK4 could mitigate these effects. Pharmacological agents like auranofin, which promote CDK4 disulfide bond formation, have shown efficacy in reducing disease severity in PH models. These findings indicate that modulating CDK4 activity could offer a novel approach for treating heart failure by addressing underlying vascular pathology.
SIRT2 gene is associated with MYOD1 gene. Wu et al. highlight the potential of the SIRT2 gene in treating heart failure, emphasizing its role in various cardiovascular conditions [36]. SIRT2 combats cardiac hypertrophy by deacetylating LKB1 and activating the AMPK pathway, affecting proteins like FOXO3a, FOXO1, and PGC1- . It also interacts with proteins such as 14-3-3 zeta, BAD, and p53 in myocardial ischemia-reperfusion injury and alleviates diabetic cardiomyopathy by deacetylating
  -tubulin, improving ventricular function. In heart failure, SIRT2 deacetylates PGC1-
 and interacts with BUBR1 and NFATc2 to delay cell aging and protect against heart failure.
SMAD7 gene is associated with MYOD1 gene. Meng et al. and Humeres et al. highlight SMAD7’s potential as a therapeutic target for heart failure, especially following MI [37, 38]. The study shows that SMAD7 is crucial in controlling fibroblast activation, which is vital for effective cardiac repair. By blocking the TGF- /Smad3 signaling pathway, SMAD7 prevents the overactivation of myofibroblasts, reducing fibrosis, inflammation, and adverse cardiac remodeling. This regulation helps preserve cardiac function and structure, slowing the progression to heart failure. Therefore, increasing SMAD7 expression is a promising approach to protect the heart from fibrosis and heart failure after MI.
JAK2 gene is associated with TNF gene. According to Baldini et al., the JAK2 gene shows great promise as a therapeutic target for heart failure due to its crucial role in the JAK-STAT pathway, which regulates cardiovascular health [39]. JAK2 Mutations like V617F are linked to increased cardiovascular risk from inflammation and thrombotic events. JAK2 inhibitors, such as ruxolitinib, have proven effective in reducing these risks and improving cardiovascular health in myeloproliferative neoplasm patients. By targeting inflammation, a key factor in heart failure progression, these inhibitors offer a promising treatment approach.
Discussion
In this study, we propose HIT, a fully explainable deep hypergraph representation learning model for predicting high-potential therapeutic gene targets for diseases of interest, leveraging curated disease-gene associations and their ontology datasets. Predicting these targets is crucial for developing personalized medicines such as gene therapy. Prior to HIT, deep graph representation learning models were the main approach to gain insights from biological associations. However, the graph structure has limitations in capturing the complex one-to-many relationships between biological entities. HIT overcomes this limitation by leveraging hypergraphs of heterogeneous biological entities, which represent the one-to-many relationships among them, and effectively captures the group semantics of the relationships by performing attention-based hypergraph representation learning. We believe that this methodology makes HIT to achieve state-of-the-art performance in classifying whether a gene has therapeutic potential and to demonstrate the ability to discover unknown but remarkable therapeutic candidates. These results indicate that HIT can accelerate the discovery of novel therapeutic gene targets and contribute to the understanding of disease mechanisms.
It is worth noting that our research does not use directional linkage information between genes since hyperedges in hypergraphs do not consider directionality between nodes, while genes influence each other directionally in pathway networks. The use of hypergraphs has a trade-off between capturing the one-to-many relationships of biological entities and capturing the directions between genes. We leave the consideration of directionality in hypergraphs of biological entities to future studies. In addition, we will explore broader applications of HIT, such as incorporating multi-omics data to build more comprehensive models to improve the understanding of disease-gene associations.
Key Points
We introduce the HIT model, an explainable deep hypergraph learning model for predicting therapeutic gene targets, capturing complex biological associations beyond binary relationships.
HIT’s robustness is validated using curated disease-gene and ontology association datasets, confirming its real-world applicability.
Our study shows HIT’s superior performance in predicting therapeutic genes, identifying promising candidates and providing insights into disease mechanisms.
The model is open-sourced on GitHub, promoting transparency, collaboration, and further research.
Supplementary Material
Contributor Information
Kibeom Kim, Division of Artificial Intelligence, Pusan National University, 2 Busandaehak-ro 63beon-gil, Geumjeong-gu, Busan 46241, South Korea.
Juseong Kim, Division of Artificial Intelligence, Pusan National University, 2 Busandaehak-ro 63beon-gil, Geumjeong-gu, Busan 46241, South Korea.
Minwook Kim, Division of Artificial Intelligence, Pusan National University, 2 Busandaehak-ro 63beon-gil, Geumjeong-gu, Busan 46241, South Korea.
Hyewon Lee, Department of Cardiology, Medical Research Institute, Pusan National University Hospital, 179 Gudeok-ro, Busan 49241, South Korea; College of Medicine, Pusan National University, 20 Geumo-ro, Yangsan 50612, Gyeongsangnam-do, South Korea.
Giltae Song, Division of Artificial Intelligence, Pusan National University, 2 Busandaehak-ro 63beon-gil, Geumjeong-gu, Busan 46241, South Korea; Department of Electrical and Computer Engineering, School of Computer Science and Engineering, Pusan National University, 2 Busandaehak-ro 63beon-gil, Geumjeong-gu, Busan 46241, South Korea; Center for Artificial Intelligence Research, Pusan National University, 2 Busandaehak-ro 63beon-gil, Geumjeong-gu, Busan 46241, South Korea.
Author contributions
K.K. designed the machine learning approaches, developed the tools, collected the data, performed the analysis, and wrote the paper; J.K. and M.K. contributed the computational approaches and the analysis; H.L. performed the clinical analysis and contributed to writing the paper; G.S. initiated, supervised, coordinated the work, and wrote the paper.
Conflict of interest. None declared.
Funding
This work was supported by Institute of Information & Communications Technology Planning & Evaluation (IITP) under the Artificial Intelligence Convergence Innovation Human Resources Development (IITP-2023-00254177) and the National Research Foundation of Korea (NRF) grant funded by the Korean government (MSIT) (No. 2021R1A2C2010775) and (No. 2022R1A4A1030189).
Data availability
The data underlying this article are available as pickle files in the ”HIT/datasets/Original_datasets” folder of the author’s Github repository at https://github.com/tigerkey10/HIT.
References
- 1. Malone ER, Oliva M, Sabatini PJ. et al.. Molecular profiling for precision cancer therapies. Genome Med 2020;12:1–19. 10.1186/s13073-019-0703-1. [DOI] [PMC free article] [PubMed] [Google Scholar]
- 2. Kurreeman FAS, Padyukov L, Marques RB. et al.. A candidate gene approach identifies the TRAF1/C5 region as a risk factor for rheumatoid arthritis. PLoS Med 2007;4:e278. 10.1371/journal.pmed.0040278. [DOI] [PMC free article] [PubMed] [Google Scholar]
- 3. Zhang Y, Showalter AM. CRISPR/Cas9 genome editing technology: a valuable tool for understanding plant cell wall biosynthesis and function. Front Plant Sci 2020;11:589517. 10.3389/fpls.2020.589517. [DOI] [PMC free article] [PubMed] [Google Scholar]
- 4. Zhou Z, Li M. Targeted therapies for cancer. BMC Med 2022;20:90. 10.1186/s12916-022-02287-3. [DOI] [PMC free article] [PubMed] [Google Scholar]
- 5. Graham DB, Root DE. Resources for the design of CRISPR gene editing experiments. Genome Biol 2015;16:1–21. [DOI] [PMC free article] [PubMed] [Google Scholar]
- 6. Patnala R, Clements J, Batra J. Candidate gene association studies: a comprehensive guide to useful in silico tools. BMC Genet 2013;14:1–11. 10.1186/1471-2156-14-39. [DOI] [PMC free article] [PubMed] [Google Scholar]
- 7. Lappalainen T, MacArthur D. From variant to function in human disease genetics. Science 2021;373:1464–8. 10.1126/science.abi8207. [DOI] [PubMed] [Google Scholar]
- 8. Yang S, Zhu F, Ling X. et al.. Intelligent health care: applications of deep learning in computational medicine. Front Genet 2021;12:607471. 10.3389/fgene.2021.607471. [DOI] [PMC free article] [PubMed] [Google Scholar]
- 9. Ferrero E, Dunham I, Sanseau P. In silico prediction of novel therapeutic targets using gene–disease association data. J Transl Med 2017;15:1–16. 10.1186/s12967-017-1285-6. [DOI] [PMC free article] [PubMed] [Google Scholar]
- 10. Domingo-Fernández D, Gadiya Y, Patel A. et al.. Causal reasoning over knowledge graphs leveraging drug-perturbed and disease-specific transcriptomic signatures for drug discovery. PLoS Comput Biol 2022;18:e1009909. 10.1371/journal.pcbi.1009909. [DOI] [PMC free article] [PubMed] [Google Scholar]
- 11. Han P, Yang P, Zhao P. et al.. GCN-MF: disease-gene association identification by graph convolutional networks and matrix factorization. In KDD ‘19. New York, NY: The Association for Computing Machinery (ACM), 2019;705–13. 10.1145/3292500.3330912. [DOI]
- 12. Li Y, Kuwahara H, Yang P. et al.. PGCN: disease gene prioritization by disease and gene embedding through graph convolutional neural networks Biorxiv. 101101/532226.2019:532226. Pre-print: not peer-reviewed.
- 13. He M, Huang C, Liu B. et al.. Factor graph-aggregated heterogeneous network embedding for disease-gene association prediction. BMC Bioinformatics 2021;22:1–15. 10.1186/s12859-021-04099-3. [DOI] [PMC free article] [PubMed] [Google Scholar]
- 14. Li Y, Guo Z, Wang K. et al.. End-to-end interpretable disease–gene association prediction. Brief Bioinform 2023;24:1–9. 10.1093/bib/bbad118. [DOI] [PubMed] [Google Scholar]
- 15. Boix CA, James BT, Park YP. et al.. Regulatory genomic circuitry of human disease loci by integrative epigenomics. Nature 2021;590:300–7. 10.1038/s41586-020-03145-z. [DOI] [PMC free article] [PubMed] [Google Scholar]
- 16. Kim CY, Baek S, Cha J. et al.. HumanNet v3: an improved database of human gene networks for disease research. Nucleic Acids Res 2022;50:D632–9. 10.1093/nar/gkab1048. (12 November 2023, date last accessed) [dataset]. [DOI] [PMC free article] [PubMed] [Google Scholar]
- 17. Aleksander SA, Balhoff J, Carbon S. et al.. The gene ontology knowledgebase in 2023. Genetics 2023;224:iyad031.Release date: 2023–0303[dataset]. 10.1093/genetics/iyad031. (12 November 2023, date last accessed). [DOI] [PMC free article] [PubMed] [Google Scholar]
- 18. Kibbe WA, Arze C, Felix V. et al.. Disease ontology 2015 update: an expanded and updated database of human diseases for linking biomedical knowledge through disease data. Nucleic Acids Res 2015;43:D1071–8[dataset]. 10.1093/nar/gku1011. (12 November 2023, date last accessed). [DOI] [PMC free article] [PubMed] [Google Scholar]
- 19. Köhler S, Gargano M, Matentzoglu N. et al.. The human phenotype ontology in 2021. Nucleic Acids Res 2021;49:D1207–17[dataset]. 10.1093/nar/gkaa1043. (12 November 2023, date last accessed). [DOI] [PMC free article] [PubMed] [Google Scholar]
- 20. Piñero J, Ramírez-Anguita JM, Saüch-Pitarch J. et al.. The DisGeNET knowledge platform for disease genomics: 2019 update. Nucleic Acids Res 2019;48:D845–55[dataset]. 10.1093/nar/gkz1021. (12 November 2023, date last accessed). [DOI] [PMC free article] [PubMed] [Google Scholar]
- 21. Miles LA, Garippa RJ, Poirier JT. Design, execution, and analysis of pooled in vitro CRISPR/Cas9 screens. FEBS J 2016;283:3170–80. 10.1111/febs.13770. [DOI] [PubMed] [Google Scholar]
- 22. Zhang Y, Nguyen TM, Zhang XO. et al.. Optimized RNA-targeting CRISPR/Cas13d technology outperforms shRNA in identifying functional circRNAs. Genome Biol 2021;22:1–22. 10.1186/s13059-021-02263-9. [DOI] [PMC free article] [PubMed] [Google Scholar]
- 23. Marchesin S, Silvello G. TBGA: a large-scale gene-disease association dataset for biomedical relation extraction. BMC Bioinformatics. 2022;23:1–16 ( [dataset]. 10.1186/s12859-022-04646-6. (12 November 2023, date last accessed). [DOI] [PMC free article] [PubMed] [Google Scholar]
- 24. Feng Y, You H, Zhang Z. et al.. Hypergraph neural networks. In: Proceedings of the AAAI Conference on Artificial Intelligence, Vol. 33, pp. 3558–65, 2019. [Google Scholar]
- 25. Liu J, Song L, Wang G. et al.. Meta-HGT: metapath-aware HyperGraph transformer for heterogeneous information network embedding. Neural Netw 2023;157:65–76. 10.1016/j.neunet.2022.08.028. [DOI] [PubMed] [Google Scholar]
- 26. Vaswani A, Shazeer N, Parmar N. et al.. Attention is all you need. Adv Neural Inf Process Syst 2017;30:1–9. [Google Scholar]
- 27. Loshchilov I, Hutter F. Decoupled weight decay regularization. arXiv. 2019. 1048550/arXiv171105101.
- 28. Kishan K, Li R, Cui F. et al.. Predicting biomedical interactions with higher-order graph convolutional networks. IEEE/ACM Trans Comput Biol Bioinform 2021;19:676–87. [DOI] [PMC free article] [PubMed] [Google Scholar]
- 29. Kipf TN, Welling M. Semi-supervised classification with graph convolutional networks arXiv. 2017. 1048550/arXiv160902907.
- 30. Wang L, Zhong C. gGATLDA: lncRNA-disease association prediction based on graph-level graph attention network. BMC Bioinformatics 2022;23:1–24. 10.1186/s12859-021-04548-z. [DOI] [PMC free article] [PubMed] [Google Scholar]
- 31. Fu X, Zhang J, Meng Z. et al.. MAGNN: metapath aggregated graph neural network for heterogeneous graph embedding. In: Proceedings of the Web Conference, Vol. 2020, pp. 2331–41. New York, NY: The Association for Computing Machinery (ACM), 2020. 10.1145/3366423.338029. [DOI] [Google Scholar]
- 32. Bazzone LE, Zhu J, King M. et al.. ADAM9 promotes type I interferon-mediated innate immunity during encephalomyocarditis virus infection. Nat Commun 2024;15:4153. 10.1038/s41467-024-48524-6. [DOI] [PMC free article] [PubMed] [Google Scholar]
-
33.
Schultheiss HP, Piper C, Sowade O. et al..
Betaferon in chronic viral cardiomyopathy (BICC) trial: effects of interferon-
 treatment in patients with chronic viral cardiomyopathy. Clin Res Cardiol 2016;105:763–73. 10.1007/s00392-016-0986-9.
[DOI] [PubMed] [Google Scholar]
treatment in patients with chronic viral cardiomyopathy. Clin Res Cardiol 2016;105:763–73. 10.1007/s00392-016-0986-9.
[DOI] [PubMed] [Google Scholar] - 34. O’Brien LC, Mezzaroma E, Van Tassell BW. et al.. Interleukin-18 as a therapeutic target in acute myocardial infarction and heart failure. Mol Med 2014;20:221–9. 10.2119/molmed.2014.00034. [DOI] [PMC free article] [PubMed] [Google Scholar]
- 35. Knight H, Abis G, Kaur M. et al.. Cyclin D-CDK4 disulfide bond attenuates pulmonary vascular cell proliferation. Circ Res 2023;133:966–88. 10.1161/CIRCRESAHA.122.321836. [DOI] [PMC free article] [PubMed] [Google Scholar]
- 36. Wu B, You S, Qian H. et al.. The role of SIRT2 in vascular-related and heart-related diseases: a review. J Cell Mol Med 2021;25:6470–8. 10.1111/jcmm.16618. [DOI] [PMC free article] [PubMed] [Google Scholar]
- 37. Meng J, Qin Y, Chen J. et al.. Treatment of hypertensive heart disease by targeting Smad3 signaling in mice. Mol Ther Methods Clin Dev 2020;18:791–802. 10.1016/j.omtm.2020.08.003. [DOI] [PMC free article] [PubMed] [Google Scholar]
-
38.
Humeres C, Shinde AV, Hanna A. et al..
Smad7 effects on TGF-
 and ErbB2 restrain myofibroblast activation and protect from postinfarction heart failure. J Clin Invest 2022;132(3):1–17. 10.1172/JCI146926. [DOI] [PMC free article] [PubMed] [Google Scholar]
 - 39. Baldini C, Moriconi FR, Galimberti S. et al.. The JAK–STAT pathway: an emerging target for cardiovascular disease in rheumatoid arthritis and myeloproliferative neoplasms. Eur Heart J 2021;42:4389–400. 10.1093/eurheartj/ehab447. [DOI] [PMC free article] [PubMed] [Google Scholar]
Associated Data
This section collects any data citations, data availability statements, or supplementary materials included in this article.
Supplementary Materials
Data Availability Statement
The data underlying this article are available as pickle files in the ”HIT/datasets/Original_datasets” folder of the author’s Github repository at https://github.com/tigerkey10/HIT.