

Abstract
Phospholipids are asymmetrically distributed in the plasma membrane (PM), with phosphatidylcholine and sphingomyelin abundant in the outer leaflet. However, the mechanisms by which their distribution is regulated remain unclear. Here, we show that transmembrane protein 63B (TMEM63B) functions as a membrane structure-responsive lipid scramblase localized at the PM and lysosomes, activating bidirectional lipid translocation upon changes in membrane curvature and thickness. TMEM63B contains two intracellular loops with palmitoylated cysteine residue clusters essential for its scrambling function. TMEM63B deficiency alters phosphatidylcholine and sphingomyelin distributions in the PM. Persons with heterozygous mutations in TMEM63B are known to develop neurodevelopmental disorders. We show that V44M, the most frequent substitution, confers constitutive scramblase activity on TMEM63B, disrupting PM phospholipid asymmetry. We determined the cryo-electron microscopy structures of TMEM63B in its open and closed conformations, uncovering a lipid translocation pathway formed in response to changes in the membrane environment. Together, our results identify TMEM63B as a membrane structure-responsive scramblase that controls PM lipid distribution and we reveal the molecular basis for lipid scrambling and its biological importance.
Subject terms: Cryoelectron microscopy, Membrane lipids
By combining genome-wide clustered regularly interspaced short palindromic repeats with Cas9 screening and cryo-electron microscopy structure analysis, the authors identified transmembrane protein 63B as a lipid scramblase that detects structural changes in the lipid bilayer and scrambles lipids to regulate membrane lipid distributions.
Main
The composition of lipid species and their distribution across the inner and outer leaflets of the plasma membrane (PM) are critical for defining cell structure and membrane physical properties, including rigidity, tension, curvature and fluidity1–3. In mammals, phospholipids in the PM are asymmetrically distributed. Phosphatidylcholine (PtdCho) and sphingomyelin (SM) represent 45–55% and 5–10% of total lipids, respectively, and are abundant in the outer leaflet. On the other hand, phosphatidylserine (PtdSer) and phosphatidylethanolamine (PtdEtn), which represent 5–10% and 15–25% of total lipids, respectively, are confined to the inner leaflet1,4–6. PtdCho and SM are important for the structural and biophysical characteristics of cell membranes, whereas PtdSer has critical roles in recruiting cytosolic proteins to the inner leaflet for signal transduction or phospholipid exchange reactions between the PM and the endoplasmic reticulum (ER) through lipid transfer proteins1,7–9. Cells actively disrupt phospholipid asymmetry and expose PtdSer and PtdEtn on the cell surface during various biological processes10. Externalized PtdSer acts as a signal to induce apoptotic cell clearance and blood coagulation and is also implicated in cell fusion, axon pruning and metalloproteinase activation10,11.
Three types of phospholipid translocases have been proposed to regulate the phospholipid distribution across the two leaflets11. Conventionally, flippases translocate PtdSer and PtdEtn from the outer to the inner leaflets, whereas floppases translocate PtdCho, SM and cholesterol from the inner to the outer leaflet12,13. Both flippases and floppases use adenosine triphosphate (ATP) to establish and maintain an asymmetrical phospholipid distribution. By contrast, scramblases randomize the phospholipid distribution across the two leaflets by translocating various membrane lipids bidirectionally without consuming energy, thereby breaking the phospholipid asymmetry10,11. Mammalian ATP8A and ATP11A–ATP11C and yeast ATP8A orthologs, which belong to type IV P-type (P4-)ATPases, function as flippases that translocate PtdSer and PtdEtn in the PM or intracellular organelles, such as the endosome and Golgi apparatus14–19. Some P4-ATPase members (ATP8B and ATP10) were recently reported to display unique or broad phospholipid preferences, such as PtdCho, phosphatidylglycerol (PtdGly), phosphatidic acid and glucosylceramide20–23. Transmembrane protein 16 (TMEM16) and XK-related (XKR) family members act as calcium-activated and caspase-activated scramblases, respectively24,25. ATP-binding cassette (ABC) transporters are proposed to work as floppases13. Although some ABC transporters mediate the efflux of PtdCho, SM and cholesterol from the PM, their contribution to the maintenance of PtdCho and SM in PM outer leaflets remains elusive26. In addition, PtdCho and SM are often subjected to degradation and enzymatic conversion by various phospholipases1,27,28; however, the mechanisms by which cells respond to these PM rearrangements are unclear.
Results
Identification of factors that affect PM PtdCho flipping
ATP11A and ATP11C serve as the primary PM PtdSer flippases29,30. A Q84E substitution in ATP11A, found in a person with severe developmental delay and neurological disorders, induced unidirectional PtdCho flipping, thereby decreasing PtdCho in the outer leaflet31. As reported, inward PtdCho flippase activity was negligible in both parental Ba/F3 and Ba/F3 cells expressing wild-type human (h)ATP11A but increased in Ba/F3 cells expressing hATP11A-Q84E using fluorescent nitrobenzoxadiazole (NBD)-conjugated PtdCho (NBD-PC) (Fig. 1a). Because PtdCho is abundant in the PM outer leaflet, unidirectional PtdCho flipping could create an imbalance of lipids between the leaflets of the lipid bilayer, altering membrane curvature22 (Fig. 1b). We hypothesized that molecules that translocate PtdCho from the inner leaflet to the outer leaflet could counteract the inward flipping of PtdCho by hATP11A-Q84E. On the basis of this hypothesis, we performed a genome-wide CRISPR–Cas9 screen and monitored PtdCho flipping activity to identify the molecules involved in PtdCho translocation between the leaflets of the lipid bilayer. Ba/F3 cells expressing mCherry-tagged hATP11A-Q84E (Ba/F3-hATP11A-Q84E-mCherry) were transformed with Cas9 and infected with lentiviruses carrying a GeCKO version 2 library composed of six single-guide RNAs (sgRNAs) targeting 20,611 genes32. Mutagenized cells were treated with NBD-PC at 15 °C for 6 min to minimize the effects of endocytosis-mediated membrane trafficking33. Cells with high inward NBD-PC flipping activity, whose expression level of hATP11A-Q84E-mCherry was retained within the same range, were collected by flow cytometry (~0.1%), expanded and subjected to additional sorting (Fig. 1c). After two repetitive sortings, NBD-PC flipping increased threefold in the sorted cells without affecting the hATP11A-Q84E protein expression levels. Deep sequencing analysis of the sorted cells revealed that sgRNAs for Slc19a2, Slc22a23 and Tmem63b accounted for more than 5% of the total reads. Additionally, more than five of the six designed sgRNAs were recovered (Fig. 1d), suggesting their involvement in PtdCho dynamics in the PM.
Fig. 1. Genome-wide CRISPR–Cas9 screen to identify genes affecting PtdCho dynamics.

a,f, PtdCho flippase activity. Ba/F3 cells or Ba/F3 cells expressing wild-type hATP11A or the Q84E mutant (a), and Ba/F3 cells, Ba/F3 cells or Tmem63bnull (Tm63bnull) transformants expressing the Q84E mutant, or Tm63bnull transformants expressing both mTMEM63B–Flag and the Q84E mutant (f) were incubated with NBD-PC at 15 °C and internalization of NBD-PC was measured by flow cytometry. Data were obtained in triplicate and represent the average median fluorescence intensity (MFI); error bars represent the s.d. P values were determined using a two-sided Student’s t-test. b, Schematic for PtdCho translocation in the PM. PtdCho flipping activity by the Q84E mutant is countered by unknown outward PtdCho translocation. c, Mutagenized cells expressing hATP11A-Q84E-mCherry were incubated with NBD-PC as above. Cells that exhibited high PtdCho flippase activity (0.1–3%) were sorted. Dot plots and histograms for NBD-PC (left) and hATP11A-Q84E-mCherry (right) are shown. The dotted circle indicates the sorted population. d, Genes plotted with percentages of detected reads against total reads and numbers of unique sgRNAs among six. Black arrows indicate three genes that cover >1% of total reads and five unique sgRNAs. e, Expression and localization of hATP11A-Q84E-mCherry. Ba/F3 (magenta) or Tm63bnull (cyan) cells expressing hATP11A-Q84E-mCherry were analyzed by flow cytometry (top) and confocal microscopy (bottom). Red, mCherry. Scale bar, 10 µm.
Among the three candidates involved in PtdCho membrane dynamics, we first focused on Tmem63b as a potential lipid translocase. Members of the TMEM63 family and their plant ortholog OSCAs (hyperosmolarity-gated calcium-permeable channels) have been proposed to function as mechanically activated ion channels34,35. Because TMEM63 and OSCA are structurally similar to TMEM16 calcium-activated scramblases35,36, we hypothesized that TMEM63B may have lipid scramblase activity. To investigate functions of Tmem63b, we established Tmem63b-null Ba/F3 (Tm63bnull) cells using the CRISPR–Cas9 system (Supplementary Fig. 1a). The cells were transformed with retroviruses expressing mCherry-hATP11A-Q84E (Fig. 1e). As shown in Fig. 1f, inward PtdCho flipping activity was enhanced 2.5-fold by Tmem63b deficiency (Tm63bnull-hATP11A-Q84E) compared to that of parental Ba/F3 cells expressing hATP11A-Q84E (Ba/F3-hATP11A-Q84E) and this increase was abolished by re-expression of mouse (m)Tmem63b (Tm63bnull-hATP11A-Q84E-mTmem63b). The Tmem63b deficiency did not affect hATP11A-Q84E mutant expression or its localization in the PM (Fig. 1e and Supplementary Fig. 1b). These results indicate that Tmem63b deficiency enhances inward PtdCho flipping by hATP11A-Q84E.
Lipid scrambling by TMEM63B
Next, we addressed the mechanisms by which TMEM63B affects PtdCho dynamics in the PM. Because TMEM63 and OSCAs have been proposed to function as mechanically activated ion channels34, we considered the possibility that TMEM63B has a similar regulatory system and activates lipid scrambling in response to changes in the physical properties of the membrane. β-cyclodextrin can remove cholesterol and thin the PM, leading to an increase in membrane tension and fluidity. Thus, it has been used to study various types of mechanosensitive channels37. This system was used to detect scramblase activity in response to membrane changes in Tm63bnull and Tm63bnull expressing enhanced green fluorescent protein (EGFP)-tagged mTMEM63B (Tm63bnull-mTMEM63B) cells (Fig. 2a). We first confirmed that the growth and morphology of Tm63bnull cells were not altered compared to those of the parental Ba/F3 or Tm63bnull-mTMEM63B cells (Extended Data Fig. 1a,b) and that the amount of major cellular lipids was not changed by Tmem63b deficiency as assessed by lipidomic analysis (Extended Data Fig. 1c and Supplementary Table 1). Expression of EGFP-tagged TMEM63B was confirmed by western blotting and confocal microscopy (Fig. 2b, c). The EGFP signal was detected at the PM as it overlapped with PlasMem Bright, a PM marker. As reported38, we observed that fluorescence signals colocalized with LysoTracker, a lysosome marker, suggesting that TMEM63B is present on both the PM and the lysosomes (Extended Data Fig. 1d). Figure 2d shows that treatment with 10 mM methyl β-cyclodextrin (MβCD) removed cholesterol from the PM of Tm63bnull and Tm63bnull-mTMEM63B cells, thereby reducing the binding of mCherry-D4, a fluorescence-conjugating cholesterol-binding domain of perfringolysin O39, to the same level.
Fig. 2. Activation of TMEM63B-mediated lipid scrambling in the PM.

a, Schematic of TMEM63B activation by cholesterol deprivation or extracellular phospholipases. b, EGFP-tagged mTMEM63B was expressed in Tm63bnull cells (Tm63bnull-mTMEM63B) and protein expression was analyzed by western blotting with anti-GFP antibody (top) and Ponceau S staining (bottom). c, Tm63bnull-mTMEM63B cells in the presence of PlasMem Bright (red). The merged image of EGFP (green) and PlasMem Bright with Hoechst 33342 (blue) is shown. Scale bar, 10 µm. d, Tm63bnull and Tm63bnull-mTMEM63B cells were treated with or without 10 mM MβCD, stained with 10 µg ml−1 mCherry-D4 and analyzed by flow cytometry. Data were obtained in triplicate and represent the average MFI and s.d. P values were determined using a two-sided Student’s t-test. e,f,i,j, Inward scramblase activity. Tm63bnull and Tm63bnull-mTMEM63B cells were treated with or without MβCD (e,f) or the indicated phospholipase (i,j), incubated with 0.1 µM NBD-PC (e,i) or 0.2 µM NBD-SM (f,j) at 4 °C and analyzed by flow cytometry. Data were obtained in triplicate and represent the average MFI and s.d. g, Annexin V staining. Left, Tm63bnull and Tm63bnull-mTMEM63B cells were treated with (magenta) or without (cyan) MβCD, stained with annexin V–Cy5, and analyzed by flow cytometry. Representative histograms for annexin V binding in the propidium iodide (PI)-negative populations are shown. Right, data were obtained in triplicate and represent the average MFI and s.d. h, Tm63bnull and Tm63bnull-mTMEM63B cells were treated with or without MβCD, incubated with cinnamycin, stained with and analyzed by flow cytometry. Data were obtained in triplicate and represent the mean and s.d. of the percentage of propidium iodide-positive cells. k–m, Tm63bnull and Tm63bnull-mTMEM63B cells were treated with (magenta) or without (cyan) the indicated concentration of PLD (k), PLC (l) or SMase (m), stained with annexin V–Cy5 and analyzed by flow cytometry. k, Left, representative histograms for annexin V binding in the propidium iodide-negative populations. Right, data were obtained in triplicate and represent the average MFI and s.d.
Extended Data Fig. 1. Characteristics of TMEM63B-mediated lipid scrambling in the PM.

a, Cell growth. Ba/F3 and Tmem63bnull cells (Tm63bnull) were cultured for 2 days and re-seeded at 2 × 10⁴ cells/mL. Viable cells were counted after staining with trypan blue, and average cell numbers were plotted. Experiments were performed in triplicate, and data represent average cell number plotted with SD (bar). The doubling times for Ba/F3 and Tmem63bnull cells are shown with SD. b, Electron microscopy images of Ba/F3 and Tm63bnull cells. Cells were incubated in phosphate buffer containing 2.5% glutaraldehyde and 2% paraformaldehyde, followed by osmium tetroxide fixation. Samples were double-stained with uranyl acetate and lead citrate, and images were acquired by transmission electron microscope. Bar, 2 µm c, Lipid profiles of Ba/F3, Tm63bnull and Tm63bnull-mTMEM63B cells. Total cellular lipids were analyzed in quintuplicate, and data represent average values with SD (bar) (n = 5). CE, Cholesterol ester. Chol, Cholesterol. DG, Diacylglycerol. TG, Triacylglycerol. PA, Phosphatidic acid. PC, Phosphatidylcholine. SM, Sphingomyelin. PS, Phosphatidylserine. PE, Phosphatidylethanolamine. PI, Phosphatidylinositol. PG, Phosphatidylglycerol. d, Tm63bnull-mTMEM63B-mCherry cells in the presence of PlasMem Bright, LysoTracker, ER Tracker, or GolgiSeeing. A merged image of mCherry (Magenta) and respective organelle markers (Green) with Hoechst 33342 (Blue) is shown. Bar, 10 µm. e,g,h,i, Annexin V staining. Ba/F3, Tm63bnull, or Tm63bnull-mTMEM63B cells were treated with or without 20 μM BAPTA-AM (calcium chelator) or 20 μM Q-VD-OPh (caspase inhibitor), treated with 10 mM MβCD (e) or 25 U/mL PLD (g, h), stained with Annexin V-Cy5, and analyzed by flow cytometry in the presence of 10 μg/mL propidium iodide. Representative histograms for Annexin V binding in the propidium iodide-negative population are shown (i). The experiments were repeated three times and data represent averages of MFI plotted with SD (bar) (e, g) or indicated (i). f, Cinnamycin sensitivity. Tm63bnull-mTMEM63B cells were treated with or without BAPTA-AM as above, treated with MβCD, incubated with 0.5 µM Cinnamycin, stained with propidium iodide, and analyzed by flow cytometry. The experiments were repeated three times and data represent averages of percentages of propidium iodide (PI)-positive cells plotted with SD (bar).
Scramblases bidirectionally and nonspecifically translocate phospholipids (Fig. 2a) and this activity can be detected even at 4 °C (ref. 40), a temperature at which ATP-dependent lipid translocation and membrane trafficking are suppressed. We examined inward scramblase activity using NBD-PC and NBD-SM24,40. As shown in Fig. 2e,f, Tm63bnull and Tm63bnull-mTMEM63B cells exhibited negligible incorporation of NBD-PC and NBD-SM on the cell surface under steady-state conditions; however, Tm63bnull-mTMEM63B cells strongly incorporated them in a time-dependent manner after MβCD treatment, indicating the inward scramblase activity of TMEM63B. Next, we examined the outward scramblase activity of PtdSer and PtdEtn, which are confined to the inner leaflet and occasionally exposed to the cell surface by activated scramblases24. As shown in Fig. 2g, annexin V, a PtdSer-binding protein, bound to Tm63bnull-mTMEM63B cells but not Tm63bnull cells after MβCD treatment. Treatment with 0.5 µM cinnamycin (Ro 09-0918), which binds and kills PtdEtn-exposing cells41, did not break the PM of Tm63bnull cells. By contrast, the same concentration of cinnamycin killed Tm63bnull-mTMEM63B cells after MβCD treatment, as shown by propidium iodide (PI) staining (Fig. 2h). These results indicated that MβCD treatment induced mTMEM63B-dependent PtdSer and PtdEtn exposure. We then investigated whether mTMEM63B-mediated lipid scrambling requires calcium because it shares structural similarities with TMEM16F, a calcium-dependent scramblase. As shown in Extended Data Fig. 1e,f, chelating intracellular Ca2+ with BAPTA-AM did not block either mTMEM63B-mediated PtdSer exposure or enhancement of cinnamycin sensitivity, indicating that TMEM63B does not require intracellular calcium for its scramblase activity.
Next, we examined whether TMEM63B-mediated scrambling is activated by other stimuli that alter the physical properties of the membrane. Phospholipase D (PLD) hydrolyzes PtdCho to generate phosphatidic acid with a small head group, thereby altering the curvature and electrostatic properties of the membrane42–44 (Fig. 2a). To investigate the effects of PLD treatment on TMEM63B-mediated scrambling, we treated mutant cells with 25 U per ml PLD and analyzed scramblase activity. As shown in Fig. 2i,j, Tm63bnull-mTMEM63B cells incorporated NBD-PC and NBD-SM after PLD treatment in a time-dependent manner. PLD-induced scrambling was not observed in Tm63bnull cells. Similarly, PLD treatment of Tm63bnull-mTMEM63B cells but not Tm63bnull cells strongly induced the binding of annexin V to the cell surface (Fig. 2k). PLD-induced PtdSer exposure in Tm63bnull-mTMEM63B cells was not blocked by BAPTA-AM or the pan-caspase inhibitor Q-VD-OPh (Extended Data Fig. 1g,h), suggesting that the observed scrambling was not mediated by calcium-activated TMEM16 or caspase-activated XKR scramblases. PLD-induced PtdSer exposure was also observed in parental Ba/F3 cells expressing endogenous TMEM63B (Extended Data Fig. 1i). Furthermore, TMEM63B-mediated PtdSer exposure was detected after treatment with other phospholipases that produce lipids with small head groups, such as phospholipase C (PLC, which hydrolyzes PtdCho to produce diacylglycerol) and SMase (which hydrolyzes SM to produce ceramide) (Fig. 2l,m). Together, these data suggest that TMEM63B induces lipid scrambling in response to changes in the properties of the membrane curvature or thickness.
Cryo-electron microscopy structure of mouse TMEM63B
To investigate the mechanisms underlying membrane structure-responsive lipid scrambling, we performed cryo-electron microscopy (cryo-EM) analysis of mTMEM63B. mTMEM63B was fused to EGFP, expressed in HEK293F cells and purified by anti-GFP nanobody affinity chromatography (Supplementary Fig. 2). The structures were determined in two different detergents, lauryl maltose neopentyl glycol (LMNG) with cholesterol hemisuccinate (CHS) and dodecyl maltoside (DDM) with CHS, with or without the YN9303-24 Fab that binds to the intracellular regions of mTMEM63B and stabilizes the open conformation (Supplementary Fig. 3 and Methods), at resolutions of 3.4 Å (LMNG–CHS), 3.6 Å (LMNG–CHS with YN9303-24), 6.7 Å (DDM–CHS) and 3.5 Å (DDM–CHS with YN9303-24) (Fig. 3a,b, Extended Data Figs. 2–5 and Table 1). mTMEM63B shares approximately 20% amino acid sequence identity with its plant ortholog OSCA (Extended Data Fig. 6) and the overall architecture of mTMEM63B is similar to that of OSCA1.1 and OSCA1.2 (refs. 35,36), consisting of 11 transmembrane domains (TMDs) and a large intracellular domain (ICD) between transmembrane helix 2 (TM2) and TM3 (Fig. 3c and Supplementary Fig. 4). We followed the nomenclature of OSCA1.2 for the domains and numbering of TM0–TM10 (ref. 35). OSCA shares architectural similarities with members of the TMEM16 family, which includes Ca2+-activated scramblases (TMEM16F) and anion channels (TMEM16A), all of which have similar dimeric architectures45,46 (Fig. 3d,e). By contrast, cryo-EM analysis of mTMEM63B revealed a monomeric structure (Fig. 3a,b,f).
Fig. 3. Cryo-EM structures of mTMEM63B.

a,b, Cryo-EM maps (a) and ribbon models (b) for mTMEM63B in LMNG–CHS (left) and DDM–CHS with Fab (right). Additional densities and models for lipid or CHS are shown in orange. The approximal micelle size is indicated. Arrowheads indicate two hook regions anchored to the micelles. c, Schematic diagram for mTMEM63B topology. Red circles indicate palmitoylated cysteines and yellow circles indicate cysteine clusters. d–f, Structural comparison of Arabidopsis thaliana (At) OSCA1.2 (d), mouse (m) TMEM16F (e) and mTMEM63B (f). Hook regions in OSCA and mTMEM63B are indicated. Insets show zoomed-in views for the two hook regions in mTMEM63B (f) and corresponding regions in AtOSCA1.2 (d). Scale bar, 10 Å (f). Cysteine residues are clustered in the hook regions in mTMEM63B. Red spheres indicate Ca2+ ions that activate mTMEM16F (e).
Extended Data Fig. 2. Cryo-EM data processing of mTMEM63B in the LMNG-CHS micelle.

a, Representative micrograph of mTMEM63B in LMNG-CHS. b, Data processing flow chart with representative 2D class averages and maps. c, Fourie shell correlation (FSC) curve of the Non-Uniform (NU)-refinement. d, Local resolution mapped on the locally-filtered refined map. e, Map vs model FSC curve, with the resolution threshold (FSC = 0.5). f, Orientation distribution of the particles used for NU-refinement.
Extended Data Fig. 5. Cryo-EM data processing of mTMEM63B in the DDM-CHS micelle with YN9303-24 Fab.

a, Representative micrograph of mTMEM63B in DDM-CHS with YN9303-24 Fab. b, Data processing flow chart with representative 2D class averages and maps. c, Fourie shell correlation (FSC) curve of the Non-Uniform (NU)-refinement. d, Local resolution mapped on the locally-filtered refined map. e, Map vs model FSC curve, with the resolution threshold (FSC = 0.5). f, Orientation distribution of the particles used for NU-refinement.
Table 1.
Cryo-EM data collection, refinement and validation statistics for mTMEM63B
| mTMEM63B in LMNG–CHS | mTMEM63B in LMNG–CHS with YN9302-Fab | mTMEM63B in DDM–CHS | mTMEM63B in DDM–CHS with YN9302-Fab | |
|---|---|---|---|---|
| EMD-37501, PDB 8WG3 | EMD-60251 | EMD-60252 | EMD-37502, PDB 8WG4 | |
| Data collection and processing | ||||
| Magnification | 105,000 | 105,000 | 105,000 | 105,000 |
| Voltage (kV) | 300 | 300 | 300 | 300 |
| Electron exposure (e− per Å2) | 50 | 50 | 50 | 50 |
| Defocus range (μm) | −0.8 to −1.6 | −0.8 to −1.6 | −0.8 to −1.6 | −0.8 to −1.6 |
| Pixel size (Å) | 0.83 | 0.83 | 0.83 | 0.83 |
| Symmetry imposed | C1 | C1 | C1 | C1 |
| Initial particle images (no.) | 2,634,800 | 13,746,257 | 1,866,794 | 6,757,787 |
| Final particle images (no.) | 110,878 | 408,554 | 290,946 | 456,579 |
| Map resolution (Å) | 3.39 | 3.63 | 6.96 | 3.47 |
| FSC threshold | 0.143 | 0.143 | 0.143 | 0.143 |
| Map resolution range (Å)a | 3.49–30.19 | 3.72–11.05 | 5.76–13.65 | 3.49–43.54 |
| Refinement | ||||
| Initial model used (AlphaFoldDB) | Q3TWI9 | Q3TWI9 | ||
| Model resolution (Å) | 3.4 | 3.4 | ||
| FSC threshold | 0.5 | 0.5 | ||
| Map sharpening B factor (Å2) | −118.5 | −145.3 | ||
| Model composition | ||||
| Nonhydrogen atoms | 4,585 | 5,887 | ||
| Protein residues | 548 | 688 | ||
| Ligands | 4 | 8 | ||
| B factors (Å2) | ||||
| Protein | 152.31 | 148.57 | ||
| Ligand | 143.68 | 168.15 | ||
| Root-mean-square deviations | ||||
| Bond lengths (Å) | 0.0088 | 0.0059 | ||
| Bond angles (°) | 1.55 | 1.49 | ||
| Validation | ||||
| MolProbity score | 1.54 | 1.25 | ||
| Clashscore | 0.86 | 0.92 | ||
| Rotamer outliers (%) | 3.30 | 1.82 | ||
| CaBLAM outlier (%) | 2.5 | 1.2 | ||
| EMRinger score | 2.29 | 2.27 | ||
| Model versus data CC (mask) | 0.75 | 0.73 | ||
| Q score | 0.60 | 0.62 | ||
| Ramachandran plot | ||||
| Favored (%) | 94.37 | 96.02 | ||
| Allowed (%) | 5.63 | 3.98 | ||
| Disallowed (%) | 0 | 0 | ||
aFSC threshold, 0.5; adaptive window size, 6. PDB, Protein Data Bank.
Extended Data Fig. 6. Amino acid sequence alignment of plant OSCA1 and vertebrate TMEM63B.

Amino acid sequences of mammalian TMEM63B (human: NP_001305721.1, mouse: NP_937810.2, chicken: NP_001366170.1, and zebrafish: XP_005157122.1) and its plant orthologues (OSCA1.1: NP_849297.1, OSCA1.2: NP_001078425.1) are shown. Alignment was performed using Clustal Omega attaining maximum homology (https://www.ebi.ac.uk/Tools/msa/clustalo/). Domains are designated as previously reported35. Transmembrane regions (TM) and intracellular linkers (IL) with helix (H) and β-sheet (β) are numbered and shaded in gray and magenta, respectively. Identical amino acids among species are indicated by asterisks. Amino acid residues found in patients with severe developmental and epileptic encephalopathy are colored in green52. Glutamate residues in TM6a of OSCA1 involved in its channel activity are colored in orange35. Palmitoylated cysteine residues found in present and previous studies are colored in magenta47,48. Amino acid residues affecting mTMEM63B-mediated scrambling and the outward TM incline in the DDM-CHS structure are highlighted in yellow and blue boxes, respectively.
It has been proposed that the ICD of OSCA1.2 contributes to dimeric interface formation through the region between IL2H4 and IL2β4 (ref. 35) (Fig. 3d and Extended Data Fig. 6). mTMEM63B has additional amino acid residues in the corresponding region and the resultant β-hairpin loop protrudes horizontally by approximately 10 Å (Fig. 3f), likely interfering with dimer formation. mTMEM63B has several cysteine residues at the cytoplasmic membrane boundary and some of the cysteine residues are clustered in this protruding loop and another loop between IL2H2 and IL2H3 (Fig. 3c,f). ICD is anchored to the micelle by these two loops (Extended Data Fig. 7a). We termed these half membrane-embedded loops in ICD ‘hook 1’ (IL2H2–IL2H3) and ‘hook 2’ (IL2H4–IL2β4) (Fig. 3c,f). It has been reported that C126 in IL1 and C327 in hook 1 are palmitoylated47,48 (Fig. 3c). Consistently, we observed an extra density near C126, which could be assigned to a palmitoyl moiety (Extended Data Fig. 7b,c). Using mass spectrometry (MS) analysis of the purified mTMEM63B protein, we found that several cysteine residues in the ICD and TMD were also palmitoylated (C51 in TM0, C126 in IL1, C382 and C398 in hook 2 and C726 and C729 in TM10) (Fig. 3c,f, Extended Data Fig. 7b,c and Supplementary Table 2). Most of these palmitoylated cysteine residues were conserved in vertebrate TMEM63 orthologs but not in plant OSCA, suggesting that vertebrate TMEM63B is highly palmitoylated (Extended Data Fig. 6).
Extended Data Fig. 7. Comparison of mTMEM63B in different detergent micelles.

a, Low-contoured unsharpened consensus maps show the ICD densities in both LMNG-CHS and DDM-CHS structures. The Hook1 region is located peripherally in the LMNG-CHS micelle that has a smaller diameter as compared to the DDM-CHS micelle. TMD and ICD are labeled, and the ICD region is indicated in yellow. b.c, Additional densities for the boundary lipid or CHS molecules and palmitoyl moiety attached to the Cys126 sidechain were observed for LMNG-CHS (b) and DDM-CHS with YN9303-24 Fab (c). The palmitoyl moieties in the Cys clusters in the two hook regions are not visible, due to high flexibility. TM numbering and IL1H (the TM0–TM1 loop) and Cys126 are indicated. d, Unsharpened consensus maps of mTMEM63B in LMNG-CHS (light green), LMNG-CHS with YN9303-24 Fab (light purple), DDM-CHS (orange), and DDM-CHS with YN9303-24 Fab (light blue) are shown. YN9303-24 Fab did not induce conformational changes in LMNG-CHS (left), while it induced significant conformational changes around lipid translocation pathway (LTP) and stabilizes the open form in DDM-CHS (middle). The comparison of the structures in LMNG-CHS and DDM-CHS without YN9303-24 Fab highlighted extracellular kinks of TM3 and TM4, induced by different micelle environments (right). e, Sections of the consensus maps in the transmembrane region (upper panels) and ICD (lower panels). The Hook1 region is less visible in LMNG-CHS.
Lipid translocation pathway and activation of mTMEM63B
The mTMEM63B cryo-EM structures obtained in LMNG–CHS and in DDM–CHS with Fab captured closed and open forms, respectively, while the structure in DDM–CHS without Fab captured the intermediate state between the two forms (Extended Data Fig. 7d,e). Structural comparisons between the closed and open forms revealed notable conformational changes in TMD, especially in TM3, TM4, TM5 and TM6 (Fig. 4a,b and Extended Data Fig. 8a). Compared to the closed form, the open form of mTMEM63B shows outward inclines of TM3, TM4 and TM5 on the extracellular side, involving kinks at P451, P492 and P530, respectively, as well as an inward shift and α-helix formation of TM6b on the intracellular side (Fig. 4a and Extended Data Fig. 8a). Consequently, these conformational changes create a large cleft on the lateral side, surrounded by TM0, TM4, TM5, TM6 and TM8, which is exposed to the lipid membrane and connect the cytoplasmic and extracellular environments (Fig. 4b). This large cleft seems sufficient to allow a phospholipid head group to pass through and it could function as a possible lipid translocation pathway (LTP) of mTMEM63B. Notably, this groove is conserved in the mTMEM16F scramblase, closely resembling the proposed activation process in the axes of TM3, TM4 and TM6, but differs from that of the anion channel mTMEM16A11,49 (Fig. 4a and Extended Data Fig. 8b,c). Together, these structural comparisons suggest that the molecular basis of lipid scrambling by mTMEM63B resembles that of the mTMEM16F scramblase.
Fig. 4. mTMEM63B LTP.

a, Comparison of closed (blue) and open (orange) conformations for TM3–TM6 in mTMEM63B (left), mTMEM16F (F518 mutant) (middle; Ca2+-free: PDB 8B8G, Ca2+-bound: PDB 8B8J) and mTMEM16A (right; Ca2+-free: PDB 5OYG, Ca2+-bound: PDB 5OYB). Red arrows indicate conformational changes upon activation. Red spheres indicate Ca2+ ions. b, Surface representation of mTMEM63B in LMNG–CHS (left) and DDM–CHS with Fab (right). Bottom, the cutaway surface at the dotted line in the top panels, with ribbon model and TM numbering indicated. Stick models indicate bound lipids and CHS. Red arrowheads indicate the LTP. c,d, Residues constituting LTP are shown for LMNG–CHS (left, closed) and DDM–CHS with Fab (right, open). The lateral cleft is depicted in light green. e, EGFP-mTMEM63B was expressed and analyzed by western blotting with anti-GFP antibody (top, short exposure; middle, long exposure; bottom, Ponceau S staining). Black arrows indicate mTMEM63B. f,g,n,o, Inward scrambling of NBD-PC (f,n) and NBD-SM (g,o). Tm63bnull and their transformants were pretreated with (f,g) or without (n,o) MβCD, incubated with 0.1–0.2 µM NBD-PC for 5–7 min (f,n) and 0.2-1 µM NBD-SM for 7–15 min (g,o) and analyzed by flow cytometry. Data were obtained in triplicate and represent the MFI (n,o) or relative scramblase activity compared to that of wild-type mTMEM63B (f,g). Error bars represent the s.d. h,i,p,q, Outward scrambling of PtdSer (h,p) and PtdEtn (i,q). Tm63bnull cells or their transformants were incubated with (h) or without (p) MβCD, stained with annexin V–Cy5 and analyzed by flow cytometry. Data were obtained in triplicate; error bars represent the s.d. i,q, Tm63bnull cells or their transformants were pretreated with (i) or without (q) MβCD and treated with cinnamycin; the percentage of propidium iodide-positive cells was determined by flow cytometry. Data were obtained in triplicate and represent percentages (q) or relative propidium iodide positivity rate compared to that of wild-type mTMEM63B-expressing cells (i); error bars represent the s.d. j–m, Changes in TM6 in mTMTM16F (j,k) and mTMEM63B (l,m). Sticks indicate residues constituting the Ca2+ site in mTMEM16F and corresponding residues in mTMEM63B.
Extended Data Fig. 8. Comparison of TMEM16 family members and TMEM63B.

a, Conformational changes between mTMEM63B in LMNG-CHS and DDM-CHS with Fab are shown for each TM helix. Kink-inducing residues, such as Pro and Gly, are indicated. b,c, Surface representation of the mTMEM16F scramblase (F518 mutant) (A; Ca2+-free: 8B8G and Ca2+-bound: 8B8J) and the mTMEM16A ion channel (B; Ca2+-free: 5OYG, Ca2+-bound: 5OYB) in inactive (left) and Ca2+-bound active (right) forms are shown. Lower panels show the cutaway surface at the dotted line in the upper panels, with ribbon model and TM numbering indicated. mTMEM16F shows a large cleft at the lateral side in the active-like form, whereas mTMEM16A does not have such a cleft. d,g, Tm63bnull cells expressing EGFP or mCherry-tagged WT or mutated mTMEM63B (Green or Magenta) were observed with a confocal microscope in the presence of PlasMem Bright. A merged image of TMEM63B-EGFP (Green) or -mCherry (Magenta) and PlasMem Bright with Hoechst 33342 (Blue) is shown. Bar, 10 µm. e, Amino acid sequences of TMEM16 [nhTMEM16 (UniProtKB: 6QM6), mouse TMEM16A (UniProtKB: Q8BHY3), human TMEM16F (UniProtKB:Q4KMQ2), mouse TMEM16F U (UniProtKB:Q6P9J9)] and mouse TMEM63B [UniProt: Q3TWI9] are aligned using Clustal Omega attaining maximum homology (https://www.ebi.ac.uk/Tools/msa/clustalo/). Transmembrane segments are shadowed in gray and numbered. Amino acid residues affecting mTMEM63B-mediated scrambling are highlighted in yellow box. Acidic residues for Ca2+-binding in TMEM16 are highlighted in magenta. Inner activation domain between TM4 and TM5 in TMEM16 is indicated by green line90. Identical amino acids among mammalian TMEM16F and TMEM63B are indicated by asterisks. f, mCherry-tagged WT- or Cys-mutants was expressed in Tm63bnull cells and analyzed by western blotting with anti-mCherry antibody (Top). CBB staining (Bottom).
Molecular basis for lipid scrambling of mTMEM63B
Hydrophilic residues in TMD have a critical role in lipid translocation in lipid scramblases and flippases11,49,50. mTMEM63B has several hydrophilic residues along the putative LTP, which are highly conserved among vertebrate TMEM63 orthologs (Extended Data Fig. 6). We selected well-conserved charged residues, including D48 in TM0, D584, R587 and R597 in TM6 and K655 and D659 in TM8, as candidate residues involved in lipid translocation (Fig. 4c,d and Extended Data Fig. 6). We also selected W485 in TM4 because its corresponding residue in OSCA1.2, which is substituted with lysine (K655), is predicted by molecular dynamics simulation to interact with phospholipids35. To assess their roles in lipid scrambling, these residues were substituted to alanine and the mutants were tagged with EGFP and stably expressed in Tm63bnull cells. Western blotting and confocal microscopy revealed that the D48A (TM0), W485A (TM4), R587A (TM6) and R597A (TM6) mutants were expressed and localized in the PM in a manner similar to wild-type mTMEM63B (Fig. 4e and Extended Data Fig. 8d), suggesting that these substitutions did not affect protein expression and localization. However, upon MβCD treatment, Tm63bnull cells expressing these mutants, especially D48A, W485A and R587A, exhibited decreased incorporation of NBD-PC and NBD-SM by 51–94% and 48–81%, respectively, compared to the WT, indicating impaired inward scrambling (Fig. 4f,g). Consistently, the outward scramblase activity assayed with annexin V and cinnamycin was strongly reduced in these mutant cells by 74–90% and 34–78%, respectively, compared to the wild type (Fig. 4h,i). Notably, W485A, which is located in the middle of TM4 in the LTP, almost completely lost the MβCD-induced inward and outward scrambling. These results indicate that phospholipids pass through the LTP, with their phospholipid head groups recognized by these charged residues, and that W485 may interact with translocating phospholipids.
Mammalian TMEM16F contains several acidic residues on the cytoplasmic side of TM6, TM7 and TM8, which constitute the Ca2+-binding sites that are highly conserved in the TMEM16 family49 (Fig. 4j,k and Extended Data Fig. 8e). Binding of Ca2+ ions alters inter-TM helix interactions, thereby inducing conformational changes in the TM6–TM8 helices, especially in the cytoplasmic segment of TM6 (TM6b), which is presumably a critical switch for its activation11,49 (Fig. 4a,j,k). Although mTMEM63B is most likely to undergo a similar inward shift to TM6b upon activation (Fig. 4a), these acidic residues for Ca2+-binding sites are not conserved in the OSCA or TMEM63 family (Extended Data Fig. 8e). Consistent with this, mTMEM63B-mediated scrambling was not blocked by chelating intracellular Ca2+ ions (Extended Data Fig. 1e–g). Instead, some of the corresponding residues in mTMEM63B (D584 on TM6 and K655 and D659 on TM7) formed inter-TM helix ionic interactions (Fig. 4l,m) and these residues did not change their conformation upon transition between the open and closed states. Substitution of these charged residues with alanine (D584A, K655A and D659A) severely reduced the expression level of TMEM63B in western blot analysis. Accordingly, EGFP signals from these mutants were decreased in the PM (Fig. 4e and Extended Data Fig. 8d), suggesting that the interhelical interactions among D584, K655 and D659 residues are essential for the stability of mTMEM63B. Interestingly, K655A exhibited constitutive scramblase activity in the PM. As shown in Fig. 4n,o, cells expressing K655A strongly incorporated NBD-PC and NBD-SM under steady-state conditions, despite the low protein expression levels of the mutant, suggesting enhanced inward scrambling. Accordingly, K655A-expressing cells were stained with annexin V, exposing PtdSer to the cell surface (Fig. 4p). Similarly, cinnamycin efficiently killed K655A-expressing cells under steady-state conditions, indicating outward PtdEtn scrambling (Fig. 4q). Altogether, these data suggest that the K655A mutant functions as a constitutively active scramblase in the PM. The K655A substitution disrupted the interhelix interactions between TM6 and TM8 and likely affected the TM6b conformation to activate mTMEM63B (Fig. 4l,m). Although D584A-expressing or D659A-expressing cells did not show inward scramblase activity to flip NBD-PC and NBD-SM (Fig. 4n,o) or outward PtdSer scrambling as assessed by annexin V (Fig. 4p), these cells were killed by cinnamycin treatment, indicating outward PtdEtn scrambling. The D584A and D659A substitutions may mildly affect the inter-TM helix interactions and provide a path that allows PtdEtn, which has a small head group, to pass through.
Membrane sensing by TMEM63B
The cryo-EM densities of the TMEM63B maps revealed several lipid molecules bound at the TM region, indicating close association with the lipid membrane (Extended Data Fig. 7b). A PtdCho lipid was stably bound between LTP-forming TM3 and TM5, suggesting its potential role in response to changes in membrane environments. In addition, the appearance of the ICD density varied between the DDM–CHS and LMNG–CHS micelles (Fig. 5 and Extended Data Fig. 7a), suggesting that ICD associates with the lipidic environment through palmitoyl moieties attached to the cysteine clusters at the membrane boundaries, including the two hook regions (Fig. 5a). To examine the importance of palmitoylated cysteine residues, these cysteine residues were substituted to serine residues (ΔCys-IL1, C126S and C144S; ΔCys-hook 1, C316S, C320S, C321S, C322S and C327S; ΔCys-hook 2, C382S, C384S, C387S, C389S and C398S; ΔCys-all, all cysteine-to-serine substitutions)51 and mCherry-tagged ΔCys mutants were stably expressed in the Tm63bnull cells for analysis. As shown in Extended Data Fig. 8f,g, the ΔCys-all mutant exhibited greatly reduced expression levels and failed to localize at the PM, suggesting that palmitoylations at these cysteine clusters are crucial for targeting mTMEM63B to the PM and maintaining protein stability. The Tm63bnull cells expressing the ΔCys-all mutant consistently showed no scramblase activity upon MβCD treatment as assayed by annexin V (Fig. 5b). On the other hand, other ΔCys mutants were expressed comparably to wild-type mTMEM63B and localized at the PM. However, Tm63bnull cells expressing ΔCys-hook 1 or ΔCys-hook 2 mutant lost TMEM63B-mediated scramblase activity to expose PtdSer. These data suggest that the cysteine clusters or palmitoylations in hooks 1 and 2 are required for TMEM63B-mediated lipid scrambling to expose PtdSer in response to changes in the membrane structure.
Fig. 5. A model for membrane sensing by mTMEM63B.
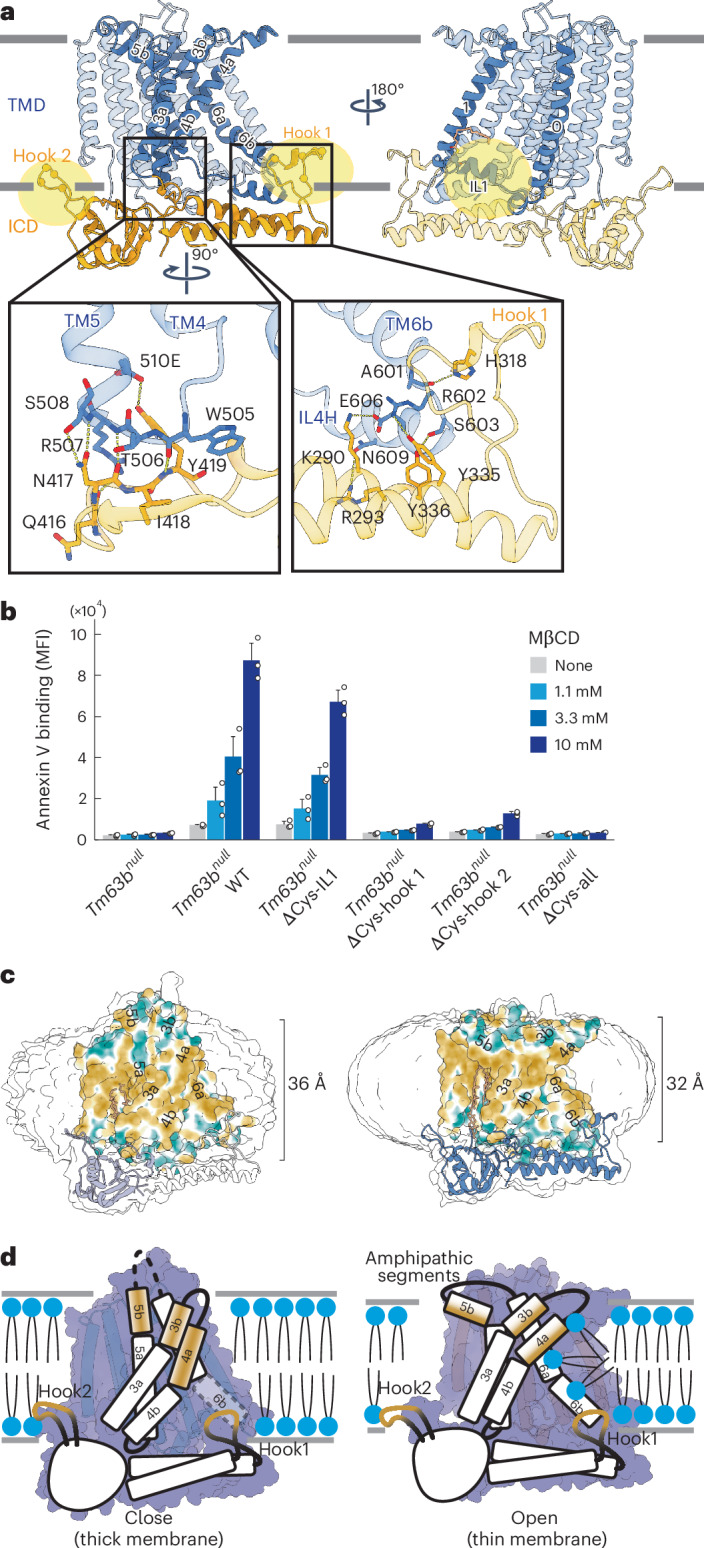
a, Interactions between ICD (orange) and TMD (cyan) with the two hook regions. Palmitoylated cysteine clusters are indicated in yellow. Insets show the zoomed-in views for contact regions between ICD and TMD. Sticks indicate the residues involved and yellow dotted lines indicate potential hydrogen-bonding interactions. b, Tm63bnull cells or their transformants were incubated with or without the indicated concentrations of MβCD, stained with annexin V–Cy5 and analyzed by flow cytometry. Experiments were repeated three times; error bars represent the s.d. c, The molecular lipophilicity potential is mapped on the surface representation of mTMEM63B in LMNG–CHS (left) and DDM–CHS with Fab (right), with color codes from dark cyan (most hydrophilic) through white to dark goldenrod (most lipophilic), suggesting that the LMNG–CHS structure has a longer membrane traverse region on TM3–TM6 compared to the DDM–CHS structure. d, Proposed mechanism for mTMEM63B activation. ICD is anchored to the cytoplasmic membrane leaflet through the palmitoylated hook regions, while TM3b, TM4a and TM5b associate with the extracellular membrane leaflet. The combination of these structural elements could enable the sensing of various changes in physical properties of the lipid membrane and stimulate conformational changes to open the extracellular hydrophobic gate of LTP.
The mTMEM63B ICD likely floats on the inner leaflet of the PM through palmitoyl moieties and senses changes in membrane structure. The ICD contacts the TMD in two regions: one with IL3 (TM4–TM5 loop) and the other with IL4 (ILH4 and TM6b) (Fig. 5a). This interaction is mediated through both hydrophilic and hydrophobic residues, including W505 and R507 (IL3) and R602 and E606 (IL4). As observed, the hook 1 region directly contacts TM6b and stabilizes its α-helical conformation in the open form. Therefore, ICD likely induces conformational changes in TMD through these contact regions. Structural changes were also observed in the extracellular amphipathic segments of TM3b, TM4a and TM5b. Although these segments were oriented parallel to the lipid membrane in the open form, they adopted straight conformations and were more widely exposed to the bulk membrane environment in the closed form (Fig. 5c,d). Although the current structures were obtained in detergent micelles and, thus, might not accurately represent conformational changes in the PM, the features of the ICD and the extracellular amphipathic segments of TM3b, TM4a and TM5b probably allow mTMEM63B to sense diverse physical changes in lipid membranes (Fig. 5d and Supplementary Video 1). It should be noted that the extracellular kinks of TM3, TM4 and TM5 were similarly observed in the intermediate state (DDM–CHS without Fab), suggesting that the thinner micelle of DDM–CHS itself could induce these kinks (Extended Data Fig. 7d). Fab binding further induced a conformational change and stabilized the open form only in DDM–CHS, although Fab, whose epitope is in the intracellular region of mTMEM63B, was not visualized in the current cryo-EM maps, likely because of the flexibility of the epitope region.
Constitutively active lipid scrambling by the V44M mutant
Several heterozygous and de novo mutations in the TMEM63B gene have been identified in individuals with severe neurodevelopmental disorders and epilepsy52. Many of these mutations are located in the extracellular gate (Fig. 6a) and the V44M substitution was the most frequent in this cohort. This valine residue is located on the extracellular side of TM0 and constitutes the hydrophobic gate of LTP, restricting lipid translocation in the closed form (Figs. 4d and 6a). The residues constituting the hydrophobic gate, including V44, I474 and F478, were highly conserved in vertebrate TMEM63B (Fig. 4d and Extended Data Fig. 6). To investigate the effects of the V44M substitution, EGFP-tagged wild-type and V44M mTMEM63B were stably expressed in the parental Ba/F3 cells. The V44M mutant protein was expressed at lower levels than wild-type mTMEM63B and was weakly detected in the PM, suggesting that the substitution affected protein stability (Fig. 6b and Extended Data Fig. 9a). First, we investigated the inward scramblase activity under steady-state conditions. As shown in Fig. 6c,d, Ba/F3 cells expressing the V44M mutant (Ba/F3-mTMEM63B-V44M) strongly incorporated NBD-PC and NBD-SM compared to Ba/F3 and Ba/F3 expressing wild-type mTMEM63B (Ba/F3-wild-type mTMEM63B) cells. Notably, few SM-rich domains detected using nontoxic lysenin (NT-Lys)53 were present on the surface of Ba/F3-mTMEM63B-V44M cells, which was consistent with an increase in inward SM scrambling (Fig. 6e,f). Next, we investigated the outward V44M-mediated scrambling and found that PtdSer and PtdEtn were massively exposed on the cell surface of Ba/F3-mTMEM63B-V44M cells. The binding of annexin V to Ba/F3-mTMEM63B-V44M cells was 66-fold higher than that to the control cells (Fig. 6g). The binding of annexin V to mutant cells was comparable to that observed in apoptotic Ba/F3-mFas cells (FasL-treated Ba/F3 expressing mouse Fas) exposed to high levels of PtdSer (Fig. 6h). Furthermore, Ba/F3-mTMEM63B-V44M cells were killed by cinnamycin at a concentration as low as approximately 0.1 µM, suggesting the outward scrambling of PtdEtn in steady-state conditions (Fig. 6i). These data suggest that V44M is the dominant substitution with constitutive scramblase activity. Introducing a bulky methionine side chain at the hydrophobic gate most likely hinders gate closure. Ba/F3-mTMEM63B-V44M cells exhibited a lower proliferation rate than parental Ba/F3 and Ba/F3-wild-type mTMEM63B cells (Extended Data Fig. 9b) and EM revealed that Ba/F3-mTMEM63B-V44M cells frequently carried enlarged vesicle structures in the cytoplasm (Extended Data Fig. 9c). This suggests that V44M mutant-mediated scrambling compromises the asymmetrical distribution of phospholipids in the PM and cellular integrity.
Fig. 6. V44M mutant disrupts phospholipid asymmetry by constitutively active lipid scrambling.

a, Schematic of LTP with reported pathogenic amino acid substitutions of human TMEM63B. Pathogenic amino acid substitutions are mapped on the current structures of closed (left; LMNG–CHS) and open (right; DDM–CHS with Fab) forms, with the most frequent pathogenic substitution, V44M, labeled in pink. b, EGFP-tagged wild-type mTMEM63B or V44M mutant was expressed in parental Ba/F3 cells and analyzed by western blotting with anti-GFP antibody (top) and Ponceau S staining (bottom). c,d, Inward scramblase activity. Ba/F3, Ba/F3-wild-type mTMEM63B or Ba/F3-mTMEM63B-V44M were incubated with 0.1 µM NBD-PC (c) or 1 µM NBD-SM (d) at 15 °C and analyzed by flow cytometry. Data were obtained in triplicate and represent the average MFI; error bars represent the s.d. e,f, NT-Lys-RFP staining. Ba/F3 cells or their transformants were stained with 10 µg ml−1 NT-Lys-RFP and analyzed with flow cytometry (e) or confocal microscopy (f). Data were obtained in triplicate and represent the average MFI and s.d. in SYTOX blue-negative population shown in histograms (e). Scale bar, 10 µm (f). g,h, Ba/F3 cells or their transformants were stained with annexin V–Cy5. To induce apoptosis, Ba/F3-mFas cells were treated with (cyan) or without (magenta) mFasL for 4 h at 37 °C. (g; right). Data were obtained in quadruplicate and represent the average MFI; error bars represent the s.d. i, Ba/F3 cells or their transformants were treated with the indicated concentrations of cinnamycin. LDH release was determined as compared to that released by 1% Triton X-100 treatment. Data were obtained in triplicate and represent average percentages; error bars represent the s.d.
Extended Data Fig. 9. Characteristics of Ba/F3 TMEM63B mutant cells.

a, Ba/F3 cells expressing EGFP-tagged WT or V44M mTMEM63B (Green) were observed with confocal microscopy in the presence of PlasMem Bright (Red). Merged image of EGFP (Green) and PlasMem Bright with Hoechst 33342 (Blue) is shown. Bar, 10 µm. b, Cell growth. Parental Ba/F3 and their transformants were cultured for 2 days and re-seeded at 2 × 10⁴ cells/mL. Viable cells were counted with trypan-blue staining and average cell numbers were plotted. Experiments were performed in triplicate, and data represent average cell numbers plotted with SD (bar). Doubling times for Ba/F3, Ba/F3-mTMEM63B, and Ba/F3-V44M cells are shown with SD. The doubling time is shown with SD value in the column. c, Electron microscopy images of Ba/F3, Ba/F3-mTMEM63B, and Ba/F3-V44M cells. Cells were incubated in phosphate buffer containing 2.5% glutaraldehyde and 2% paraformaldehyde, followed by osmium tetroxide fixation. Samples were double-stained with uranyl acetate and lead citrate, and images were acquired by transmission electron microscope. Arrowheads indicate enlarged vesicle structures. The region indicated by dotted line is shown with higher magnification in red box. Bar, 2 µm for left and middle panels, and 1 µm for right panel. d, Ba/F3 cells or their transformants were stained with Annexin V-Cy5 and SytoxBlue, and their Annexin V and SytoxBlue profiles are shown. Data were obtained in triplicate and represent average MFI is shown with SD. e, Ba/F3 cells or their transformants were treated with the indicated concentrations of cinnamycin. LDH release was determined as compared with that released by 1% Triton-X100 treatment. Data were obtained in triplicate and represent average percentages with SD (bar).
TMEM63B regulates PtdCho and SM distribution in the PM
Lastly, we examined the physiological role of TMEM63B in the PM lipid distribution. Phospholipids in the outer PM leaflet were extracted and replaced with SM-loaded methyl α-cyclodextrin (MαCD)54. Cellular PtdCho and SM were metabolically labeled with [methyl-14C]choline and analyzed using thin-layer chromatography (TLC). Consistent with the lipidomic analysis (Extended Data Fig. 1c), the amounts of total cellular [14C]PtdCho and [14C]SM were not affected by TMEM63B deficiency in Ba/F3 and Tm63bnull cells (Fig. 7a). By contrast, the amount of these lipids in the PM outer leaflet was altered by TMEM63B deficiency; that is, [14C]PtdCho was decreased by approximately 30–40%, whereas [14C]SM was increased twofold in Tm63bnull cells, as compared to Ba/F3 cells. These changes were restored to the normal level by the expression of mTMEM63B-EGFP. Consistently, SM-rich domains detected by NT-Lys increased twofold in Tm63bnull cells compared to those in control cells (Fig. 7b). The asymmetrical distribution of PtdSer and PtdEtn was not affected in the PM of Tm63bnull cells (Extended Data Fig. 9d,e). These data suggest that TMEM63B regulates the distribution of PtdCho and SM in the outer leaflet of the PM.
Fig. 7. TMEM63B deficiency alters PtdCho and SM distribution in the PM outer leaflet.
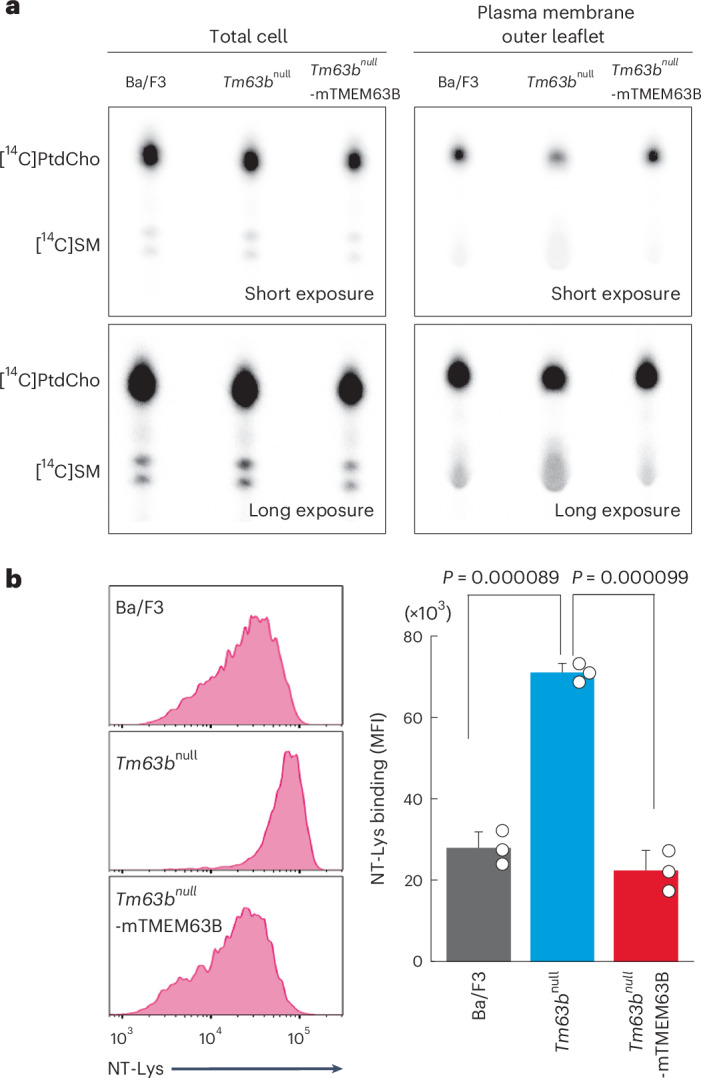
a, Ba/F3, Tm63bnull and Tm63bnull-mTMEM63B-EGFP cells were labeled with [14C]choline. Total cellular lipids (left) and lipids extracted by SM-loaded MαCD from the PM outer leaflet (right) were separated by TLC. b, Ba/F3 cells or their transformants were stained with 10 µg ml−1 NT-Lys-RFP and analyzed with flow cytometry. Left, representative histograms for NT-Lys. Right, data were obtained in triplicate and represent the average MFI and s.d. in the SYTOX blue-negative population shown in histograms. P values were determined using a two-sided Student’s t-test.
Discussion
TMEM63B functions as a membrane structure-responsive lipid scramblase and is crucial for regulating PtdCho and SM distribution in the PM (Fig. 7); however, the mechanisms remain elusive because it scrambles lipids and is not specific to PtdCho and SM. PtdCho is abundant in the PM outer leaflet6. PtdCho synthesis occurs on the cytoplasmic side of the ER and the synthesized PtdCho is quickly transported to the PM inner leaflet by lipid transfer proteins1,7,9 (Extended Data Fig. 10). TMEM63B may sense lipid accumulation in the inner leaflet and randomize these lipids across the PM bilayer, contributing to the translocation of PtdCho to the outer leaflet. Conversely, SM is synthesized from PtdCho and ceramide on the luminal side of the Golgi9; thus, SM is localized in the PM outer leaflet. TMEM63B activation induces SM translocation to the inner leaflet, with data showing that SM on the surface disappeared in the V44M mutant-expressing cells while it increased in the Tm63bnull cells. This suggests that TMEM63B affects SM distribution on the cell surface. Although some SM clusters have been detected in the PM inner leaflet in mammalian cells6,55, their fate remains unclear. The dynamics of PtdCho and SM in the PM inner leaflet and Golgi, along with their metabolic processes, will require further investigation. Activated TMEM63B also exposes PtdSer and PtdEtn on the cellular surface; however, P4-ATPases restore their asymmetrical distribution by flipping them into the inner leaflet14,16. Collectively, our data suggest that the distribution of PM lipids is maintained by several lipid translocases, such as P4-ATPases and TMEM63B (Extended Data Fig. 10).
Extended Data Fig. 10. Regulation of distribution of phospholipids in the PM.

At steady-state conditions, PtdSer and PtdEtn are confined to the inner leaflet of PMs by P4-ATPases. PtdCho and SM are rich in the PM outer leaflet, and TMEM63B is inactive. Once the physical properties of PMs are changed by phospholipases, such as PLD and SMase, or PtdCho accumulation into the PM inner leaflet, TMEM63B is activated to randomize lipids in the PM, resolving the compositional or quality imbalances across the lipid bilayer. After (or coupled with) the randomization, PtdSer and PtdEtn are confined to the PM inner leaflet by P4-ATPases. Finally, these rearrangements of lipid distribution of the PM may lead to the inactivation of TMEM63B. The TMEM63B-mediated lipid scrambling contributes to PtdCho localization to the PM outer leaflet and balances between PtdCho and SM at steady-state conditions.
Mammalian cells express various phospholipases and overproduction of lipids with small head groups critically alters membrane properties43; thus, TMEM63B may accommodate these membrane changes by randomizing lipid distribution. When pore-forming proteins damage the PM, acid SMase is exocytosed into the extracellular environment and the resulting ceramides induce membrane invagination and internalization of the damaged membrane56. PLC and PLD family members function intracellularly and are involved in various biological processes, including protein kinase C-mediated signal transduction, receptor-mediated signal transduction and membrane trafficking28. TMEM63B-mediated lipid scrambling may also contribute to the biological functions of phospholipases.
TMEM63B is essential for human and mouse health. Systemic Tmem63b-deficient mice show embryonic lethality57. Mice lacking Tmem63b in inner ear hair cells (IHCs) develop hearing loss58. Additionally, TMEM63B facilitates lung inflation-induced surfactant secretion59. Future studies should explore how the scrambling or ion channel activity of TMEM63B functions in IHCs and alveolar epithelial cell homeostasis and the role of TMEM63B in other tissues. The V44M substitution confers constitutive lipid scramblase activity, which compromises phospholipid asymmetry. Persons with the V44M substitution suffer from neurological disorders and anemia52. This implies that macrophages may phagocytose mutant red blood cells in a PtdSer-dependent manner and may be susceptible to hemolysis because of shear stress. Vetro et al. reported that the V44M mutant induces inward leak cation currents, which may also contribute to pathogenesis52. Nine additional heterozygous mutations (encoding R433H, D459E, V463I, I475del, T481N, G580C, G580S, R660T and F697L) were identified52 (Fig. 6a). These mutations impact residues located in the TMD, are conserved among mammals (Extended Data Fig. 6) and may cause abnormal scrambling at the PM and intracellular membranes, such as lysosomes and vesicles across the secretory pathway, leading to disease.
OSCA and TMEM63 constitute a family of mechanosensitive ion channels in plants and vertebrates, respectively, with topological similarities to TMEM16 proteins34,35. While OSCA1.1 and OSCA1.2 exhibit strong mechanically activated currents comparable to those observed with mouse PIEZO1, a well-established mechanosensitive channel34, mouse or human TMEM63 proteins corresponded to mechanically activated currents that were one hundredth of those mediated by OSCAs or PIEZOs34. Unlike the homodimeric architecture of OSCAs35,36, mTMEM63B exists as a monomer. The recently published structures of TMEM63 members also show a monomeric structure that resembles the closed conformation of mTMEM63B in the present study60,61. Together with other reports34,52,61, we propose that TMEM63B serves dual functions as a membrane structure-responsive lipid scramblase and a mechanosensitive ion channel. These two functions may be independently executed because the mechanosensitive ion channel is directly activated by physical stimuli and responds on a millisecond timescale, while the lipid scrambling occurs on the order of minutes. It is currently unclear which physical stimuli induce TMEM63B’s scrambling, as we could not detect scramblase activity when mTMEM63B-expressing cells were treated with shear or osmotic stress. Additionally, the mechanisms by which mTMEM63B senses the alteration in membrane structures through its ICD with palmitoylated hooks will be a topic for future research. Very recent cryo-EM studies on OSCA1.2 revealed the formation of a large cleft resembling LTP in TMEM63B and surmised its potential scramblase activity62. Transmembrane channel-like (TMC) family members have structural similarities to TMEM16 family members3,63 and the possible involvement of TMC1 in scramblase activity was also proposed64. Therefore, lipid scramblase activity may be conserved in some family members (TMEM16, TMEM63 and TMC) that share similar protein folding, while their activation mechanisms may vary.
Methods
Cell lines, plasmids, antibodies and reagents
HEK293T (American Type Culture Collection (ATCC)) and FreeStyle 293-F (Thermo Fisher Scientific) cells were grown in DMEM containing 10% fetal calf serum (FCS) and FreeStyle 293 Expression Medium (Thermo Fisher Scientific), respectively. Mouse interleukin 3 (IL-3)-dependent Ba/F3 cells (ATCC) and their transformants were cultured in RPMI-1640 medium supplemented with 10% FCS and 50 U per ml recombinant IL-3. The C127I cells expressing mouse IL-3 were described previously65. Soluble FasL was produced as described using COS-7 cells66. The recombinant protein of mCherry-D4, a fluorescence-conjugating cholesterol-binding domain of perfringolysin O, and NT-Lys-RFP, a truncated nontoxic form of SM-binding toxin lysenin fused to red fluorescent protein (RFP), were prepared as described39,53,67. The Tmem63b-deficient Ba/F3 lines (Tm63bnull) were established by a CRISPR–Cas9 system using the pX330 vector68 carrying the following complementary sequences: 5′-CACCGCGTAGTCCCAGGCCACCTTC-3′ and 5′-AAACGAAGGTGGCCTGGGACTACGC-3′ (target sequences are underlined). The targeted loci was amplified with primers (5′- GCTCGGGCTCTTTCTTACCT-3′ and 5′-GCTGCTTTCCAACTCCTGTC-3′) and gene editing was verified by Sanger sequencing (Supplementary Fig. 1a).
The pMXs-puro and pGag-pol-IRES-bsr plasmids were from T. Kitamura (Foundation for Biomedical Research and Innovation at Kobe)69. The pCMV-VSV-G, pCMV-VSV-G-RSV-rev and pCAG-HIVgp plasmids were from H. Miyoshi (Riken Bioresource Center). The pCold I-His-NT-Lys and pCold I-His-mCherry-D4 plasmids were described previously31,67. The pAdVAntage plasmid was purchased from Thermo Fisher Scientific. The LentiCas9-Blast vector32, mouse CRISPR knockout pooled Library (GeCKO version 2)70 and pX330 plasmid were obtained from Addgene. Human complementary DNA (cDNA) for CDC50A (NM_018247.3), ATP11A (NM_015205.2) and ATP11A carrying the Q84E substitution (c.250C>G) was previously described31. The mouse Tmem63b cDNA (NM_198167.3; carrying synonymous single-nucleotide polymorphisms rs13465680 and rs13465681) was prepared by reverse transcription–PCR with RNA from Ba/F3 cells using the following primers: 5′-GCCTTAATTAAGCCACCATGCTGCCGTTCTTGCTG-3′ and 5′-GGCGAATTCCTGGTGAATCTCATTCTCTATG-3′ (PacI and EcoRI sites are underlined), tagged with Flag, EGFP or mCherry at the C terminus, introduced into pMXs-puro between PacI and EcoRI sites and used to infect Ba/F3 cells. The mTMEM63B mutants were prepared by NEBuilder HiFi DNA Assembly (New England Biolabs) or recombinant PCR using mTmem63b cDNA with primers carrying mutated nucleotides71 and mutations were certified by Sanger sequencing. The ΔCys-all cDNA flanked by PacI and EcoRI sites was synthesized by FASMAC, digested with PacI and EcoRI and inserted into the pMXs-puro vector for mCherry-tagged ΔCys-all expression. The synthesized cDNA was also used as a PCR template for ΔCys-IL1, ΔCys-hook 1 and ΔCys-hook 2 fragments, which were assembled using a HiFi Assembly kit. The sequence was verified by Sanger sequencing.
A horseradish peroxidase-conjugated rabbit anti-GFP antibody, rabbit anti-RFP antibody and mouse anti-DDDDK (Flag) antibody were purchased from Medical and Biological Laboratories. Hoechst 33342 and GolgiSeeing were from Dojindo and Funakoshi, respectively. PlasMem Bright, LysoTracker green and ER-Tracker green were purchased from Thermo Fisher Scientific. 1-palmitoyl-2-oleoyl-sn-glycero-3-PtdCho and N-stearoyl-d-erythro-sphingosylphosphorylcholine were purchased from Avanti Polar Lipids. MαCD was from FUJIFILM Wako Chemicals. FuGENE6 was purchased from Promega. Propidium iodide and the lactate dehydrogenase (LDH) cytotoxicity assay kit were purchased from Nacalai Tesque. Cinnamycin was purchased from Cayman Chemical. PLC, PLD, SMase and fatty acid-free BSA were purchased from Merck.
Cell transformation
Ba/F3 cells were transformed as described previously15,31. In brief, the pMXs-puro or pMXs-neo vector carrying cDNA for human CDC50A, ATP11A or mouse TMEM63B was transfected into HEK293T cells by FuGENE 6 (Promega) together with pGag-pol-IRES-bsr, pCMV-VSV-G and pAdVAntage. The retroviruses were concentrated by centrifugation or the Retro-X concentrator (Takara) and used to transform Ba/F3 cells. The transformants were selected by culturing the cells with 1 µg ml−1 puromycin. If necessary, the puromycin-resistant cells were subjected to sorting by FACSAria III (BD Biosciences) or CytoFLEX SRT (Beckman Coulter) for the expression of EGFP or mCherry.
Genome-wide CRISPR screening
Genome-wide CRISPR–Cas9 screening with Ba/F3 cells was performed as described70,72. In brief, Ba/F3 cells were coinfected with retroviruses carrying cDNA for Flag-tagged human CDC50A and mCherry-tagged human ATP11A-Q84E and the transformants were selected in the presence of 1 mg ml−1 G418. A lentivirus carrying cDNA for Cas9-Flag was produced by transfecting HEK293T cells with lentiCas9-Blast, pCAG-HIVgp and pCMV-VSV-G-RSV-rev and was used to infect Ba/F3 cells expressing hCDC50A and hATP11A-Q84E. The transformants were selected in the presence of 15 µg ml−1 blasticidin S and subjected to a limiting dilution. The clone expressing hCDC50A-Flag, Cas9-Flag and mCherry-hATP11A-Q84E was identified by western blotting with anti-Flag (DDDDK) or anti-mCherry (RFP) antibodies.
The lentivirus for the sgRNA library was produced by transfecting 1 × 10⁷ HEK293T cells using FuGENE 6 with 17 µg of GeCKO version 2 library (A + B) DNA, 8 µg of pCAG-HIVgp and 5 µg of pCMV-VSV-G-RSV-rev. The virus was concentrated by centrifugation at 6,000g at 4 °C for 16 h and used to infect Ba/F3 cells expressing hCDC50A–Flag, Cas9-Flag and mCherry–hATP11A-Q84E at a multiplicity of infection of 0.3. Approximately 3 × 10⁷ cells were placed in 24-well culture plates at 2 × 10⁵ cells per well (a total of 150 wells) and spin-infected at 700g at 30 °C for 1 h in the presence of 10 µg ml−1 polybrene. The infected cells were then cultured for 3 days in culture medium containing 1 µg ml−1 puromycin and 15 µg ml−1 blasticidin. After tenfold dilution, the cells were further cultured for 2–3 days in the presence of puromycin and blasticidin S, followed by 2 days of culture without the antibiotics.
The mutated cells were then subjected to the flippase assay. In brief, 1 × 10⁷ cells were washed twice with Hanks’ balanced salt solution (HBSS), suspended in 4 ml of HBSS containing 2 mM CaCl2 and 1 mM MgCl2 and preincubated at 15 °C for 10 min. NBD-PC was added to the cells at a final concentration of 500 nM, incubated at 15 °C for 6 min and put on ice. Then, 4 ml of HBSS containing 5 mg ml−1 fatty acid-free BSA was added to the solution and the cells were collected by centrifugation at 500g at 4 °C for 2 min. The cells were resuspended in prechilled HBSS containing 5 mg ml−1 fatty acid-free BSA and subjected to cell sorting with a FACSAria III. The cell population with a high NBD-PC signal (about 0.1%) was collected and cultured for 3–5 days. This sorting procedure was repeated for the cells with high NBD-PC flippase activity.
Genomic DNA was purified from the sorted cells by QIAamp DNA mini kit (Qiagen). Using 12 µg of DNA as the template, the lentiviral sequences were amplified by PCR with PrimeSTAR Max DNA polymerase (Takara Bio) and primers (5′-AATGGACTATCATATGCTTACCGTAACTTGAAAGTATTTCG-3′ and 5′-CTTTAGTTTGTATGTCTGTTGCTATTATGTCTACTATTCTTTCC-3′). The amplicons were subjected to a second PCR using PrimeSTAR HS DNA polymerase (Takara Bio) to connect adaptor sequences for next-generation sequencing with a mixture of forward primers (NGS-Lib-Fwd-1–10)73 and a common reverse primer (5′-CAAGCAGAAGACGGCATACGAGATGTGACTGGAGTTCAGACGTGTGCTCTTCCGATCTTCTACTATTCTTTCCCCTGCACTGT-3′). The PCR product was separated by electrophoresis, excised and purified using the Wizard SV gel and PCR clean-up system (Promega). The PCR product was quantified with a Quant-iT PicoGreen double-stranded DNA assay kit (Thermo Fisher Scientific) and subjected to deep sequencing by MiSeq (Illumina) using the MiSeq reagent Kit v3 (Illumina). The read sequences were assigned to the sgRNA sequences targeted to the respective genes and the abundance of each unique sgRNA was calculated using software custom-designed at Amelieff.
Incorporation of NBD lipids and detection of phospholipids and cholesterol
The incorporation of NBD lipids was assayed as described previously67. In brief, 5 × 10⁵ cells were incubated at 4 °C with 0.1–0.01 µM NBD-PC or 1–0.2 µM NBD-SM in 500 µl of HBSS containing 1 mM MgCl2 and 2 mM CaCl2 (HBSS++). An aliquot (100 µl) of cells was mixed with 150 µl of HBSS containing 50 mg ml−1 fatty acid-free BSA, incubated for 1–2 min on ice and analyzed using CytoFLEX (Beckman Coulter). To detect PtdSer, SM and cholesterol on the cell surface, cells were incubated at 4 °C for 30–50 min in annexin V buffer containing 500-fold diluted annexin V–Cy5 (BioVision) or in HBSS containing 10 µg ml−1 NT-Lys-RFP or mCherry-D4. After counterstaining with 10 µg ml−1 propidium iodide, cells were analyzed by CytoFLEX. The PtdEtn exposure was examined as described previously41. In brief, cells were incubated at 4 °C for 40 min with 0.5 µM cinnamycin in 500 µl of annexin V buffer containing 5 mg ml−1 BSA and 10 µg ml−1 propidium iodide and analyzed by flow cytometry for propidium iodide positivity using CytoFLEX. In some cases, LDH released to the medium was evaluated using the LDH cytotoxicity assay kit according to the manufacturer’s instructions.
To examine the effect of the lipid composition of the PM on the incorporation of NBD lipids and the distribution of phospholipids on the cell surface, cells were pretreated in HBSS++ with 10 mM MβCD at 15 °C for 15 min or in annexin V buffer (10 mM HEPES–KOH buffer (pH 7.4) containing 140 mM NaCl and 2.5 mM CaCl2) with 50 U per ml PLD at 37 °C for 30 min, 1.0 U per ml PLC at 37 °C for 30 min or 0.5 U per ml SMase at 15 °C for 30 min and used in the assay described above.
Metabolic labeling of cells with [14C]choline and lipid extraction
Labeling cells with [14C]choline and detection of [14C]PtdCho and [14C]SM were essentially performed as described previously31. In brief, cells were cultured for 2 days in RPMI-1640 containing 10% FCS and 1 μCi of choline chloride [methyl-14C] (55 mCi mmol−1; American Radiolabeled Chemicals). The MαCD-mediated lipid exchange to extract lipids from the PM outer leaflet was performed as described previously54. In brief, 5.7 mg of SM was suspended in 4.5 ml of RPMI-1640 medium prewarmed to 70 °C and incubated at 70 °C for 5 min. After adding 500 μl of 400 mM MαCD, the solution was incubated at 37 °C for 1 h and centrifuged; the supernatant was used as SM-loaded MαCD. Cells were suspended in SM-loaded MαCD solution and incubated at 20 °C for 1 h. After centrifugation, the supernatants were mixed with a hexane–isopropanol mixture (3:2, v/v) and the organic phase was collected. Lipids in the water phase were re-extracted, combined with the first extract, dried under a nitrogen stream and dissolved in 25 μl of a methanol–chloroform mixture (1:1, v/v). Extracted lipids (8,000 disintegrations per minute) were separated on a high-performance TLC silica gel 60 plate (Merck) with a mixture of chloroform, methanol and ammonium hydroxide (65:25:5, v/v/v) as a solvent and visualized with an imaging plate detector (FLA-7000, FUJIFILM). Total cellular lipids were extracted by mixing with a hexane–isopropanol mixture (3:2, v/v) and analyzed as above.
Confocal microscopy analysis
The PM was stained with PlasMem Bright green and red, diluted 100-fold and 200-fold, respectively. For intracellular organelle staining, cells were incubated with 50 nM LysoTracker green (Thermo Scientific), 1 µM ER-Tracker green (Thermo Scientific) or 0.4 µM GolgiSeeing (Funakoshi). To detect SM-rich domains and cholesterol on the cell surface, cells were stained with 10 µg ml−1 NT-Lys-RFP and mCherry-D4, respectively. The cells were then counterstained with 3.6–8.9 µM Hoechst 33342 and transferred to a glass-bottom dish (Matsunami Glass); images were acquired using an LSM 710 (Carl Zeiss) or FV3000 (EVIDENT) confocal laser-scanning microscope, followed by image processing with ImageJ.
SDS–PAGE and western blotting
Cells were washed with PBS and lysed in radioimmunoprecipitation assay buffer (50 mM HEPES–NaOH (pH 8.0), 150 mM NaCl, 1% Nonided P-40, 0.1% SDS and 0.5% sodium deoxycholate) containing proteinase inhibitor cocktail (Nacalai Tesque). After removing insolubilized aggregates, the lysates were incubated at room temperature for 20 min in SDS sample buffer (62.5 mM Tris-HCl buffer (pH 6.8), 2% SDS, 10% glycerol, 5% β-mercaptoethanol and 0.001% bromophenol blue), separated by electrophoresis on a 7.5% or 10% polyacrylamide gel (Nacalai Tesque) and transferred to PVDF membranes (Merck Millipore). The membrane was blocked with TBS containing 0.05% Tween-20 and 5% skim milk and probed with anti-GFP (1:3,000), anti-RFP (1:3,000) or anti-DDDDK (Flag) (1:1,000) antibody, followed by detection with ChemiDoc Touch MP (Bio-Rad) or LAS4000 (GE Healthcare) using Chemi-Lumi One Super (Nacalai Tesque). Proteins on PVDF membranes were stained with Ponceau S or Coomassie brilliant blue (CBB). Precision Plus protein standards (Bio-Rad) and YesBlot western marker I (SMOBIO) were used as molecular weight markers.
Protein expression and purification for cryo-EM analysis
Mouse Tmem63b (mTMEM63B; UniProt Q3TWI9) cDNA tagged with a tobacco etch virus (TEV) cleavage site, EGFP and a Twin-Strep-tag at the C terminus was cloned into a pEG BacMam vector74. Bacmids were generated in Escherichia coli DH10Bac and used to transfect Sf9 cells (Thermo Scientific) with the Bac-to-Bac system for baculovirus production. FreeStyle 293-F cells (Thermo Scientific) at 2 × 10⁶ cells per m were infected by concentrated baculovirus to a volume ratio of 100:1 (equivalent to 1:10 in the original concentration) and cultured at 37 °C for 18 h in FreeStyle medium (Thermo Scientific), followed by incubation at 30 °C for 48 h in the presence of 5 mM sodium butylate. Cells were collected by centrifugation, resuspended in buffer containing 50 mM Tris-HCl buffer (pH 8.0), 150 mM NaCl and protease inhibitor cocktail and lysed by sonication (Tomy/UD-211; output: 5, duty: 50, time: 30 min). The lysate was centrifuged at 26,000 r.p.m. for 1 h using an ultracentrifuge (Beckman Coulter, Optima XE-90, fixed-angle rotor 45Ti) to collect the membrane fraction, which was homogenized and stored at −180 °C until use.
mTMEM63B was purified from the membrane fraction by solubilizing with 1% LMNG and 0.1% CHS or 1.5% DDM and 0.3% CHS. After removing the insoluble fraction by centrifugation at 40,000 r.p.m. for 30 min, the supernatant was incubated for 1 h with 1 ml of anti-GFP nanobody-coupled CNBr Sepharose. The resin was loaded onto a column, washed with ten column volumes of buffer containing 0.02% LMNG and 0.002% CHS or 0.03% DDM and 0.006% CHS and treated at 4 °C overnight with 150 µg of TEV protease. mTMEM63B in the flowthrough fractions was purified by a Superose 6 Increase 3.2/300 Column (Cytiva) using the AKTA Pure 25M system (Cytiva) with a buffer containing 20 mM Tris-HCl (pH 8.0), 150 mM NaCl and 1.0 mM 2-mercaptoethanol, supplemented with 0.003% LMNG and 0.0003% CHS or 0.03% DDM and 0.003% CHS. For the mTMEM63B sample solubilized with DDM–CHS, the protein was incubated at 4 °C for 10 min with anti-mTMEM63B Fab at a molar ratio of 2:1 before the size-exclusion chromatography. The purified mTMEM63B protein was concentrated to 5 mg ml−1 (LNMG–CHS sample) or 18 mg ml−1 (DDM–CHS sample) for the cryo-EM analysis. For the Fab-bound samples, the purified TMEM63B sample was mixed with anti-mTMEM63B YN9303-24 Fab at twofold molar excess (DDM–CHS sample) or 1.2-fold molar excess (LMNG–CHS sample) and then incubated at 4 °C for 10 min before the size-exclusion chromatography. The purified samples were concentrated to 5 mg ml−1 (LNMG–CHS sample), 3.5 mg ml−1 (LMNG–CHS sample with Fab), 11 mg ml−1 (DDM–CHS sample) or 18 mg ml−1 (DDM–CHS sample with Fab) for the cryo-EM analysis.
Antibody generation
All the animal experiments conformed to the guidelines of the Guide for the Care and Use of Laboratory Animals of Japan and were approved by the Kyoto University Animal Experimentation Committee (no. Med Kyo 22055). Mouse monoclonal antibodies against mTMEM63B were raised as previously described75. In brief, a proteoliposome was prepared by reconstituting purified mTMEM63B into phospholipid vesicles consisting of a 10:1 mixture of chicken egg yolk PtdCho (Avanti Polar Lipids) and the adjuvant lipid A (Sigma-Aldrich) to facilitate an immune response. The MRL/lpr mice (Japan SLC) were injected three times with the proteoliposome at 2-week intervals. Hybridomas were generated with NS-1 myeloma (ATCC) as described previously76. Biotinylated proteoliposomes were prepared by reconstituting mTMEM63B with a mixture of egg yolk PtdCho and 1,2-dipalmitoyl-sn-glycero-3-PtdEtn-N-(cap biotinyl) (16:0; Avanti Polar Lipids) and immobilized onto streptavidin-coated microplates (Nunc). Hybridoma clones were screened by ELISA on immobilized biotinylated proteoliposomes, allowing for positive selection of antibodies that recognized the native conformation of mTMEM63B. Positive hybridomas were further screened with SDS-denatured mTMEM63B to exclude the antibodies against linear epitopes. The complex formation between mTMEM63B and monoclonal antibodies was examined using fluorescence-detection size-exclusion chromatography and flow cytometry; one monoclonal antibody (clone YN9303-24) showed specific binding to the intracellular regions of mTMEM63B and was used for the cryo-EM analysis (Supplementary Fig. 3). The sequence of the Fab was determined by 5′-RACE with total RNA isolated from the hybridoma as described77.
Cryo-EM sample preparation, data collection and processing
First, 3 µl of protein solution (2.5 mg ml−1 or 5 mg ml−1 for the LMNG sample; 3.5 mg ml−1 for the LMNG sample with Fab; 5.5 mg ml−1 or 11 mg ml−1 for the DDM sample; 9 mg ml−1 or 18 mg ml−1 for the DDM sample with Fab) was applied to a Quantifoil grid (Quantifoil Au 1.2/1.3, Cu 0.6/1.0 or Cu/Rh 1.2/1.3 holey carbon 300 mesh) that was glow-discharged in advance at 10 mA for 50 s. All grids were blotted for 3 s at 6 °C and 100% humidity with a blot force of 10 and plunge-frozen into liquid ethane using a Vitrobot (Mark IV, Thermo Fisher). To solve the preferred orientation bias problem, a final concentration of 0.1% CHAPS or 1.5 mM F-FC8 was added to the drop of LMNG sample with Fab before applied to the grids.
Videos were collected at 300-kV acceleration voltage with a Titan Krios G4 (Thermo Fisher Scientific) equipped with a K3 detector (Gatan) in counting mode with correlative double sampling using automated EPU software (Thermo Fisher Scientific) in RIKEN Yokohama. Images were acquired at ×105,000 magnification with a pixel size of 0.83 Å. Videos were collected with 48 frames using a defocus range of −1.6 µm to −0.8 µm and the total exposure dose was 50.9 e− per Å2.
All data were processed using CryoSPARC (version 4.2.1)78. Videos were motion-corrected and the contrast transfer function was estimated using a patch-base method. The data processing for the LMNG–CHS sample (4,878 videos), LMNG–CHS sample with Fab (18,370 videos: 8,191 videos from the grid without detergents and 7,175 and 3,004 videos from the grids supplemented with F-FC8 and CHAPS, respectively), DDM–CHS sample (4,068 videos) and DDM–CHS sample with Fab (10,051 videos) are summarized in Extended Data Figs. 2–5. In brief, particles were automatically picked and extracted with a 256-pixel or 300-pixel square box size, which was Fourier-cropped to a 64-pixel square. The two-dimensional (2D) classification with different settings (initial batch size, number of classes, etc.) was concurrently performed to select better-looking micelle-shaped particles. The selected particles were used to reconstruct initial three-dimensional models and the best-looking model was used as a reference for further refinement. After several rounds of heterogeneous refinement, selected particles were re-extracted with a 300-pixel square box size and Fourier-cropped to a 160-pixel square (LMNG–CHS and DDM–CHS with Fab) or with a 256-pixel square box size and Fourier-cropped to a 128-pixel square (LMNG–CHS with Fab and DDM–CHS). Additional rounds of heterogeneous refinement were performed several times and final particles were selected and subjected to nonuniform refinement, yielding 3.4-Å, 3.6-Å, 6.9-Å and 3.5-Å resolution maps for LMNG–CHS, LMNG–CHS with Fab, DDM–CHS and DDM–CHS with Fab, respectively, determined by the gold-standard Fourier shell correlation (FSC = 0.143).
Modeling
Mode building and refinement were performed for the structures in LMNG–CHS and in DDM–CHS with Fab. The AlphaFold2-predicted model (AlphaFoldDB Q3TWI9) was globally fitted to each map using ChimeraX 1.5 and used as the initial model79. The model was then manually rebuilt using Coot 0.9.9.8 (ref. 80) and adjusted using an ISOLDE plugin in ChimeraX81; refmac-based reciprocal space refinement was performed against the halfmaps by Servalcat82, adjusting a weight parameter (--weight_auto_scale) to prevent model clashing in the less-resolved region. The densities for ICD in the LMNG–CHS structure, the YN9303-24 Fab fragment in the DDM–CHS structure and IL2 in both structures were weak or not observed in the cryo-EM maps and, thus, omitted in the model. The final model was validated by MolProbity83, EMRinger84 and Model-Map Q score in ChimeraX85. The data collection, refinement parameters and model statistics are summarized in Table 1.
Lipidomic analysis
Lipids were extracted according to Bligh and Dyer’s method with some modifications86. In brief, cells (1 × 10⁶) were washed with prechilled PBS and snap-frozen in liquid nitrogen. The cell pellet (Ba/F3, Tm63bnull or Tm63bnull mTMEM63B cells with five biological replicates from each cell) was mixed with 1 ml of ice-cold methanol, transferred into a 2-ml tube and mixed with 10 µl of the internal standard (IS) solution A (mouse SPLASH Lipidomix MS standard, Avanti Polar Lipids) and 10 µl of IS solution B (Avanti Polar Lipids). Specifically, 10 µl of IS solution A contained 1.0 nmol of PtdCho (15:0/[2H7]18:1), 0.070 nmol of PtdEtn (15:0/[2H7]18:1), 0.20 nmol of PtdSer (15:0/[2H7]18:1), 0.05 nmol of PtdGly (15:0/[2H7]18:1), 0.20 nmol of phosphatidylinositol (15:0/[2H7]18:1), 0.10 nmol of phosphatidic acid (15:0/[2H7]18:1), 2.5 nmol of cholesteryl ester ([2H7]18:1), 0.15 nmol of diacylglycerol (15:0/[2H7]18:1), 0.35 nmol of triacylglycerol (15:0/[2H7]18:1/15:0) and 0.20 nmol of SM (d18:1/[2H9]18:1). On the other hand, 10 µl of IS solution B contained 0.10 nmol of free fatty acids ([13C16]16:0) and 3.0 nmol of cholesterol ([2H7]cholesterol). The sample was vigorously mixed by vortexing for 1 min, sonicated for 5 min and incubated on ice for 5 min. The extracts were centrifuged at 16,000g for 5 min at 4 °C and the supernatant was transferred to clean tubes. The protein concentration in the pellet was determined using a Pierce BCA protein assay kit (Thermo Fisher Scientific). Aliquots (400 µL) of the supernatant were dried under a stream of nitrogen, dissolved in 100 µl of methanol and chloroform (1:1) and analyzed by supercritical fluid chromatography (SFC) with a diethylamine (DEA) column coupled with triple-quadrupole MS87,88.
The conditions for the SFC (Nexera UC system, Shimadzu) were as follows: column, ACQUITY UPC2 Torus DEA column (3.0-mm inner diameter, 100 mm, 1.7 µm particle size; Waters); injection volume, 2 µl; column temperature, 50 °C; mobile phase A, supercritical carbon dioxide; mobile phase B (modifier), make-up pump solvent consisting of methanol and water (95:5, v/v) with 0.1% (w/v) ammonium acetate; flow rate of mobile phase, 1 ml min−1; flow rate of make-up pump, 0.1 ml min−1; back-pressure regulator, 10 MPa. The gradient conditions were as follows: 1% B, 0–1 min; 1–75% B, 1–24 min; 75% B, 24–26 min; 1% B, 26–30 min. The triple-quadrupole MS (LCMS-8060, Shimadzu) analysis conditions were as follows: polarity, positive and negative ionization; electrospray voltage, 4 kV in positive ion mode and ‒3.5 kV in negative ion mode; nebulizer gas flow rate, 3.0 L min−1; drying gas flow rate, 10 L min−1; desolvation line temperature, 250 °C; heat block temperature, 400 °C; detector voltage, 2.16 kV. The multiple reaction monitoring (MRM) parameters per time period were as follows: limit on number of MRM transitions, 150; dwell time, 2 ms; pause time, 2 ms; polarity switching time, 5 ms. Optimized MRM parameters are shown in Supplementary Table 1. The analytical platform for lipidomic analysis was controlled using LabSolutions (version 5.99 SP2, Shimadzu), and data analysis was performed using Multi-ChromatoAnalysT (version 1.3.4.0, Beforce). Lipid identification was performed on the basis of retention time and specific MRM transitions indexed to IS for each lipid class. Quantitative levels of lipids were calculated using peak areas relative to an IS and corrected for the total protein amount of each sample (Supplementary Table 1).
Detection of palmitoylated peptides
Shotgun proteomic analysis was performed as described previously89, with modifications. The purified mTMEM63B (1.0 µg of protein) was incubated at 37 °C for 30 min with 40 mM TCEP in 3.0 µl of 6.7 mM Tris-HCl buffer (pH 8.0) containing 0.01% DDM, 0.001% CHS, 50 mM NaCl and 0.33 mM β-mercaptoethanol. IAA was added to each sample at a final concentration of 80 mM and incubated at room temperature for 30 min. Three volumes of prechilled (−30 °C) acetone was added to the sample and the sample was kept at −30 °C for 2 h. The proteins were collected by centrifugation at 7,000g for 5 min at 4 °C, washed twice with 90% prechilled acetone, air-dried and dissolved by sonication in 2 µl of a solution of trypsin and Lys-C (250 ng µl−1) in 50 mM ammonium bicarbonate. The mixture was incubated at 37 °C for 2 h while shaken with a Thermomixer comfort (Eppendorf) at a setting of 300 r.p.m., diluted with two volumes of 0.5% (v/v) TFA and subjected to nanoflow liquid chromatography (nano-LC) high-resolution tandem MS/MS analysis.
The nano-LC–MS/MS system was composed of a Dionex Ultimate 3000 nano-RSLC system and a Q-Exactive HF high-performance benchtop quadrupole Orbitrap mass spectrometer (Thermo Fisher Scientific) equipped with a Dream spray electrospray ionization source (AMR). An Acclaim PepMap C18 column (Thermo Fisher Scientific; 300-µm inner diameter, 5 mm) with a particle size of 5 µm was used as the precolumn for sample trapping. The loading pump was run at 1 µl min−1 with water, acetonitrile and TFA (98/2/0.1, v/v/v) and 0.5 µL was injected per sample. After loading, the sample was switched online to the packed nano-LC column of 2-µm-particle-size L-column2 ODS (CERI; 50-µm inner diameter, 200 mm). The nano-LC conditions were as follows: mobile phase, water and FA (100/0.1, v/v; solvent A) and water, acetonitrile and FA (80/20/0.1, v/v/v; solvent B); flow rate, 200 nl min−1; column temperature, 40 °C. The gradient conditions were as follows: 5%–40% B, 0–100 min; 40%–99% B, 100–120 min; 99% B, 120–130 min; 99%–5% B, 130–131 min; 5% B, 131–150 min.
The MS analysis conditions were as follows: polarity, positive ionization; spray voltage, 1.8 kV; capillary temperature, 275 °C; S-lens level, 50; probe heater temperature, 350 °C; mass resolution, 60,000; automatic gain control (AGC) target (the number of ions used to fill the C-trap), 3,000,000; maximum injection time (IT), 110 ms; MS scan range, 350–1,500 m/z. The data-dependent MS/MS (dd-MS/MS) spectra (top seven) were acquired with higher-energy collision dissociation. The dd-MS/MS conditions were as follows: mass resolution, 60,000; AGC target, 200,000; maximum IT, 138 ms; isolation window, 1.2 m/z; normalized collision energy, 28 eV; ion selection abundance threshold, 140,000; charge exclusion, 1 and more than 7; dynamic exclusion, 15 s.
Proteome Discover version 2.4 (Thermo Fisher Scientific) was used for data processing, including peak detection, peak area calculations and peak identification. The MS/MS spectra were used to search the SwissProt database with decoy sequences to identify proteins using the Sequest HT algorithm (Thermo Fisher Scientific). The search was conducted with the following parameter settings: enzyme used, trypsin; allowed number of missed cleavages, 3; dynamic modifications, carbamidomethylation of cysteine and palmitoylation of cysteine. Assigned MS/MS spectra were filtered with a peptide confidence value of ‘high’ to obtain a false discovery rate of less than 1% with the following parameters: minimum number of peptides required for protein identification, 1; minimum number of amino acids required for protein identification, 4.
Statistics and reproducibility
The cell-based and biochemical experiments were independently conducted at least two times, as described in the figure legends, and similar results were confirmed. Analyses with western blots (SDS–PAGE) and confocal fluorescence microscopy were performed at least twice, confirming the results, and representative images are shown. P values were calculated using a two-sided Student’s t-test. Error bars indicate the s.d.
Reporting summary
Further information on research design is available in the Nature Portfolio Reporting Summary linked to this article.
Online content
Any methods, additional references, Nature Portfolio reporting summaries, source data, extended data, supplementary information, acknowledgements, peer review information; details of author contributions and competing interests; and statements of data and code availability are available at 10.1038/s41594-024-01411-6.
Supplementary information
Supplementary Figs. 1–4 and associated uncropped western blot images.
Supplementary Video 1.
Supplementary Tables 1 and 2 are in one Excel file with two tabs.
Source data
Numerical source.
Unprocessed western blots and/or gels.
Numerical source.
Unprocessed western blots and/or gels.
Numerical source.
Numerical source.
Unprocessed western blots and/or gels.
Numerical source.
Unprocessed western blots and/or gels.
Numerical source.
Numerical source.
Unprocessed western blots and/or gels.
Numerical source.
Acknowledgements
We thank C. Sawada, X. Jing, K. Shimada, N. Shinoda, M. Nishimura, A. Nagata and Y. Shiraki for their secretarial or technical assistance. We thank M. Goto for assistance with the lipidome analysis. We also thank Y. Sakamaki and S. Arakawa for their technical assistance with EM. This work is supported by Grants-in-Aid from the Japan Society for the Promotion of Science (JSPS; JP23K05762 to Y.M.; JP22H05182 and JP22H05185 to Y.I.; JP21H04770 to S.N.; JP23H02439 and JP24H02264 to T.N.; JP21H02682 and JP22H05186 to K.S.), AMED (JP23ama121007 to S.I. and N.N.), Takeda Hosho Grants for Research in Medicine (T.N. and K.S.), Toray Science Foundation (K.S.), Ohsumi Frontier Science Foundation (K.S.), Kobayashi Foundation (K.S.), G-7 Scholarship Foundation (K.S.), Chugai Foundation for Innovative Drug Discovery Science (K.S.), Cooperative Research Project Program of the Medical Institute of Bioregulation, Kyushu University (K.S. and Y.I.), Nanken-Kyoten Tokyo Medical and Dental University (TMDU; K.H., Y.I., S.N., T.N. and K.S.), Medical Research Center Initiative for High Depth Omics, TMDU (K.S.), and Multilayered Stress Diseases (JPMXP1323015483), TMDU. C.S.S. is a JSPS research fellow, supported by 23KF0027. Cryo-EM experiments were performed at the RIKEN Yokohama cryo-EM facility.
Extended data
Extended Data Fig. 3. Cryo-EM data processing of mTMEM63B in the LMNG-CHS micelle with YN9303-24 Fab.

a–c Representative micrographs of mTMEM63B in LMNG-CHS with YN9303-24 Fab (a) and the same grid preparation supplemented with fluorinated foscholine-8 (F-FC8) (b) or CHAPS (c). d, Data processing flow chart with representative 2D class averages and maps. e, Fourie shell correlation (FSC) curve of the Non-Uniform (NU)-refinement. f, Local resolution mapped on the unsharpened refined map. g, Orientation distribution of the particles used for NU-refinement.
Extended Data Fig. 4. Cryo-EM data processing of mTMEM63B in the DDM-CHS micelle.

a, Representative micrograph of mTMEM63B in DDM-CHS. b, Data processing flow chart with representative 2D class averages and maps. c, Fourie shell correlation (FSC) curve of the Non-Uniform (NU)-refinement. d, Local resolution mapped on the locally-filtered refined map. e, Orientation distribution of the particles used for NU-refinement.
Author contributions
Y.M. and K.S. performed the CRISPR–Cas9 screen and identified TMEM63B as a lipid scramblase. Y.M. carried out the cell-based experiments with technical support from C.S.S. and R.K., using resources provided by S.N. The production of recombinant proteins of TMEM63B and cryo-EM analysis were carried out by K.T., Y.L. and T.N. The monoclonal antibody for TMEM63B (YN9303-24) was generated by K.L., T.U., N.N. and S.I. Proteomic and lipidomic analysis was performed by M.T., K.H., T.B. and Y.I. The manuscript was written by Y.M., K.T., Y.L., T.N. and K.S. with input from all authors. K.S. conceptualized the initial outline of the project and Y.M., K.T., Y.L., T.N. and K.S. conceptualized the study. T.N. and K.S. supervised the study.
Peer review
Peer review information
Nature Structural & Molecular Biology thanks Joseph Lyons and the other, anonymous, reviewer(s) for their contribution to the peer review of this work. Peer reviewer reports are available. Primary Handling Editor: Katarzyna Ciazynska, in collaboration with the Nature Structural & Molecular Biology team.
Data availability
The cryo-EM maps were deposited to the Electron Microscopy Data Bank (EMDB) under accession numbers EMD-37501 (LMNG–CHS), EMD-60251 (LMNG–CHS with YN9303-24 Fab), EMD-60252 (DDM–CHS) and EMD-37502 (DDM–CHS with YN9303-24 Fab) and the coordinates were deposited to the Protien Data Bank (PDB) under accession numbers 8WG3 (LMNG–CHS) and 8WG4 (DDM–CHS with YN9303-24 Fab). The corresponding cryo-EM raw images were deposited to the EM Public Image Archive under accession codes EMPIAR-12281 (LMNG–CHS), EMPIAR-12282 (DDM–CHS with YN9303-24 Fab), EMPIAR-12283 (LMNG–CHS with YN9303-24 Fab) and EMPIAR-12284 (DDM–CHS). The palmitoylated peptides of mTMEM63B protein were identified using the SwissProt database (https://www.uniprot.org/uniprotkb?query=reviewed%3Atrue&facets=model_organism%3A10090) and the analysis data are shown in Supplementary Table 2. The lipidomic data are shown in Supplementary Table 1. The proteomics and lipidomics MS raw data were deposited to the jPOST repository with the dataset identifier JPST003386 and the MB-POST repository with the dataset identifier MPST000001, respectively. Source data are provided with this paper.
Competing interests
The authors declare no competing interests.
Footnotes
Publisher’s note Springer Nature remains neutral with regard to jurisdictional claims in published maps and institutional affiliations.
These authors contributed equally: Yugo Miyata, Katsuya Takahashi.
Contributor Information
Tomohiro Nishizawa, Email: t-2438@yokohama-cu.ac.jp.
Katsumori Segawa, Email: segawa.mche@tmd.ac.jp.
Extended data
is available for this paper at 10.1038/s41594-024-01411-6.
Supplementary information
The online version contains supplementary material available at 10.1038/s41594-024-01411-6.
References
- 1.Harayama, T. & Riezman, H. Understanding the diversity of membrane lipid composition. Nat. Rev. Mol. Cell Biol.19, 281–296 (2018). [DOI] [PubMed] [Google Scholar]
- 2.Janmey, P. A. & Kinnunen, P. K. Biophysical properties of lipids and dynamic membranes. Trends Cell Biol.16, 538–546 (2006). [DOI] [PubMed] [Google Scholar]
- 3.Kefauver, J. M., Ward, A. B. & Patapoutian, A. Discoveries in structure and physiology of mechanically activated ion channels. Nature587, 567–576 (2020). [DOI] [PMC free article] [PubMed] [Google Scholar]
- 4.Devaux, P. F. Static and dynamic lipid asymmetry in cell membranes. Biochemistry30, 1163–1173 (1991). [DOI] [PubMed] [Google Scholar]
- 5.Lorent, J. H. et al. Plasma membranes are asymmetric in lipid unsaturation, packing and protein shape. Nat. Chem. Biol.16, 644–652 (2020). [DOI] [PMC free article] [PubMed] [Google Scholar]
- 6.Murate, M. & Kobayashi, T. Revisiting transbilayer distribution of lipids in the plasma membrane. Chem. Phys. Lipids194, 58–71 (2016). [DOI] [PubMed] [Google Scholar]
- 7.Lenoir, G., D’Ambrosio, J. M., Dieudonne, T. & Copic, A. Transport pathways that contribute to the cellular distribution of phosphatidylserine. Front. Cell Dev. Biol.9, 737907 (2021). [DOI] [PMC free article] [PubMed] [Google Scholar]
- 8.van Meer, G., Voelker, D. R. & Feigenson, G. W. Membrane lipids: where they are and how they behave. Nat. Rev. Mol. Cell Biol.9, 112–124 (2008). [DOI] [PMC free article] [PubMed] [Google Scholar]
- 9.Vance, J. E. Phospholipid synthesis and transport in mammalian cells. Traffic16, 1–18 (2015). [DOI] [PubMed] [Google Scholar]
- 10.Bevers, E. M. & Williamson, P. L. Getting to the outer leaflet: physiology of phosphatidylserine exposure at the plasma membrane. Physiol. Rev.96, 605–645 (2016). [DOI] [PubMed] [Google Scholar]
- 11.Sakuragi, T. & Nagata, S. Regulation of phospholipid distribution in the lipid bilayer by flippases and scramblases. Nat. Rev. Mol. Cell Biol.24, 576–596 (2023). [DOI] [PMC free article] [PubMed] [Google Scholar]
- 12.Andersen, J. P. et al. P4-ATPases as phospholipid flippases—structure, function, and enigmas. Front. Physiol.7, 275 (2016). [DOI] [PMC free article] [PubMed] [Google Scholar]
- 13.Coleman, J. A., Quazi, F. & Molday, R. S. Mammalian P4-ATPases and ABC transporters and their role in phospholipid transport. Biochim. Biophys. Acta1831, 555–574 (2013). [DOI] [PMC free article] [PubMed] [Google Scholar]
- 14.Sebastian, T. T., Baldridge, R. D., Xu, P. & Graham, T. R. Phospholipid flippases: building asymmetric membranes and transport vesicles. Biochim. Biophys. Acta1821, 1068–1077 (2012). [DOI] [PMC free article] [PubMed] [Google Scholar]
- 15.Segawa, K., Kurata, S. & Nagata, S. Human type IV P-type ATPases that work as plasma membrane phospholipid flippases and their regulation by caspase and calcium. J. Biol. Chem.291, 762–772 (2016). [DOI] [PMC free article] [PubMed] [Google Scholar]
- 16.Miyata, Y., Yamada, K., Nagata, S. & Segawa, K. Two types of type IV P-type ATPases independently re-establish the asymmetrical distribution of phosphatidylserine in plasma membranes. J. Biol. Chem.298, 102527 (2022). [DOI] [PMC free article] [PubMed] [Google Scholar]
- 17.Yabas, M. et al. ATP11C is critical for the internalization of phosphatidylserine and differentiation of B lymphocytes. Nat. Immunol.12, 441–449 (2011). [DOI] [PMC free article] [PubMed] [Google Scholar]
- 18.Tang, X., Halleck, M. S., Schlegel, R. A. & Williamson, P. A subfamily of P-type ATPases with aminophospholipid transporting activity. Science272, 1495–1497 (1996). [DOI] [PubMed] [Google Scholar]
- 19.Coleman, J. A., Kwok, M. C. & Molday, R. S. Localization, purification, and functional reconstitution of the P4-ATPase Atp8a2, a phosphatidylserine flippase in photoreceptor disc membranes. J. Biol. Chem.284, 32670–32679 (2009). [DOI] [PMC free article] [PubMed] [Google Scholar]
- 20.Dieudonne, T. et al. Autoinhibition and regulation by phosphoinositides of ATP8B1, a human lipid flippase associated with intrahepatic cholestatic disorders. eLife11, e75272 (2022). [DOI] [PMC free article] [PubMed] [Google Scholar]
- 21.Dieudonne, T. et al. Activation and substrate specificity of the human P4-ATPase ATP8B1. Nat. Commun.14, 7492 (2023). [DOI] [PMC free article] [PubMed] [Google Scholar]
- 22.Takada, N. et al. Phospholipid-flipping activity of P4-ATPase drives membrane curvature. EMBO J.37, e97705 (2018). [DOI] [PMC free article] [PubMed] [Google Scholar]
- 23.Kita, N. et al. Glucosylceramide flippases contribute to cellular glucosylceramide homeostasis. J. Lipid Res.65, 100508 (2024). [DOI] [PMC free article] [PubMed] [Google Scholar]
- 24.Suzuki, J., Umeda, M., Sims, P. J. & Nagata, S. Calcium-dependent phospholipid scrambling by TMEM16F. Nature468, 834–838 (2010). [DOI] [PubMed] [Google Scholar]
- 25.Suzuki, J. et al. Calcium-dependent phospholipid scramblase activity of TMEM16 protein family members. J. Biol. Chem.288, 13305–13316 (2013). [DOI] [PMC free article] [PubMed] [Google Scholar]
- 26.Wu, A., Wojtowicz, K., Savary, S., Hamon, Y. & Trombik, T. Do ABC transporters regulate plasma membrane organization? Cell. Mol. Biol. Lett.25, 37 (2020). [DOI] [PMC free article] [PubMed] [Google Scholar]
- 27.Di Paolo, G. & De Camilli, P. Phosphoinositides in cell regulation and membrane dynamics. Nature443, 651–657 (2006). [DOI] [PubMed] [Google Scholar]
- 28.McDermott, M. I., Wang, Y., Wakelam, M. J. O. & Bankaitis, V. A. Mammalian phospholipase D: function, and therapeutics. Prog. Lipid Res.78, 101018 (2020). [DOI] [PMC free article] [PubMed] [Google Scholar]
- 29.Segawa, K. et al. Caspase-mediated cleavage of phospholipid flippase for apoptotic phosphatidylserine exposure. Science344, 1164–1168 (2014). [DOI] [PubMed] [Google Scholar]
- 30.Segawa, K. et al. Phospholipid flippases enable precursor B cells to flee engulfment by macrophages. Proc. Natl Acad. Sci. USA115, 12212–12217 (2018). [DOI] [PMC free article] [PubMed] [Google Scholar]
- 31.Segawa, K. et al. A sublethal ATP11A mutation associated with neurological deterioration causes aberrant phosphatidylcholine flipping in plasma membranes. J. Clin. Invest.131, e148005 (2021). [DOI] [PMC free article] [PubMed] [Google Scholar]
- 32.Sanjana, N. E., Shalem, O. & Zhang, F. Improved vectors and genome-wide libraries for CRISPR screening. Nat. Methods11, 783–784 (2014). [DOI] [PMC free article] [PubMed] [Google Scholar]
- 33.Sullivan, P. C., Ferris, A. L. & Storrie, B. Effects of temperature, pH elevators, and energy production inhibitors on horseradish peroxidase transport through endocytic vesicles. J. Cell. Physiol.131, 58–63 (1987). [DOI] [PubMed] [Google Scholar]
- 34.Murthy, S. E. et al. OSCA/TMEM63 are an evolutionarily conserved family of mechanically activated ion channels. eLife7, e41844 (2018). [DOI] [PMC free article] [PubMed] [Google Scholar]
- 35.Jojoa-Cruz, S. et al. Cryo-EM structure of the mechanically activated ion channel OSCA1.2. eLife7, e41845 (2018). [DOI] [PMC free article] [PubMed] [Google Scholar]
- 36.Zhang, M. et al. Structure of the mechanosensitive OSCA channels. Nat. Struct. Mol. Biol.25, 850–858 (2018). [DOI] [PubMed] [Google Scholar]
- 37.Cox, C. D., Zhang, Y., Zhou, Z., Walz, T. & Martinac, B. Cyclodextrins increase membrane tension and are universal activators of mechanosensitive channels. Proc. Natl Acad. Sci. USA118, e2104820118 (2021). [DOI] [PMC free article] [PubMed] [Google Scholar]
- 38.Akter, F. et al. Multi-cell line analysis of lysosomal proteomes reveals unique features and novel lysosomal proteins. Mol. Cell Proteom.22, 100509 (2023). [DOI] [PMC free article] [PubMed] [Google Scholar]
- 39.Maekawa, M. Domain 4 (D4) of perfringolysin O to visualize cholesterol in cellular membranes—the update. Sensors (Basel)17, 504 (2017). [DOI] [PMC free article] [PubMed] [Google Scholar]
- 40.Sakuragi, T. et al. The tertiary structure of the human Xkr8–Basigin complex that scrambles phospholipids at plasma membranes. Nat. Struct. Mol. Biol.28, 825–834 (2021). [DOI] [PMC free article] [PubMed] [Google Scholar]
- 41.Makino, A. et al. Cinnamycin (Ro 09-0198) promotes cell binding and toxicity by inducing transbilayer lipid movement. J. Biol. Chem.278, 3204–3209 (2003). [DOI] [PubMed] [Google Scholar]
- 42.Jenkins, G. M. & Frohman, M. A. Phospholipase D: a lipid centric review. Cell. Mol. Life Sci.62, 2305–2316 (2005). [DOI] [PMC free article] [PubMed] [Google Scholar]
- 43.Fanani, M. L. & Ambroggio, E. E. Phospholipases and membrane curvature: what is happening at the surface? Membranes (Basel)13, 190 (2023). [DOI] [PMC free article] [PubMed] [Google Scholar]
- 44.Zhukovsky, M. A., Filograna, A., Luini, A., Corda, D. & Valente, C. Phosphatidic acid in membrane rearrangements. FEBS Lett.593, 2428–2451 (2019). [DOI] [PubMed] [Google Scholar]
- 45.Dang, S. et al. Cryo-EM structures of the TMEM16A calcium-activated chloride channel. Nature552, 426–429 (2017). [DOI] [PMC free article] [PubMed] [Google Scholar]
- 46.Alvadia, C. et al. Cryo-EM structures and functional characterization of the murine lipid scramblase TMEM16F. eLife8, e44365 (2019). [DOI] [PMC free article] [PubMed] [Google Scholar]
- 47.Yang, W., Di Vizio, D., Kirchner, M., Steen, H. & Freeman, M. R. Proteome scale characterization of human S-acylated proteins in lipid raft-enriched and non-raft membranes. Mol. Cell Proteom.9, 54–70 (2010). [DOI] [PMC free article] [PubMed] [Google Scholar]
- 48.Dowal, L., Yang, W., Freeman, M. R., Steen, H. & Flaumenhaft, R. Proteomic analysis of palmitoylated platelet proteins. Blood118, e62–e73 (2011). [DOI] [PMC free article] [PubMed] [Google Scholar]
- 49.Le, S. C., Liang, P., Lowry, A. J. & Yang, H. Gating and regulatory mechanisms of TMEM16 ion channels and scramblases. Front. Physiol.12, 787773 (2021). [DOI] [PMC free article] [PubMed] [Google Scholar]
- 50.Hiraizumi, M., Yamashita, K., Nishizawa, T. & Nureki, O. Cryo-EM structures capture the transport cycle of the P4-ATPase flippase. Science365, 1149–1155 (2019). [DOI] [PubMed] [Google Scholar]
- 51.Aicart-Ramos, C., Valero, R. A. & Rodriguez-Crespo, I. Protein palmitoylation and subcellular trafficking. Biochim. Biophys. Acta1808, 2981–2994 (2011). [DOI] [PubMed] [Google Scholar]
- 52.Vetro, A. et al. Stretch-activated ion channel TMEM63B associates with developmental and epileptic encephalopathies and progressive neurodegeneration. Am. J. Hum. Genet110, 1356–1376 (2023). [DOI] [PMC free article] [PubMed] [Google Scholar]
- 53.Kiyokawa, E. et al. Spatial and functional heterogeneity of sphingolipid-rich membrane domains. J. Biol. Chem.280, 24072–24084 (2005). [DOI] [PubMed] [Google Scholar]
- 54.Li, G. et al. Efficient replacement of plasma membrane outer leaflet phospholipids and sphingolipids in cells with exogenous lipids. Proc. Natl Acad. Sci. USA113, 14025–14030 (2016). [DOI] [PMC free article] [PubMed] [Google Scholar]
- 55.Murate, M. et al. Transbilayer distribution of lipids at nano scale. J. Cell Sci.128, 1627–1638 (2015). [DOI] [PubMed] [Google Scholar]
- 56.Tam, C. et al. Exocytosis of acid sphingomyelinase by wounded cells promotes endocytosis and plasma membrane repair. J. Cell Biol.189, 1027–1038 (2010). [DOI] [PMC free article] [PubMed] [Google Scholar]
- 57.Cacheiro, P. et al. Human and mouse essentiality screens as a resource for disease gene discovery. Nat. Commun.11, 655 (2020). [DOI] [PMC free article] [PubMed] [Google Scholar]
- 58.Du, H. et al. The cation channel TMEM63B is an osmosensor required for hearing. Cell Rep.31, 107596 (2020). [DOI] [PubMed] [Google Scholar]
- 59.Chen, G. L. et al. Mechanosensitive channels TMEM63A and TMEM63B mediate lung inflation-induced surfactant secretion. J. Clin. Invest.134, e174508 (2024). [DOI] [PMC free article] [PubMed] [Google Scholar]
- 60.Zhang, M., Shan, Y., Cox, C. D. & Pei, D. A mechanical-coupling mechanism in OSCA/TMEM63 channel mechanosensitivity. Nat. Commun.14, 3943 (2023). [DOI] [PMC free article] [PubMed] [Google Scholar]
- 61.Zheng, W. et al. TMEM63 proteins function as monomeric high-threshold mechanosensitive ion channels. Neuron111, 3195–3210 (2023). [DOI] [PMC free article] [PubMed] [Google Scholar]
- 62.Han, Y. et al. Mechanical activation opens a lipid-lined pore in OSCA ion channels. Nature628, 910–918 (2024). [DOI] [PubMed] [Google Scholar]
- 63.Douguet, D. & Honore, E. Mammalian mechanoelectrical transduction: structure and function of force-gated ion channels. Cell179, 340–354 (2019). [DOI] [PubMed] [Google Scholar]
- 64.Ballesteros, A. & Swartz, K. J. Regulation of membrane homeostasis by TMC1 mechanoelectrical transduction channels is essential for hearing. Sci. Adv.8, eabm5550 (2022). [DOI] [PMC free article] [PubMed] [Google Scholar]
- 65.Fukunaga, R., Ishizaka-Ikeda, E. & Nagata, S. Purification and characterization of the receptor for murine granulocyte colony-stimulating factor. J. Biol. Chem.265, 14008–14015 (1990). [PubMed] [Google Scholar]
- 66.Shiraishi, T. et al. Increased cytotoxicity of soluble Fas ligand by fusing isoleucine zipper motif. Biochem. Biophys. Res. Commun.322, 197–202 (2004). [DOI] [PubMed] [Google Scholar]
- 67.Miyata, Y. & Segawa, K. Protocol to analyze lipid asymmetry in the plasma membrane. STAR Protoc.3, 101870 (2022). [DOI] [PMC free article] [PubMed] [Google Scholar]
- 68.Cong, L. et al. Multiplex genome engineering using CRISPR/Cas systems. Science339, 819–823 (2013). [DOI] [PMC free article] [PubMed] [Google Scholar]
- 69.Kitamura, T. et al. Retrovirus-mediated gene transfer and expression cloning: powerful tools in functional genomics. Exp. Hematol.31, 1007–1014 (2003). [PubMed] [Google Scholar]
- 70.Shalem, O. et al. Genome-scale CRISPR–Cas9 knockout screening in human cells. Science343, 84–87 (2014). [DOI] [PMC free article] [PubMed] [Google Scholar]
- 71.Higuchi, R. In PCR Protocols: A Guide to Methods and Applications (eds Innis, M. A. et al.) 177–188 (Academic Press, 2012).
- 72.Ryoden, Y., Fujii, T., Segawa, K. & Nagata, S. Functional expression of the P2X7 ATP receptor requires Eros. J. Immunol.204, 559–568 (2020). [DOI] [PubMed] [Google Scholar]
- 73.Joung, J. et al. Genome-scale CRISPR–Cas9 knockout and transcriptional activation screening. Nat. Protoc.12, 828–863 (2017). [DOI] [PMC free article] [PubMed] [Google Scholar]
- 74.Goehring, A. et al. Screening and large-scale expression of membrane proteins in mammalian cells for structural studies. Nat. Protoc.9, 2574–2585 (2014). [DOI] [PMC free article] [PubMed] [Google Scholar]
- 75.Jaenecke, F. et al. Generation of conformation-specific antibody fragments for crystallization of the multidrug resistance transporter MdfA. Methods Mol. Biol.1700, 97–109 (2018). [DOI] [PubMed] [Google Scholar]
- 76.Kohler, G., Howe, S. C. & Milstein, C. Fusion between immunoglobulin-secreting and nonsecreting myeloma cell lines. Eur. J. Immunol.6, 292–295 (1976). [DOI] [PubMed] [Google Scholar]
- 77.Ozawa, T., Kishi, H. & Muraguchi, A. Amplification and analysis of cDNA generated from a single cell by 5′-RACE: application to isolation of antibody heavy and light chain variable gene sequences from single B cells. Biotechniques40, 469–470 (2006). [DOI] [PubMed] [Google Scholar]
- 78.Punjani, A., Rubinstein, J. L., Fleet, D. J. & Brubaker, M. A. cryoSPARC: algorithms for rapid unsupervised cryo-EM structure determination. Nat. Methods14, 290–296 (2017). [DOI] [PubMed] [Google Scholar]
- 79.Pettersen, E. F. et al. UCSF ChimeraX: structure visualization for researchers, educators, and developers. Protein Sci.30, 70–82 (2021). [DOI] [PMC free article] [PubMed] [Google Scholar]
- 80.Emsley, P. & Cowtan, K. Coot: model-building tools for molecular graphics. Acta Crystallogr. D60, 2126–2132 (2004). [DOI] [PubMed] [Google Scholar]
- 81.Croll, T. I. ISOLDE: a physically realistic environment for model building into low-resolution electron-density maps. Acta Crystallogr. D74, 519–530 (2018). [DOI] [PMC free article] [PubMed] [Google Scholar]
- 82.Yamashita, K., Palmer, C. M., Burnley, T. & Murshudov, G. N. Cryo-EM single-particle structure refinement and map calculation using Servalcat. Acta Crystallogr. D77, 1282–1291 (2021). [DOI] [PMC free article] [PubMed] [Google Scholar]
- 83.Williams, C. J. et al. MolProbity: more and better reference data for improved all-atom structure validation. Protein Sci.27, 293–315 (2018). [DOI] [PMC free article] [PubMed] [Google Scholar]
- 84.Barad, B. A. et al. EMRinger: side chain-directed model and map validation for 3D cryo-electron microscopy. Nat. Methods12, 943–946 (2015). [DOI] [PMC free article] [PubMed] [Google Scholar]
- 85.Pintilie, G. et al. Measurement of atom resolvability in cryo-EM maps with Q-scores. Nat. Methods17, 328–334 (2020). [DOI] [PMC free article] [PubMed] [Google Scholar]
- 86.Bligh, E. G. & Dyer, W. J. A rapid method of total lipid extraction and purification. Can. J. Biochem. Physiol.37, 911–917 (1959). [DOI] [PubMed] [Google Scholar]
- 87.Takeda, H. et al. Widely-targeted quantitative lipidomics method by supercritical fluid chromatography triple quadrupole mass spectrometry. J. Lipid Res.59, 1283–1293 (2018). [DOI] [PMC free article] [PubMed] [Google Scholar]
- 88.Fushimi, T. et al. Dynamic metabolome analysis reveals the metabolic fate of medium-chain fatty acids in AML12 cells. J. Agric. Food Chem.68, 11997–12010 (2020). [DOI] [PubMed] [Google Scholar]
- 89.Hata, K., Izumi, Y., Hara, T., Matsumoto, M. & Bamba, T. In-line sample processing system with an immobilized trypsin-packed fused-silica capillary tube for the proteomic analysis of a small number of mammalian cells. Anal. Chem.92, 2997–3005 (2020). [DOI] [PubMed] [Google Scholar]
- 90.Gyobu, S., Ishihara, K., Suzuki, J., Segawa, K. & Nagata, S. Characterization of the scrambling domain of the TMEM16 family. Proc. Natl Acad. Sci. USA114, 6274–6279 (2017). [DOI] [PMC free article] [PubMed] [Google Scholar]
Associated Data
This section collects any data citations, data availability statements, or supplementary materials included in this article.
Supplementary Materials
Supplementary Figs. 1–4 and associated uncropped western blot images.
Supplementary Video 1.
Supplementary Tables 1 and 2 are in one Excel file with two tabs.
Numerical source.
Unprocessed western blots and/or gels.
Numerical source.
Unprocessed western blots and/or gels.
Numerical source.
Numerical source.
Unprocessed western blots and/or gels.
Numerical source.
Unprocessed western blots and/or gels.
Numerical source.
Numerical source.
Unprocessed western blots and/or gels.
Numerical source.
Data Availability Statement
The cryo-EM maps were deposited to the Electron Microscopy Data Bank (EMDB) under accession numbers EMD-37501 (LMNG–CHS), EMD-60251 (LMNG–CHS with YN9303-24 Fab), EMD-60252 (DDM–CHS) and EMD-37502 (DDM–CHS with YN9303-24 Fab) and the coordinates were deposited to the Protien Data Bank (PDB) under accession numbers 8WG3 (LMNG–CHS) and 8WG4 (DDM–CHS with YN9303-24 Fab). The corresponding cryo-EM raw images were deposited to the EM Public Image Archive under accession codes EMPIAR-12281 (LMNG–CHS), EMPIAR-12282 (DDM–CHS with YN9303-24 Fab), EMPIAR-12283 (LMNG–CHS with YN9303-24 Fab) and EMPIAR-12284 (DDM–CHS). The palmitoylated peptides of mTMEM63B protein were identified using the SwissProt database (https://www.uniprot.org/uniprotkb?query=reviewed%3Atrue&facets=model_organism%3A10090) and the analysis data are shown in Supplementary Table 2. The lipidomic data are shown in Supplementary Table 1. The proteomics and lipidomics MS raw data were deposited to the jPOST repository with the dataset identifier JPST003386 and the MB-POST repository with the dataset identifier MPST000001, respectively. Source data are provided with this paper.