

Abstract
Hepatocellular carcinoma (HCC) is the most common type of liver cancer and is associated with high morbidity and mortality rates. The aims of this study were to investigate the immune-promoting action of nucleolar and spindle-associated protein 1 (NUSAP1) and identify an immunotherapy target for HCC. The Cancer Genome Atlas (TCGA) was used to analyze interaction molecules and immune correlation. The interaction between NUSAP1 and SHC binding and spindle associated 1 (SHCBP1) was examined. The role of the SHCBP1/Janus kinase 2/signal transducer and activator of transcription 3 (SHCBP1/JAK2/STAT3) pathway in this process was explored. After co-culture with HCC cell lines, the differentiation of peripheral blood mononuclear cells (PBMCs) into dendritic cells (DC) was evaluated by measuring the expression of surface factors CD1a and CD86. Pathological tissues from 50 patients with HCC were collected to validate the results of cell experiments. The expression levels of CD1a and CD86 in tissues were also determined. The results show that NUSAP1 interacted with SHCBP1 and was positively correlated with DC. In HCC cell lines, an interaction was observed between NUSAP1 and SHCBP1. It was verified that NUSAP1 inhibited the JAK2/STAT3 phosphorylation pathway by blocking SHCBP1. After co-culture, the levels of CD1a and CD86 in PBMC were elevated. In the clinical specimens, CD1a and CD86 expression levels were significantly higher in the high-NUSAP1 group versus the low-NUSAP1 group. In Summary, NUSAP1 enhanced immunity by inhibiting the SHCBP1/JAK2/STAT3 phosphorylation pathway and promoted DC generation and HCC apoptosis. NUSAP1 may be a target of immunotherapy for HCC.
Key Words: hepatocellular carcinoma, nucleolar and spindle-associated protein 1, immunity, dendritic cell, SHCBP1/JAK2/STAT3 pathway
Liver cancer is the third leading cause of cancer-related death and is characterized by a high rate of recurrence.1–3 Hepatocellular carcinoma (HCC) accounts for 80% of liver cancer cases.4 The majority of patients are diagnosed with HCC at an advanced or unresectable disease stage; consequently, treatment options are limited, and the prognosis is unfavorable.5,6 Due to its toxic side effects, systemic chemotherapy provides only marginal survival benefits for patients with HCC.7 Other therapeutic approaches, such as surgical resection, transplantation, ablation, intervention, and targeted therapy, have led to improved survival rates. Nevertheless, ~70% of patients experience relapse within 5 years. Moreover, currently, there are no established medications available for the prevention of disease recurrence.8–15 HCC is becoming a global health challenge; therefore, it is particularly important to develop a safe and effective therapy for this disease.
Recently, cancer immunotherapy (ie, treatment involving the immune system of the patient) has become a new option for the clinical treatment of multiple tumor types.16 The immune system can monitor the systemic immune response, locate cancer cells for elimination, and achieve long-term regression of local and metastatic tumors.17 As the first line of defense in the human body, the innate immune system responds to harmful immunogens and eliminates them in a nonspecific manner.18,19 Dendritic cells (DC) are among the most effective antigen-presenting cells (APC); thus, they can effectively activate natural and adaptive immunity by producing regulatory factors. DC vaccine has been used in tumor immunotherapy to promote T-cell proliferation and induce a durable and powerful humoral and cytotoxic T lymphocyte (CTL) immune response.18,19 Therefore, it is crucial to activate and generate DC in tumor immunity.
Nucleolar and spindle-associated protein 1 (NUSAP1) is an important mitotic regulator, binding to microtubules and playing key roles in mitotic processes and spindle formation and stability. In HCC, low levels of NUSAP1 have been significantly correlated with poor patient prognosis20–22 and associated with the recurrence of HCC.23 In addition, NUSAP1 plays an important role in tumor progression and invasion.24,25 Recently, increasing evidence showed that NUSAP1 is a tumor stem cell-related gene inhibiting immune infiltration and tumorigenesis.26,27 It has also been demonstrated that NUSAP1 downregulation can promote tumor metastasis by enhancing the properties of cancer stem cells (CSC) and the progression of epithelial-to-mesenchymal transition (EMT).28 Although the pathogenic mechanisms of NUSAP1 in multiple tumor types have been well studied, their effect on the tumor immune microenvironment has not been thoroughly investigated.
This study aims to find a new target for HCC immunotherapy that can safely and effectively inhibit HCC and regulate the microenvironment around HCC, and explore the specific mechanisms of its effects. It could provide a target for anti-HCC immunotherapy and a new direction for the treatment of HCC.
MATERIALS AND METHODS
Identification of Differentially Expressed Genes (DEGs)
RNA sequencing data and clinical characteristics of HCC were retrieved from the TCGA database. RNA matrix data analysis was performed using R software 4.0.3. After excluding patients with incomplete clinical data, the data from 424 cases were included in the study.
The gene expression data downloaded from the TCGA website (424 cases) were divided into 2 groups based on cancer tissue and cancer adjacent tissue (Normal, n=50; Tumor, n=374). According to the threshold of statistical significance, | log2 fold change |>2, and P<0.05, DEGs were screened from the TCGA database based on expression differences and clinical univariate Cox regression.
The Gene Ontology (GO) and Kyoto Encyclopedia of Genes and Genomes (KEGG) databases were used as references. The “cluster profiler” package in R was used to conduct enrichment analysis on DEGs selected from TCGA and GEO databases. We used the Benjamini-Hochberg approach to correct for multiple factor differences, and a false discovery rate of <0.05 indicated statistical significance.
The immunogene module of the TIMER tool (https://cistrome.shinyapps.io/timer) was used to analyze the correlation between the expression of hub genes and immunological infifiltration (including infifiltration levels of B cell, CD4+T cell, CD8+T cell, macrophage, neutrophil, and dendritic cell) in HCC tissues from the TCGA.29,30
Cell Culture and Transfection
HCC cell line Hep-2G and Huh-7 were purchased from American Type Culture Collection (ATCC, Manassas, VA, USA) and grown in MEM medium(Gibco; Thermo Fisher Scientific Inc., Waltham, MA, USA) at 37°C in a humidified atmosphere with 5% CO2, respectively. Meanwhile, 10% fetal bovine serum (FBS; Gibco) was used in the cultures of the above 2 cell lines.
pc-NUSAP1 lentiviral plasmids and sh-SHCBP1 lentiviral plasmids were chemically synthesized by Shanghai GenePharma Co. Ltd. (Shanghai, China). The sequences of pc-NUSAP1 are the following: 5’- GCT CAG CCA CAC TGA GCT TCT GCC TCA-3’. The sequences of the sh-SHCBP1#1 and sh-SHCBP1#2 are the following: 5’- CCA ATT ACA GTG AGT CTG ATT-3’ and 5’- GCT TGA GTG AAA GGT AGA TTT-3’ and nontargeting shRNA. After transfection of 293T cells with the appropriate lentiviral vector along with psPAX2 (GenePharma Shanghai, China) and pMD2.G (GenePharma Shanghai, China) and cultivated at 37°C for 48 h, the lentiviral particles were harvested. When the cell density reached ~60%–70% confluence, Hep-G2 cells and Huh-7 cells were transfected with the lentiviral particles by polybrene (MedchemExpress, New Jersey, USA), respectively. The next day, the cells were intervened with puromycin for 48 hours to achieve human HCC Hep-G2 and Huh-7 cells with overexpressed NUSAP1 and knockdown SHCBP1, shortly named transfected HCC Hep-G2 and transfected Huh-7 cells.
Cell Counting Kit-8 (CCK-8) and Colony Formation Assays
Transfected Hep-G2 cells and Huh-7 cells were collected and resuspended in a complete culture medium (3×10⁴ cells/ml) and then subcultivation in 96-well plates (100 μl/well). 24, 48, and 72 hours later; the cells were probed with 10 μl CCK-8 solution (Beyotime) at 37°C for 2 h. The OD value was read at 450 nm wavelength using a microplate reader (Bio-Rad, Hercules, CA, USA). The proliferation inhibition rate was calculated by the formula: proliferation inhibition rate (%)=(1-OD value of experimental group/OD value of wild group)×100%.
To further investigate the proliferation inhibition, the transfected Hep-G2 cells and Huh-7 cells were collected and spread evenly in 6-well plates at a density of 1000 cells/well and then cultivated at 37°C for 21 days to form colonies. Finally, the colonies were rinsed with phosphate-buffered saline (PBS), fixed using 100% methanol, and stained with 0.05% crystal violet. The colonies were counted by a microscope (Nikon, Tokyo, Japan).
Sphere Formation Assay
Cell sphere formation assay was applied to measure cell stemness. The transfected Hep-G2 and Huh-7 cells were seeded in 96-well ultra-low attachment culture dishes (Cat# 3474; Corning) at 200 cells per well and incubated in DMEM/F12 medium (Cat# C11330500BT; Gibco) supplemented with 20 ng/ml basic fibroblast growth factor (Cat# HG10014-NH; Sino Biological) and 20 ng/ml epidermal growth factor (Cat# HG10325-M; Sino Biological), 2% B27 supplement (Cat# 17504–044; Thermo Fisher Scientific). Seven days later, the spheroids were observed and counted by a microscope (Cat# 135706; Nikon Corporation).
Cell Migration Ability Detection
Transwell experiments was used to detect migration ability, 1 × 10⁵ transfected Hep-G2 and Huh-7 cells were respectively added to the upper compartments of the Transwell chambers (8 μm pores; Corning Costar, Cambridge, MA, USA) containing 100 μl of FBS-free medium. Twenty percent FBS-supplemented culture medium was placed in the lower chambers, and then the cells were incubated at 37°C. Seventy-two hours later, cotton buds were used to manually wipe away the nonmigrated cells, and the migrated cells were treated with 100% methanol for fixation and 0.05% crystal violet for coloration. Next, the migrated cells were counted and photographed by an inverted light microscope(Nikon, Tokyo, Japan). To assess invasion capacity, the top layer surface of the membranes was coated with Matrigel (BD Bioscience, San Jose, CA, USA) in advance, and the subsequent experimental steps were the same as those described above.
Flow Cytometry Analysis
Flow cytometry analysis was applied to measure cell apoptosis. The cell cycle was estimated utilizing propidium iodide (PI) staining. As usual, PI binding to DNA is proportional to the DNA content, which is used to determine the cell cycle stage. The transfected Hep-G2 and Huh-7 cells were seeded at a density of 1×10⁶ cells per well with complete medium in 6-well plates and incubated overnight. After stained and washed three times with PBS, the cells were detached and fixed with 70% cold ethanol at 4°C overnight, then stained with PI solution (including RNase) in the dark at room temperature for 20 minutes and finally evaluated by flow cytometry. This procedure was repeated 3 times.
TUNEL Assay
TUNEL assay was applied to further measure cell apoptosis. The transfected Hep-G2 and Huh-7 cells were subcultivated in 12-well plates for 24 h and then fixed with 4% PFA for 15 min and then stained with TUNEL reagent (Beyotime) for 1 h at room temperature. 4’,6-diamidino-2-phenylindole (DAPI, Beyotime) was used to dye cell nuclei. The fluorescence signal was collected with an XSPY-3201LED fluorescent microscope (Shanghai CSOIF Co., LTD, Shanghai, China).
Western Blot Analysis
The total proteins of transfected Hep-G2 cells and Huh-7 cells were respectively isolated by RIP assay (RIPA) lysis buffer containing phenylmethanesulfonyl fluoride (Beyotime). After quantification with the BCA Protein Assay Kit (Beyotime), the same amount of proteins was loaded and subjected to separation in 10% sodium dodecylsulfate-polyacrylamide gel electrophoresis (SDS-PAGE), and then the proteins were transferred onto a polyvinylidene difluoride (PVDF) membrane. Subsequently, the membranes were immersed in 5% nonfat dry milk at room temperature for 2 h and incubated overnight at 4°C with primary antibodies targeting NUSAP1(Cat. No. #54828; SAB, Maryland, USA), SHCBP1(Cat. No. 12672-1-AP; Proteintech, California, USA), JAK2(Cat. No. #48922; SAB, Maryland, USA), phospho-JAK2(Cat. No. #C92136HRP; SAB, Maryland, USA), STAT3(Cat. No. #41464; SAB, Maryland, USA), phospho-STAT3(Cat. No. #11045; SAB, Maryland, USA), or GAPDH (Cat. No. ab8245; Abcam, Cambridge, UK). Next, a further 2 h incubation at room temperature was conducted with a horseradish peroxidase (HRP)-conjugated secondary antibody (Cat. No. ab205719; Abcam, Cambridge, UK). Finally, Pierce™ ECL Western Blotting Substrate (Thermo Fisher Scientific Inc.) was adopted for target signal visualization.
Co-immunoprecipitation Analysis
Total protein lysate was isolated from Hep-G2 and Huh-7 cell lines by RIP assay (RIPA) lysis buffer containing phenylmethanesulfonyl fluoride (Beyotime), respectively. A target protein-specific anti-NUSAP1(Cat. No. #54828; SAB, Maryland, USA) or anti-SHCBP1(Cat. No. 12672-1-AP; proteintech, California, USA) antibody in conjunction with Protein A/G affinity beads (Santa Cruz Biotechnology) for 30–60 min at 4 °C. The bead-antibody complex was suspended with the corresponding protein lysate. The beads were washed 3 times with extraction buffer and collected by centrifugation at 3000g. Subsequently, the immunoprecipitants were subjected to Western Blot Analysis.
Interleukin-6 (IL-6) Level Detection
Elisa assay was applied to measure the IL-6 level. After the transfected Hep-G2 and Huh-7 cells grew in the medium for 24, 48, and 72 h, the cell culture supernatants were collected. According to the instructions of IL-6 ELISA kits purchased from Boster Biological Co. (Cat# MEK2004; Boster, USA), IL-6 level in the cultured cell supernatants of the different groups were detected, respectively. The OD value was read at 562 nm wavelength using a microplate reader (Bio-Rad, Hercules, CA, USA).
Dendritic Cell Level Detection
Peripheral blood mononuclear cells (PBMCs) were separated from the venous blood (15 mL) of a volunteer with 10-hour fasting by Ficoll (Sigma, USA) gradient centrifugation within 2 hours. The single-cell suspension was prepared and then kept in 1640 medium.
PBMCs were seeded on the top of collagenased cell culture inserts of a 12-well Transwell system (Corning BV, The Netherlands) at a density of 2.5×10⁵ cells per cell culture insert. Before and after transfection, HCC cells were seeded at a density of 2.5×10⁵ cells per well. Then cultivated under a humidifed atmosphere of 5% CO2 at 37 °C for 14 days. The cultured cells were used for subsequent studies.
CD1a and CD86 were detected by cell surface staining to evaluate the DC level. The transfected and non-transfected cells Hep-G2 and Huh-7 were respectively cocultured with PBMCs. At the same time, JAK activator 50 nM Coumermycin A1 and IL-6 inhibitor 1μM LMT-28(MCE, USA) were used for 24 h for the response experiment, and IL-4 (20 ng/mL) and GM-CSF (50 ng/mL) were added to induce PBMC differentiation. Fourteen days later, the PBMCs were stained in the dark at room temperature for 1 h with 500 μL of CD1a (Cat. No. #C49610; SAB, Maryland, USA) and CD86 (Cat. No. #C48763; SAB, Maryland, USA), and then analyzed by flow cytometry (BD Bioscience). This procedure was replicated 3 times.
Histopathology and Immunohistochemistry
The tumor samples of 50 HCC surgical inpatients and the related clinical data in Taizhou People’s Hospital from March 2018 to March 2023 were collected. The tumor tissues were cut into 2 μm sections from at least 3 different planes and stained with haematoxylin and eosin, the histopathology was observed by an optical microscope (Nikon, Tokyo, Japan).
Paraffin-embed section dehydration and immunoperoxidase staining were performed. Antigenic epitopes were exposed using a 10 mM citrate buffer and microwaving. The sections were incubated with rabbit polyclonal antibodies. Primary Ab staining was detected with peroxidase-conjugated anti-rabbit IgG. The images were acquired under a Leica DM4000B fluorescence microscope equipped with a digital camera. For the quantitative analysis, histoscore (H score) was calculated based on the staining intensity and percentage of stained cells. The tissue sections were examined and scored separately by 2 independent investigators blinded to the clinicopathologic data.
Statistical Analysis
All data were obtained from three independent experiments and were expressed as the mean ± SD. The difference between the 2 groups was analyzed using paired or unpaired Student t-tests. One-way analysis of variance (ANOVA) followed by Tukey’s test was employed to assess the differences between multiple groups. The correlation of different genes in expression was tested using Pearson’s correlation coefficient. A value of P<0.05 was considered to indicate a statistically significant difference.
RESULTS
Bioinformatics Screened NUSAP1 in HCC and Explored the Correlation with Immunity
RNA sequencing data of HCC were retrieved from TCGA, and 424 cases were involved in the study. Compared with adjacent tissues, 6969 DEGs were found in tumor tissues, among which 3479 were upregulated and 3490 were downregulated (P<0.05, | Log2FC |>0.565) (Fig. 1A). To further screen DEGs, 2086 DEGs were selected based on univariate COX regression (High-risk gene: HR>1, P<0.05 Low-risk genes: HR<1, P<0.05), as a result, Compared with adjacent tissues, 1099 were upregulated and 987 were downregulated (Fig. 1B). NUSAP1 is a risk factor in both analysis methods, and SHCBP1 is a protective factor. Then, the selected differential genes were imported into the STRING database for PPI analysis, with the interaction score>0.4 (Fig. 1C).
FIGURE 1.

Expression profile characteristics of the TCGA-LIHC data sets NUSAP1 and SHCBP1. Volcano plot of the differentially expressed genes. Red dots indicate upregulated genes; black dots indicate genes with no significant expression changes; and Green dots indicate downregulated genes. The threshold was | log2 fold change |>0.565, P<0.05; (B) Univariate Cox analysis identified prognosis-related differentially expressed genes.High-risk gene: HR>1, P<0.05; Low-risk genes: HR <1, P<0.05; (C) PPI networks of prognosis-related differentially expressed genes. The cytohubba was used to find the network hub genes (top 20); (D, G) NUSAP1 and SHCBP1 expression in 50 normal tissues and 374 tumor tissues from the TCGA-LIHC data set; (E, H) NUSAP1 and SHCBP1 expression in 50 paired tissues from the TCGA-LIHC data set; (F, I) ROC curves for distinguishing the NUSAP1 and SHCBP1 expression of 50 normal tissues and 374 tumor groups in the TCGA-LIHC data set; (J) survival analysis of NUSAP1 and SHCBP1 from TCGA-LIHC database; (K) NUSAP1 and SHCBP1 expression correlation analysis from the TCGA-LIHC data set; (L) Association between SHCBP1 expression and immune cell infiltration from the TCGA-LIHC database.
To investigate the biological role of NUSAP1, we explored the mRNA expression of NUSAP1 in 50 normal tissues and 374 tumor tissues from the TCGA-LIHC data set (Fig. 1D); the results suggested that NUSAP1 was significantly downregulated in the tumor tissues (P<0.001). In the 50 paired tissues, NUSAP1 was also significantly downregulated in the tumor tissues (P<0.001) (Fig. 1E). To verify the diagnostic value of SHCBP1 in HCC, an ROC curve was drawn to verify its significance in HCC diagnosis. The results showed that NUSAP1 low expression had a good diagnostic value for HCC (area under the curve=0.736,95% CI: 0.945-0.977) (Fig. 1F). Also, when exploring the role of SHCBP1, we found that SHCBP1 expression was significantly upregulated in the tumor tissues whether in both the whole tissues (P<0.001) (Fig. 1G) and in the 50 paired tissue pairs (P<0.001) (Fig. 1H). In addition, ROC curve showed that SHCBP1 high expression had a good diagnostic value for HCC (area under the curve=0.959,95%CI: 0.936-0.987) (Fig. 1I). Moreover, NUSAP1 and SHCBP1 were involved in the tumorigenesis and malignancy progress of HCC.
To explore whether there was an interaction between NUSAP1 and SHCBP1, we conducted a survival analysis, and we found that the 2 groups were only when NUSAP1 had low expression and SHCBP1 high expression (P=0.049) (Fig. 1J). And according to TCGA-LIHC dataset NUSAP1, SHCBP1 expression correlation analysis, NUSAP1 and SHCBP1 were negatively correlated(R=−0.25, P<0.001) (Fig. 1K).
Subsequently, the immune correlation on SHCBP1 was analyzed (Fig. 1L), and the results showed that the enrichment score of DC in the SHCBP1 low-expression group was significantly higher than that of the SHCBP1 high-expression group. As a result, it was conceived that the process of NUSAP1 influencing DC levels may be related to SHCBP1.
NUSAP1 Inhibited the Malignance of the Human HCC Cell Lines
NUSAP1 plays an important role in the progression of tumors.23,24 To validate the bioinformatics analysis results and reveal the effect of NUSAP1 on HCC, relevant validation was performed in vitro. The NUSAP1 level of the 2 human HCC cell lines (Hep-G2 and Huh-7) was both significantly lower than that of the normal human hepatocytes cell line (Fig. 2A). Hep-G2 and Huh-7 cell lines were so used for further functional experiments. After pc-NUSAP1 lentiviral transfection, NUSAP1 expression level of Hep-G2 and Huh-7 cell lines both increased (Fig. 2B). Colony formation assay instructed the NUSAP1 inhibited their clonogenic capacity (Fig. 2C), and CCK-8 assay showed NUSAP1 overexpress inhibited the cells’ proliferation (Inhibition ratio at 72 hours: Hep-G2: Control vs. pc-NUSAP1 1.5±0.2% vs. 57.2±9.4%, P<0.001; Huh-7: Control vs. pc-NUSAP1 3.1±0.4% vs. 41.5±5.7%, P=0.009) (Fig. 2D). Meanwhile, the Transwell assay proved that NUSAP1 overexpress inhibited the migration and invasion of Hep-G2 and Huh-7 cells (Fig. 2E-F).
FIGURE 2.

NUSAP1 inhibits the malignance of the human HCC cell lines. (A) Expression of NUSAP1 in HCC and normal hepatocytes cell line; (B) The transfection efficiency of NUSAP1 overexpressing in HCC; (C and D) NUSAP1 overexpressing HCC cells proliferation and colony formation; (E and F) The migratory and invasive properties of NUSAP1 overexpressing HCC cells were determined through Transwell experiments; (G) Sphere formation assays investigated the NUSAP1 overexpressing HCC cells stemness; (H) TUNEL experiments investigated the NUSAP1 overexpressing HCC cells level of apoptosis (***P<0.001).
Previous studies suggest that NUSAP1 influences tumor stemness.25,26 Sphere formation assays were so performed to investigate the correlation of NUSAP1 with HCC stemness. Compared to adherent cells, the NUSAP1 expression level was significantly downregulated in HCC tumor spheres and further increased during serial passages (Fig. 2G). Meanwhile, after 24 hours intervention with Cisplatin (DDP) at 10 μM concentration, TUNEL experiments indicated that the level of apoptosis observed in the pc-NUSAP1 group was significantly increased compared with the Control group(Apoptosis ratio at 24 hours: Hep-G2: Control vs. pc-NUSAP1 13.6±3.2% vs. 37.6±5.4%, P<0.001; Huh-7: Control vs. pc-NUSAP1 8.3±1.9% vs. 23.1±6.3%, P=0.009) (Fig. 2H).
Taken together, NUSAP1 overexpress reduced the malignancy of HCC.
NUSAP1 Inhibited the JAK2/STAT3 Phosphorylation Pathway by Binding to SHCBP1 in HCC Cell Lines
SHCBP1, a protein that specifically links the SH2-domain of the Src homolog (Shc), participates in activating multiple phosphorylation pathways in tumors.31 In human body, JAK2/STAT3 phosphorylation pathway is able to regulate cytokine levels,32–34 Subsequently, we performed a gene set enrichment analysis (GSEA) on the TCGA-LIHC data and found that were significantly enriched in KEGG_JAK_STAT_SIGNALING_PATHWAY (Fig. 3A). The immunomodulatory of NUSAP1 is speculated to be associated with the activation of JAK2/STAT3 phosphorylation pathway. To verify this speculation, We first tested whether there was an interaction between NUSAP1 and SHCBP1 in Hep-G2 and Huh-7. CO-IP experiments demonstrated that NUSAP1 and SHCBP1 were able to bind (Fig. 3B), And the expression levels of NUSAP1 and SHCBP1 were inversely correlated (Fig. 3C). We further detected the phosphorylation of JAK2/STAT3 of HCC cell lines by Western Bolt, and the results showed the level of p-JAK2 and p-STAT3 were both decreased, while the levels of JAK2 and STAT3 were no significantly changed after NUSAP1 overexpressed in Hep-G2 and Huh-7 cells (Fig. 3D).
FIGURE 3.

NUSAP1 role in the JAK/STAT3 pathway in human HCC cell lines. (A) GSEA was used to analyze the KEGG_JAK_STAT_SIGNALING_PATHWAY in TGCA (n=374); (B) CO-IP experiments detect NUSAP1 and SHCBP1 binding; (C) WB detect NUSAP1 and SHCBP1 correlation; (D) WB detect NUSAP1 and JAK2/STAT3 pathway correlation; (E) WB detect SHCBP1 role in NUSAP1 and JAK/STAT3 pathway correlation; (F) Resuce experiment validate SHCBP1 role in NUSAP1 and JAK2/STAT3 pathway correlation.
To further verify that NUSAP1 activates the JAK2/STAT3 phosphorylation pathway by binding to SHCBP1, SHCBP1 was knockdown in the HCC cell line with NUSAP1 overexpressed by transfecting sh-SHCBP1 lentiviral plasmids to test the phosphorylation level of JAK2/STAT3 pathway. The result showed the levels of p-JAK2 and p-STAT3 after SHCBP1 knockdown were significantly decreased compared with that of the control group, whereas the levels of JAK2 and STAT3 had no significant changes (Fig. 3E). The Coumermycin A1 (JAK activator) was applied for the response experiments. It was found the p-JAK2 and p-STAT3 levels had no significant difference in the control group and SHCBP1 knockdown group after Coumermycin A1 intervene (Fig. 3F), which further verified the correlation between the NUSAP1 and JAK2/STAT3 phosphorylation pathway and indicated that NUSAP1 bound SHCBP1 to inhibit the JAK2/STAT3 phosphorylation pathway.
NUSAP1 Inhibited the Level of IL-6 to Promoted the Differentiation of PBMCs Around HCC into DC
It has been evidenced that, in the tumor microenvironment, IL-6 can activate the JAK2/STAT3 phosphorylation pathway, and phosphorylated STAT3, in return, can promote IL-6 secretion in a positive feedback loop, ultimately leading to a favorable tumor growth environment; IL-6 suppresses the activating of multiple immune pathways.33,35,36 In this study, IL-6 level was examined in the supernatant of Hep-G2 and Huh-7 cell groups. The result showed that the IL-6 level in the supernatant of the pc-NUSAP1 groups was both significantly lower than that of the Control groups (Hep-G2: P<0.001; Huh-7: P=0.006) (Fig. 4A).
FIGURE 4.

NUSAP1 intervene in the differentiation of PBMCs around HCC into DC. (A) Elisa assay test IL-6 levels in the cell supernatant; (B and C) After co-culture, the expression levels of the surface factors CD1a and CD86 of PBMCs were determined by flow cytometry; (D and E) After LMT-28 intervene, the expression levels of the surface factors CD1a and CD86 of PBMCs were determined by flow cytometry; (F and G) After Coumermycin A1 intervene, the expression levels of the surface factors CD1a and CD86 of PBMCs were determined by flow cytometry; (H) After co-culture, WB detect Apoptosis-related proteins in HCC.
To verify the effect of NUSAP1 on PBMCs differentiating into DC, HCC cells and human PBMCs were cocultured to determine the expression levels of DC-specific surface factors CD1a and CD86 by flow cytometry. The results showed PBMCs CD1a and CD86 expression levels were significantly higher in the pc-NUSAP1 group compared with Control groups (CD1a: Hep-G2: pc-NUSAP1 group vs. Control group 47.1±8.9% vs. 19.7±3.6% P<0.001; Huh-7: pc-NUSAP1 group vs. Control group 37.1±7.4% vs. 25.7±3.7% P=0.006; CD86: Hep-G2: pc-NUSAP1 group vs. Control group 31.9±8.9% vs. 19.6±3.6% P=0.037; Huh-7: pc-NUSAP1 group vs. Control group 32.8±7.2% vs. 16.3±2.8% P=0.009) (Fig. 4B-C). This indicates that NUSAP1 is able to inhibit the differentiation of PBMCs around HCC into DC.
To explore the role of IL-6 in this progress, IL-6 inhibitor LMT-28 was used in the response experiments, and it was found that there was no significant difference in CD1a and CD86 expression levels in both groups of PBMCs after LMT-28 intervene (Fig. 4D-E). The previously shown results proved that IL-6 plays an important role in inhibiting DC generation in HCC, and blocking IL-6 could promote DC generation.
To prove whether JAK2/STAT3 phosphorylation plays a role in preventing PBMCs from differentiating into DC, Coumermycin A1 (JAK activator) was used in the response experiments and found that CD1a level and CD86 level were both low in PBMCs groups after Coumermycin A1 intervention in comparison with that in no Coumermycin A1 used groups (Fig. 4F-G). The immunosuppression phenomenon may be thus the result of the JAK2/STAT3 pathway through IL-6 positive feedback.
Western Blot was used to examine the apoptosis of transfected HCC cells after co-culturing with PBMCs. As shown in Figure 4H, compared with the control group, Cleaved-caspase-9, Cleaved-caspase-3, Bax, and Cleaved-RARP levels were increased, while Bcl-2 expression level was decreased in pc-NUSAP1 group, meaning more apoptosis in pc-NUSAP1 group after co-culture. Although the pc-NUSAP1 group without co-culture increased apoptosis compared with the control group after co-culture, the apoptosis level was lower than the pc-NUSAP1 group after co-culture. The previously shown results indicated that NUSAP1 promoted PBMCs around HCC, differentiating into DC and HCC apoptosis.
NUSAP1 Function Validated in Clinical Samples by Immunohistochemistry
Tumor and adjacent tissues from 50 surgical HCC patients with related medical information were collected for clinical validation. The NUSAP1 protein in the tissues was quantified by immunohistochemistry, and the results showed that the NUSAP1 protein in the tumor tissues was significantly lower than that in the adjacent tissues(P=0.004) (Fig. 5A), proving the diagnostic significance of NUSAP1 again.
FIGURE 5.

NUSAP1 expression levels in HCC patient tissues. (A) Expression of NUSAP1 in tumor and normal group in HCC patient tissues; (B) Expression of NUSAP1, CD1a, CD86, Bax, and Bcl-2 in HCC patient tissues.
In the 50 HCC cases, NUSAP1 was low expressed in 22 cases (The immunohistochemistry stage was I-II) in the tumor tissues and high expressed in 28 cases (The immunohistochemistry stage was stage III-IV) (Fig. 5B). The results by immunohistochemical staining of DC-specific surface factors CD1a and CD86 in both groups showed that CD1a protein (P=0.008) and CD86 protein (P=0.009) in the tumor tissues of the high NUSAP1 group were both significantly higher than that of the low NUSAP1 group, demonstrating that NUSAP1 low expression inhibited DC production in HCC.
To clinically explore the effect of NUSAP1 on HCC cell apoptosis, Bax and Bcl-2 proteins were detected by immunohistochemistry, and the analysis results showed that Bax expression in the high NUSAP1 group was higher than that in the low NUSAP1 group (P=0.025), while Bcl-2 expression was lower than that in the low NUSAP1 group (P=0.019). The previously shown results demonstrated that NUSAP1 was able to simultaneously promote HCC cell apoptosis. These clinical findings are consistent with the results of cellular experiments.
DISCUSSION
The immune system is a key regulatory factor of tumor biology, with the ability to regulate tumor development, growth, invasion, and metastasis. In recent years, immunotherapy based on the regulation of tumor immunity has provided new options for the treatment of cancer and achieved good results in the clinical setting.37–39 However, a proportion of tumors do not respond to immunomodulatory actions. Certain tumors regulate cytokines in a variety of ways, constructing a microenvironment conducive to tumor growth while inhibiting the anti-tumor immune response of the patient.40 Therefore, although the immune system of a patient can be utilized to attack tumors, it fails to reach its anti-tumor potential in some cases.
The findings of this study further confirmed the low expression of NUSAP1 in HCC and its effects on tumor proliferation, migration, invasion, and stemness. Moreover, this is the first study exploring the specific mechanism by which NUSAP1 affects tumor immunity.
By bioinformatics analysis, we found that the effect of NUSAP1 on HCC may be associated with SHCBP1. SHCBP1 is located downstream of Src homolog and collagen (SHC) (a key binding protein for cell surface receptors) and binds to the SH2 region of SHC.41 It is linked to the development of numerous tumor types and involved in the regulation of various phosphorylation signal transduction pathways, including JAK2/STAT3.42 The JAK/STAT pathway is an evolutionarily conserved signaling pathway involved in several key physiological processes, such as hematopoiesis, differentiation, metabolism, and immune regulation.43–46 Structurally, the JAK/STAT pathway includes transmembrane receptors, receptor-associated cytoplasmic tyrosine kinases (JAK), and STATs.47 As a multifunctional molecule belonging to the STAT family, STAT3 can interact with >40 different cytokines, including interleukin-6 (IL-6), myocardial nutrient-1 (CT-1), and leukemic inhibitory factor (LIF), as well as be activated by the phosphorylation of C-terminal domain tyrosine 705 (Y705). These effects lead to a variety of different functions,48,49 including the regulation of innate immunity.
Inherent immune cells play a key role in tumor elimination. DC, a key component of essential innate immunity, plays an essential role in antigen presentation. The term DC refers to a group of different cell types widely distributed throughout the whole body. They act as sentinels to capture the process and present exogenous antigens (including tumor-specific antigens) to CD4+T cells (direct presentation) by major histocompatibility complex class II (MHC-II). Alternatively, they bind to CD8+T cells (cross-presentation) through a specific pathway of MHC-I to achieve tumor clearance.50–54 Some strategies have been designed based on the immune system to eliminate cancer cells. Nonetheless, certain tumor cells with reduced immunogenicity by immunosuppressive cells and immunosuppression-related molecules can escape from the attack of T cells. In recent years, strategies based on modulating the immune system are widely studied and applied to eliminate cancer cells. These strategies include the use of immune checkpoint inhibitors, such as anti-PD-1 and anti-CTLA-4 antibodies, to enhance T-cell immune responses against tumors. In addition, the use of CAR-T cell therapy is also an effective strategy in which the patient’s T cells are modified into CAR-T cells that can recognize and attack tumor cells.55–57 In addition, immunotherapy methods such as tumor vaccines and cytokine therapy have also made certain progress in clinical trials.58,59
IL-6, a pleiotropic cytokine produced by different cells and tissues, plays a wide range of physiopathological roles.60,61 IL-6 signaling mediated by cell membrane soluble interleukin-6 receptor (sIL-6R) can activate the JAK2/STAT3 phosphorylation pathway. In turn, STAT3 promotes IL-6 secretion in a positive feedback loop, enhances the anti-inflammatory activity of IL-6, and induces the transition from neutrophil to macrophage accumulation, thus inhibiting immunity. The role of IL-6 in the regulation of lymphocytes has also been studied. It induces the differentiation of B cells and T helper 17 cells, whereas it inhibits that of regulatory T cells, thereby facilitating the continuous presence of inflammatory response.62–64 Therefore, blocking IL-6 may be a new concept for suppressing tumor immune escape.
There are still some shortcomings to our study: first, our study was conducted based on public databases and validated in cell experiments, but still not further validated by animal experiments; it may take some time to construct animal models for in vivo experiments, which will be further investigated and validated in subsequent experiments. Second, although our clinical study evaluated the correlation between NUSAP1 and the clinical stage of patients, due to the short follow-up time, it failed to combine NUSAP1 with prognosis-related indicators such as overall survival (OS) and progression-free survival (PFS), which will be published in subsequent studies.
CONCLUSION
In summary, NUSAP1 inhibited the JAK2/STAT3 phosphorylation pathway by binding to SHCBP1. This process promoted the secretion of IL-6 through a positive feedback loop, enabling the formation of a high-IL-6 tumor microenvironment in HCC. This effect inhibited the differentiation of PBMCs into DC, thus resulting in tumor immune escape (Fig. 6). This finding suggests that NUSAP1 could be used as a target for inhibiting tumor immune escape in anti-HCC therapy. NUSAP1 may be used to identify patients at high risk of immune escape and provide active personalized therapy to those patients.
FIGURE 6.
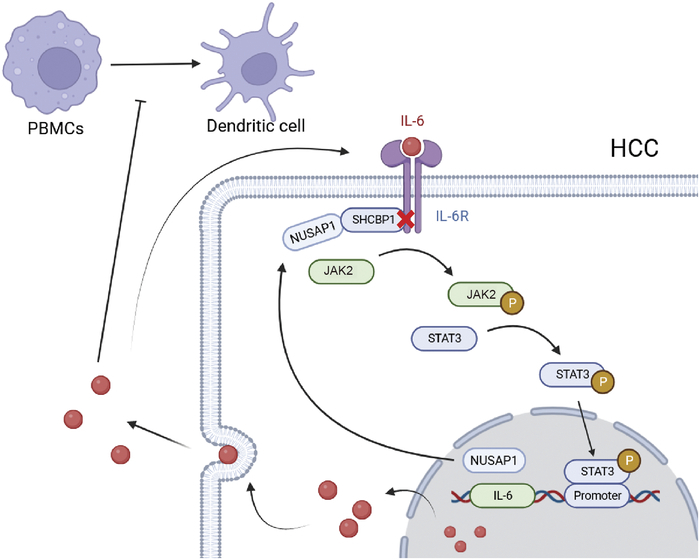
Mechanism diagram.
ACKNOWLEDGMENTS
The authors thank the Department of Pathology, Taizhou People’s Hospital, for assistance in immunohistochemical staining.
Conflicts of Interest/Financial Disclosures
None reported. All authors have declared there are no financial conflicts of interest with regard to this work.
Footnotes
G.C.: Conceptualization, Methodology, Formal analysis, Investigation, Data curation, Writing – original draft, and Writing – review and editing. W.L.: Software, Validation, Formal analysis, Data curation, Writing – original draft, and Writing – review & editing. R.G.: Investigation, Data curation, and Writing – review & editing. T.G.: Validation and editing. Y.Z. and Z.S.: Data curation. C.Z.: Investigation, Writing – review and editing, and Project administration. M.L.: Conceptualization, Methodology, Validation, Formal analysis, Investigation, Data curation, Writing – review and editing, Supervision, Project administration, and Funding acquisition.
G.J.C. and W.Y.L. contributed equally to this work.
Ethics approval and consent to participate:This study was approved by the Ethics Committee of Affiliated Taizhou People’s Hospital of Nanjing Medical University (KY 2023-162-01). All procedures performed in studies involving human participants were in accordance with the 1964 Helsinki Declaration and its later amendments or comparable ethical standards.
All data and materials are available for sharing if needed.
This study was sponsored by the 333 Plan Foundation of Jiangsu, China (Su Talent Office [2022] 21-2).
Contributor Information
Guojie Chen, Email: chenguojie222@163.com.
WenYa Li, Email: liwenya20211226@163.com.
Ruomu Ge, Email: 17705655016@163.com.
Ting Guo, Email: wangjunguoting2008@163.com.
Yuhan Zhang, Email: 2417124395@qq.com.
Chenglin Zhou, Email: 2231510032@stmail.ntu.edu.cn.
Mei Lin, Email: 2814843984@qq.com.
REFERENCES
- 1. Siegel RL, Miller KD, Jemal A. Cancer statistics, 2019. CA Cancer J Clin. 2019;69:7–34. [DOI] [PubMed] [Google Scholar]
- 2. Marquardt JU, Andersen JB, Thorgeirsson SS. Functional and genetic deconstruction of the cellular origin in liver cancer. Nat Rev Cancer. 2015;15:653–667. [DOI] [PubMed] [Google Scholar]
- 3. Maomao C, He L, Dianqin S, et al. Current cancer burden in China: Epidemiology, etiology, and prevention. Cancer Biol Med. 2022;19:1121–1138. [DOI] [PMC free article] [PubMed] [Google Scholar]
- 4. Llovet JM, Kelley RK, Villanueva A, et al. Hepatocellular carcinoma. Nat Rev Dis Primers. 2021;7:6. [DOI] [PubMed] [Google Scholar]
- 5. Forner A, Reig M, Bruix J. Hepatocellular carcinoma. Lancet. 2018;391:1301–1314. [DOI] [PubMed] [Google Scholar]
- 6. Llovet JM, Ricci S, Mazzaferro V, et al. Sorafenib in advanced hepatocellular carcinoma. N Engl J Med. 2008;359:378–390. [DOI] [PubMed] [Google Scholar]
- 7. Ikeda M, Mitsunaga S, Ohno I, et al. Systemic chemotherapy for advanced hepatocellular carcinoma: Past, present, and future. Diseases. 2015;3:360–381. [DOI] [PMC free article] [PubMed] [Google Scholar]
- 8. Llovet JM, Real MI, Montaña X, et al. Arterial embolisation or chemoembolisation versus symptomatic treatment in patients with unresectable hepatocellular carcinoma: A randomised controlled trial. Lancet (London England). 2002;359:1734–1739. [DOI] [PubMed] [Google Scholar]
- 9. Lo CM, Ngan H, Tso WK, et al. Randomized controlled trial of transarterial lipiodol chemoembolization for unresectable hepatocellular carcinoma. Hepatology. 2002;35:1164–1171. [DOI] [PubMed] [Google Scholar]
- 10. Llovet JM, Bruix J. Systematic review of randomized trials for unresectable hepatocellular carcinoma: Chemoembolization improves survival. Hepatology. 2003;37:429–442. [DOI] [PubMed] [Google Scholar]
- 11. Cheng AL, Kang YK, Chen Z, et al. Efficacy and safety of sorafenib in patients in the Asia-Pacific region with advanced hepatocellular carcinoma: A phase III randomised, double-blind, placebo-controlled trial. Lancet Oncol. 2009;10:25–34. [DOI] [PubMed] [Google Scholar]
- 12. Kudo M, Finn RS, Qin S, et al. Lenvatinib versus sorafenib in first-line treatment of patients with unresectable hepatocellular carcinoma: A randomised phase 3 non-inferiority trial. Lancet. 2018;391:1163–1173. [DOI] [PubMed] [Google Scholar]
- 13. Bruix J, Qin S, Merle P, et al. Regorafenib for patients with hepatocellular carcinoma who progressed on sorafenib treatment (RESORCE): A randomised, double-blind, placebo-controlled, phase 3 trial. Lancet. 2017;389:56–66. [DOI] [PubMed] [Google Scholar]
- 14. Hasegawa K, Kokudo N, Makuuchi M, et al. Comparison of resection and ablation for hepatocellular carcinoma: A cohort study based on a japanese nationwide survey. J Hepatol. 2013;58:724–729. [DOI] [PubMed] [Google Scholar]
- 15. Lu LC, Cheng AL, Poon RT. Recent advances in the prevention of hepatocellular carcinoma recurrence. Seminars in Liver Disease. Thieme Medical Publishers; 2014. [DOI] [PubMed] [Google Scholar]
- 16. Waldman AD, Fritz JM, Lenardo MJ. A guide to cancer immunotherapy: From t cell basic science to clinical practice. Nat Rev Immunol. 2020;20:651–668. [DOI] [PMC free article] [PubMed] [Google Scholar]
- 17. Wang DR, Wu XL, Sun YL. Therapeutic targets and biomarkers of tumor immunotherapy: Response versus non-response. Signal Transduct Target Ther. 2022;7:331. [DOI] [PMC free article] [PubMed] [Google Scholar]
- 18. Abbas AK, Lichtman AH, Pillai S, et al. Cellular and Molecular Immunology, 10th ed. Philadelphia, PA, USA: Elsevier; 2022. ISBN 978-0-323-75748-5. [Google Scholar]
- 19. Chaplin DD. Overview of the immune response. J Allergy Clin Immunol. 2010;125:S3–S23. [DOI] [PMC free article] [PubMed] [Google Scholar]
- 20. Chen L, Yang L, Qiao F, et al. High levels of nucleolar spindle associated protein and reduced levels of BRCA1 expression predict poor prognosis in triple-negative breast cancer. PLoS One. 2015;10:e0140572. [DOI] [PMC free article] [PubMed] [Google Scholar]
- 21. Bogunovic D, O’Neill DW, Belitskaya-Levy I, et al. Immune profile and mitotic index of metastatic melanoma lesions enhance clinical staging in predicting patient survival. Proc Natl Acad Sci U S A. 2009;106:20429–20434. [DOI] [PMC free article] [PubMed] [Google Scholar]
- 22. Hou S, Hua L, Wang W, et al. Nucleolar spindle associated protein 1 (NUSAP1) facilitates proliferation of hepatocellular carcinoma cells. Transl Cancer Res. 2019;8:2113–2120. [DOI] [PMC free article] [PubMed] [Google Scholar]
- 23. Liu K, Hao M, Ouyang Y, et al. CD133(+) cancer stem cells promoted by VEGF accelerate the recurrence of hepatocellular carcinoma.. Sci Rep. 2017;7:41499. [DOI] [PMC free article] [PubMed] [Google Scholar]
- 24. Wu X, Xu B, Yang C, et al. Nucleolar and spindle associated protein 1 promotes the aggressiveness of astrocytoma by activating the hedgehog signaling pathway. J Exp Clin Cancer Res. 2017;36:127. [DOI] [PMC free article] [PubMed] [Google Scholar]
- 25. Gordon CA, Gong X, Ganesh D, et al. NUSAP1 promotes invasion and metastasis of prostate cancer. Oncotarget. 2017;8:29935–29950. [DOI] [PMC free article] [PubMed] [Google Scholar]
- 26. Pan S, Zhan Y, Chen X, et al. Identification of biomarkers for controlling cancer stem cell characteristics in bladder cancer by network analysis of transcriptome data stemness indices. Front Oncol. 2019;9:613. [DOI] [PMC free article] [PubMed] [Google Scholar]
- 27. Zeng H, Ji J, Song X, et al. Stemness related genes revealed by network analysis associated with tumor immune microenvironment and the clinical outcome in lung adenocarcinoma. Front Genet. 2020;11:549213. [DOI] [PMC free article] [PubMed] [Google Scholar]
- 28. Li H, Zhang W, Yan M, et al. Nucleolar and spindle associated protein 1 promotes metastasis of cervical carcinoma cells by activating Wnt/beta-catenin signaling.. J Exp Clin Cancer Res. 2019;38:33. [DOI] [PMC free article] [PubMed] [Google Scholar]
- 29. Wang J, Sun J, Liu LN, et al. Siglec-15 as an immune suppressor and potential target for normalization cancer immunotherapy. Nat Med. 2019;25:656–666. [DOI] [PMC free article] [PubMed] [Google Scholar]
- 30. Ravi R, Noonan KA, Pham V, et al. Bifunctional immune checkpoint-targeted antibody-ligand traps that simultaneously disable TGFβ enhance the effiffifficacy of cancer immunotherapy.. Nat Commun. 2018;9:741. [DOI] [PMC free article] [PubMed] [Google Scholar]
- 31. Wang N, Zhu L, Wang L, et al. Identification of SHCBP1 as a potential biomarker involving diagnosis, prognosis, and tumor immune microenvironment across multiple cancers. Comput Struct Biotechnol J. 2022;20:3106–3119. [DOI] [PMC free article] [PubMed] [Google Scholar]
- 32. Liu M, Li C, Qu J, et al. Baicalein enhances immune response in TNBC by inhibiting leptin expression of adipocytes. Cancer Sci. 2023;114:3834–3847. [DOI] [PMC free article] [PubMed] [Google Scholar]
- 33. Chuangchot N, Jamjuntra P, Yangngam S, et al. Enhancement of PD-L1-attenuated CAR-T cell function through breast cancer-associated fibroblasts-derived IL-6 signaling via STAT3/AKT pathways. Breast Cancer Res. 2023;25:86. [DOI] [PMC free article] [PubMed] [Google Scholar]
- 34. Qiu X, Zhou J, Xu H, et al. Alcohol reshapes a liver premetastatic niche for cancer by extra- and intrahepatic crosstalk-mediated immune evasion. Mol Ther. 2023;31:2662–2680. [DOI] [PMC free article] [PubMed] [Google Scholar]
- 35. Anstee Joanne E, Feehan Karen T, Opzoomer James W, et al. LYVE-1 macrophages form a collaborative CCR5-dependent perivascular niche that influences chemotherapy responses in murine breast cancer. Dev Cell. 2023;58:1548–1561.e10. [DOI] [PubMed] [Google Scholar]
- 36. Kim S, Chen J, Jo S, et al. IL-6 selectively suppresses cDC1 specification via C/EBPβ. J Exp Med. 2023;220. [DOI] [PMC free article] [PubMed] [Google Scholar]
- 37. Kalos M, June CH. Adoptive T cell transfer for cancer immunotherapy in the era of synthetic biology. Immunity. 2013;39:49–60. [DOI] [PMC free article] [PubMed] [Google Scholar]
- 38. Hamid O, Robert C, Daud A, et al. Safety and tumor responses with lambrolizumab (anti-PD-1) in melanoma. N Engl J Med. 2013;369:134–144. [DOI] [PMC free article] [PubMed] [Google Scholar]
- 39. Topalian SL, Hodi FS, Brahmer JR, et al. Safety, activity, and immune correlates of anti-PD-1 antibody in cancer. N Engl J Med. 2012;366:2443–2454. [DOI] [PMC free article] [PubMed] [Google Scholar]
- 40. Ferrone C, Dranoff G. Dual roles for immunity in gastrointestinal cancers. J Clin Oncol. 2010;28:4045–4051. [DOI] [PMC free article] [PubMed] [Google Scholar]
- 41. Zhang GY, Ma ZJ, Wang L, et al. The role of Shcbp1 in signaling and disease. Curr Cancer Drug Targets. 2019;19:854–862. [DOI] [PubMed] [Google Scholar]
- 42. Asano E, Hasegawa H, Hyodo T, et al. SHCBP1 is required for midbody organization and cytokinesis completion. Cell Cycle. 2014;13:2744–2751. [DOI] [PMC free article] [PubMed] [Google Scholar]
- 43. Leonard WJ, O’Shea JJ. Jaks and STATs: Biological implications. Annu Rev Immunol. 1998;16:293–322. [DOI] [PubMed] [Google Scholar]
- 44. O’Shea JJ. Jaks, STATs, cytokine signal transduction, and immunoregulation: Are we there yet? Immunity. 1997;7:1–11. [DOI] [PubMed] [Google Scholar]
- 45. Hou XS, Perrimon N. The JAK-STAT pathway in drosophila. Trends Genet. 1997;13:105–110. [DOI] [PubMed] [Google Scholar]
- 46. Barrat FJ, Crow MK, Ivashkiv LB. Interferon target-gene expression and epigenomic signatures in health and disease. Nat Immunol. 2019;20:1574–1583. [DOI] [PMC free article] [PubMed] [Google Scholar]
- 47. Meraz MA, White JM, Sheehan KC, et al. Targeted disruption of the Stat1 gene in mice reveals unexpected physiologic specificity in the JAK-STAT signaling pathway. Cell. 1996;84:431–442. [DOI] [PubMed] [Google Scholar]
- 48. Golus M, Bugajski P, Chorbinska J, et al. STAT3 and its pathways’ dysregulation-underestimated role in urological tumors. Cells. 2022;11:3024. [DOI] [PMC free article] [PubMed] [Google Scholar]
- 49. Amaya ML, Inguva A, Pei S, et al. The STAT3-MYC axis promotes survival of leukemia stem cells by regulating SLC1A5 and oxidative phosphorylation. Blood. 2022;139:584–596. [DOI] [PMC free article] [PubMed] [Google Scholar]
- 50. Dudziak D, Kamphorst AO, Heidkamp GF, et al. Differential antigen processing by dendritic cell subsets in vivo. Science. 2007;315:107–111. [DOI] [PubMed] [Google Scholar]
- 51. Joffre OP, Segura E, Savina A, et al. Cross-presentation by Dendritic Cells. Nat Rev Immunol. 2012;12:557–569. [DOI] [PubMed] [Google Scholar]
- 52. van Endert P. Intracellular recycling and cross-presentation by MHC class I molecules. Immunol Rev. 2016;272:80–96. [DOI] [PubMed] [Google Scholar]
- 53. Amigorena S. Editorial overview: usual and unusual ways to antigen presentation. Curr Opin Immunol. 2020;64:iii–iv. [DOI] [PubMed] [Google Scholar]
- 54. Roquilly A, Mintern JD, Villadangos JA. Spatiotemporal adaptations of macrophage and dendritic cell development and function. Annu Rev Immunol. 2022;40:525–557. [DOI] [PubMed] [Google Scholar]
- 55. Sharma P, Allison JP. The future of immune checkpoint therapy. Science. 2015;348:56–61. [DOI] [PubMed] [Google Scholar]
- 56. Ribas A, Wolchok JD. Cancer immunotherapy using checkpoint blockade. Science. 2018;359:1350–1355. [DOI] [PMC free article] [PubMed] [Google Scholar]
- 57. Zou W, Wolchok JD, Chen L. PD-L1 (B7-H1) and PD-1 pathway blockade for cancer therapy: Mechanisms, response biomarkers, and combinations. Sci Transl Med. 2016;8:328rv4. [DOI] [PMC free article] [PubMed] [Google Scholar]
- 58. June CH, Sadelain M. Chimeric antigen receptor therapy. New England Journal of Medicine. 2018;379:64–73. [DOI] [PMC free article] [PubMed] [Google Scholar]
- 59. Sahin U, Türeci Ö. Personalized vaccines for cancer immunotherapy. Science. 2018;359:1355–1360. [DOI] [PubMed] [Google Scholar]
- 60. Kokje VBC, Gabel G, Koole D, et al. IL-6: a Janus-like factor in abdominal aortic aneurysm disease. Atherosclerosis. 2016;251:139–146. [DOI] [PubMed] [Google Scholar]
- 61. Munoz-Canoves P, Scheele C, Pedersen BK, et al. Interleukin-6 myokine signaling in skeletal muscle: A double-edged sword? FEBS J. 2013;280:4131–4148. [DOI] [PMC free article] [PubMed] [Google Scholar]
- 62. Bettelli E, Carrier Y, Gao W, et al. Reciprocal developmental pathways for the generation of pathogenic effector TH17 and regulatory T cells. Nature. 2006;441:235–238. [DOI] [PubMed] [Google Scholar]
- 63. Kimura A, Naka T, Kishimoto T. IL-6-dependent and -independent pathways in the development of interleukin 17-producing T helper cells. Proc Natl Acad Sci. 2007;104:12099–12104. [DOI] [PMC free article] [PubMed] [Google Scholar]
- 64. Veldhoen M, Hocking RJ, Atkins CJ, et al. TGFβ in the context of an inflammatory cytokine milieu supports de novo differentiation of IL-17-producing T cells. Immunity. 2006;24:179–189. [DOI] [PubMed] [Google Scholar]