

Abstract
Background:
Trichoscopy is a simple, noninvasive tool to help in the diagnosis of various hair and scalp disorders. There is paucity of data on the normal trichoscopic parameters of hair density and diameter in the Indian population.
Aim:
The aim of this study was to establish the trichoscopic patterns of hair and scalp in healthy Indian males and to provide a framework for future reference.
Materials and Methods:
Quantitative trichoscopic analysis using a videodermoscope was done on healthy Indian males with no hair/scalp complaints. Images were taken from four areas: frontal, occipital, and both temporal areas, under 20x and 70x magnification. The following parameters were analyzed by the software: hair density and thickness; percentage of thin, medium, and thick hairs; percentage of anagen and telogen hairs; vellus hair density and hair count; follicular unit density; percentage of follicular hair units; single, double, triple, and four hairs per follicular unit; and distribution and pattern of scalp vasculature.
Results:
A total of 120 healthy males were recruited in the study with a mean age of 24.6 years. The hair density was the highest in the frontal and occipital areas, while the hair thickness was similar in all the sites evaluated. The follicular unit density was the highest in the frontal and occipital areas with the temporal area having the highest number of single hair follicular units. The scalp vasculature varied with the area examined, the most common pattern being the pin-point type.
Limitations:
It was a hospital-based study with a relatively small sample size. The software used in the study cannot detect gray hairs.
Conclusion:
Our study has attempted to fill the gaps in the medical literature by proposing comparable reference values for trichoscopy in healthy Indian males.
Keywords: Hair density, healthy males, hair thickness, trichoscopy, videodermoscope
Introduction
Trichoscopic analysis of the scalp is a noninvasive technique used to diagnose hair and scalp disorders with the help of a manual or video dermoscope. The magnification ranges from 20x to 1000x magnification.[1] The principle involved in trichoscopy is transillumination of a lesion and its evaluation under high magnification to visualize the fine features. The various structures which may be studied include hair shafts, hair follicle openings, perifollicular epidermis, and cutaneous microvessels.[2] Trichoscopy of normal hair and scalp in adult Indian males has not been extensively studied. Hence, in this study, we attempted to establish the normal trichoscopic values for measurable parameters in healthy adult Indian males to help distinguish between the normal and abnormal trichoscopic findings. The aim of our study was to establish the trichoscopic patterns of hair and scalp in healthy Indian males and to establish the normal values of measurable parameters in healthy male population among Indians and provide a framework for future reference.
Materials and Methods
A total of 120 healthy males aged 18 to 50 years with no hair and scalp diseases in anamnesis and clinical examination were recruited in this observational, cross-sectional study. The study group included subjects visiting the Dermatology Outpatient Department of our hospital located in Coastal Karnataka between January 2022 and April 2022. Subjects with complaints of hair loss and other scalp and hair disorders were excluded from the study. The study was approved by the institutional ethics committee (IEC-1/2020/009).
A detailed clinical history regarding age, history of hair loss, scalp pruritus, recent illnesses in the past (<6 months), any medical comorbidities, hair treatments undertaken, drug history, and family history of hair loss were documented. Participants with the following conditions were excluded from the study: disorders of hair loss or scalp skin diseases, rapid weight loss in the past 6 months, systemic conditions such as autoimmune diseases, anemia, diabetes mellitus or thyroid/liver disease, current treatment (topical or systemic) undertaken for hair growth, and use of hair dye/bleaching 1 month prior to study enrolment. All participants were subjected to a detailed clinical examination to look for diffuse/patterned hair loss, scarring on scalp, or excessive scalp scaling.
Photographs were taken using the overview mode of Fotofinder II (Medicam 1000, Germany), which gives a 20x–160x magnification. The images were taken using both the contact nonpolarized and polarized modes of the dermoscope. Trichoscopic images were taken at a magnification of 20x and 70x (areas of 9 mm2 and 1 cm2 were analyzed, respectively) from each of the following areas: frontal, occipital, right temporal, and left temporal. The hair and perifollicular areas were evaluated. The sites chosen were as follows:
Frontal area: a point on the line extending from the tip of the nose crossing the line connecting the tips of both ears.
Temporal area: a point which is 4 cm above the tragus of the ear.
Occipital area: a point on the external occipital protuberance.
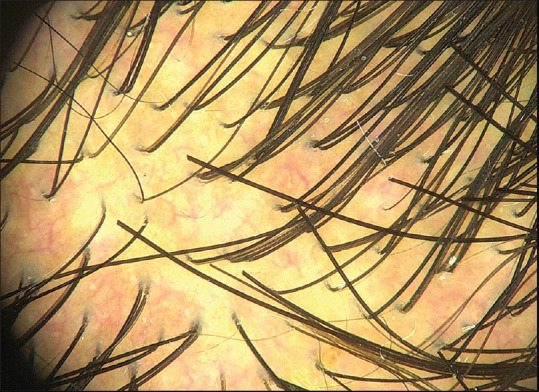
The device is equipped with a TrichoScale pro 3.2 software analysis system, which allows carrying out measurements of structures visualized in magnified images and provides results in real scale. The following parameters were analyzed under 20x magnification [Figure 1]:
Figure 1.

Dermoscopic features of healthy scalp (Fotofinder II, polarized, 20x)
Hair density (/cm2)
Mean hair thickness (mm)
Percentage of thin hairs (<0.03 mm), medium hairs (0.03 mm–0.05 mm), and thick hairs (>0.05 mm)
Percentage of anagen and telogen hairs
Vellus hair density (/cm2)
Vellus hair count (%)
Percentage of follicular hair units
Percentage of single, double, triple, four, or more hairs per follicular unit.
Follicular unit density (/cm2)
Distribution and pattern of blood vessels
The number of yellow dots was calculated on both 20x and 70x magnification.
Statistical analysis
For statistical analysis, the results of right and left temporal areas were averaged. Data was coded and entered in the Excel spread sheet, and statistical analysis was performed using SPSS (Statistical Package for the Social Sciences) version 27 [IBM SPASS statistics (IBM corp. released 2011)]. Descriptive statistics of the explanatory and outcome variables were calculated by mean and standard deviation for quantitative variables and frequency and proportions for qualitative variables. Inferential statistics like repeated ANOVA was applied to compare the quantitative variables with paired t-test used for comparison between different areas. The level of significance was set at 5% (P value < 0.05).
Results
Hair density
The mean hair density was found to be the highest in the frontal area (160.05 ± 86.89/cm2), followed by the occipital (156.27 ± 97.82/cm2) and temporal areas (123.6 ± 64.8/cm2) (P value > 0.05). There was a statistically significant difference in mean hair density between the frontal area and temporal area (P value < 0.001) and also between the occipital area and temporal areas (P value < 0.001). The mean hair density in all areas combined was 146.6 ± 83.17/cm2.
Hair thickness
The mean hair thickness was 0.1 ± 0.04 mm, which was found to be similar in all three areas (P value > 0.05). With regard to hair thickness, none of the pairs from two separate areas were statistically significantly different after being analyzed with pairwise comparisons. Table 1 shows the percentage of thin, medium, and thick hairs in various areas of the scalp.
Table 1.
Percentage of thin, medium, and thick hairs in all the scalp areas
| Areas of scalp | Thin Hair (<0.03 mm) (%) | Medium Hair (0.03-0.05 mm) (%) | Thick Hair (>0.05 mm) (%) |
|---|---|---|---|
| Frontal | 9.9±7.8 | 23±27.1 | 69.3±13.5 |
| Temporal | 8.7±7.7 | 15.9±9 | 75.3±13.5 |
| Occipital | 8±5.8 | 18.6+8.5 | 73.4±11.8 |
Percentage of anagen and telogen hairs
The percentage of anagen hairs was the highest in the temporal areas (79.5 ± 10.94%), followed by the occipital area (74.65 ± 12.59%) and then the frontal area (73.84 ± 14.40%). This difference was statistically significant between the frontal and temporal regions and between the occipital and temporal regions (P value < 0.001). Similarly, the percentage of telogen hairs was the highest in the frontal areas (26.17 ± 14.4%), followed by the occipital area (25.35 ± 12.59%) and then the temporal area (20.50 ± 10.94%). This difference was statistically significant between the frontal and temporal regions and between the occipital and temporal regions (P value < 0.001). The calculation of anagen and telogen hairs was done by the TrichoScale software analysis based on the length of the hairs [Figure 2].
Figure 2.

Anagen (green) and telogen (red) hairs visualized on trichoscopy (Fotofinder II, polarized, 20x)
Vellus hair count
Vellus hairs are defined as nonmedullated, hypopigmented hairs which are <0.03 mm thick and <2–3 mm long.[2] The mean vellus hair count per field was maximum in the occipital area (10.76 ± 4.08), followed by the frontal area (10.2 ± 3.31) and the least in temporal areas (7.83 ± 3.21). The mean percentage of vellus hair count was maximum in the frontal area (10.71 ± 8.32%), followed by the temporal area (9.76 ± 8.49%) and the occipital area (9.64 ± 7.19%). The difference in the mean percentage of vellus hair count was not statistically significant in all the areas (P value > 0.05). The calculation of terminal and vellus hairs was done by the TrichoScale software analysis based on the thickness of the hairs [Figure 3].
Figure 3.

Terminal (blue) and vellus (yellow) hairs visualized on trichoscopy (Fotofinder II, polarized, 20x)
Pilosebaceous units
The follicular unit consists of a group of hairs consisting of several terminal hairs (usually 1 to 4) occurring naturally on the scalp.[3] The average hairs per unit was the highest in the occipital areas (2.25 ± 1.57), followed by the frontal area (2.19 ± 1.59) and then the temporal area (2.08 ± 1.5). The average hair per unit in all areas combined was 2.17 ± 1.55. We found that the frontal area had the highest follicular unit density (96.04 ± 38.21/cm2), followed by the occipital area (94.76 ± 44.19/cm2) and the least in the temporal areas (79.24 ± 31.56/cm2).
We evaluated the percentage of single-hair, double-hair, and triple-hair units and follicular units with four or more hairs. Among them, the percentage of follicular units with single hair is the most important. The highest percentage of single-hair units was seen in the temporal areas (62.31% ± 10.35 vs 59.43% ± 11.71 in the occipital area vs 57.27% ± 10.67 in the frontal area) (P value < 0.05) [Table 2]. The highest percentage of double-hair units was seen in the frontal area (30.02% ± 7.23 vs 28.18% ± 6.89 in the occipital area vs 27.41% ± 6.86 in temporal areas) (P value > 0.05, not significant).
Table 2.
Percentage of 1 hair, 2 hair, 3 hair, and 4 hair follicular units (FU) in different areas of the scalp
| Areas of scalp | 1 hair FU (%) | 2 hair FU (%) | 3 hair FU (%) | 4 hair FU (%) |
|---|---|---|---|---|
| Frontal | 57.27 | 30.02 | 9.85 | 2.85 |
| Occipital | 59.43 | 28.18 | 9.33 | 3.00 |
| Temporal | 62.31 | 27.4 | 8.05 | 2.23 |
| Overall | 59.67 | 28.53 | 9.07 | 2.69 |
The mean percentage of follicular units with triple hairs in all areas in our patients was <10%. The presence of triple hair follicular units are considered a normal anatomic variation and can be observed in healthy individuals.
The mean percentage of follicular units with ≥4 hairs was <3% in all areas with the highest being in the occipital area. We found that the distribution of FU types in healthy Indian males was: One-hair FUs accounted for 59.67%, two-hair FUs accounted for 28.53%, three-hair FUs accounted for 9.07%, and four-hair FUs accounted for 2.69%.
Blood vessels
Two types of vascular patterns commonly observed were pinpoint-like vessels and arborizing vessels [Figures 4 and 5]. However, in a few volunteers, the vascular pattern could not be detected. The most commonly detected vascular pattern in all the areas was the pinpoint-like vessels, which was predominantly seen in the temporal areas (43.3%), followed by the occipital area (26.7%), and then the frontal area (22.5%). The arborizing type of vascular pattern was seen mainly in the temporal region (20%), followed by the occipital area (10.8%) and the frontal region (3.3%) [Table 3].
Figure 4.

Pinpoint pattern of blood vessels (Fotofinder II, polarized, 20x, red arrow)
Figure 5.
Arborizing pattern of blood vessels (Fotofinder II, polarized, 20x)
Table 3.
Cutaneous vasculature in different areas of the scalp
| Blood Vessels | Frontal | Temporal | Occipital | |||
|---|---|---|---|---|---|---|
|
|
|
|
||||
| Frequency | Percentage | Frequency | Percentage | Frequency | Percentage | |
| Not detected | 89 | 74.2 | 44 | 36.7 | 75 | 62.5 |
| Pinpoint-like vessels | 27 | 22.5 | 52 | 43.3 | 32 | 26.7 |
| Arborizing vessels | 4 | 3.3 | 24 | 20 | 13 | 10.8 |
| Total | 120 | 100 | 120 | 100 | 120 | 100 |
Yellow dots
In both the fields (20x and 70x), yellow dots were seen sparingly. But we found that the number of yellow dots was higher at 70x magnification when compared to lower magnification at 20x due to enhanced visualization of trichoscopic structures at higher magnifications. The highest number of yellow dots was seen in the temporal area under both magnifications.
Scalp scaling
The degree of scaling observed was divided into 0, no scaling; 1, mild scaling; 2, moderate scaling; 3, severe scaling. Mild degree of scaling was noticed maximally in frontal area (42.5%) followed by temporal (35%), and occipital areas (29.1%) [Figure 6].
Figure 6.

Moderate degree of scalp scaling seen (Fotofinder II, polarized, 20x)
Discussion
In this study, we recruited 120 healthy Indian males and examined the scalp using a Fotofinder II in an attempt to standardize the range of normal hair measurements. We found that the hair density was the highest in the frontal and occipital areas and the least in the temporal areas. This is in accordance with a study on healthy Han Chinese.[4] A study done on healthy Egyptian[5] males also found that the hair density was the highest in frontal and occipital areas and the least in the temporal areas. This finding supports the observation that in androgenetic alopecia (AGA), hair thinning is first noticed in the temporal area which has the least hair density.
In a study by Loussouarn,[6] which compared the hair densities among Asians, Caucasians, and Africans, he found that in Asians, the hair density was the highest in the frontal and occipital areas and the least in temporal areas; but in general, Caucasians had a higher hair density when compared to Asians and Africans. The mean hair density in our study was 146.6 ± 83.17/cm2, which was lower in comparison to studies done on Caucasians, Africans, and Koreans.[4,6,7] Studies done on Asian population have described a slightly higher mean hair density than that obtained in our study.[7,8] However, this could be explained by the fact that the age of our study subjects ranged from 18 to 50 years. This supports the findings from other previous studies, which have concluded that aging causes a reduction in the hair density and also that there is a significant diversity among hair density among various ethnicities [Table 4].
Table 4.
Comparison of hair parameters among various ethnic groups
| Parameters | Indians (Our Study) | Arabs[9] | Thai[8] | Egyptian[5] | Caucasian[6] | Chinese[4] |
|---|---|---|---|---|---|---|
| No of cases (Males) | 120 | 60 | 79 | 136 | 56 | 80 |
| Age range (years) | 18-50 | 18-60 | >18 | 18-38 | 28±5 | 20-70 |
| Mean Hair Density (/cm2) | 146.6±83.1 | 152.3±5 | 153.6±15.5 | 136±16.9 | 211±65 | 144.2±27.9 |
| Mean hair thickness (mm) | 0.1 | 0.08 | 0.08 | 0.07 | --- | --- |
In our study, the mean hair thickness was similar in all areas evaluated. The hair was however the thickest in the temporal and occipital areas when compared to the frontal area, although statistically significant differences were not detected. This is in accordance with a study on South Koreans.[7]
Hair thickness heterogeneity or anisotrichosis refers to the simultaneous presence of hairs of varying thicknesses. In AGA, anisotrichosis of >20% is considered to be a major diagnostic criterion and is useful in the intial diagnosis.[2] We observed anisotrichosis of >20% in the frontal region; however, it is difficult to say whether this is a typical feature seen in healthy individuals or if it is one of the early trichoscopic features of AGA even in individuals who do not have a history of hairloss/thinning. Therefore, more research in this area is required to support or contradict this observation.
The percentage of telogen hairs varies greatly in different ethnic groups and across all regions.[6,10] We found that the maximum percentage of telogen hairs was located in the frontal areas, followed by occipital and temporal areas in contrast to other studies,[6,10] which found a higher percentage of telogen hairs in temporal areas.
Our study found that among different scalp areas studied, the maximum proportion of single-hair units was seen in the temporal area, followed by occipital and frontal areas. The highest proportion of double-hair units was seen in the frontal area and then the occipital and temporal areas; in case of triple-hair units, the highest proportion was found in the occipital and frontal areas and finally the temporal regions, which is in concordance with a similar study.[5] But in contrast to our findings, Rakowska[11] concluded that the percentage of double-hair units was the highest in temporal areas, followed by frontal and then the occipital areas. In our study, we found that the average hair per unit was 2.17 ± 1.55 and it was the highest in the occipital area and the least in the temporal area, which is in accordance with a similar study on healthy Egyptian males.[5]
The follicular unit density/cm2 was the highest in the frontal and occipital areas (mean 94 units/cm2) and the least in the temporal area. The outcome of hair transplant surgeries is better when the scalp donor sites have more than 80 FUs/cm2.[12] The mean follicular unit density in our study was 87.32 units/cm2. This was more than that seen in the studies done on Chinese population.[4,13]
The number and pattern of cutaneous vasculature depend on the scalp area studied, the disease type, and activity.[14] In our study, we found two patterns of cutaneous microvasculature, the pin-point type, which was the most common (30.83%) in all the areas, and the arborizing type (11.38%), which was predominant in the temporal areas. We could not detect a vascular pattern in 57.8% of the subjects. This may be explained by the concept that all arborizing vessels were seen to blanch under pressure and hence may not have been visualized by the trichoscope.[14] Three characteristic vascular patterns have been described: interfollicular simple red loops, interfollicular twisted loops, and arborizing red lines.[15] Interfollicular simple red loops are seen best at higher magnifications (50x or more) and appear as multiple erythematous, fine, hair-pin-shaped structures which are regularly spaced. They appear as pinpoint red dots at lower magnifications.[15] Interfollicular twisted loops are visualized as dilated and tortuous capillaries and may help in differentiating scalp psoriasis from seborrheic dermatitis.[16] In healthy individuals, arborizing red lines are seen predominantly in the occipital and temporal areas.[11] This corresponds to the findings in our study.
Yellow dots on trichoscopy correspond to dilated follicular infundibulum plugged with keratin and/or sebum.[17] The finding of yellow dots is diagnostic of alopecia areata (AA) and is also seen in advanced stages of AGA. In AGA, yellow dots are predominantly found in the frontal area and can have an irregular size and distribution, and when compared to AA, yellow dots are less numerous in AGA. Our study found that yellow dots were more common in the temporal areas, in contrast to a study by Rakowska,[11] who reported the highest number of yellow dots in the frontal area. This may be because the yellow dots are difficult to identify in individuals with skin of colour and look like white dots.[18]
Limitations
TrichoScale analysis cannot recognize all gray/vellus hairs and can underestimate the total number of hairs by 10–20%. Studies[19] have demonstrated that results obtained from TrichoScale analysis can have a falsely elevated telogen hair percentage and that there is poor clinical correlation between the vellus hair percentage and hair thinning. A study done by Temel[20] found errors due to the presence of multiple hairs in follicular units, crossing hairs, overlapping and closeness of hairs, and variability in hair thickness throughout its length and has suggested that further optimization is required for TrichoScale analysis.
Conclusion
The interpretation of laboratory data depends on their comparison with normal reference values; however, in trichology, these reference values are incomplete or lacking sufficient data.[16] This study attempted to provide the normal comparable reference values in trichoscopy for healthy adult Indian males.
Conflicts of interest
There are no conflicts of interest.
Funding Statement
Nil.
References
- 1.Ummiti A, Priya PS, Chandravathi PL, Kumar CS. Correlation of Trichoscopic Findings in Androgenetic Alopecia and the Disease Severity. Int J Trichology. 2019;11:118–22. doi: 10.4103/ijt.ijt_103_17. [DOI] [PMC free article] [PubMed] [Google Scholar]
- 2.Kasumagic-Halilovic E. Trichoscopic Findings in Androgenetic Alopecia. Med Arch. 2021;75:109–11. doi: 10.5455/medarh.2021.75.109-111. [DOI] [PMC free article] [PubMed] [Google Scholar]
- 3.Zito PM, Raggio BS. In: StatPearls. Treasure Island (FL): StatPearls Publishing; 2023. Jan, Hair Transplantation. [Updated 2023 Feb 14] Available from: https://www.ncbi.nlm.nih.gov/books/NBK547740/# . [Google Scholar]
- 4.Guo ZH, Wang G, Miao Y, Fan ZX, Liu XM, Qu Q. The distribution of hair in Han Chinese. Plast Aesthet Res. 2017;4:150–4. [Google Scholar]
- 5.Abdel Hay R, Sayed KS, Hegazi SA, Nada A, Amer MA. Trichoscopic features of hair and scalp in noncomplaining individuals: A descriptive study. J Cosmet Dermatol. 2022;21:3934–42. doi: 10.1111/jocd.14694. [DOI] [PubMed] [Google Scholar]
- 6.Loussouarn G. Diversity of hair growth profiles. Int J Dermatol. 2005;44((Suppl 1)):6–9. doi: 10.1111/j.1365-4632.2005.02800.x. [DOI] [PubMed] [Google Scholar]
- 7.Kim JE, Lee JH, Choi KH, Lee W-S, Choi GS, Kwon OS, et al. Phototrichogram analysis of normal scalp hair characteristics with aging. Eur J Dermatol. 2013;23:849–56. doi: 10.1684/ejd.2013.2170. [DOI] [PubMed] [Google Scholar]
- 8.Leerunyakul K, Suchonwanit P. Evaluation of hair density and hair diameter in the adult Thai population using quantitative trichoscopic analysis. Biomed Res Int. 2020;2020:2476890. doi: 10.1155/2020/2476890. [DOI] [PMC free article] [PubMed] [Google Scholar]
- 9.Loussouarn G, Lozano I, Panhard S, Collaudin C, El Rawadi C, Genain G. Diversity in human hair growth, diameter, colour and shape. An in vivo study on young adults from 24 different ethnic groups observed in the five continents. Eur J Dermatol. 2016;26:144–54. doi: 10.1684/ejd.2015.2726. [DOI] [PubMed] [Google Scholar]
- 10.Alsharif SH, AlGhamdi KM. Evaluation of scalp hair density and diameter in the arab population: Clinical office-based phototrichogram analysis. Clin Cosmet Investig Dermatol. 2022;15:2737–43. doi: 10.2147/CCID.S394045. [DOI] [PMC free article] [PubMed] [Google Scholar]
- 11.Rakowska A. Trichoscopy (hair and scalp videodermoscopy) in the healthy female. Method standardization and norms for measurable parameters. J Dermatol Case Rep. 2009;3:14–9. doi: 10.3315/jdcr.2008.1021. [DOI] [PMC free article] [PubMed] [Google Scholar]
- 12.Bao Y, Wu K, Lin J, Chen Y, Wu W. Study on hair distribution in healthy males for hair restoration design. J Craniofac Surg. 2018;29:e785–90. doi: 10.1097/SCS.0000000000004765. [DOI] [PubMed] [Google Scholar]
- 13.Tsai RY, Lee SH, Chan HL. The distribution of follicular units in the Chinese scalp: Implications for reconstruction of natural-appearing hairlines in Orientals. Dermatol Surg. 2002;28:500–3. doi: 10.1046/j.1524-4725.2002.01194.x. [DOI] [PubMed] [Google Scholar]
- 14.Kłosowicz A, Alsalhi W, Tosti A. How to optimize trichoscopy for evaluation of scalp vessels. Skin Appendage Disord. 2020;6:216–9. doi: 10.1159/000508166. [DOI] [PMC free article] [PubMed] [Google Scholar]
- 15.Tosti A, Duque-Estrada B. Dermoscopy in hair disorders. J Egypt Womens Dermatol Soc. 2010;7:1–4. [Google Scholar]
- 16.Kim GW, Jung HJ, Ko HC, Kim MB, Lee WJ, Lee SJ, et al. Dermoscopy can be useful in differentiating scalp psoriasis from seborrhoeic dermatitis. Br J Dermatol. 2011;164:652–6. doi: 10.1111/j.1365-2133.2010.10180.x. [DOI] [PubMed] [Google Scholar]
- 17.Lima CDS, Lemes LR, Melo DF. Yellow dots in trichoscopy: Relevance, clinical significance and peculiarities. An Bras Dermatol. 2017;92:724–6. doi: 10.1590/abd1806-4841.20176157. [DOI] [PMC free article] [PubMed] [Google Scholar]
- 18.Ankad BS, Mukherjee S, Smitha SV. Trichoscopy in hair disorders in darker skin: An approach to diagnosis. Clin Dermatol Rev. 2020;4:102–14. [Google Scholar]
- 19.Van Neste D, Trueb RM. Critical study of hair growth analysis with computer- assisted methods. J Eur Acad Dermatol Venereol. 2006;20:578–83. doi: 10.1111/j.1468-3083.2006.01568.x. [DOI] [PubMed] [Google Scholar]
- 20.Bilgiç TA, Gülkesen KH, Dicle Ö. Automated digital image analysis (TrichoScan) in male patients with androgenetic alopecia; Comparison with manual marking of hairs on trichoscopic images. Skin Res Technol. 2018;24:515–6. doi: 10.1111/srt.12449. [DOI] [PubMed] [Google Scholar]