

Abstract
For sheet metals, anisotropy is a significant property affecting sheet metal forming processes. The anisotropy of sheet metals is caused by the rolling process, and several anisotropic constitutive models have been proposed under the non-associated flow rule to describe the deformation and stress anisotropies of sheet metals independently. However, most of them are based on yield functions that are only identified by the experimental data of orthogonal axes, or yield functions that are applicable to only the plane stress state. In this study, the yld2004-18p yield function, which can be used to analyze the three-dimensional stress state in multiple axes with high accuracy and acceptable identification cost, is used to develop a non-associated constitutive model and subsequently applied to sheet metal forming analysis. Finite element analysis results of circular cup drawing and hole expansion demonstrate the capability of the yld2004-18p-based non-associated constitutive model in more accurately describing both the deformation and stress anisotropies of sheet metals.
Keywords: Anisotropy, Non-associated flow rule, Constitutive model, Sheet metal forming, Finite element analysis
Subject terms: Computational methods; Applied mathematics; Design, synthesis and processing; Mechanical properties; Characterization and analytical techniques
Introduction
The anisotropy of metallic materials is affected by the manufacturing process. For sheet metals, the anisotropy is caused by the rolling process, where the developed rolling textures result in anisotropic R-values (deformation anisotropy) and anisotropic yield stresses (stress anisotropy) for rolled sheets. Anisotropy is known to have a significant effect on sheet metal forming processes. In the circular cup drawing process, ears appear on the cup after drawing due to the anisotropy1. In the circular blanking process, because of the anisotropy of sheet metals, the product becomes oval-shaped even though the punch is circular2. The effect of anisotropy is also demonstrated in the springback after unloading during the bending process3 and tension leveling4,5. Therefore, it is significant to consider the anisotropy of metallic materials when studying sheet metal forming processes to better predict the forming results. More accurate predictions can significantly contribute to the optimization of forming processes.
Various anisotropic yield functions have been proposed to capture these phenomena in sheet metal forming. The best-known function is the Hill48 yield function6, which is an extension of the von Mises yield function for isotropic bodies. The Hill48 yield function is in a quadratic form, and it is still one of the most widely used constitutive models in the field of sheet metal forming due to its convenience and user-friendliness for engineers and researchers7–11. The Hill79 yield function12, which is an extension of the Hill48 yield function to a non-quadratic form, is proposed to control the curvature of the yield surface. Barlat et al. developed an anisotropic yield criterion by incorporating an additional shear component to the Hosford yield function, which is also an extension of the Hill48 yield function to a non-quadratic form to control the curvature of the yield surface, and presented it as the yld91 yield function13. The conventional Hill48 yield function comprises two sets of anisotropic parameters, i.e., one for deformation anisotropy identified from R-values, and the other for stress anisotropy identified from yield stresses. Whereas the anisotropic parameters of the conventional Hill48 yield function can be identified using the R-values or yield stresses in different directions to describe either the deformation anisotropy or stress anisotropy, the anisotropic parameters of the yld91 yield function can only be identified from the directional yield stresses to describe the stress anisotropy; hence, the deformation anisotropy cannot be captured by the yld91 yield criterion. By contrast, the yld96 yield function14 is a generalization of the yld91 yield function and can simultaneously capture both deformation and stress anisotropy. However, the yld96 yield function is imperfect. One of its major problems is that it cannot guarantee the convexity of the yield surface at all times; Hence, the yld2000-2d yield function15, which is a yield function for the plane stress state, was proposed based on linear transformations to guarantee the convexity of the yield surface. Subsequently, the yld2004-18p yield function16 was proposed as an extension of the yld2000-2d yield function to the three-dimensional stress state. Both the yld2000-2d and yld2004-18p models have gained widespread application in the field of sheet metal forming due to their relatively high accuracy at an acceptable identification cost.
The abovementioned Hill and yld family anisotropic yield functions, as well as some recent polynomial-type anisotropic yield functions (e.g., those proposed by S. Soare17 and F. Yoshida18), were all proposed based on the associated flow rule; consequently, they have evolved into a complex formulation to capture multiaxial stress and deformation anisotropy in a single complex function. The plasticity theory is composed of 1) yield criterion or function, 2) flow rule, and 3) hardening rule. The plastic potential function  can be separated from the yield function
  in the flow rule to simplify the plasticity theory reasonably and is known as the non-associated flow rule. By developing a constitutive model using the non-associated flow rule that was then validated, Stoughton19 pioneered the use of the non-associated flow rule in sheet metal forming.
  et al. developed a non-associated constitutive model using the Hill48 yield function and the Karafilis–Boyce yield function to perform circular cup drawing analysis and obtained better results compared with using the associated flow rule20. Park and Chung constructed a material model using the yld2000-2d yield function based on the non-associated flow rule and performed a circular cup drawing analysis, from which the shape of six ears was predicted successfully21. Paulino and Yoon adopted Hill48 as the yield function and yld2000-2d as the plastic potential function under the non-associated flow rule to predict the cup height profile after mini-die drawing, and the eight ears observed experimentally were predicted correctly with higher computational efficiency compared to the non-associated yld2000-2d and associated yld2004-18p models22. Some recent analyses using the non-associated flow rule have been applied to not only circular cup drawing23, but also to hole expansion to predict the thinning behaviors of sheet metals24, to forming limit deformation to improve the forming limit curve prediction25, to deep drawing of channel sections to predict the springback behaviors26, as well as to tension leveling to predict the residual curvatures of leveled strips27. However, most of the non-associated constitutive models in sheet metal forming are based on yield functions such as Hill48, which are only identified by the experimental data of orthogonal axes, or yield functions such as yld2000-2d, which are applicable to only the plane stress state. In practice, under acceptable identification cost, choosing a constitutive model that describes the three-dimensional stress state can provide better prediction accuracy for sheet metal forming than models based on a plane stress state. For instance, many studies1,28–30 have demonstrated that the forming anisotropy prediction accuracy of the yld2004-18p model in a three-dimensional stress state is higher than that of the yld2000-2d model in a plane stress state. However, few studies have been conducted to reproduce the anisotropic behavior more accurately with three-dimensional stress state and acceptable identification cost using constitutive models involving the non-associated flow rule.
In this study, with the aim of developing a constitutive model that offers relatively higher accuracy while not increasing the identification cost, we used the yld2004-18p yield function, which can be used to analyze the three-dimensional stress state with the results of multiaxial experimental values, to develop a non-associated constitutive model and subsequently applied to sheet metal forming analysis. To evaluate the developed constitutive model, we performed a finite element (FE) analysis of the circular cup drawing and hole expansion, since sheet metals are subjected to deformation and loads in different directions, and the capability of the developed constitutive model in describing deformation and stress anisotropy can be verified easily by comparing the analysis and experimental results. Based on the circular cup drawing, the performance of the constitutive model in capturing deformation anisotropy can be obtained by comparing the predicted cup height with the experimental results. For hole expansion, the performance of the constitutive model in capturing both deformation and stress anisotropy can be evaluated more precisely by verifying the thinning behaviors of the expanded sheet metal.
Non-associated constitutive model based on yld2004-18p yield criterion
Plastic potential function and yield function
In plasticity theory, the plastic strain increment is defined using the flow rule as follows:
 |
1 |
where  is the plastic strain increment,
  is the Cauchy stress tensor,
  is the plastic potential function, and
  is the plastic multiplier. When the plastic potential function
  is the same as the yield function
  , Eq. (1) is known as the associated flow rule; otherwise, it is known as the non-associated flow rule. The yld2004-18p yield criterion16 shown below was adopted as the basic expression of the yield function
  and plastic potential function
  in this study to develop the non-associated constitutive model, as it can express both normal anisotropy and in-plane anisotropy for both stress and deformation with sufficient accuracy.
 |
2 |
Here,  and
and  are the principal values of
  and
and  , respectively;
  and
and  are linear transformations of the deviatoric stress tensor
  , expressed as
 |
3 |
where  and
and  are the anisotropic parameter matrices defined as
 |
4 |
Here,  (
( ) and
) and  (
( ) are anisotropic parameters of the yld2004-18p yield criterion. The deviatoric stress tensor
  is defined as
 |
5 |
where
 |
6 |
Accordingly, the equivalent stress of the yld2004-18p yield criterion can be defined as
| 7 |
Subsequently, the equivalent plastic strain can be calculated using the work conjugate rule as follows:
 |
8 |
Substituting Eqs. (1)–(8) yields the increment form of the equivalent plastic strain, as follows:
 |
9 |
Here, the plastic potential function  and yield function
  are both in the form of the yld2004-18p yield function as Eq. (7). However, the anisotropic parameters (components of
  and
and  in Eq. 4) are different, as discussed in the next section.
Parameter identification
The yld2004-18p function contains 18 anisotropy parameters (components of  and
and  in Eq. (4). The original yld2004-18p yield criterion was proposed under the associated flow rule; hence, the plastic potential function and the yield function are the same, and all the anisotropy parameters are identified by minimizing the following error function:
 |
10 |
where the superscript pr represents the predicted values of the directional yield stresses or R-values, and the superscript ex presents the experimental values of the directional yield stresses or R-values.  is the yield stress in the
  direction, and
  is the R-value in the
  direction.
  and
and  are the weight coefficients for the fitting of the yield stresses and R-values, respectively. The experimental values of the directional yield stresses and R-values are measured from tensile tests at
  ,
,  ,
,  ,
,  ,
,  ,
,  ,
,  from the rolling direction
 , and biaxial tensile tests
  . The predicted yield stress in the
  direction is obtained by substituting the corresponding stress state to Eq. (7) to calculate the equivalent stress, and the predicted R-value in the
  direction is expressed as
 |
11 |
The proof for Eq. (11) can be found in the first section of Methods. Because the stress and deformation anisotropies are described by a single function, which is the yield function under the associated flow rule, both the yield stresses and R-values are considered in this error function to identify the anisotropic parameters for the original yld2004-18p yield criterion under the associated flow rule. The recommended values of weight coefficients for the identification of stress anisotropy ( ) and deformation anisotropy (
 ) are 1.0, and 0.1, respectively16.
In this study, a constitutive model was developed under the non-associated flow rule to capture the stress and deformation anisotropies more flexibly; therefore, the two sets of anisotropic parameters can be identified independently for the yld2004-18p function when it is adopted as the yield function or the plastic potential function. For the yld2004-18p yield function and plastic potential function, the anisotropic parameters are identified by minimizing the error functions defined in Eqs. (12) and (13), respectively.
 |
12 |
 |
13 |
Only the yield stresses were adopted to identify the anisotropic parameters of the yield function to capture the stress anisotropy, whereas only the R-values were adopted to identify the anisotropic parameters of the plastic potential function to capture the deformation anisotropy. The gradient descent method was adopted to minimize the error functions mentioned above for the parameter identification of the yld2004-18p function under the associated or non-associated flow rule (the initial values of all parameters were set to 1.0 in the parameter identification).
Prediction of anisotropies
To validate the developed non-associated constitutive model based on the yld2004-18p yield criterion, the experimental data of two anisotropic sheet metals, i.e., AA2090-T3 (shown in Table 1) and DP980 (shown in Table 2), were adopted to identify the anisotropic parameters of the yld2004-18p function under the associated and non-associated flow rules to predict the stress and deformation anisotropies. The identified parameters of the yld2004-18p function for AA2090-T3 and DP980 are listed in Tables 3 and 4, respectively (the yld2004-18p function identified by both the directional yield stresses and R-values using Eq. (10) is referred to as yld2004-sr, the yld2004-18p function identified by directional yield stresses using Eq. (12) is referred to as yld2004-s, and the yld2004-18p function identified by directional R-values using Eq. (13) is referred to as yld2004-r).
Table 1.
Material properties of AA2090-T3 sheet.
| Material | AA2090-T3* |
|---|---|
| Sheet thickness (mm) | 1.60 |
| Young’s modulus (MPa) | 61,000 |
| Poisson’s ratio | 0.33 |
| Stress–strain curve (MPa) |  |
 Material properties of AA2090-T3 are reported in Yoon et al.31
Table 2.
Material properties of DP980 sheet.
| Material | DP980* | |||||||
|---|---|---|---|---|---|---|---|---|
| Sheet thickness (mm) | 1.20 | |||||||
| Young’s modulus (MPa) | 210,000 | |||||||
| Poisson’s ratio | 0.33 | |||||||
| Stress–strain curve (MPa) |  |
|||||||
| Normalized yield stresses |  |
 |
 |
 |
 |
 |
 |
 |
| 1.000 | 0.9906 | 0.9813 | 0.9915 | 1.0034 | 1.0178 | 1.0312 | 0.9860 | |
| R-values |  |
 |
 |
 |
 |
 |
 |
 |
| 0.6910 | 0.7600 | 0.8880 | 1.0500 | 1.0800 | 1.0200 | 0.9590 | 0.6976 |
 Material properties of DP980 are reported in Benchmark1 of NUMISHEET201832
Table 3.
Anisotropic parameters of yld2004-18p for AA2090-T3 sheet.
| yld2004-18p-sr | yld2004-18p-s | yld2004-18p-r | |
|---|---|---|---|
 |
 |
0.0569 |  |
 |
1.2086 | 0.9860 | 0.8729 |
 |
 |
0.1986 | 0.0788 |
 |
0.4198 | 0.9314 | 0.9801 |
 |
0.6058 | 0.5871 | 0.6396 |
 |
1.2442 | 1.3309 | 1.4167 |
 |
1.0560 | 0.9447 | 1.0768 |
 |
1.0891 | 1.0907 | 1.0690 |
 |
1.0938 | 1.0925 | 1.0237 |
 |
0.8930 | 1.0763 | 0.9362 |
 |
0.4520 | 0.4324 | 0.7828 |
 |
0.4569 | 0.6137 | 0.6837 |
 |
0.9206 | 0.9659 | 0.7782 |
 |
1.1227 | 1.1519 | 1.1211 |
 |
 |
 |
 |
 |
1.3167 | 1.4567 | 1.1683 |
 |
1.1660 | 1.1752 | 1.1471 |
 |
1.1210 | 1.1164 | 1.0516 |
| a | 8 | 8 | 8 |
Table 4.
Anisotropic parameters of yld2004-18p for DP980 sheet.
| yld2004-18p-sr | yld2004-18p-s | yld2004-18p-r | |
|---|---|---|---|
 |
0.9787 | 0.9822 | 0.9631 |
 |
1.0156 | 1.0162 | 1.0405 |
 |
0.9563 | 0.9729 | 0.9672 |
 |
0.9923 | 0.9937 | 0.9666 |
 |
1.0380 | 1.0254 | 1.0364 |
 |
0.9700 | 0.9846 | 0.9707 |
 |
1.0230 | 1.0119 | 1.0279 |
 |
1.0000 | 1.0000 | 1.0000 |
 |
1.0000 | 1.0000 | 1.0000 |
 |
0.9787 | 0.9821 | 0.9631 |
 |
1.0156 | 1.0163 | 1.0405 |
 |
0.9563 | 0.9731 | 0.9672 |
 |
0.9923 | 0.9937 | 0.9667 |
 |
1.0379 | 1.0255 | 1.0364 |
 |
0.9700 | 0.9845 | 0.9707 |
 |
1.0229 | 1.0117 | 1.0279 |
 |
1.0000 | 1.0000 | 1.0000 |
 |
1.0000 | 1.0000 | 1.0000 |
| a | 6 | 6 | 6 |
Using the identified anisotropic parameters of the yld2004-18p yield function under the associated or non-associated flow rule, the yield stresses and R-values of AA2090-T3 and DP980 at each angle from the rolling direction were calculated and compared with the experimental values (as shown in Figs. 1 and 2). For both AA2090-T3 and DP980, the material characterization data required to identify the anisotropic parameters of the associated and non-associated constitutive models based on the yld2004-18p yield criterion were the same. However, the constitutive model based on the non-associated flow rule fitted more accurately to the experimental data compared with that based on the associated flow rule. This indicates that the developed non-associated yld2004-18p constitutive model can improve the prediction accuracy for the deformation and stress anisotropies without increasing experimental cost compared with the associated yld2004-18p constitutive model. However, the number of parameters of the non-associated yld2004-18p constitutive model is 36, which is much more than the number of input experimental data used for parameter identification (totally 16 sets of experimental data as shown in Eqs. 12 and 13). The redundant parameters will raise an issue of uniqueness for the parameter identification (i.e. various sets of constitutive parameters that can fit the input experimental data may be obtained during the parameter identification).
Figure 1.

Experimental and predicted (a) yield stresses and (b) R-values of AA2090-T3.
Figure 2.

Experimental and predicted (a) yield stresses and (b) R-values of DP980.
However, as mentioned in the previous section, in the parameter identification, the initial values of all parameters were set to 1.0, and the gradient descent method was adopted to minimize the error functions. In this case, for both the AA2090-T3 and DP980, the identification procedure was robust, and the parameters listed in Tables 3 and 4 were the only ones can be obtained. For other initial values, the identified values of parameters may be different but all the input experimental data can be well-captured by the identified yield and plastic potential surfaces. This means that the orthotropic anisotropy, as well as the in-plane anisotropy at  increments can be well-captured by the calibrated non-associated yld2004-18p model even though the identified parameters may not be unique. Different sets of identified parameters do not cause different predictions of orthotropic anisotropy. They only cause slightly different in-plane anisotropy predictions at degree increments less than
  , which do not affect the prediction accuracy of in-plane anisotropy at
  increments. Some previous relatively simple yield functions do not have enough parameters to capture all the available anisotropies in stresses and R-values accurately, while this can be avoided by utilizing our proposed method. It is the redundant parameters of the developed non-associated yld2004-18p model that improve the prediction accuracy of the orthotropic anisotropy and in-plane anisotropy at
  increments because the parameter identification becomes more flexible considering the redundancy compared with the associated yld2004-18p model. Note that only 16 of the 18 parameters of the yld2004-18p function are independent as indicated by van den Boogaard et al.33, which makes the non-uniqueness problem during the parameter identification of the developed non-associated yld2004-18p model even less serious.
Applications
Numerical implementation
The developed non-associated constitutive model based on the yld2004-18p function was implemented in the Abaqus/Standard via a user-defined material (UMAT) subroutine using the convex cutting-plane algorithm34 (implementation details in the second section of Methods), which is a semi-implicit stress integration algorithm that can guarantee the work conjugate numerically. The Hill48 function, which remains one of the most widely used constitutive models in the field of sheet metal forming to date, was also implemented in the Abaqus/Standard via a UMAT subroutine as the yield or plastic potential function for later accuracy comparisons in this study. Note that the derivatives of Hill48 function were calculated analytically considering its relatively simple form, and the derivatives of yld2004-18p function were calculated numerically considering its relatively complex form. Usually R-value is often overestimated with a semi-implicit stress integration algorithm35. In this study, we carefully controlled the step increment size within 0.001 with the total time period of 1.0 in simulation to ensure the prediction accuracy of R-values. A one-element analysis was conducted to compare the predicted R-values with the analytical results for both the associated and non-associated yld2004-18p models (details in the third section of Methods, showing the prediction accuracy of R-values using convex cutting-plane algorithm). The static implicit FE analysis of the circular cup drawing for AA2090-T3 and hole expansion for DP980 was conducted using the UMAT to further evaluate the simulation accuracy of the developed yld2004-18p-based non-associated constitutive model in sheet metal forming analysis. For the circular cup drawing analysis, the simulation accuracy is evaluated by the cup height. For the hole expansion analysis, the simulation accuracy is evaluated by the thickness plastic strain. For comparison, the Hill48 function was adopted as the yield function or plastic potential function (Hill48 yield criterion with associated and non-associated flow rules, details in the fourth section of Methods) to simulate the circular cup drawing and hole expansion. Hereinafter, the yld2004-18p function and Hill48 function identified by directional yield stresses are referred to as yld2004-18p-s and Hill48-s, respectively; the yld2004-18p function and Hill48 function identified by directional R-values are referred to as yld2004-18p-r and Hill48-r, respectively; and the yld2004-18p function identified by both the directional yield stresses and R-values is referred to as yld2004-18p-sr.
Circular cup drawing test
The FE analysis of the circular cup drawing was performed under the experimental conditions reported by Yoon et al.31. A schematic view of the circular cup drawing test is shown in Fig. 3, and the experimental conditions are summarized in Table 5. One quarter of the cup was simulated considering the symmetry. The punch, holder, and die were modeled as analytical rigid bodies, and the blank was discretized using 7440 incompatible eight-node solid elements (62, 40, and 3 in the circumferential, radial, and thickness directions, respectively). Note that a case study was conducted to decide this mesh size considering both the calculation efficiency and accuracy.
Figure 3.
Schematic view of circular cup drawing.
Table 5.
Experimental conditions of circular cup drawing of AA2090-T3.
| AA2090-T3 | |
|---|---|
Punch diameter  (mm) (mm) |
97.46 |
Punch profile radius  (mm) (mm) |
12.70 |
Die opening diameter  (mm) (mm) |
101.48 |
Die profile radius  (mm) (mm) |
12.70 |
Blank diameter  (mm) (mm) |
158.76 |
| Blank-holder force (KN) | 22.2 |
| Friction coefficient | 0.1 |
The friction coefficient was set to 0.1 following the suggestions of Yoon et al31
The properties of the AA2090-T3 blank are listed in Table 1, and the Swift law was used to fit the stress–strain curve of the hardening law. The developed non-associated constitutive model based on the yld2004-18p yield criterion, as well as the original yld2004-18p yield criterion under the associated flow rule, were adopted to conduct the FE analysis of the circular cup drawing for the AA2090-T3 sheet using the UMAT subroutine in Abaqus/Standard (parameters listed in Table 3). For comparison, the Hill48 function was also adopted as the yield function or plastic potential function to simulate the circular cup drawing for the AA2090-T3 sheet (parameters listed in Table 8).
Table 8.
Anisotropic parameters of Hill48 for AA2090-T3 sheet.
| H | F | G | L, M, N | |
|---|---|---|---|---|
| Hill48-s | 0.6368 | 0.5703 | 0.3632 | 2.5711 |
| Hill48-r | 0.1746 | 0.2522 | 0.8254 | 2.2381 |
Figure 4 summarizes the cup height distributions obtained via experiment and FE analysis using the associated and non-associated Hill48 and yld2004-18p constitutive models, and the computation time of each model is listed in Table 6. It can be seen that for both the Hill48 and yld2004-18p yield criteria, the non-associated models yield higher computation time of circular cup drawing than the associated models. The yld2004-18p models do not take much more computation time than the Hill48 models, because the derivatives are calculated numerically for yld2004-18p function but analytically for Hill48 function during the numerical implementation as mentioned in the section Numerical implementation. As for the results of the associated and non-associated constitutive models based on the Hill48 function, none of the models based on the associated flow rule (associated Hill48-r and associated Hill48-s) can reproduce the ear around  that occurred in the experiment, while the constitutive model based on the non-associated flow rule (non-associated Hill48) reproduced a small amount of ear around
  . As for the constitutive models using the yld2004-18p function under the associated or non-associated flow rule, both models can reproduce the ear around
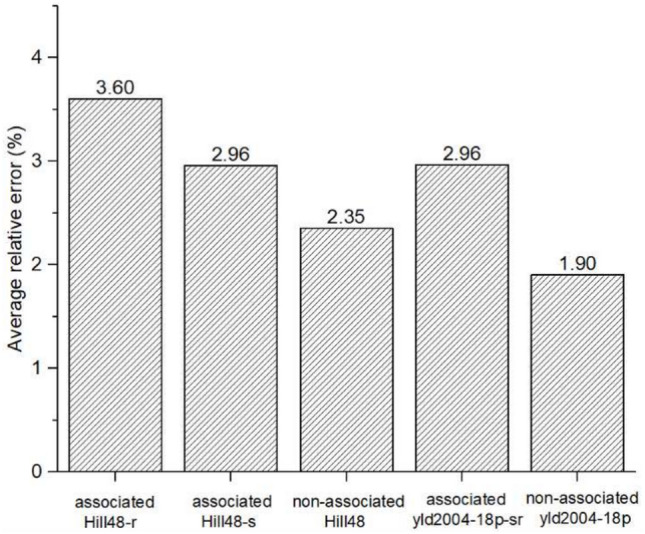
  , while the overall predicted cup height, particularly the ear peak, obtained by the non-associated flow rule (non-associated yld2004-18p) was closer to the experimental values than obtained by the associated flow rule (associated yld2004-18p-sr). Figure 5 shows the average relative error of the predicted cup heights of each model for all measured positions. The average relative error of the predicted cup heights for all measured positions is defined as
 |
14 |
where  is the cup height at the measured position i, and N is the total number of all measured positions. The superscript pr and ex represent the predicted and experimental cup heights, respectively. It can be seen that the non-associated constitutive models can yield better predictions than the associated constitutive models, and the developed yld2004-18p-based non-associated constitutive model yields the best prediction. However, the peak position of the ear obtained by the yld2004-18p-based non-associated constitutive model was
  , whereas the experimental value was at
  . The yld2004-18p function used the results of uniaxial tensile tests at
  increments from the rolling direction to the transverse direction to identify the anisotropic parameters. Therefore, it cannot yield accurate predictions for the directions appearing between the
  and
and  . This characteristic of the yld2004-18p function leads to the difference between the predicted and experimental peak positions. Note that although the associated Hill48-s and associated yld2004-18p-sr constitutive models yield the same average relative errors, the associated Hill48-s constitutive model cannot predict the small ear around
  while the associated yld2004-18p-sr constitutive model can do. The higher prediction accuracy of associated yld2004-18p-sr constitutive model is benefited from its more characterization data.
Figure 4.

Cup heights obtained from experiment and Hill48-based and yld2004-18p-based associated and non-associated constitutive models.
Table 6.
Computation time of each model for circular cup drawing simulation of AA2090-T3.
| Model | Computation time |
|---|---|
| associated Hill48-r | 6,254 s |
| associated Hill48-s | 6,439 s |
| non-associated Hill48 | 11,519 s |
| associated yld2004-18p-sr | 10,283 s |
| non-associated yld2004-18p | 13,009 s |
(CPU clock speed: 2.90 GHz; Number of cores per CPU: 4; Number of CPUs: 1; Main memory: 8 GB; Operating system: Windows 10)
Figure 5.
Average relative error of predicted cup heights of associated and non-associated Hill48 and yld2004-18p constitutive models for all measured positions.
Both the deformation and stress anisotropies can affect the earing in drawing test36. To evaluate the effect of deformation anisotropy and stress anisotropy in this circular cup drawing test, the Hill48 function and yld2004-18p function were adopted as the yield function or plastic potential function under the non-associated flow rule to conduct the FE analysis. Figure 6 summarizes the cup height distributions predicted by the non-associated constitutive models based on the Hill48 function and yld2004-18p function. As shown, the distributions of cup heights predicted by the same plastic potential function were similar. In other words, it can be concluded that the selection of the plastic potential function contributed more to the predicted cup height in the circular cup drawing than the yield function under the non-associated flow rule, and that the deformation anisotropy is the dominant factor affecting the cup height.
Figure 6.

Cup heights obtained from experiment and non-associated constitutive models based on Hill48 function and yld2004-18p function.
Hole expansion test
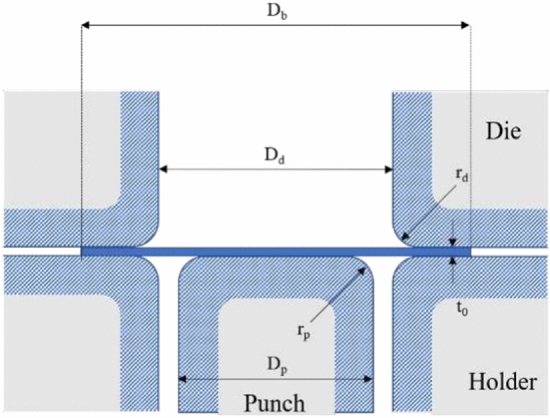
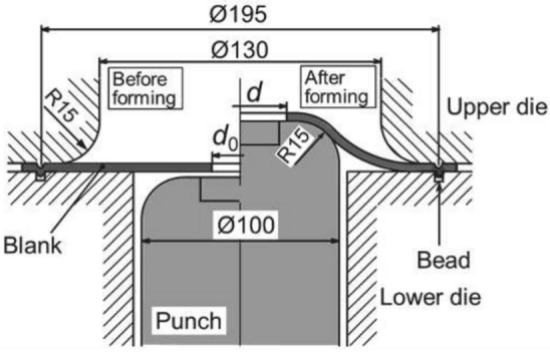
An FE analysis of the hole expansion test for the DP980 sheet was conducted. The hole expansion test was performed as the Benchmark 1 at NUMISHEET 201832. A schematic view of the hole expansion test and tool dimensions is shown in Fig. 7, and the initial diameter of the blank hole was 30 mm. One-quarter of the blank was simulated considering the symmetry. The punch and upper and lower dies were modeled as analytical rigid bodies, and the blank was discretized by 6480 incompatible eight-node solid elements (40, 43, and 3 in the circumferential, radial, and thickness directions, respectively). Note that a case study was conducted to decide this mesh size considering both the calculation efficiency and accuracy. The friction coefficient between the blank and the punch was set to 0.1. For the other contacts, the friction coefficient was set to 0.15.
Figure 7.
Schematic view of hole expansion test and tool dimensions.
The material properties of the DP980 blank are summarized in Table 2, and the Kim–Tuan equation37 was used to fit the stress–strain curve of the hardening law. The developed non-associated constitutive model based on the yld2004-18p yield criterion, as well as the original yld2004-18p yield criterion under the associated flow rule, were adopted to conduct the FE analysis of hole expansion for the DP980 sheet using the UMAT subroutine in Abaqus/Standard (parameters listed in Table 4). As in the circular cup drawing analysis, the Hill48 function was adopted as the yield function or plastic potential function to conduct the FE analysis such that a comparison can be performed (parameters listed in Table 9). Note that the bead constraint shown in Fig. 7 was substituted by the full constraint at the outer edge of the blank in the FE analysis. However, in the experiment, it was discovered that the thickness reduction of the expanded blank was suppressed by the inflow of material from the bead. Therefore, the thickness reductions obtained from the FE analysis were generally larger than the experimental results38. If additional materials can flow through the bead, the overall thickness reductions can be affected. When comparing the present analysis with the experimental data to evaluate the capability of each constitutive model, it is preferable to compare the shapes of the thickness plastic strain distributions instead of the exact values, because the errors of exact values can be brought by the FE modeling that cannot consider the inflow of material from the bead. In both the experiment and simulation, the thickness plastic strain at each specified location is calculated using the measured thickness before and after deformation.
Table 9.
Anisotropic parameters of Hill48 for DP980 sheet.
| H | F | G | L, M, N | |
|---|---|---|---|---|
| Hill48-s | 0.4559 | 0.4845 | 0.5441 | 1.5201 |
| Hill48-r | 0.4086 | 0.4261 | 0.5914 | 1.5771 |
Figure 8 summarizes the distribution of the thickness plastic strain in three radial directions:  (rolling direction),
  (diagonal direction), and
  (transverse direction) from the rolling direction, when the punch stroke reached 15 mm for the Hill48-based and yld-2004-18p-based constitutive models under the associated or non-associated flow rule. It can be seen that all of the Hill48-based and yld2004-18p-based associated and non-associated models shown in Fig. 8 can predict the radial thinning behavior of the rolling, diagonal, and transverse directions in the hole expansion test correctly, because the tensile tests in these three directions were used to calibrate the Hill48 and yld2004-18p functions. While the associated yld2004-18p constitutive model yields the best predicted shape of the thickness plastic strain distribution in the rolling direction, the non-associated yld2004-18p constitutive model yields the best predictions in the diagonal and transverse directions. The computation time of each model is listed in Table 7, and it can be seen that for both the Hill48 and yld2004-18p yield criteria, the non-associated models yield higher computation time of hole expansion than the associated models. Similar to the circular cup drawing simulations, the yld2004-18p models do not take much more computation time than the Hill48 models, because the derivatives are calculated numerically for yld2004-18p function, but analytically for Hill48 function during the numerical implementation as mentioned in the section Numerical implementation.
Figure 8.

Distribution of thickness plastic strain in (a)  , (b)
, (b)  , and (c)
  from rolling direction for Hill48-based and yld-2004-18p-based associated and non-associated constitutive models when punch stroke reached 15 mm.
Table 7.
Computation time of each model for hole expansion simulation of DP980.
| Model | Computation time (s) |
|---|---|
| Associated Hill48-r | 7214 |
| Associated Hill48-s | 6985 |
| Non-associated Hill48 | 8027 |
| Associated yld2004-18p-sr | 7963 |
| Non-associated yld2004-18p | 8315 |
(CPU clock speed: 2.90 GHz; Number of cores per CPU: 4; Number of CPUs: 1; Main memory: 8 GB; Operating system: Windows 10)
Figure 9 shows the thickness plastic strain in the circumference direction at 2 mm from the hole edge when the punch stroke reached 15 mm for the Hill48-based and yld-2004-18p-based constitutive models under the associated or non-associated flow rule. As shown, the positions of the peaks and troughs obtained by all the Hill48-based and yld2004-18p-based associated constitutive models were opposite to those obtained from the experimental values, indicating that the circumferential thinning behaviors in the hole expansion test could not be predicted correctly by the constitutive model under the associated flow rule. The developed non-associated yld2004-18p constitutive model overcame this shortcoming of the associated yld2004-18p constitutive model and yielded the best prediction for the circumferential thinning behaviors (shape of the thickness plastic strain distribution in the circumference direction). It is worth mentioning that by adjusting the weight coefficient of the error function (Eq. 10) for a certain direction (e.g.  ), the predictive stress and R-value results of the associated yld2004-18p model in corresponding direction may be improved while results in other directions deteriorate. However, we cannot know which direction has the most significant effect on the desired sheet metal forming result before we conduct the experiment and relevant numerical case studies, which is another issue deviating from the main purpose of this work. In this study, we adopted the widely used parameter identification method for the associated yld2004-18p model to evaluate its prediction ability for sheet metal forming.
Figure 9.
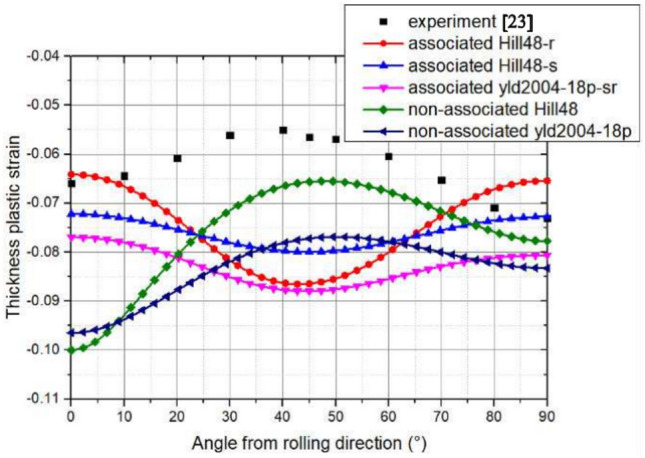
Distribution of thickness plastic strain in circumference direction at 2 mm from hole edge obtained Hill48-based and yld-2004-18p-based associated and non-associated constitutive models when punch stroke reached 15 mm.
To evaluate the effect of deformation anisotropy and stress anisotropy in this hole expansion test, the Hill48 function and yld2004-18p function were adopted as the yield function or plastic potential function under the non-associated flow rule to conduct the FE analysis. Figure 10 summarizes the thickness strain distributions predicted by different non-associated constitutive models based on the Hill48 function and yld2004-18p function. As shown, stress anisotropy (selection of yield function) dominated because the thickness plastic strain distributions obtained by the constitutive models with the same yield function exhibited similar shapes, whereas the constitutive models with different yield functions exhibited different shapes.
Figure 10.
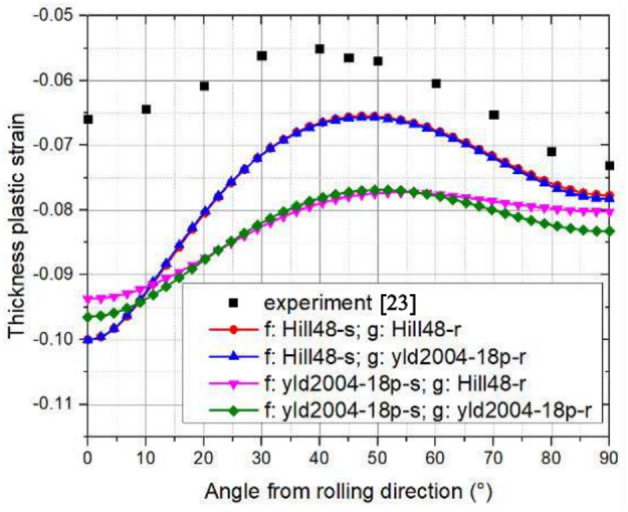
Distribution of thickness plastic strain in circumference direction at 2 mm from hole edge obtained from experiment and non-associated constitutive models based on Hill48 function and yld2004-18p function when punch stroke reached 15 mm.
However, different plastic potential functions can also yield different results when the same function is selected as the yield function, as exemplified in Fig. 11. As shown, even though yld2004-18p-s was selected as the yield function for all models, the thickness strain distribution in the circumferential direction varied depending on the plastic potential function, indicating that the effect of the plastic potential cannot be disregarded. When yld2004-18p-s is selected as the plastic potential function to describe the deformation anisotropy, the thickness strain distribution in the circumferential direction is incorrect because the R-values are not considered in yld2004-18p-s. For the other models shown in Fig. 11, because the R-values are considered in the plastic potential function, the positions of the peaks and troughs of the thickness strain distribution in the circumferential direction are similar to the experimental results. Therefore, by comparing the shapes of the thickness plastic strain distributions instead of the exact values in Figs. 10 and 11, it can be concluded that the correct strain distribution trends in the circumferential direction cannot be obtained unless both the stress anisotropy (selection of yield function) and deformation anisotropy (selection of plastic potential function) are correctly described.
Figure 11.
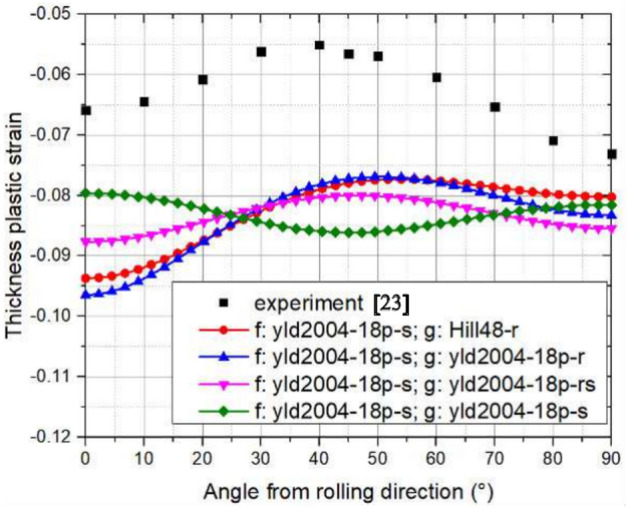
Distribution of thickness plastic strain in circumference direction at 2 mm from hole edge obtained using yld2004-18p-s yield function and different plastic potential functions when punch stroke reached 15 mm.
Figure 12 visualizes the thickness plastic strain distribution when the punch stroke reached 20 mm. In the experiment, fracture occurred at 8 mm from the edge of the hole in the rolling direction when the punch stroke reached  mm. Because the fracture law is not applied in this FE analysis, if we assume that the fracture occurs at the location where the plastic strain in the thickness direction is the lowest when the punch stroke reaches 20 mm, then it can be assumed that the fracture occurs at
  from the rolling direction in all the Hill48-based and yld2004-18p-based associated constitutive models. By contrast, both the Hill48-based and yld2004-18p-based non-associated constitutive models successfully predicted the fracture occurs at the rolling direction. While the non-associated Hill48 constitutive model predicted the location of the fracture at approximately 5 mm from the hole edge, the developed non-associated yld2004-18p constitutive model predicted the location of the fracture at approximately 6 mm from the hole edge, which was closer to the experimental result.
Figure 12.

Distribution of thickness plastic strain when punch stroke reached 20 mm for (a) associated Hill48-r, (b) associated Hill48-s, (c) associated yld2004-18p-sr, (d) non-associated Hill48, and (e) non-associated yld2004-18p constitutive models.
Discussions
The validity of using the yld2004-18p yield criterion based on the non-associated flow rule is discussed in this section. Stoughton and Yoon derived the four stability conditions of the material model for sheet metal forming39, and the readers can refer to their paper for details. It is well understood that the associated flow rule models can guarantee the stability conditions. However, a non-associated flow rule model may lead to negative plastic work under some conditions, which cannot meet the stability requirements. Hence, we first discuss whether the plastic work is positive. This is the condition in which the amount of work generated by plastic deformation is always greater than zero. The work generated by plastic deformation can be expressed as follows:
 |
15 |
Substituting Eq. (1) into Eq. (15) yields
 |
16 |
If the plastic potential function  is a linear homogeneous function with respect to the Cauchy stress tensor
  , then from Euler’s homogeneous function theorem, the plastic work can be expressed as
 |
17 |
Because  is greater than or equal to zero,
  , and the requirement of positive plastic work is satisfied. The original yld2004-18p yield function under the associated flow rule is a linear homogeneous function with respect to the Cauchy stress tensor
  , and we applied it to the non-associated flow rule using independent anisotropic parameters for the yield function and plastic potential function, which does not affect the property of the yld2004-18p function; therefore, we can confirm that the positive plastic work is guaranteed when the yld2004-18p function is used as the plastic potential function under the non-associated flow rule.
Next, we discuss the incompressibility of plastic deformation. Hydrostatic stress contributes to volume change, whereas deviatoric stress, which is the Cauchy stress minus the hydrostatic stress, contributes to plastic deformation. Therefore, to satisfy volume invariance due to plastic deformation, the deviatoric stress must be used to define the plastic potential function. The derivative of the yld2004-18p function when it is adopted as the plastic potential function with respect to the Cauchy stress tensor, can be expressed by the chain rule as follows:
| 18 |
From the definition of the deviatoric stress tensor  in Eq. (5), the following equation is satisfied:
 |
19 |
Substituting Eq. (19) into Eq. (18) yields
 |
20 |
This proves that the sum of the plastic strain increments in the x, y, and z directions is zero; hence, the incompressibility of plastic deformation is satisfied when the yld2004-18p function is used as the plastic potential function regardless of the flow rule.
Regarding the convexity of the non-associated yld2004-18p yield criterion, a function is convex if its Hessian matrix is positive semi-definite with respect to its independent variables, and the convexity can be preserved from the principal reference frame to any other transformed reference frame. For both the yield function and plastic potential function of the non-associated yld2004-18p yield criterion, they are all in the yld2004-18p function form, and the convexity of the yld2004-18p function has been proven by Barlat et al.16. Hence, the convexity of the non-associated yld2004-18p yield criterion can be guaranteed.
Although the validity of using yld2004-18p as a plastic potential function based on the non-associated flow law is discussed above, we cannot assert that the non-associated flow rule is strictly theoretically correct in sheet metal forming. However, the FE analysis results obtained using the developed yld2004-18p-based non-associated constitutive model in this study for the circular cup drawing and hole expansion tests were similar to the experimental values, and some experimental observations also indicated that the plastic potential was non-associated under certain conditions40. Moreover, the circumferential thinning behaviors in the hole expansion test were successfully predicted, unlike using the associated constitutive models. This indicates the high analytical accuracy of the developed non-associated constitutive model based on the yld2004-18p yield criterion. However, compared with the associated constitutive model, adopting the non-associated constitutive model in FE analysis will increase the computation time, as shown in Tables 6 and 7. This is because the material stiffness matrix of the non-associated constitutive model is unsymmetric (the option “Use unsymmetric material stiffness matrix” should be checked when defining the material behaviors in Abaqus). Unlike the associated constitutive model, whose material stiffness matrix is symmetric, the material stiffness matrix of non-associated constitutive model should be fully saved during the FE analysis, which leads to lower calculation efficiency.
Another crucial issue worthy of discussion is the balance between the accuracy of the constitutive model and the model identification cost. The main improvement in accuracy of the non-associated yld2004-18p model presented in this study is compared to the original associated yld2004-18p model. This accuracy improvement is achieved without increasing the identification cost, which is one of the key significances of this work. In recent years, numerous constitutive models based on neural networks have been proposed, which offer further improvements in accuracy compared to traditional advanced constitutive models that rely on complex constitutive equations41. However, these neural network-based constitutive models require extensive identification data for training, and the high identification cost currently hinders their practical application despite their superior accuracy. Therefore, balancing model accuracy with identification cost, which is an important aspect of user-friendliness, has become a critical topic in current research on constitutive models. Both academia and industry place significant importance on the user-friendliness of constitutive models and have undertaken corresponding research and efforts (e.g., those proposed by Yoshida18 and Abspoel42). This study aims to find the balance between accuracy and cost, offering a non-associated yld2004-18p model that is convenient to implement widely and achieves improvement in accuracy compared to the associated yld2004-18p.
Conclusions
Based on the non-associated flow rule, a constitutive model was developed using the yld2004-18p yield function, whose anisotropic parameters were identified from directional yield stresses, and the yld2004-18p plastic potential function, whose anisotropic parameters were identified from directional R-values. The developed non-associated constitutive model was implemented into the Abaqus/standard via the UMAT subroutine to conduct FE analyses of circular cup drawing and hole expansion to evaluate its capability in capturing stress and deformation anisotropies. In the circular cup drawing analysis, the cup height predicted by the developed non-associated yld2004-18p constitutive model was more similar to the experimental result, as compared with those by the constitutive models based on the Hill48 function and yld2004-18p function under the associated flow rule, as well as that by the constitutive model based on the Hill48 function under the non-associated flow rule. In the hole expansion test analysis, the thickness plastic strain distribution in the circumferential direction could not be predicted correctly by the constitutive models based on the associated flow rule; however, the developed yld2004-18p-based non-associated constitutive model predicted the trend successfully. The positive plastic work, the incompressibility of plastic deformation, and the convexity of the yield criterion were guaranteed in the developed non-associated constitutive model based on the yld2004-18p function. The FE analysis results of the circular cup drawing and hole expansion tests demonstrated the practicability of the non-associated yld2004-18p constitutive model developed in this study without increasing the identification cost compared to the associated yld2004-18p constitutive model. In future studies, the developed model can be further improved by considering more sheet metal behaviors (e.g., the anisotropic hardening, Bauschinger effect, fracture criterion), and more identification data (e.g., stresses in normal and shear planes). Considering more sheet metal behaviors with more identification data may further improve the simulation accuracy43, but it is also crucial to strike a balance between model accuracy and identification cost when developing constitutive models for practical applications. An optimal approach ensures the developed constitutive model is both sufficiently accurate and user-friendly.
Methods
A proof for Eq. (11)
As per R. Hill’s monograph “The Mathematical Theory of Plasticity” (Chapter 12)44, we have the following equation to calculate the R-values in the  direction:
 |
21 |
Considering the non-associated flow rule we used and the plastic incompressibility, we have
 |
22 |
 |
23 |
 |
24 |
 |
25 |
Substituting Eqs. (22), (23), (24), and (25) to Eq. (21), then Eq. (11) in the manuscript can be obtained.
Convex cutting-plane algorithm for implementation of constitutive model
The convex cutting-plane algorithm is one of the elastic-plastic operator split methods that contains two steps. In the first step, the total strain increment  is assumed to be fully elastic and the trial stress
  is calculated using Eq. (26). The yield criterion F is given by Eq. (27).
 |
26 |
 |
27 |
where the superscript n denotes the nth step of the stress integration, the subscript k denotes the iteration number of the nth step of the stress integration (k=0 denotes initial state),  represents the elastic stiffness tensor,
  represents the flow stress calculated by hardening rule. If
  , the trial stress
  is located inside or on the yield surface (the total strain increment
  is fully elastic), and the
  th step of stress integration can be conducted. If
  , the trial stress
  is located outside the yield surface (plastic strain occurs), and the second step called plastic corrector is conducted to bring back the stress onto the yield surface using Newton–Raphson iteration scheme.
Transform the yield criterion F using the Newton–Raphson method with respect to the plastic multiplier gives
 |
28 |
According to the chain rule,
 |
29 |
Substituting Eq. (29)–(28) gives
 |
30 |
where  ,
,  ,
,  , and
, and  .
.
Finally, the incremental change of the plastic multiplier in the kth iteration of the  th stress integration is given by
 |
31 |
The stress and strain are updated as follows during the iterative calculation until convergence.
 |
32 |
 |
33 |
One-element analysis for R-value prediction using convex cutting-plane algorithm
The static implicit FE analysis using one-element (1 mm 1 mm
1 mm 1 mm, incompatible eight-node solid element) was conducted to evaluate the R-value prediction ability of the convex cutting-plane algorithm for the associated and non-associated yld2004-18p models. The material parameters of AA2090-T3 were used for the analysis (listed in Table 3), and the step increment size in the simulation was controlled within 0.001 with the total time period of 1.0. The predicted and analytical R-values are compared in Fig. 13, showing the R-value prediction accuracy of the stress integration algorithm in this study.
Figure 13.

Comparison of predicted and analytical R-values for AA2090-T3 in one-element analysis of (a) associated yld2004-18p and (b) non-associated yld2004-18p models.
Hill48 yield criterion under associated or non-associated flow rule
The Hill48 yield criterion is expressed as
 |
34 |
Under the associated flow rule, the yield function and plastic potential function based on the Hill48 yield criterion are the same, as shown below:
 |
35 |
The anisotropic parameters can then be identified using either directional R-values obtained from Eq. (36) to capture the deformation anisotropy (referred to as Hill48-r), or directional yield stresses obtained by Eq. (37) to capture the stress anisotropy (referred to as Hill48-s).
 |
36a |
 |
36b |
 |
36c |
 |
36d |
 |
37a |
 |
37b |
 |
37c |
 |
37d |
For the Hill48 yield criterion under the non-associated flow rule, the anisotropic parameters of the yield function and plastic potential function are independent. The parameters of the Hill48 yield function are identified using Eq. (36) with the directional yield stresses, and the parameters of the Hill48 plastic potential function are identified using Eq. (37) with directional R values.
Acknowledgements
This work was supported by the Special Fund for Rural Revitalization of Guangdong Province (2025TS-1-2); National Key Researchand Development Program (2022YFD2002203); the Innovation Fund of Guangdong Academy of Agricultural Sciences (No. 202104); the Youth Training Program of Guangdong Academy of Agricultural Sciences (No. R2020QD-061); the International Cooperation Project of Guangdong Province (No. KY-202301); the Innovation Fund Industry Special Project of Guangdong Academy of Agricultural Science (Grant No. 202306).
Author contributions
Conceptualization, H.W.; methodology, H.W.; software, H.W. and A.Y.; investigation, H.W.; writing—original draft preparation, H.W.; writing—review and editing, H.W., C.F., S.X., G.Q., X.L. and J.Y.; methodology-advising, C.F.; supervision, J.Y.; funding acquisition, S.X. All authors have read and agreed to the published version of the manuscript.
Data Availability
The datasets used and analyzed during the current study are available from the corresponding author upon reasonable request.
Declarations
Conflict of interest
The authors declare no conflict of interest.
Footnotes
Publisher’s note
Springer Nature remains neutral with regard to jurisdictional claims in published maps and institutional affiliations.
Contributor Information
Changxiang Fan, Email: fanchangxiang@gdaas.cn.
Sai Xu, Email: xusai@gdaas.cn.
References
- 1.Tang, B. & Lou, Y. Effect of anisotropic yield functions on the accuracy of material flow and its experimental verification. Acta Mech. Solida Sin.32, 50–68 (2019). [Google Scholar]
- 2.Matsunaga, T., Kawabe, T. & Mizugaki, Y. Dimensional change of product and oval shape prediction modelin circular blanking. J. Jpn. Soc. Technol. Plast.53, 49–53 (2012). [Google Scholar]
- 3.Sumikawa, S., Ishiwatari, A., Hiramoto, J. & Urabe, T. Improvement of springback prediction accuracy using material model considering elastoplastic anisotropy and bauschinger effect. J. Mater. Process. Technol.230, 1–7 (2016). [Google Scholar]
- 4.Wang, H., Wu, B., Higuchi, T. & Yanagimoto, J. Tension leveling using finite element analysis with different constitutive relations. ISIJ Int.60, 1273–1283 (2020). [Google Scholar]
- 5.Wang, H. et al. Effects of yield point and plastic anisotropy on results of elastic-plastic finite element analysis of tension leveling. J. Braz. Soc. Mech. Sci. Eng.44, 319. 10.1007/s40430-022-03588-7 (2022). [Google Scholar]
- 6.Hill, R. A theory of the yielding and plastic flow of anisotropic metals. Proc. R. Soc. Lond. Ser. A. Math. Phys. Sci.193, 281–297 (1948). [Google Scholar]
- 7.Béres, G. J. et al. An extended stress-based forming limit diagram focusing on the wrinkling phenomenon and the effect of the normal pressure on clamped surfaces. J. Mater. Process. Technol.322, 118196 (2023). [Google Scholar]
- 8.Hajiahmadi, S., Naeini, H. M., Talebi-Ghadikolaee, H., Safdarian, R. & Zeinolabedin-Beygi, A. Effect of anisotropy on spring-back of pre-punched profiles in cold roll forming process: An experimental and numerical investigation. Int. J. Adv. Manuf. Technol.129, 3965–3978 (2023). [Google Scholar]
- 9.Said, L. B., Mars, J., Wali, M. & Dammak, F. Effects of the tool path strategies on incremental sheet metal forming process. Mech. Ind.17, 411 (2016). [Google Scholar]
- 10.Dewangan, Y. K., Gupta, A., Bandyopadhyay, K., Faye, A. & Lee, M.-G. Incorporation of anisotropy for the failure prediction of aa6061 during spif process. Int. J. Adv. Manuf. Technol. 1–18 (2024).
- 11.Wang, H. et al. Numerical analysis on failure of sheet metals with non-ordinary state-based peridynamics. Eng. Fract. Mech.292, 109652 (2023). [Google Scholar]
- 12.Hill, R. Theoretical plasticity of textured aggregates. In Mathematical Proceedings of the Cambridge Philosophical Society, vol. 85, 179–191 (Cambridge University Press, 1979).
- 13.Barlat, F., Lege, D. J. & Brem, J. C. A six-component yield function for anisotropic materials. Int. J. Plast.7, 693–712 (1991). [Google Scholar]
- 14.Barlat, F. et al. Yielding description for solution strengthened aluminum alloys. Int. J. Plast.13, 385–401 (1997). [Google Scholar]
- 15.Barlat, F. et al. Plane stress yield function for aluminum alloy sheets-part 1: Theory. Int. J. Plast.19, 1297–1319 (2003). [Google Scholar]
- 16.Barlat, F. et al. Linear transfomation-based anisotropic yield functions. Int. J. Plast.21, 1009–1039 (2005). [Google Scholar]
- 17.Soare, S., Yoon, J. W. & Cazacu, O. On the use of homogeneous polynomials to develop anisotropic yield functions with applications to sheet forming. Int. J. Plast.24, 915–944 (2008). [Google Scholar]
- 18.Yoshida, F., Hamasaki, H. & Uemori, T. A user-friendly 3d yield function to describe anisotropy of steel sheets. Int. J. Plast.45, 119–139 (2013). [Google Scholar]
- 19.Stoughton, T. B. A non-associated flow rule for sheet metal forming. Int. J. Plast.18, 687–714 (2002). [Google Scholar]
- 20.Cvitanić, V., Vlak, F. & Lozina, Ž. A finite element formulation based on non-associated plasticity for sheet metal forming. Int. J. Plast.24, 646–687 (2008). [Google Scholar]
- 21.Park, T. & Chung, K. Non-associated flow rule with symmetric stiffness modulus for isotropic-kinematic hardening and its application for earing in circular cup drawing. Int. J. Solids Struct.49, 3582–3593 (2012). [Google Scholar]
- 22.Paulino, M. & Yoon, J. W. Study on yield function and plastic potential under non-associated flow for accurate earing prediction in cup drawing. Steel Res. Int.86, 852–860. 10.1002/srin.201400566 (2015). [Google Scholar]
- 23.Džoja, M., Cvitanić, V., Safaei, M. & Krstulović-Opara, L. Modelling the plastic anisotropy evolution of aa5754-h22 sheet and implementation in predicting cylindrical cup drawing process. Eur. J. Mech.-A/Solids77, 103806 (2019). [Google Scholar]
- 24.Wu, B., Wang, H., Taylor, T. & Yanagimoto, J. A non-associated constitutive model considering anisotropic hardening for orthotropic anisotropic materials in sheet metal forming. Int. J. Mech. Sci.169, 105320 (2020). [Google Scholar]
- 25.Lian, J. et al. An evolving non-associated hill48 plasticity model accounting for anisotropic hardening and r-value evolution and its application to forming limit prediction. Int. J. Solids Struct.151, 20–44 (2018). [Google Scholar]
- 26.Taherizadeh, A., Green, D. E. & Yoon, J. W. A non-associated plasticity model with anisotropic and nonlinear kinematic hardening for simulation of sheet metal forming. Int. J. Solids Struct.69, 370–382 (2015). [Google Scholar]
- 27.Wang, H., Wu, B. & Yanagimoto, J. Elastic-plastic finite element analysis of tension leveling with non-associated flow rule and mixed hardening. Steel Res. Int.90, 1800401 (2019). [Google Scholar]
- 28.Xu, L., Barlat, F. & Ahn, D. Constitutive modelling of ferritic stainless steel sheets. Int. J. Mater. Form.2, 391–394 (2009). [Google Scholar]
- 29.Achani, D., Hopperstad, O. & Lademo, O. Influence of advanced yield criteria on predictions of plastic anisotropy for aluminium alloy sheets. Int. J. Mater. Form.2, 487–490 (2009). [Google Scholar]
- 30.Saito, Y. & Takizawa, H. Modeling of yield surfaces for a5052 aluminum alloy sheets with different tempers by simplified identification method and its experimental validation. Mater. Trans.64, 1605–1613 (2023). [Google Scholar]
- 31.Yoon, J. W., Barlat, F., Dick, R. & Karabin, M. Prediction of six or eight ears in a drawn cup based on a new anisotropic yield function. Int. J. Plast.22, 174–193 (2006). [Google Scholar]
- 32.Hama, T., Kuroda, M. & Takahashi, S. Numisheet 2018: 11th international conference and workshop on numerical simulation of 3d sheet metal forming processes. J. Phys. Conf. Ser.1063, 011001 (2018). [Google Scholar]
- 33.van den Boogaard, T., Havinga, J., Belin, A. & Barlat, F. Parameter reduction for the yld2004-18p yield criterion. Int. J. Mater. Form.9, 175–178. 10.1007/s12289-015-1221-3 (2016). [Google Scholar]
- 34.Safaei, M., Lee, M.-G. & De Waele, W. Evaluation of stress integration algorithms for elastic-plastic constitutive models based on associated and non-associated flow rules. Comput. Methods Appl. Mech. Eng.295, 414–445 (2015). [Google Scholar]
- 35.Cardoso, R. P. & Yoon, J. W. Stress integration method for a nonlinear kinematic/isotropic hardening model and its characterization based on polycrystal plasticity. Int. J. Plast.25, 1684–1710 (2009). [Google Scholar]
- 36.Yoon, J. W., Dick, R. & Barlat, F. A new analytical theory for earing generated from anisotropic plasticity. Int. J. Plast.27, 1165–1184 (2011). [Google Scholar]
- 37.Pham, Q. T. & Kim, Y. S. An alternative procedure to identify stress-strain relation for dp980 sheet over a large strain range. J. Phys. Conf. Ser.1063, 012115 (2018). [Google Scholar]
- 38.Miyake, N. & Kuwabara, T. High precision material modeling of 5000-series aluminum alloy sheet for enhancing the predictive accuracy of hole expansion simulation. J. Jpn. Inst. Light Met.70, 217–224 (2020). [Google Scholar]
- 39.Stoughton, T. B. & Yoon, J. W. Review of Drucker’s postulate and the issue of plastic stability in metal forming. Int. J. Plast.22, 391–433 (2006). [Google Scholar]
- 40.Kuwabara, T. & Horiuchi, Y. Determining subsequent yield surface of pure titanium sheet by use of abrupt strain path change. Int. J. Mater. Form.1, 237–240. 10.1007/s12289-008-0360-1 (2008). [Google Scholar]
- 41.Marques, A. E., et al. Machine learning applications in sheet metal constitutive modelling: A review. Int. J. Solids Struct. 303, 113024. 10.1016/j.ijsolstr.2024.113024 (2024). [Google Scholar]
- 42.Abspoel, M., Scholting, M. E., Lansbergen, M., An, Y. & Vegter, H. A new method for predicting advanced yield criteria input parameters from mechanical properties. J. Mater. Process. Technol.248, 161–177 (2017). [Google Scholar]
- 43.Banabic, D., Barlat, F., Cazacu, O. & Kuwabara, T. Advances in anisotropy of plastic behaviour and formability of sheet metals. Int. J. Mater. Form.13, 749–787 (2020). [Google Scholar]
- 44.Hill, R. The Mathematical Theory of Plasticity Vol. 11 (Oxford University Press, Oxford, 1998). [Google Scholar]
Associated Data
This section collects any data citations, data availability statements, or supplementary materials included in this article.
Data Availability Statement
The datasets used and analyzed during the current study are available from the corresponding author upon reasonable request.