

Abstract
In China, a significant amount of coal fly ash is stored or used for landfill reclamation. The contaminants in coal fly ash (CFA) leachate can cause regional soil and groundwater contamination during long-term storage. This paper focuses on a coal gangue comprehensive utilisation power plant in Fenyang City, Shanxi Province, China, where the leaching characteristics of CFA were investigated by leaching tests. Laboratory-scale long-term soil column leaching tests and long-term ash column leaching tests were conducted using compacted soil and compacted CFA, respectively, to simulate contaminant migration patterns from CFA during the early and later stages of landfill operation. Hydrus-1D simulation software was used to calculate contaminant transport from the CFA landfill. The test results indicate that the concentrations of six representative elements or compounds in the CFA leachate exceeded the Groundwater Standard Class III. Among these contaminants, Pb contamination was the worst, with concentrations 26.67 times above the standard. The flow rate of the leachate is lower when the degree of compaction of the Ma’lan loess and the CFA is higher, and it takes longer for the leachate to start flowing. The greatest release of the ions occurred at a Ma’lan loess compaction coefficient of 0.943 and a hydraulic conductivity of 6.031 × 10− 7. Under extreme rainfall conditions, the contaminants and heavy metals in the fly ash leachate migrate to a maximum depth of 56 cm in the compacted soil layer, with Pb reaching a depth of 28 cm, nickel 23 cm, cadmium 9 cm and hexavalent chromium 5 cm to meet Class III groundwater quality standards. These results indicate a potential risk of groundwater contamination in the vicinity of CFA deposits or land reclamation projects in long-term storage. To mitigate this risk, the Guofeng Power Plant may consider utilizing locally compacted Malan loess in combination with geosynthetic materials or implementing a liner much thicker than 1.5 m to enhance the impermeability of the fly ash landfill.
Supplementary Information
The online version contains supplementary material available at 10.1038/s41598-025-86591-x.
Keywords: Coal fly ash, Soil column leaching tests, Ash column leaching tests, Coal gangue comprehensive utilization power plants, Compactness loess, Extreme continuous rainfall regimes
Subject terms: Environmental sciences, Hydrology
Introduction
Coal fly ash (CFA), also known as pulverised fuel ash, is a byproduct of coal combustion. It is generated from flue gases and particulates that are emitted from thermal power plant boilers, as well as coal gangue and coal slime comprehensive utilization power plant. The production of fly ash is directly related to coal consumption and utilization rates. In China, coal is the predominant source of power, accounting for over 73% of the country’s total power generation energy. The CFA emissions have been steadily increasing due to rising electricity demand, although the Chinese government is actively working to change the energy structure, with the goal of decreasing the proportion of thermal power. According to Dwivedi1 (2014), China produces between 600 and 800 million tons of CFA annually, which makes it the second-largest volume of industrial solid waste in the country2 (Zhao 2018). Although some CFA can be reused, a considerable amount is stored as waste heaps due to technical and economic constraints. In recent years, a significant portion of the CFA has been directed to dry landfills, including valley fills and land reclamation, to increase the amount of cultivable land and address the challenges posed by population growth and limited land resources, thereby emerged as a crucial practice in China. However, the utilization of excess fly ash through valley filling for land creation in China proceeds without explicit procedural regulations or guidelines. Given its potential environmental repercussions, this method remains controversial among environmental regulators.
The chemical composition of coal fly ash (CFA) varies significantly depending on the type of thermal power plant furnace, combustion method, coal types, and combustion conditions in each region. It mainly consists of elements such as silicon, aluminium, iron, calcium, magnesium, titanium, sodium, potassium, and manganese. These elements may be present in the form of oxides or a variety of compounds, including silicates, silica-alumina salts, and sulphates3 (Vukašinović-Pešić 2009). Furthermore, it is worth noting that fly ash and stack emissions contain heavy metal ions, including but not limited to As, Cd, Cr, Cu, Pb, Ni, Zn, and Hg4–6 (Huggins F 2009; Ćujić M 2016, Gopinathan P 2022). Open stockpiled, unlined fly ash could release large quantities of hazardous elements into the environment over time due to the leaching action of rainfall. This can result in pollution of groundwater, soil, and local ecosystems, posing a threat to both social production and human life2,7,8 (Zhao 2018; Hassett D J 1994; Locatelli L 2019). Additionally, around 50% of China’s coal-fired power plants are located in areas with significant ‘coal-water conflicts’. In these areas, which are rich in coal but poor in surface water resources, groundwater is the main source of water supply. The hazardous chemicals from CFA will infiltrate into deep layers under the hydraulic gradient and can poison the groundwater. Therefore, the bottom liner of the sites where CFA is stored must be treated to prevent vertical seepage. Compacted clay liners (CCL) and compacted soil liners (CSL) are recognized as effective impermeable materials in bottom liner systems9 (Özçoban, et al. 2022), constructed primarily from natural materials but enhanced with industrially processed additives such as bentonite or synthetic polymers to improve performance10–12 (Mitchell, 1965; Daniel, 1989; Benson, 1994). Recent research has explored alternative materials such as nanocalcium silicate13 (Mohammed and Mogha, 2016), coal fly ash14,15 (Deka A 2017; Najaf, et al. 2021), peat16 (Marques, et al. 2020) and activated carbon17 (Li, et al., 2020) and others materials18 (Guarena, et al. 2020) to improve the anti-pollution properties of these liners. Despite promising advances, the integration of these alternatives presents ongoing challenges that require further research19 (Marques, et al. 2024). In China, the primary impermeable materials used in landfills include clay liners, bentonite liners, high-density polyethylene (HDPE) liners, geosynthetic clay liners (GCL) and HDPE/GCL composite systems. Specifically, international regulatory bodies, including the USEPA (2002), the Council of the European Union (Council Directive 1999/31/EC), and CETESB (2005), have established that areas designated for the disposal of hazardous waste must be equipped with a bottom liner that meets the specific hydraulic conductivity requirement of 10− 9 m/s. Domestic dry ash landfills are required to have a liner system equivalent to a 1.5 m thick clay layer with a saturated hydraulic conductivity of less than 10− 7 cm/s to prevent leachate infiltration according to the Standard for pollution control on the non-hazardous industrial solid waste storage and landfill (GB 18599 − 2020), and Code for design of dry ash disposal area of fossil-fired power plant (DL/T 5488 − 2014). The potential for contamination from fly ash stacked and landfilling, and the characterisation of contaminant transport patterns, have become the focus of increasing research interest.
Environmental studies of fly ash from power plants started in the 1960s. In recent decades, numerous studies have examined the mineralogical composition of fly ash and bottom ash, as well as the chemical formulae, contents, physicochemistry, mineralogy, and leaching characteristics of heavy metal trace elements and rare earth elements in fly ash and bottom ash20–25. (Okada T 2012; Neupane G 2013; Singh M K 2016; Kumar S 2016; Akin S S 2020; Ju T 2023). The potential contamination of thermal power plants and their surroundings with pollutants or heavy metals from ash has been a concern for many years5,26-30 (Ćujić M 2016; Popović A 2001; Ward C R 2009; Silva L 2012; Dragović S et al. 2013; Li et al. 2014; ). Research on the comprehensive utilisation technology of fly ash is also an area of great interest due to its characteristics. Fly ash can be used in the production of building materials, road construction, backfilling, soil improvement, extraction of metal components, adsorbents, and more31 (Liang Z 2010). Despite the extensive research on the environmental effects of coal-fired power plants, little consideration has been given to the compaction status of CFA in studies of leachate control measures at ash sites. There is a lack of published research on the potential contamination of compacted CFA through compacted soils, especially caused by coal gangue comprehensive use power plants in China. Additionally, the current practice of compaction and containment treatment carried out at the base of landfills is mainly dependent on average meteorological conditions. However, with the intensification of global climate change, the frequency and intensity of extreme rainfall events have shown significant trends, which have important implications for the transport and transformation of environmental pollutants and ecological risks.
The study uses a coal gangue comprehensive use power plant in Shanxi Province, China, as a case study. The power plant generates a substantial surplus of fly ash, and plans are in place to achieve its comprehensive utilization by reclaiming land through valley filling, thereby expanding arable land. However, the local soil is the collapsible Malan loess, which does not meet the requirements for use as a bottom liner material directly. Furthermore, the wide range to be filled, the large volumes of required fill material, high transportation costs, and the construction challenges associated with clay liners pose significant constraints. In light of these considerations, this research proposes the utilization of locally sourced soils, specifically examining the feasibility of compacted Malan loess as an alternative liner material. It takes into account the compacted CFA and underlying loess in the ash field, and conducts experimental and numerical simulation based on this engineering background. The aim of this study is to provide a detailed analysis of the release and migration rules of pollutants, as well as to assess the potential contamination caused by CFA of different densities through its underlying compacted loess under continuous rainfall regimes. The findings can serve as a reference for the structural design of the landfill liner system, as well as for the feasibility assessment and planning of landfill and reclamation projects.
Research area
The dry ash storage site of the Guofeng Coal Gangue Comprehensive Utilization Power Plant is about 5.6 km southeast of Fenyang City. It is in a gully with a collapsed loess foundation and low phreatic water levels. It is recharged by atmospheric precipitation.
Fenyang City is situated within a semi-arid region of the Loess Plateau in China. The annual precipitation is concentrated in the months of June to September, with a notable disparity in the distribution of precipitation both within and between years. Since 1956,The mean annual precipitation is 419.8 mm, with a maximum of 718.0 mm (1988) and a minimum of 260.7 mm (1997). The mean annual precipitation days are 73.6, with the maximum daily precipitation occurring on 140.2 mm of rainfall and the maximum hourly precipitation occurring on 79.2 mm of rainfall. Furthermore, 21 days of precipitation are recorded with daily precipitation greater than 50 mm.
The Guofeng power plant has a twin-engine configuration, generating 2 × 300 MW of power. On average, it operates for 5,295 h annually and produces 85.32 × 10⁴ tonnes of fly ash and 84.18 × 10⁴ tonnes of slag. The power plant is equipped with 2 × 1085 t/h circulating fluidized bed boilers. The SNCR denitration device is constructed concurrently, and a semi-dry desulphurisation method is employed in the furnace and outside the furnace. It is important to note that these by-products are all utilized in a comprehensive strategy. The temporary ash disposal site is located at Jiangnan Gorge Ash Yard, which has a volume of 31.55 × 10⁴ cubic metres. This site implements a directional stacking strategy, directing the placement of ash materials from the northwest to the southeast valley entrance. According to current operating parameters, the estimated useful life of the stored ash is approximately 0.37 years.
Materials and methods
The study used CFA, landfill topsoil and meteoric water as the experimental materials.
Fly ash and bottom ash samples and characterization
Sample collection and pretreatment
To comprehensively assess the pollutant content in pulverised fuel ash from the power plant, this study sampled fly ash and bottom ash based on their respective collection locations. Fly ash samples were collected randomly from the fly ash outlet and storage yard, while bottom ash samples were taken randomly from the tap hole and slag dump. The sample locations is shown in Fig. 1. The samples were labelled as ash 1, ash 2, slag 1, and slag 2, respectively. After screening with a 3 mm Teflon-coated sieve mesh, the four samples with the same weight were placed in separate valve bags. And then, the total amount and ions composition of pollutants in dry ash were determined in laboratory.
Fig. 1.
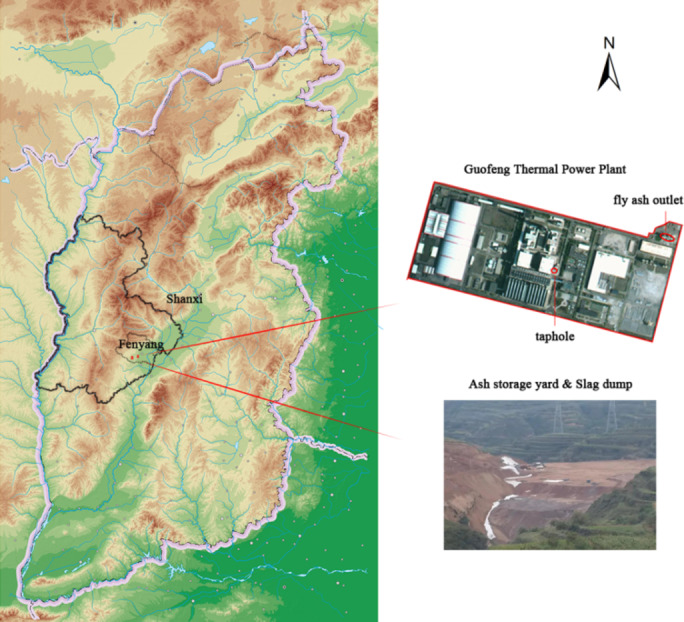
Map of sampling locations (Hypsometric map and satellite imagery were taken from China’s National Platform for Common Geospatial Information Services “tianditu”. URL: www.tianditu.gov.cn.) (This map was created using Adobe Photoshop software version 23.0.0. Available at: www.adobe.com/cn/).
Test items and measuring method
The analysis of the ash samples included particle size distribution, maximum dry density, optimum moisture content, and the concentrations of heavy metal ions, fluoride, chloride, and sulfate.
The particle size distribution was determined using the hydrometer method, while the maximum dry density and optimum moisture content were measured using a multifunction compactor with the standard Proctor test.
The chemical composition of the ash samples was analyzed, focusing on six elements of prime environmental concern (As, Cd, Cr, Hg, Ni, and Pb) due to their significant bio-toxicity, together with other heavy metals (Cu, Se), fluoride, chloride, and sulfate, based on the mineral composition and combustion characteristics of the coal used at the Guofeng Power Plant and their potential for causing serious environmental harm.
Heavy metal concentrations were determined according to the Soil Quality-Analysis of Soil Heavy Metals-Atomic Absorption Spectrometry with Aqua Regia Digestion (NY/T 1613–2008). Fluoride and chloride were measured using an 883 Basic IC plus ion chromatograph produced by Metrohm, Switzerland, and sulphate was measured using the gravimetric method.
Basic physicochemical characteristics of fly ash and bottom ash
Fly ash and bottom slag are typically distinguished by their particle size. Fly ash has a primary particle size distribution ranging from 10 to 100 μm, with a relatively concentrated and uniform particle size distribution, classifying it as a poorly graded soil. The fly ash particle size distribution curve is shown in Fig. 2. In contrast, bottom ash has a larger particle size, with a more dispersed particle size distribution, which makes it easier to separate compared to fly ash.
Fig. 2.
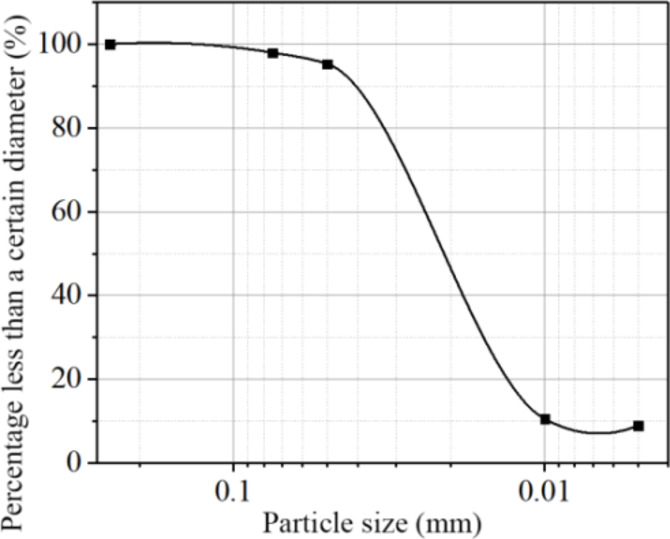
The particle size distribution curve of coal ash fly.
The basic physical indexs of the coal fly ash are shown in Table 1.
Table 1.
The basic physical indexs of CFA.
| Initial moisture content (%) | Grain density (g/cm3) |
<0.075 mm silt content (%) |
<0.005 mm clay content (%) |
Plastic limit (%) |
Liquid limit (%) |
|---|---|---|---|---|---|
| 4.2 | 2.62 | 98.2 | 0.65 | 46.5 | 32.6 |
The ion contents in fly ash and bottom ash are shown in Table 2.
Table 2.
Ion contents in fly Ash and bottom Ash (mg/kg).
| Elements or compounds | Fly ash | Bottom ash | The background of soil in China | The background of soil in Shanxi Province | ||
|---|---|---|---|---|---|---|
| ash outlet | ash storage yard | taphole | slag dump | |||
| Cd | 4.73 | 3.88 | 3.31 | 3.28 | 0.074 | 0.102 |
| Pb | 65.8 | 60.9 | 40.8 | 42.4 | 23.6 | 14.7 |
| Cu | 45.4 | 44.7 | 32.1 | 31.8 | 20.0 | 22.9 |
| Cr | 74 | 69.9 | 68.0 | 68.6 | 53.9 | 55.3 |
| Ni | 38.1 | 32 | 23.1 | 24.8 | 23.4 | 29.9 |
| As | 12.7 | 10.8 | 4.06 | 3.76 | 9.2 | 9.1 |
| Hg | 1.06 | 0.68 | 0.56 | 0.56 | 0.040 | 0.023 |
| Se | 7.60 | 4.98 | 0.46 | 0.60 | 0.216 | 0.16 |
| Fluoride | 214 | 145 | 85.8 | 47.4 | 440 | 482 |
| Chloride | 770 | 700 | 700 | 660 | 150① | |
| Sulfate | 9.48 × 10⁴ | 9.75 × 10⁴ | 7.63 × 10⁴ | 7.29 × 10⁴ | 672① | |
① The average content of soil in North China.
The fly ash from Guofeng Power Plant contains high levels of sulfur (S) and chloride (compounds), as well as heavy metals such as cadmium (Cd), chromium (Cr), lead (Pb), and mercury (Hg), and trace elements including copper (Cu), nickel (Ni), and selenium (Se). These elements and compounds exceed the background values for trace element content in soil in China or specifically in Shanxi Province by varying degrees.
Background soil and water
The compacted remodeled loess used in the tests, sourced from a depth of 20–100 cm in the undisturbed Ma’lan loess surrounding the ash storage field. The sample weighed 100 kg. Tap water was used instead of meteoric water.
Given the extensive literature on the physical and hydrodynamic properties of Malan Loess32 (LI 2018), including its soil-water characteristic (retention) curves, measurements of these curves were not included in this study. The basic properties of the undisturbed Ma’lan loess are shown in Table 3. The elements or compounds concentration of Ma’lan loess and tap water are shown in Table 4.
Table 3.
The basic physical indicators of undisturbed Ma’lan soil.
| Color | Natural moisture content (%) |
Soil Natural Density (g/cm3) |
Porosity (%) |
Saturation Degree (%) |
Plastic Limit (%) |
Liquid Limit (%) |
Soil Particles (%) | grain-size classification | ||
|---|---|---|---|---|---|---|---|---|---|---|
| >0.05 mm | 0.05–0.005 mm | < 0.005 mm | ||||||||
| pale yellow | 19.2 | 1.672 | 48.05 | 46.43 | 16.2 | 31.8 | 26.25 | 69.53 | 4.22 | silt mild clay |
Table 4.
The concentration of elements or compounds in Ma’lan loess and tap water.
| Elements or Compounds Concentration | F | Chloride | Cr | Cd | Pb | Ni |
|---|---|---|---|---|---|---|
| Ma’lan loess(mg/kg) | 157 | 160 | 58.9 | 0.070 | 22.3 | 19.5 |
| Tap water (mg/L) | 0.142 | 143.22 | 0 | 0 | 0 | 0 |
The concentrations of heavy metals, trace elements and compounds in the Ma’lan loess and tap water were all lower than the background values of these elements and compounds in the soil of Shanxi province or China.
Leaching tests
In order to simulate the leaching process of harmful components from an ash storage yard during its operational period, which is subjected to rainwater or groundwater infiltration, and to analyse the leaching characteristics of pollutants and harmful components, leaching tests were conducted. According to the mineral composition and combustion method of the coal selected for the Guofeng coal-fired power plant, six elements of main environmental concern (As, Cd, Cr, Hg, Ni and Pb), heavy metal ions Cu and Se causing selenosis poisoning, as well as fluoride, chloride, sulfate with higher content in the leaching solution were routinely monitored for risk assessment.
The leaching procedure for the fly ash and bottom ash samples was conducted according to the Solidwaste-Extraction Procedure for Leaching Toxicity-Horizontal Vibration Method (HJ/557–2009). The procedure included the following steps: First, 20 g of each of the four ash samples were placed in pre-dried, constant-weight, covered aluminum boxes and dried at 105 °C for 8–16 h until a constant weight (± 0.01 g) was achieved, allowing for the calculation of the moisture content. The laboratory measurements showed that the CFA from the ash outlet, tap hole, and slag yard had a moisture content of 0%, while the sample from the ash storage yard had a moisture content of 0.05%. Based on the determined moisture content, 100 g (dry weight) of each sample was accurately weighed and placed in 2 L glass wide-mouth bottles. Ultra-pure water was added to each sample to achieve a liquid-to-solid ratio of 10:1 (L/kg), as calculated according to the moisture content. The bottles were then tightly sealed and vertically fixed on a SHA-C model oil bath constant-temperature shaker, which was set to a frequency of 110 oscillations per minute and an amplitude of 40 mm. The samples were shaken at room temperature for 8 h, after which they were allowed to stand for 16 h. Following the standing period, the leachate was filtered through a 0.45 μm microporous membrane using a vacuum filter. Finally, the ionic composition of the leachate was analyzed. The concentrations of Cd, Pb, Cu, Cr, and Ni were determined using an atomic absorption spectrophotometer (TAS-990), while the As, Hg, and Se were measured using an atomic fluorescence spectrometer (AFS-8510). Additionally, the F−, Cl−, and SO42− were analyzed using an 883 Basic IC plus ion chromatograph (Metrohm, Switzerland).
Soil engineering tests
The compaction properties of loess are a crucial parameter in ash field operations. During the later stages of ash field operation, when fly ash has accumulated to a certain level, high-pressure compaction is carried out. Therefore, compacting tests, collapsibility tests, and penetration tests were conducted to determine some parameters of Ma’lan Loess and CFA related to engineering characteristics such as compaction, collapsibility, and permeability.
Compaction tests
To determine the compaction parameters of Ma’lan loess and fly ash, their respective maximum dry densities (ρdmax) and optimum moisture contents was determined. Compaction tests were performed on Ma’lan loess and fly ash specimens using a multi-purpose compaction apparatus and standard scientific procedures.
In this study, the light compaction test was used, with a compaction effort of 592.2 kJ/m³. The optimum moisture content of approximately 15% was estimated using the plastic limit of Ma’lan loess. Six moisture gradients (11, 13, 15, 17, 19, and 21%) were then selected experimentally. Three kilograms of air-dried soil samples, sieved through a 5 mm sieve, were gradually mixed with water in a soil mixing tray to ensure uniform moisture distribution. The soil samples were compacted in layers of approximately one-third of the height of the moulds, with 25 compactions between each layer. After compaction, the specimens were removed from the moulds using a mechanical extruder, weighed accurately, and two core samples were extracted from the centre of the specimens to determine the moisture content and calculate the wet density.
The compacted soil samples were then crushed, remixed, and stirred. Compaction and moisture content measurements were repeated at predetermined moisture contents. The dry density of all samples was calculated, and a curve was plotted between dry density and moisture content. Next, 2 kg of air-dried soil samples were sieved through a 5 mm sieve. The air-dried moisture content of the soil samples was measured and adjusted to the optimum moisture content. Manual compaction was then carried out using tampers for varying numbers of repetitions. The relationship between compaction thickness and dry density was established by observing and recording the resulting variation in compaction thickness.
The maximum dry density (ρdmax) and optimum moisture content were determined from the compaction curve. The compaction coefficient (λ), which is a measure of the degree of compaction, is defined as the ratio of the actual dry density (ρd) of the soil to its maximum dry density (ρdmax). The calculation method is shown in Formula (1):
 |
1 |
Where λ is the compaction coefficient, ρd is the actual dry density of the soil (g/cm3), ρdmax is the maximum dry density of the soil (g/cm3).
The maximum dry density, optimum moisture content, and compaction thickness of CFA were also determined using the same method.
Collapsibility determination and classification
In order to evaluate the collapsibility of Ma’lan loess, indoor collapsibility tests were carried out using the double line method with a WG type single lever triaxial high pressure consolidation apparatus. The applied pressures were 100 kPa, 300 kPa, 500 kPa, 700 kPa, 900 kPa and 1000 kPa. Undisturbed soil samples were prepared to ensure uniform height and flat, parallel surfaces. Incremental loads were applied, starting at 100 kPa, and each load was maintained until the settlement rate was less than 0.01 mm per hour, indicating primary consolidation. The process was repeated for each subsequent load up to 1000 kPa. After reaching the maximum load, the samples were gradually saturated from top to bottom to simulate water infiltration. The same pressure levels were then reapplied and settlements were recorded. After the experiment, the consolidated samples were saved for permeability testing. The collapsibility coefficient (δs) was determined using the formula (2):
 |
2 |
where h0 is the initial height of the sample, hp is the height of the specimen after deformation stabilization, h′pis the final height after wetting and re-consolidation.
According to the “Chinese Geotechnical Test Code (GB/T50123-2019)”, soil samples are classified into different collapsibility grades based on the calculated δs values: non-collapsible if δs < 0.015, slightly collapsible if 0.015 ≤ δs < 0.030, moderately collapsible if 0.030 ≤ δs < 0.070, and highly collapsible if δs ≥ 0.070. The results of the current experiment, including the calculated δs values, were used to classify the soil samples into these respective collapsibility grades.
Indoor permeability tests
Ma’lan loess, characterised by it’s fine particle size, is inherently collapsible. When saturated with water, the soil structure degrades, leading to changes in the porosity ratio. This has a significant effect on the permeability of the soil. Compacted CFA typically results in a denser overall structure due to the compression of interparticle voids, which reduces their size. Consequently, the permeability of the compacted fly ash layer is significantly reduced compared to its uncompacted state.
Therefore, the variable head method was used in the permeability tests to determine the hydraulic conductivity of the Ma’lan Loess and CFA under different degrees of compaction. The TST-55 permeameter was used for the measurements. Prior to the experiment, a graduated glass tube was connected to the penetrometer with a rubber hose. The glass tube was then filled with water to a certain height, allowing the water to penetrate from the bottom to the top of the sample. Once the sample was saturated, the formal experiment began. The head difference within Δt was recorded to establish an instantaneous linear relationship which was used to calculate the hydraulic conductivity.
Long-term soil column leachate tests
Five soil column leachate tests were designed based on the relationship between the optimal moisture content, maximum dry density, and compaction thickness of the soil samples determined by geotechnical tests. The tests used CFA from the ash hole as the pollution source due to its higher pollution content compared to the other three sampling sites. One hundred kilograms of samples were taken directly from the ash outlet of Guofeng thermal power plant.
The lab-scale simulated column was an acrylic tube with an outside diameter of 16 cm, an inside diameter of 15 cm and a height of 80 cm. During the experiment, the column was secured to an iron frame. A Mariotte bottle filled with water was placed on the frame to control the water head. The height of the Mariotte bottle was alternated to maintain a constant supply of water. At the bottom of the water column, there was an acrylic sieve plate with microscopic holes that were 1 mm in diameter and spaced 2.5 mm apart to ensure uniform water penetration. Furthermore, a Teflon-coated stainless steel mesh with 100 mesh is placed between the column and sieve plate to prevent blockage of the sieve plate. A transparent container, with the same inner and outer diameters as the leaching column, is positioned below the sieve plate to collect the lysimetric solutions and prevent evaporation effectively. The column, sieve plate, and water container were connected using lacquer enamel and waterproof screws. The seams were made watertight using silicone mat to maintain the seal. The soil column leachate tests apparatus is shown in Fig. 3.
Fig. 3.

Soil column leachate tests apparatus.
After installation, impurities were removed and the loess was sieved through a 2 mm sieve. It was then spread evenly for one week to determine the air-dried moisture content. Water was added to adjust the Ma’lan loess to the optimum moisture content. The soil was then filled into the column in batches of 1500 g per batch, layer by layer, according to the required compaction thickness, until it was filled to a height of 60 cm. A 10 cm thick layer of in-situ outlet fly ash was used to cover the top, followed by a 2 cm thick layer of coarse-grained quartz sand to ensure uniform penetration of the drench solution. The Mariotte bottle was filled with water and leachate tests were conducted continuously day and night at a constant head of 5 cm throughout the process.
After the leachate begins to flow out, a sample of the liquid is collected, sealed, and stored under refrigeration. Subsequently, samples were taken and measured every 24 h, with an interval of no more than 48 h between samples and measurements. The concentrations of Cd, Pb, Cr, Ni, F−、Cl−、SO42− were measured in the same manner as in the previous leaching experiments.
Long-term ash column leachate tests
During the later service period of the ash yard, the CFA must be roller compacted before being landfilled. To simulate different levels of compactness of the CFA, five ash columns with varying compaction coefficients were designed for the ash column leachate tests. The ash column leaching experimental apparatus is shown in Fig. 4.
Fig. 4.

Ash column leachate tests apparatus.
Prior to conducting the experiment, the compaction test was used to determine the maximum dry density and optimal moisture content of the CFA samples. A correlation between compacted thickness and dry density of CFA samples was also obtained. The study simulated the varying compactness of CFA using samples weighing 1500 g and with thicknesses of 13.5 cm, 10.5 cm, 9 cm, 7.5 cm, and 6 cm. The hydraulic conductivity of the CFA was then measured using the laboratory method of varying head. The results, including the compaction coefficient and hydraulic conductivity, are presented in Table 5.
Table 5.
The compaction coefficient, hydraulic conductivity of CFA with different compaction.
| Ash Column 1 | Ash Column 2 | Ash Column 3 | Ash Column 4 | Ash Column 5 | |
|---|---|---|---|---|---|
| Thickness/cm | 13.1 | 10.5 | 9 | 7.5 | 6 |
| dry density g/cm3 | 0.454 | 0.566 | 0.661 | 0.793 | 1.008 |
| compaction coefficient | 0.431 | 0.537 | 0.627 | 0.752 | 0.956 |
| hydraulic conductivity cm/s | 4.874 × 10− 4 | 1.218 × 10− 4 | 5.331 × 10− 5 | 2.285 × 10− 5 | 1.523 × 10− 5 |
The compacted CFA were filled into the 5 columns 60 cm high, and the leaching processes were conducted continuously day-and-night at a constant head of 15 cm. As before, liquid samples were collected when the leaching solution flowed out, and subsequent samples are taken at 24-hour intervals after that. The element species, testing methods and experimental procedures were consistent with the soil column leachate tests.
Numerical simulation
Model setup and structure
A numerical transport model was constructed to simulate the transfer of pollutants from CFA through compacted loess using the flow and transport mode in Hydrus-1D. The assessed factors were the pollutants that exceeded the standard in the leach liquor, and their transfers in loess under heavy rains were simulated. The model used a time unit of ‘d’, a length unit of ‘cm’, and a pollutant mass unit of ‘mg’. The soil thickness was set to 300 cm and divided into 300 grids. The ‘Climate Overview of Fenyang City’, published by the Fenyang government, states that the longest recorded period of continuous rainfall is 21 days. Therefore, the simulation time was set to 21 days.
Water transport model
The movement of soil moisture can be classified into isotropic homogeneous and unsaturated 1D vertical steady flow, without considering the effects of evaporation and root uptake on moisture movement. The upper boundary is defined as the constant head boundary, and the lower boundary is treated as a free drainage boundary. The mathematical model for one-dimensional moisture movement can be expressed using Richards’ Eq. (3).
 |
3 |
where θ is the volumetric water content, t is time (d), h is the matric head induced by capillary action (cm), z is the elevation above a vertical datum (cm), K is the hydraulic conductivity (cm/d), h0 is the matric head at time t = 0 (cm), hb is the head at lower boundary (cm), θ0 is the initial water content.
The Van-Genutchen hydraulic characteristic model33 (Van Genuchten M T, 1980) was used to express the relationship between soil hydraulic characteristic parameters, and the model is shown in Eq. (4).
 |
4 |
where θr is the residual water content, θs is the saturated water content, Se is the effective water content, Ks is the saturated hydraulic conductivity (cm/d), α is the soil air entry value (m− 1), n and m are the characteristic parameters of the curve, l is the pore connectivity coefficient, is about 0.5 in general.
Solute transport model
As the focus of this study is on the contaminants in fly ash, and the leachate from the loess exhibited zero concentrations of the target ions, the initial solute concentration in soil water was 0. The upper boundary was set as the constant concentration boundary due to the Continuous accumulation of CFA, while the lower boundary was set to Zero-gradient condition. The maximum value of contaminant ions in ash column tests was taken as the pollutants concentrations, as shown as the Table 6.
Table 6.
Values of contaminant ions concentration in the model.
| SO42− | F− | Ni | Cr | Cd | Pb | |
|---|---|---|---|---|---|---|
| Density(mg/L) | 899.561 | 1.585 | 0.1328 | 0.1324 | 0.0220 | 0.6833 |
In this simulation, from an environmental safety perspective, the solute diffusion in gas phase and source-sink term were ignored, and a lagged effect caused by coupling between temperature and ion on solute transport were also not considered. Solute transport in soils based on the convection-dispersion equation (5) is as follows:
 |
5 |
Where  is the volumetric water content, C0 is initial solute concentration (mg/L), Ct is solute concentration of upper boundary (mg/L), t is time (d), z is the elevation above a vertical datum (cm), Dw is longitudinal dispersivity (cm), V is seepage velocity(cm/d), H is Depth of unsaturated zone(cm), Kd is partition coefficient (adsorption coefficient).
Parameter setting
HYDRUS-1D software includes a neural network-based transfer function method (Rosetta model) that can predict soil hydraulic characteristic parameters based on soil particle size distribution.
The soil hydraulic parameters required for the water transport model include the residual water content θr, the saturated water content
 s, the saturated hydraulic conductivity ks, the soil air entry value α, and the curve characteristic parameter n. The solute transport model parameters include the longitudinal dispersion and the adsorption coefficient.
In this study, the saturated hydraulic conductivity ks was determined from geotechnical test results with values of 0.05 cm/d and 1.25 cm/d at different compaction levels. The other soil hydraulic parameters were predicted using the neural network-based transfer function method (Rosetta model) in HYDRUS-1D, based on the measured soil particle size distribution. The specific steps are as follows: in the Rosetta Lite V 1.1 module, the proportions of sand, silt, and clay, together with the bulk density of the loess, were input to automatically calculate the corresponding soil water retention curve parameters. The parameters were determined as
 r was 0.067,
  s was 0.46, α was 0.020 and n was 1.21. The ion adsorption coefficients was determined according to the results of previous studies, the results is shown as Table 7. The longitudinal dispersion coefficient was determined using the inverse solution module in HYDRUS-1D. Specifically, the measured concentrations of six ions at different time points from the column experiments were input into the model. The inverse solution module then employed an optimization algorithm to iteratively adjust the longitudinal dispersivity until the simulated results best matched the observed data. The optimization process resulted in a longitudinal dispersivity value of 3.15 cm.
Table 7.
Ion distribution (adsorption) coefficients.
| SO42− | F− | Ni | Cr | Cd | Pb | |
|---|---|---|---|---|---|---|
| distribution coefficients | 2.332 | 0.016 | 0.0015 | 0.0026 | 0.0038 | 7.4 × 10− 4 |
Model calibration and validation
The pollution transport model was used to obtain concentration curves for each ion at 60 cm over time. These curves were then compared to experimental results taken after 15 days, as the leachate concentration was measured at this point. The calculated concentrations were found to be in good agreement with the measured values, with the fitting error falling within the permissible range(Supplemental Figure S-1). It shows that the simulation results are reliable, the setup parameters are relatively accurate and can be used to predict the practical simulation application of fly ash pollutants in compacted loess.
Prediction scheme
The validated model was applied to calculate contaminant mobility in coal fly ash landfills under continuous rainfall regimes. Contaminant transport in the fly ash landfill was predicted on the 21st day of continuous rainfall.
Results
Physical modeling results
Leachability of elements
Ion concentration of the leachate from four fly ash samples is shown as Table 8. Based on a comparison of China’s Quality Standard of Underground Water” (GB/T14848-2017), the World Health Organization (WHO) Guidelines for Drinking-water Quality, the United States Environmental Protection Agency (USEPA) National Primary Drinking Water Regulations, the European Union (EU) Drinking Water Directive (98/83/EC), and Japan’s Safe Drinking Water Standards, the most stringent criteria from these standards were selected as the upper limit references for the analysis.
Table 8.
Ion Concentration in Leachate from fly Ash and bottom Ash (mg/L).
| Ion | Fly ash | Bottom ash | Upper limit of monitoring indicators | ||||||||||
|---|---|---|---|---|---|---|---|---|---|---|---|---|---|
| ash outlet | ash storage yard | taphole | slag dump | China GB/T14848-2017 |
WHO 98/83/EC |
USA MCL(MCLG) |
EU | JAPAN WQC |
|||||
| 1 | 2 | 1 | 2 | 1 | 2 | 1 | 2 | ||||||
| Cd | 0.0102 | 0.0024 | null | 0.0024 | null | 0.0024 | null | null | 0.005 | 0.003 | 0.005 | 0.005 | 0.01 |
| Pb | 0.2667 | 0.1833 | 0.1833 | 0.1000 | 0.1000 | 0.1833 | null | null | 0.01 | 0.01 | 0.015 | 0.01 | 0.01 |
| Cu | 0.0185 | 0.0088 | 0.0088 | 0.0088 | null | null | null | null | 1.0 | 1.0 | 1.3 | 2.0 | 1.0 |
| Cr | 0.0989 | 0.1538 | null | 0.0989 | 0.0440 | null | null | null | 0.05 | 0.05 | 0.1 | 0.05 | 0.05 |
| Ni | 0.2128 | 0.0528 | 0.1806 | 0.0368 | 0.1806 | 0.0048 | 0.1648 | null | 0.02 | 0.02 | 0.02 | 0.01 | |
| As | null | null | null | null | null | null | null | null | 0.01 | 0.01 | 0.01 | 0.01 | 0.01 |
| Hg | 0.0002 | 0.0001 | 0.0001 | 0.0001 | 0.0001 | 0.0001 | 0.0001 | 0.0001 | 0.001 | 0.001 | 0.002 | 0.001 | 0.0005 |
| Se | null | 0.0001 | null | 0.0001 | null | 0.0001 | null | 0.0001 | 0.01 | 0.01 | 0.05 | 0.01 | 0.01 |
| F− | 3.1920 | 3.635 | 2.8886 | 3.3750 | 0.6055 | 1.1500 | 0.5525 | 0.7700 | 1.0 | 1.5 | 4.0 | 1.5 | 0.8 |
| Cl− | 149.63 | 154.55 | 107.36 | 139.31 | 2.9585 | 13.413 | 2.6055 | null | 250 | 250 | 250 | 250 | 200 |
| SO42− | 723.70 | 727.86 | 709.19 | 720.03 | 792.88 | 813.26 | 791.54 | 771.44 | 250 | 250 | 250 | 250 | |
Bold value represents ion concentration exceeding permitted levels of Standard.
The results indicate that certain chemical components of environmental concern found in CFA or bottom ash may be soluble in water. The ion concentration of Cd, Pb, Cr, Ni, F−, SO42− in the leachate from the ash outlet, Pb, Cr, Ni, F−, SO42−from the ash storage yard, Pb, Ni, F−、SO42− from the taphole, and Ni, SO42− from the slag dump all exceeded the threshold of groundwater Class III water standards. The levels of Pb in CFA from the ash outlet were far higher than the allowable level in groundwater, exceeding it by 26.67 times. Furthermore, the ion concentration in the leachate from CFA varied depending on the location, with the highest concentration found in the fly ash from the ash outlet, followed by the fly ash from the ash storage yard, bottom ash from the taphole, and finally bottom ash from the slag dump (excluding SO42−).
Physico-mechanical properties of Ma’lan loess and CFA
The compaction tests show that for Ma’lan loess, the maximum dry density (ρdmax) is achieved at an optimal moisture content of 13% after 20 manual compaction blows, resulting in a value of 1.781 g/cm³. The compaction curves of Ma’lan loess is shown in Fig. 5.
Fig. 5.
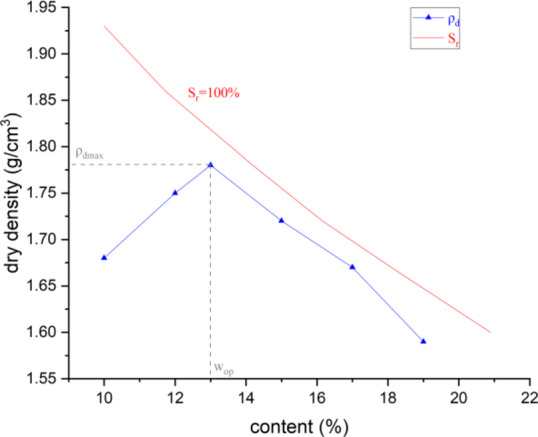
Compaction and saturation curves of Malan loess.
For coal fly ash, the optimal moisture content is 32%, which corresponds to a dry density of 1.054 g/cm³. The compaction curves of CFA is shown Fig. 6. Fly ash exhibits a stable internal structure when it is near its maximum dry density. The addition of moisture results in only minor alterations to the volume and dry density.
Fig. 6.
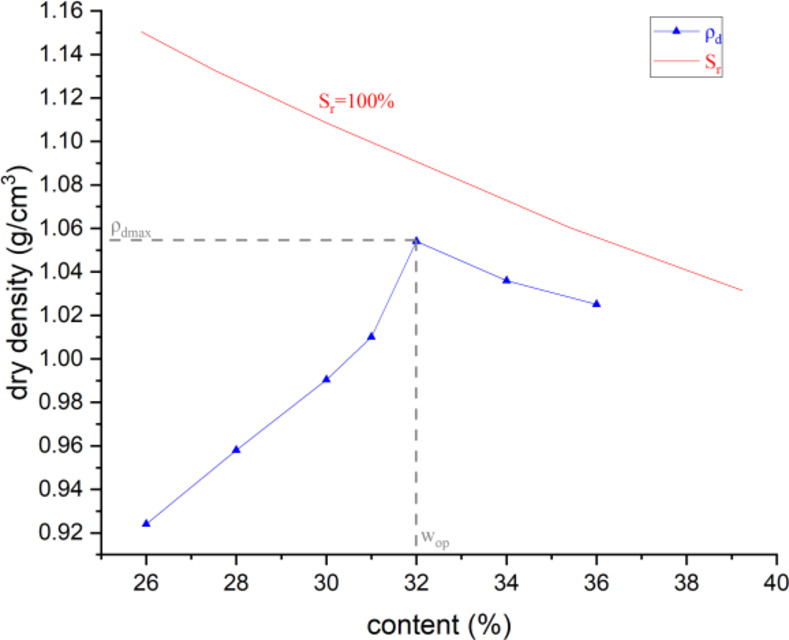
Compaction and saturation curves of fly ash.
The main physical properties of compacted remodeled Ma’lan loess and CFA are shown as Tables 9 and 10, respectively.
Table 9.
The main physical properties of compacted remodeled Ma’lan loess.
| Simulative soil column | Compacted thickness(cm) | Dry Density (g/cm3) |
Compaction Coefficient |
Coefficient of Collapsibility | Collapsibility Grade of Loess | Hydraulic Conductivity (cm/s) |
|---|---|---|---|---|---|---|
| No.1 | 7 | 1.056 | 0.593 | 0.0926 | high collapsibility | 6.495 × 10− 4 |
| No.2 | 6 | 1.231 | 0.692 | 0.0749 | high collapsibility | 2.771 × 10− 4 |
| No.3 | 5.5 | 1.343 | 0.754 | 0.0532 | intermediate collapsibility | 1.188 × 10− 4 |
| No.4 | 5 | 1.478 | 0.830 | 0.0383 | intermediate collapsibility | 2.690 × 10− 5 |
| No.5 | 4.4 | 1.679 | 0.943 | 0.0109 | high collapsibility | 6.031 × 10− 7 |
Table 10.
The main physical properties of compacted CFA.
| Simulative ash column | Compacted thickness(cm) |
Dry Density (g/cm3) |
Compaction Coefficient |
Hydraulic Conductivity (cm/s) |
|---|---|---|---|---|
| No.1 | 13.1 | 0.454 | 0.431 | 4.874 × 10− 4 |
| No.2 | 10.5 | 0.566 | 0.537 | 1.218 × 10− 4 |
| No.3 | 9 | 0.661 | 0.627 | 5.331 × 10− 5 |
| No.4 | 7.5 | 0.793 | 0.752 | 2.285 × 10− 5 |
| No.5 | 5.9 | 1.008 | 0.956 | 1.523 × 10− 5 |
The transition regulation of pollutants from CFA in the remolded loess with different compactness
In the long-term soil column leaching tests, the basic information such as discharge and outflow time of leachate for each of the soil column was shown as Table 11.
Table 11.
The information of leachate outflows of soil columns.
| Compaction Coefficient of Ma’lan Loess | Initial Outflow Time (h) | Discharge (ml/h) |
Total Testing Duration (d) | |
|---|---|---|---|---|
| Soil Column 1 | 0.593 | 2 | 458.04 | 73 |
| Soil Column 2 | 0.692 | 5 | 432.71 | 73 |
| Soil Column 3 | 0.754 | 6 | 341.95 | 73 |
| Soil Column 4 | 0.830 | 8 | 274.40 | 73 |
| Soil Column 5 | 0.943 | 360 | 2.24 | 100 |
The outflow exhibited an initial increase followed by a decrease and eventually stabilized over time. As the compactness of the loess increases, the outflow time of the leachate also increases. Conversely, the discharge and outflow volume of the leachate show a negative correlation with the compactness. This means that as the loess compactness increases, it takes longer for the leachate to begin flowing through the soil column, with slower flow and lower outflow volume. In Soil Column 1, which had the smallest compactness, leachate began flowing after only two hours of leaching. In contrast, Soil Column 5 had the highest compactness and required 15 consecutive days of leaching before any leachate flowed out. The observed flow rate was only 2.24 ml/hour, which was the longest duration and smallest flow rate recorded in the experiment.
The ion concentrations in leachate from soil columns with different compactness are shown as Fig. 7.
Fig. 7.


The concentration variation of pollutants in leachate of soil column(a)Change of sulfate concentration in leachate of 5 different soil columns with time; (b) Change of fluoride concentration in leachate of 5 different soil columns with time; (c) Change of Ni concentration in leachate of 5 different soil columns with time; (d) Change of Cr concentration in leachate of 5 different soil columns with time; (e) Change of Cd concentration in leachate of 5 different soil columns with time; (f) Change of Pb concentration in leachate of 5 different soil columns with time;
The concentrations of pollutants at different depths of fly ash and its underlying compacted loess of each soil column after leachate tests are shown as Fig. 8.
Fig. 8.

Pollutant concentration in fly ash and compacted loess of each soil column after leachate tests.
The test results indicate that high concentrations of SO42− and F− remained in the leachate after the leaching experiments. The maximum release of both ions occurred in soil column 3 with a compaction coefficient of 0.754, and the minimum release occurred in soil column 5 with 0.943. In soil column 5, the SO42− concentration in leachate was much lower than other soil columns.
For each soil column, content of SO42−, F−, Ni, Cr, Cd, Pb in fly ash decreased compared to pre-leaching, with Cd having the largest decrease. After a period of leaching, concentrations of Ni, Cr, Cd, Pb all reduced to 0 mg/L. Release amounts of these four heavy metal ions were highest at a compaction coefficient of 0.943 for Ma’lan Loess. Release amounts of each pullutant from leachate are shown as Fig. 9.
Fig. 9.
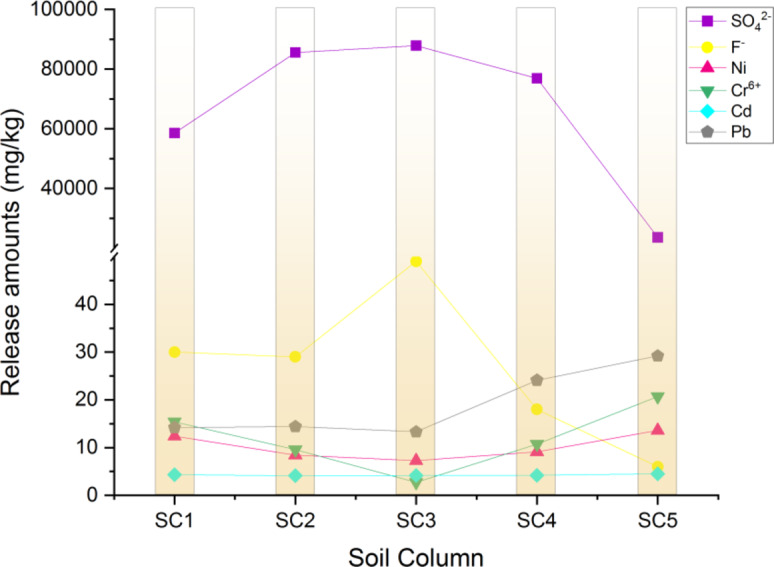
Release amounts of each pullutant from CFA.
Based on the pullutant content at different depths in the soil columns with different levels of compression, Ma’lan loess has the ability to adsorb SO42−, F−, and Ni from fly ash, and the amount of adsorption is related to the compaction degree and its hydraulic conductivity of Malan loess. The physical structure of the soil is crucial in determining the efficiency of pollutant release and transport.
Furthermore, it was observed that Ma’lan Loess experienced significant collapse with compaction coefficients below 0.754, while no collapse was observed when the compaction factor reached 0.943. In practical situations, loess collapsibility can lead to ground subsidence and the formation of water flow channels, which can allow pollutants to directly enter underlying aquifers from fly ash. Therefore, a compaction coefficient of over 0.943 for the underlying loess would have the least impact on the environment during landfills.
Regularity of pollutant release from CFA with different compactness
The information about discharge and outflow times of leachate for the five ash columns is shown as Table 12.
Table 12.
The information of leachate outflows of ash columns.
| No. | Compaction Coefficient of CFA | Initial Outflow Time (h) | Discharge (ml/h) |
Total Testing Duration (d) |
|---|---|---|---|---|
| Ash column 1 | 0.431 | 2 | 340.91 | 15 |
| Ash column 2 | 0.537 | 5 | 329.70 | 15 |
| Ash column 3 | 0.627 | 8 | 262.41 | 15 |
| Ash column 4 | 0.752 | 10 | 136.81 | 15 |
| Ash column 5 | 0.956 | 12 | 6.72 | 15 |
It is evident that the compaction of fly ash has an impact on the flow of leachate. As the compaction factor increases, the time taken for leachate to begin flowing out also increases, resulting in lower flow rates and total outflow. The results of this experiment show that Soil Column 1, which had the lowest level of compaction, began leachate outflow after two hours of leaching, while the Soil Column 5 with the highest level of compaction took 12 h. It is recommended to use highly compacted fly ash as it requires longer rainfall times for pollutants to migrate through the leachate to deeper soil or groundwater, reducing the risk of contamination. The environmental impact of fly ash can be mitigated by controlling its degree of compaction.
The ions contents of fly ash with different compactness in each ash column after leaching tests are shown as Fig. 10.
Fig. 10.


The concentration variation of pollutants in leachate of ash column(a)Change of sulfate concentration in leachate of 5 different ash columns with time; (b) Change of fluoride concentration in leachate of 5 different ash columns with time; (c) Change of Ni concentration in leachate of 5 different ash columns with time; (d) Change of Cr concentration in leachate of 5 different ash columns with time; (e) Change of Cd concentration in leachate of 5 different ash columns with time; (f) Change of Pb concentration in leachate of 5 different ash columns with time;
The Pollutant concentration of fly ash in each ash column after leachate tests are shown as Fig. 11.
Fig. 11.

Pollutant concentration of fly ash in each ash column after leachate tests.
The results show that the leachate’s ionic content trend in the ash column was affected by the level of fly ash compaction. Specifically, as the compaction increased, the leachate’s runoff time increased while the runoff volume decreased. These findings demonstrate the impact of fly ash compaction on leachate runoff and provide valuable insights for future waste management practices. At a compaction factor of 0.956, the pollutants in the fly ash required 12 h of continuous rainfall to reach the underlying soil, with an outflow rate of 6.72 ml/h. The experiment has concluded and the leachate still contained SO42− and F−. However, their contents decreased as the ash compaction increased. These findings demonstrate a clear understanding of the behaviour of heavy metal ions in relation to ash compaction. Among the heavy metal ions, nickel had the longest release time, while cadmium had the shortest release time of three days. It is worth noting that the release of cadmium was not affected by compaction, whereas the release of nickel, Cr, and lead decreased with increasing ash compaction. This is supported by the significant decrease in leachate flow rate and slowed outflow rate observed as the compaction increased from 0.752 to 0.956. Increasing the compaction degree to above 0.8 effectively reduces environmental damage by preventing pollution leakage and lowering environmental risk.
Numerical simulation results
Migration details of six ions (SO42−、F−、Ni、Cr、Cd、Pb) in compacted Ma’lan Loess is shown as Fig. 12.
Fig. 12.

Concentration-depth curve of each pollutant.
Figure 12 shows the distribution of six ions in the compacted loess layer at different depths on 21 days of rain. The results demonstrate that continuous leaching for 21 days leads to a gradual increase in contaminant migration depth and ion concentration in soil water over time. The maximum migration depth and initial exceeding depth of ion concentration were determined in accordance with the Class III groundwater standard outlined in the Groundwater Quality Standard (GB/T 14848 − 2017), as presented in Table 13.
Table 13.
Migration distance of pollutants in loess layer.
| SO42− | F− | Ni | Cr | Cd | Pb | |
|---|---|---|---|---|---|---|
| Maximum migration depth on Day 21 for rain (cm) | 56 | 56 | 55 | 55 | 55 | 55 |
| Depth of concentration up to standard on Day 21 for rain (cm) | 0 | 0 | 23 | 5 | 9 | 28 |
| National standard on drinking water quality (mg/l) | ≤ 250 | ≤ 1.0 | ≤ 0.05 | ≤ 0.05 | ≤ 0.01 | ≤ 0.05 |
It can be seen that following 21 consecutive days of simulated rainfall, the six ions (SO42−, F−, Ni, Cr, Cd and Pb) from the fly ash in the compacted layer of loess exhibited maximum migration depths is 56 cm, did not penetrate through the compacted soil layer with a saturated hydraulic conductivity of 6.031 × 10− 7 cm/s under experimental conditions. The migration depths of these ions to meet the groundwater criteria Class III varied, lead (Pb) has the deepest migration depth of 28 cm, followed by Nickel (Ni) at 23 cm and cadmium (Cd) at 9 cm each, chromium (Cr) at 5 cm, fluoride (F−) and sulfate (SO42−) are all 0. This indicates that there are differences in the migration ability of different ions in soil.
Discussion
The preliminary sampling and chemical analysis indicated that among the four sampling locations (ash outlet, ash storage yard, slag outlet, and slag storage yard), the ash outlet fly ash exhibited the highest concentrations of contaminants.The higher concentrations of pollutants in fly ash leachates can be attributed to several factors. Firstly, fly ash particles typically have smaller diameters and larger specific surface areas, which facilitate a greater accumulation of trace elements and chemical constituents on their surfaces. This increased adsorption propensity makes fly ash more susceptible to interaction with water, thereby causing a more rapid leaching process. During transportation and storage from the ash discharge point to the ash storage area, volatile contaminants may undergo volatilization and dispersal. It is suggested that pollutants within the stored fly ash may also undergo dilution or immobilisation through natural processes such as percolation and weathering over extended periods of time. These environmental interactions could potentially reduce their leachable concentrations due to prolonged settling.
Additionally, the concentration of SO42− in the leachate of fly ash is influenced by the combustion process. Advanced desulfurization methods produce thermally stable sulfate byproducts, but at temperatures above 1200 °C, the structural integrity of these sulfate compounds becomes compromised, leading to their decomposition into SO2 and O2. Due to their smaller size and predominant presence in the high-temperature regions of the liquid slag furnace, fly ash particles undergo more thorough sulfate decomposition during the burning process. As a result, the sulfate breakdown within fly ash is enhanced, leading to lower residual sulfate levels in its leachate. This comprehensive thermal degradation contributes to the overall reduction of sulfate content in the leachate extracted from fly ash. Therefore, after the leaching experiments, the fly ash from ash outlet, which exhibited the highest concentrations of contaminants, was selected as the main research object for subsequent long-term soil column leach tests and long-term ash column leach tests.
The results of the experimental and numerical simulation indicate that there are significant differences in the migratory capacity of pollutants in fly ash with varying degrees of compression in distinct compressed soils, and significant variations in the migration behavior of different contaminants within the same column. These differences are primarily attributed to the intrinsic chemical properties of the contaminants and their interactions with the soil matrix34 (Wang N, 2020). Specifically, the mobility and sorption characteristics of organic compounds, inorganic salts, and heavy metals present in leachate vary, resulting in differing travel velocities and distances within the soil. Furthermore, Soil structure, particle size, specific surface area, porosity, and the properties of the interacting liquid also influence contaminant migration35,36 (Liu P, 2020; Emmanuel E ,2020). The degree of compaction of soil and fly ash is different, the porosity is different, and the permeability is different, and the dissolution degree of pollutants will be affected. The more compacted the soil and fly ash are, the less porous and less permeable they are. In response, the mobility and adsorption properties of pollutants in fly ash are affected. In the ash column with high compactness, SO42− and F− still have a high residual amount even after a long time of leaching. This may be because the increase of fly ash compactness reduces the specific surface area of contact between fly ash particles and leachate, reduces the efficiency of leaching, and slows down the release rate of pollutants. At the same time, the reaction time of the ash column with high compaction degree lags behind. During the compaction process, the migration path of SO42− becomes longer and the migration rate decreases, thus reducing the environmental release of pollutants. The release of F− may involve rapid dissolution of soluble fluoride followed by slow release of insoluble fluoride. When the degree of compaction is high, the rapid release phase of early leaching is shortened and the stable release of insoluble fluoride becomes the main process, resulting in a more stable release process. On the other hand, within the same ash column, the concentrations of SO42− and F− ions are high, characterised by strong solubility. High ion concentrations reduce the electrostatic interactions between soil particles, and the heavy metals in the ash form tightly bound hydrates upon contact with water, making the soil more porous and thus increasing its permeability, resulting in higher concentrations compared to other elements37,38 (Liu et al., 2015; Ajitha, A.R., 2019). The release of heavy metals such as nickel and lead may be delayed due to limited internal diffusion, resulting in altered release rates and depth distributions.
Under extreme continuous rainfall conditions, the maximum transport depth of pollutants can be up to 56 cm, posing a threat to environmental safety. However, further research is needed to confirm these findings. Contaminants can reach the groundwater standard Class III when transported to a depth of approximately 0.30 m. Although this distance is less than the minimum design thickness of 1.5 m for the liner in current Chinese landfill standards, this result was obtained under laboratory conditions with a single event of continuous rainfall and an assumed leachate head of 5 cm. In addition to the critical importance of leachate hydraulic head of landfill39 (Shi S, et al., 2023) and the influence of contaminant properties on the hydraulic conductivity of soil liners9 (Özçoban, et al., 2022), in real-world scenarios, especially under extreme rainfall conditions, there is a significant likelihood of rapid contaminant migration and degradation of groundwater quality, potentially leading to deeper contaminant infiltration than anticipated.
Requirements for liner thickness and saturated hydraulic conductivity vary from country to country, but most countries, including China, use a hydraulic conductivity of less than 10− 7 cm/s as the standard for controlling landfill leakage. The subsoil at the Guofeng power plant site, characterised as silty clay, has a permeability coefficient of 6.031 × 10− 7 cm/s even when compacted to its maximum dry density, which does not quite meet the requirement of less than 10− 7, but is close. Assuming k = 10− 7cm/s and h = 1.5 m as the “standard” design parameters for compacted soil liners in China, localised solutions could be implemented at the Guofeng power plant for landfilling. These include the use of local compacted Malan loess together with geosynthetic materials, or increasing the thickness of the liner much more than 1.5 m to compensate for deficiencies in the hydraulic conductivity in accordance with the principles of pollution control equivalence.
Conclusion
This study investigated the leaching characteristics of coal ash and the contaminant migration patterns, taking into account the compaction conditions at each stage of the coal ash storage site. Predictions of pollutant concentrations at different depths were confidently made, while acknowledging the potential for variability in the results.
Fly ash leachate extraction tests concludes that the concentrations of six contaminants (Cd, Pb, Cr, Ni, fluoride, sulfate) in the coal ash leachate exceeded the Groundwater Quality Criteria Class III. Furthermore, Compressed coal fly ash and its underlying Ma’lan Loess increased the outflow time of the contaminants, and a negative correlation was found between compaction and outflow rate. The compaction factor of fly ash ranges from 0.752 to 0.956, the flow rate of leachate can be drastically reduced by two orders of magnitude. It is crucial to maintain a compaction factor of at least 0.8 to minimize the environmental impact. Based on the simulation results, at a compaction factor of 0.943, equivalent to a hydraulic conductivity of 6.031 × 10− 7, after 21 days of continuous leaching, the contaminants and heavy metals have the potential to migrate and diffuse to the depth of 56 cm, not yet exceeds the current design range for the bottom loess isolation layer in our country. Integrating the actual situation, the Guofeng Power plant can use local compacted Malan loess, along with geosynthetic materials or thicker liners, to improve imperviousness for fly ash landfilling, it is important to control the leachate hydraulic head, increase the liner thickness and consider contaminant characteristics to ensure long-term stability and environmental safety.
Electronic supplementary material
Below is the link to the electronic supplementary material.
Acknowledgements
We gratefully acknowledge the financial support and thank Engineers Jianwei Meng,Senior Engineer Dawei Liang, and Researcher Jun Zhu for aiding in conducting this research. We also thank the editors and peer reviewers for their time, careful work and helpful suggestions.We would like to thank Dinaz Qureshi, editorial contributor Advisor, for his guidance.
Author contributions
All authors contributed to the study conception and design. Material preparation, data collection were performed by X.S., G.J., data analysis were performed by X.S., W.A and S.H. The first draft of the manuscript was written by X.S and all authors commented on previous versions of the manuscript. All authors read and approved the final manuscript.
Funding
This work was supported by the Fundamental Research Program of Shanxi Province (Grant numbers [202303021211196]).
Data availability
Data is provided within the manuscript or supplementary information files.
Declarations
Competing interests
The authors declare no competing interests.
Footnotes
Publisher’s note
Springer Nature remains neutral with regard to jurisdictional claims in published maps and institutional affiliations.
References
- 1.Dwivedi, A. & Jain, M. K. Fly ash–waste management and overview: a review. J. Recent. Res. Sci. Technol.6, 30–35 (2014). [Google Scholar]
- 2.Zhao, S. et al. Chemical speciation and leaching characteristics of hazardous trace elements in coal and fly ash from coal-fired power plants. J. Fuel. 232, 463–469 (2018). [Google Scholar]
- 3.Vukašinović-Pešić, V. & Rajaković, L. Chemical composition and some trace element contents in coals and coal ash from tamnava-zapadno polje coal field, Serbia. J. Energ. Source Part. A. 31, 1583–1589 (2009). [Google Scholar]
- 4.Huggins, F. & Goodarzi, F. Environmental assessment of elements and polyaromatic hydrocarbons emitted from a Canadian coal-fired power plant. J. Int. J. Coal Geol.77, 282–288 (2009). [Google Scholar]
- 5.Ćujić, M., Dragović, S., Đorđević, M., Dragović, R. & Gajić, B. Environmental assessment of heavy metals around the largest coal fired power plant in Serbia. J. CATENA. 139, 44–52 (2016). [Google Scholar]
- 6.Gopinathan, P. et al. Geochemical, mineralogical and toxicological characteristics of coal fly ash and its environmental impacts. Chemosphere307, 135710. 10.1016/j.chemosphere.2022.135710 (2022). [DOI] [PubMed] [Google Scholar]
- 7.Hassett, D. J. Scientifically valid leaching of coal conversion solid residues to predict environmental impact. J. Fuel Process. Technol.39, 445–459 (1994). [Google Scholar]
- 8.Locatelli, L. et al. A simple contaminant fate and transport modelling tool for management and risk assessment of groundwater pollution from contaminated sites. J. J. Contam. Hydrol.221, 35–49 (2019). [DOI] [PubMed] [Google Scholar]
- 9.Özçoban, M. Ş., Acarer, S. & Tüfekci, N. Effect of solid waste landfill leachate contaminants on hydraulic conductivity of landfill liners. J. Water Sci. Technol.85, 1581–1599 (2022). [DOI] [PubMed] [Google Scholar]
- 10.Mitchell, J. K., Hooper, D. R. & Campenella, R. G. Permeability of compacted clay. J. J. Soil. Mech. Found. Div.91, 41–65 (1965). [Google Scholar]
- 11.Daniel, D. E. In situ hydraulic conductivity tests for compacted clay. J. J. Geotech. Eng.115, 1205–1226 (1989). [Google Scholar]
- 12.Benson, C. H., Zhai, H. & Wang, X. Estimating hydraulic conductivity of compacted clay liners. J. J. Geotech. Eng.120, 366–387 (1994). [Google Scholar]
- 13.Mohammed, S. A. S. & Moghal, A. A. B. Efficacy of nano calcium silicate (NCS) treatment on tropical soils in encapsulating heavy metal ions: leaching studies validation. J. Innov. Infrastruct. So. 1, 1–12 (2016). [Google Scholar]
- 14.Deka, A. & Sekharan, S. Contaminant retention characteristics of fly ash–bentonite mixes. J. Waste Manage. Res.35, 40–46 (2017). [DOI] [PubMed] [Google Scholar]
- 15.Najafi, E. K., Chenari, R. J. & Arabani, M. Sorption kinetics of lead and zinc ions by clay-fly ash geopolymers. J. Environ. Eng. Sci.38, 729–741 (2021). [DOI] [PubMed] [Google Scholar]
- 16.Marques, J. P., Rodrigues, V. G., Raimondi, I. M. & Lima, J. Z. Increase in Pb and Cd adsorption by the application of peat in a tropical soil. J. Water Air Soil. Pollut. 231, 1–21 (2020). [Google Scholar]
- 17.Li, K., Lu, H., Zhang, Q. & Li, J. Adsorption of cd (II) and Cu (II) onto clay modified with sludge activated carbon. J. KSCE J. Civ. Eng.24, 1706–1716 (2020). [Google Scholar]
- 18.Guarena, N., Dominijanni, A. & Manassero, M. From the design of bottom landfill liner systems to the impact assessment of contaminants on underlying aquifers. Innov. Infrastruct. Solut.5, s41062–s41019. 10.1007/s41062-019-0251-y (2020). [Google Scholar]
- 19.Marques, J. P., Nauerth, I. M. R., Kasemodel, M. C. & Rodrigues, V. G. S. Systematic review of alternative materials that improve retention of potentially toxic metals in soil/clay liners in waste disposal areas. J. Environ. Monit. Assess.196, 394 (2024). [DOI] [PubMed] [Google Scholar]
- 20.Okada, T. & Tomikawa, H. Leaching characteristics of lead from melting furnace fly ash generated by melting of incineration fly ash. J. J. Environ. Manage.110, 207–214 (2012). [DOI] [PubMed] [Google Scholar]
- 21.Neupane, G. & Donahoe, R. J. Leachability of elements in alkaline and acidic coal fly ash samples during batch and column leaching tests. J. Fuel. 104, 758–770 (2013). [Google Scholar]
- 22.Singh, M. K., Kumar, S. & Ratha, D. Physiochemical and leaching characteristics of fly and bottom ash. J. Energ. Source Part. A. 38, 2377–2382 (2016). [Google Scholar]
- 23.Kumar, S., Kumar, K. & Gupta, M. Characterization of heavy metal trace elements in the fly ash from a thermal power plant. J. Energ. Source Part. A. 38, 2370–2376 (2016). [Google Scholar]
- 24.Akın, S. Ş., Magalhaes, D. & Kazanc, F. A study on the effects of various combustion parameters on the mineral composition of Tunçbilek fly ash. Fuel275, 117881. 10.1016/j.fuel.2020.117881 (2020). [Google Scholar]
- 25.Ju, T. et al. Analysis of enrichment, correlation, and leaching patterns of rare earth elements in coal fly ash assisted by statistical measures. Sci. Total Environ.902, 166070. 10.1016/j.scitotenv.2023.166070 (2023). [DOI] [PubMed] [Google Scholar]
- 26.Popovic, A., Djordjevic, D. & Polic, P. Trace and major element pollution originating from coal ash suspension and transport processes. J. Environ. Int.26, 251–255 (2001). [DOI] [PubMed] [Google Scholar]
- 27.Ward, C. R. et al. Element mobility from fresh and long-stored acidic fly ashes associated with an Australian power station. J. Int. J. Coal Geol.80, 224–236 (2009). [Google Scholar]
- 28.Silva, L. F. O. et al. The occurrence of hazardous volatile elements and nanoparticles in Bulgarian coal fly ashes and the effect on human health exposure. J. Sci. Total Environ.416, 513–526 (2012). [DOI] [PubMed] [Google Scholar]
- 29.Dragović, S. et al. Trace element distribution in surface soils from a coal burning power production area: a case study from the largest power plant site in Serbia. J. CATENA. 104, 288–296 (2013). [Google Scholar]
- 30.Li, Z., Ma, Z., van der Kuijp, T. J., Yuan, Z. & Huang, L. A review of soil heavy metal pollution from mines in China: pollution and health risk assessment. J. Sci. Total Environ.468, 843–853 (2014). [DOI] [PubMed] [Google Scholar]
- 31.Liang, Z., He, X. & Ni, J. Change of crystallinity and mineral composition of fly ash with mechanical and chemical activation for the improvement of phosphate uptake. J. Waste Manage. Res.28, 901–907 (2010). [DOI] [PubMed] [Google Scholar]
- 32.Li, P., Li, T. & Vanapalli, S. K. Prediction of soil-water characteristic curve for Malan loess in Loess Plateau of China. J. J. Cent. South. Univ.25, 432–447 (2018). [Google Scholar]
- 33.Van Genuchten, M. T. A closed-form equation for predicting the hydraulic conductivity of unsaturated soils. J. Soil. Sci. Soc. Am. J.44, 892–898 (1980). [Google Scholar]
- 34.Wang, N. et al. Leachability and adverse effects of coal fly ash: A review. J Hazard Mater. 396, 122725; (2020). 10.1016/j.jhazmat. 122725 (2020). [DOI] [PubMed]
- 35.Liu, P., Wang, Q., Jung, H. & Tang, Y. Speciation, distribution, and mobility of hazardous trace elements in coal fly ash: insights from Cr, Ni, and Cu. J. Energy Fuels. 34, 14333–14343 (2020). [Google Scholar]
- 36.Emmanuel, E., Anggraini, V., Asadi, A. & Raghunandan, M. E. Interaction of landfill leachate with olivine-treated marine clay: suitability for bottom liner application. Environ. Technol. Inno. 17, 100574. 10.1016/j.eti.2019.100574 (2020). [Google Scholar]
- 37.Liu, Y., Bouazza, A., Gates, W. P. & Rowe, R. K. Hydraulic performance of geosynthetic clay liners to sulfuric acid solutions. J. Geotext. Geomembranes. 43, 14–23 (2015). [Google Scholar]
- 38.Ajitha, A. R., Chandrakaran, S. & Sheela, E. Y. Impact of lead on the geotechnical properties and adsorption characteristics of landfill liner. J. Int. J. Appl. Eng. Res.14, 3104–3110 (2019). [Google Scholar]
- 39.Shu, S., Peng, C., Liu, H. & Meng, L. Breakthrough times for barrier systems at typical municipal solid waste landfills in China. J. Environ. Sci. Pollut R. 30, 58773–58782 (2023). [DOI] [PubMed] [Google Scholar]
Associated Data
This section collects any data citations, data availability statements, or supplementary materials included in this article.
Supplementary Materials
Data Availability Statement
Data is provided within the manuscript or supplementary information files.