

ABSTRACT
Gut inflammation is a salient prodromal feature of Parkinson's disease (PD) implicated in pathologic processes leading to nigrostriatal dopaminergic degeneration. However, existing rodent models of PD are suboptimal for investigating the interaction between gut inflammation and neuropathology. This study aimed to develop a rat model of PD in which gut inflammation exacerbated PD symptoms induced by a parkinsonian lesion. This was achieved by combining the 6‐hydroxydopamine (6‐OHDA) rat model for PD and the dextran sodium sulfate (DSS) rat model for colitis. The model was characterised using behavioural tests, including reaching, step, gait, open‐field and cylinder tests, plus stereological quantification of substantia nigra (SN) DA neurodegeneration, and histological analysis of SN microglial activation and distal colon morphology. The combination of 6‐OHDA and DSS resulted in greater stool softening and bleeding, shorter colons and greater distal colon histological damage, when compared with the 6‐OHDA model. Additionally, 6‐OHDA and DSS rats displayed similar DA neurodegeneration, yet less SN microglial activation, when compared to 6‐OHDA rats that did not receive DSS. Finally, DSS + 6‐OHDA rats exhibited impaired forelimb motor function compared with 6‐OHDA rats, with decreased performance in reaching and step tests. In conclusion, DSS administration exacerbated forelimb motor dysfunction in 6‐OHDA rats. Behavioural changes in DSS + 6‐OHDA rats were associated with lower levels of microglial activation and similar levels of dopamine depletion compared with 6‐OHDA‐only rats. These results support that the DSS + 6‐OHDA rat model is a promising PD animal model to investigate deleterious gut–brain interactions in PD.
Keywords: 6‐OHDA, behavioural rat, dextran sodium sulfate, inflammatory bowel disease, Parkinson's disease

Abbreviations
- 6‐OHDA
6‐hydroxydopamine
- AP
anterior–posterior
- CNS
central nervous system
- DA
dopamine
- DAB‐Ni
diaminobenzidine nickel
- DSS
dextran sodium sulfate
- DV
dorsal–ventral
- ENS
enteric nervous system
- GI
gastrointestinal
- GM‐CSF
granulocyte‐macrophage colony‐stimulating factor
- H&E
haematoxylin and eosin
- HRP
horseradish peroxidase
- Iba1
ionized calcium‐binding adaptor molecule 1
- IL
interleukin
- IBD
inflammatory bowel disease
- MCP
monocyte chemoattractant protein
- ML
medial–lateral
- PBS
phosphate buffer saline
- PD
Parkinson's disease
- PFA
paraformaldehyde
- RT
room temperature
- SN
substantia nigra
- SNr
substantia nigra pars reticulata
- SNc
substantia nigra pars compacta
- TH
tyrosine hydroxylase
- TLR4
toll‐like receptor 4
- VTA
ventral tegmental area
1. Introduction
Parkinson's disease (PD) is a chronic and progressive neurodegenerative disease with a global age‐standardised prevalence of 138.6 per 100,000 people (Xu et al. 2024). PD is characterised by the selective and cumulative decline in dopamine (DA) neurons within the substantia nigra pars compacta (SNc) and ventral tegmental area (VTA), in conjunction with Lewy body inclusions (Bloem, Okun, and Klein 2021; Damier et al. 1999; Lewandowsky 1912). Despite valiant attempts, there are no approved disease‐modifying therapies for PD (Giladi et al. 2023; Pagano et al. 2022). Due to an ageing population and increasing global incidence of PD, early diagnosis, management and prophylactic treatment of PD pose increasingly important focuses for research.
A complex, bidirectional link between the central nervous system (CNS) and enteric nervous system (ENS), termed the ‘gut–brain axis’, has implicated gastrointestinal (GI) inflammation in the pathogenesis of parkinsonian neurodegeneration (Kip and Parr‐Brownlie 2022, 2023; Smith and Parr‐Brownlie 2019). People diagnosed with inflammatory bowel disease (IBD) have a 17% increased risk of subsequently being diagnosed with PD. Systemic inflammation is suggested to underlie this relationship, since the risk of PD is greatly reduced among people with IBD if they have previously received immunosuppressive therapies (Park et al. 2019; Peter et al. 2018). Moreover, GI dysfunction is common among people with PD and includes constipation, abnormal gut and faecal microbiome composition, elevated faecal calprotectin levels, increased colon glial markers and pro‐inflammatory cytokine mRNA expression and increased intestinal permeability (Devos et al. 2013; Gorecki et al. 2019; Hasegawa et al. 2015; Hor et al. 2022; Keshavarzian et al. 2015; Peter et al. 2018; Schwiertz et al. 2018; Unger et al. 2016).
Despite the emerging significant relationship between GI inflammation and PD pathology, no current animal model of PD purposefully exhibits chronic gut inflammation. Consequently, existing and future research is limited to replicating an incomplete pathology of PD. This study addresses this significant gap in PD research through the development of a novel animal model for PD in which chronic gut inflammation exacerbates parkinsonian symptoms. This was achieved by combining the well‐established 6‐hydroxydopamine (6‐OHDA) rat model for PD with the Ghattamaneni, Panchal, and Brown (2019) dextran sulfate sodium (DSS) model for IBD to produce the DSS + 6‐OHDA rat model for PD.
To our knowledge, no studies have assessed the effect of DSS on 6‐OHDA or MPTP models of PD. Adjacently, Dwyer et al. (2021) evaluated the impact of DSS on a dual lipopolysaccharide and paraquat toxic model of PD. Male mice received DSS (25% in tap‐water) for 5 days prior to murine model induction. DSS markedly altered the gut microbiome, worsened behaviour test performance and increased SNc microglia activation and serum cytokines. It did not alter SNc DA neurodegeneration. As such, this study aimed to address the gap in PD research by providing a novel gut–brain rat model for PD.
2. Materials and Methods
2.1. Animals
One‐month‐old male Wistar rats (n = 20) were housed in a reverse 12‐h light/dark cycle and had restricted food (15 g/day) for 24 h prior to behavioural tasks to ensure motivation during tasks and otherwise had ad libitum food and water access. Experiments were conducted during the dark cycle. Rats were weighed and checked for well‐being and behavioural signs three times weekly. Prior to surgery, rats were housed in groups of two to four; following surgery, they were housed in pairs in a split dual cage to enable social stimulation while providing the benefits of individual housing. All experiments were approved by the Animal Ethics Committee at the University of Otago, New Zealand.
2.2. Experimental Design
Rats were randomly assigned to 1 of 3 groups: tap‐water + vehicle injection (n = 6; termed ‘control’), tap‐water + 6‐OHDA (n = 7; termed ‘6‐OHDA’) or DSS + 6‐OHDA (n = 7; termed ‘DSS + 6‐OHDA’). Rats were on experiment for 8 weeks in total. In Week 1, rats were trained for the step test, reaching and gait analysis. Training was not required for open‐field and cylinder tests, although baseline open‐field data were obtained. DSS treatment began in the second week. Behavioural assessments for prelesion motor performance (step test, reaching, gait analysis and open‐field) were conducted in Week 4. Rats received a unilateral intrastriatal 6‐OHDA or sham lesion during Week 5. In Weeks 6–8, behavioural assessments for postlesion motor performance (step test, reaching, gait analysis and open‐field) were conducted weekly. Rats completed a cylinder test once during Week 8.
2.3. Behavioural Characterisation of the DSS + 6‐OHDA Model
2.3.1. Reaching Test
The reaching task, as described by Hyland et al. (2019), was conducted to measure the extent of forelimb akinesia. Training involved six sessions over 1 week (5 min/experiment) to identify their dominant paw prior to the lesion. Rats were placed in a Perspex box (17 × 27 × 40 cm) with a rectangular opening in the wall through which they reached to recover a cereal pellet (Coco Pops; Kellogg's) from a platform. Reaches were recorded as the disruption of an infrared beam situated between the opening and the pellet, which was converted to a TTL signal and recorded using a CED Power1401 (Cambridge Electronic Design) and Spike 2 software (Cambridge Electronic Design). Dominant paw reaches were recorded as manually entered keystrokes.
2.3.2. Step Test
Rats were first trained to perform the step test for 6 training sessions over 1 week, as described by Olsson et al. (1995), to measure the extent of forelimb akinesia. Briefly, rats were held in both hands while restricting the hindlimbs and one forelimb, leaving the free forelimb to bear the weight. The rat was moved slowly along a 1‐m surface, ensuring the free forelimb constantly contacted the surface. For each experiment, this was repeated five times in forehand and backhand positions for both dominant and nondominant forelimbs. The number of adjusting steps was counted for both directions and limbs. The step ratio was calculated as the mean number of adjusting steps made by each paw per trial for each rat, within each group.
2.3.3. Cylinder Test
The cylinder test was conducted to measure the extent of forelimb akinesia, as described by Schallert and Tillerson (2000). Unhabituated rats were placed in a Perspex cylinder (19 × 30 cm). The rat was videotaped from beneath the cylinder for 5 min. The number of wall touches during rears made by dominant and nondominant paws and simultaneous paw touches was manually counted. The cylinder test result was calculated as the mean number of wall touches made by the dominant paw or simultaneous paw touch in 5 min, within each group.
2.3.4. Gait Analysis
To measure gait parameters during locomotion the CatWalk XT (Noldus Information Technology) was used following the protocol detailed in Zhou et al. (2015). The CatWalk software analysed both forelimb and hindlimb locomotion; however, the current study focused on hindlimb gait kinetics as forelimb function was assessed by the step, reaching and cylinder tests. Rats walked along a Perspex walkway (130 × 68 × 152 cm) to recover cereal pellets (Coco Pops; Kellogg's). The walkway floor was a glass plate (130 × 20 × 0.5 cm) illuminated by green light, which reflected the areas of glass touched for footprint detection. Footprint patterns were recorded and quantitatively analysed using computerised CatWalk XT software. Gait parameters assessed included stride length, swing speed and intensity (a measure of weight bearing preference) for both dominant and nondominant hindlimbs (Klein et al. 2009; Zhou et al. 2015). Rats were first trained to walk along the walkway consistently for five uninterrupted runs (10 min/experiment) over 1 week. Rats were recorded for five runs per experiment. A successful run was defined as a run that was uninterrupted, spanned the entire walkway and did not contain any hesitation (Zhou et al. 2015). Gait data were collected prior to the lesion and 2 weeks postlesion.
2.3.5. Open‐Field Activity
Open‐field activity, as described by Tamás et al. (2005), was assessed to measure the extent of hypokinesia. Rats were placed in a monitoring box (45 × 45 × 55 cm), and locomotion was recorded for 10 min via Ethovision XT automated computerised video tracking system (Noldus Information Technology). Rats underwent initial habituation to the monitoring box for 30 min, prior to commencing the behavioural testing period. Behavioural parameters included total distance travelled, mean movement velocity and total duration of rearing.
2.4. DSS‐Induced Gut Dysfunction
Gut inflammation was induced following the protocol previously described by Ghattamaneni, Panchal, and Brown (2019), whereby rats were administered DSS (1%; TdB Consultancy) in drinking water for a total of 6 weeks. Rat stools were examined daily in the first week following the commencement of DSS treatment and then subsequently every 3 days, to evaluate the onset and progression of gut dysfunction. DSS treatment ceased 1 week prior to perfusion. Stool was scored on consistency and bleeding (Table 1) (Ghattamaneni, Panchal, and Brown 2019).
TABLE 1.
Definitions of stool scores.
| Score | Stool consistency | Stool bleeding |
|---|---|---|
| 0 | Formed | Normal colour |
| 1 | Mild‐soft | Brown colour |
| 2 | Very soft | Red colour |
| 3 | Diarrhoea | Blood red |
2.5. 6‐OHDA‐Induced PD
Unilateral dopaminergic lesions of the striatum were conducted by injecting the neurotoxin 6‐OHDA contralateral to the dominant paw using aseptic surgical techniques (Bosch‐Bouju et al. 2014; Parr‐Brownlie et al. 2022). Rats were anaesthetised with ketamine/domitor (75 mg/kg s.c. ketamine; PhoenixPharm; 0.5 mg/kg s.c. domitor; Zoetis) and lignocaine (4 mg/kg s.c.; Ethical Agents Veterinary Marketing Ltd) was injected along the shaved incision line. The rat was positioned in a stereotaxic frame in the flat skull position and ophthalmic ointment (Alcon Laboratories) was applied to both eyes. Amphroprim (30 mg/kg s.c.; Virbac Animal Health) and buprenorphine (0.05 mg/kg s.c.; Indivio) were administered. The skull was exposed by a sagittal incision. The skull was cleaned with saline and ethanol, and exposed blood vessels were cauterised. Bregma and lambda were identified. A hole was drilled into the skull above the dorsolateral striatum contralateral to the dominant paw (0.4 mm AP, 3.0 mm ML and 6.2 mm DV, relative to bregma or dura). Bone chips and dura were removed from the hole. 6‐OHDA (6‐mg/mL 0.9% saline containing 0.1% ascorbic acid, total volume of 3 μL; Sigma) was injected via a cannula and Hamilton syringe (1 μL/min; World Precision Instruments). The cannula was kept in place for an additional 3 min to allow sufficient time for 6‐OHDA diffusion. The cannula was removed, and the incision site was sutured using sterile monofilament suture (WEGO‐PGCL; Foosin Medical Supplies). The rat was removed from the ear bars and received an injection of saline (6–10 mL s.c.) and antisedan (2.5 mg/kg s.c.; Zoetis). Rats were returned to a single‐housing cage for recovery, were postoperatively monitored twice daily for 5 days and received buprenorphine (0.05 mg/kg s.c.; Indivio) twice daily for 3 days.
2.6. Histology
2.6.1. Perfusion and Tissue Preparation
Following behavioural data collection, rats were deeply anesthetised with sodium pentobarbital (100 mg/kg, i.p.; Provet NZ Pty Limited). After a midline abdominal incision, the colon was removed, its length (cm) was measured, and the distal portion (~2 cm) was removed and suspended in paraformaldehyde (PFA; 4%; Sigma‐Aldrich). A blood sample (3 mL) was taken from the heart. The rat was then transcardially perfused with phosphate‐buffered solution (PBS) and PFA. Brains and distal colons were stored overnight in PFA (4%) and then transferred to sucrose (30%; LabServ). Fixed colon tissue was coronally sectioned (20 μm) using a cryostat (CM1950; Leica Biosystems), mounted onto slides and stored at −20°C. Fixed substantia nigra (SN) tissue was coronally sectioned (40 μm) using a vibratome or cryostat (Leica Biosystems). SN sections were stored free‐floating in wells containing cryoprotectant at −20°C. The blood sample was centrifuged, and plasma was collected and stored at −20°C.
2.6.2. Structural Analysis of Colon Epithelium
Haematoxylin and eosin (H&E) staining was performed on distal colon sections (Ghattamaneni, Panchal, and Brown 2019). Sections were imaged using a brightfield microscope (20X objectives; Nikon) to observe morphological changes in the colon epithelium. Sections were scored for histological damage on the following parameters: crypt architecture, crypt abscess, inflammatory cell infiltration, goblet cell depletion and muscle thickness (Table 2) (Kim et al. 2012). Following scoring, a total histological damage score was calculated as the sum of individual parameters. A total score of 0–5 indicates absent or minimal gut inflammation, a total score of 5–10 indicates moderate gut inflammation, and a total score of 10–15 indicates severe gut inflammation (Kim et al. 2012).
TABLE 2.
Definitions of colon histological damage scores.
| Score | Crypt architecture | Crypt abscess | Inflammatory cell infiltration | Goblet cell depletion | Muscle thickness |
|---|---|---|---|---|---|
| 0 | Normal | Absent | Normal | Absent | Normal |
| 1 | Minor changes | Minor abscess | Minor increase in inflammatory cells | Minor loss of goblet cells | Minor increase in thickness |
| 2 | Moderate disruption in crypt architecture | Moderate abscess | Moderate inflammatory infiltrates | Moderate loss of goblet cells | Moderate increase in thickness |
| 3 | Severe damage, smooth epithelial lining | Severe crypt abscesses in epithelium | Significant inflammatory infiltrates | Severe loss/absence of goblet cells | Significant increase in thickness |
2.6.3. Stereological Quantification of SN Dopaminergic Cell Lesion
Chromagen immunohistochemical staining was performed on SN sections to stain for tyrosine hydroxylase (TH), a marker for dopaminergic cells in the SN (Bosch‐Bouju et al. 2014; Parr‐Brownlie et al. 2022). Sections were incubated overnight at 4°C with a rabbit anti‐TH primary antibody (1/500 dilution; EMD, Millipore Corp; #657012). Sections were then incubated for 4 h at room temperature (RT) with a goat anti‐rabbit HRP (horseradish peroxidase) secondary antibody (1/500 dilution; Abcam; ab97051). Finally, sections were incubated in a 3,3‐diaminobenzidine nickel (DAB‐Ni) substrate (Vector Laboratories) for 90 s. Sections were mounted on slides and cover slipped. To determine the extent of the SNc dopaminergic cell lesion, blinded and unbiased stereological quantification using the StereoInvestigator Software (Version 10.0, MicroBrightField Inc., Williston, Vermont, USA) and brightfield microscope (Nikon) was conducted. The count was performed using a counting frame of 50 × 50 μm with a dissector height of 20 μm and a uniform random sampling grid of 150 × 150 μm (optical dissector volume of 50,000 μm3; sampling grid area of 22,500 μm2). Scheaffer's coefficient of error ranged between 0.056 and 0.188. SNc regions were defined following the Paxinos and Watson (2006) stereotaxic rat brain atlas, and cell counts were compared between the lesioned and nonlesioned hemispheres.
2.6.4. Semi‐Quantitative Analysis of Microglial Activation in SN
Fluorescent immunohistochemical staining was performed on SNc and substantia nigra pars reticulata (SNr) sections to stain for ionised calcium‐binding adaptor molecule 1 (Iba1), a marker for microglial activation (Ahmed et al. 2007). The SNr was assessed in conjunction with the SNc to evaluate microglial activation that may have affected DA neurons and processes more globally. Sections were incubated overnight at 4°C with a rabbit anti‐Iba1 primary antibody (1/1000 dilution; Wako; #019‐19741). Sections were then incubated for 4 h at RT with a DyLight 594 goat anti‐rabbit IgG (H + L) secondary antibody (1/1000 dilution; Vector Laboratories; DI‐1594). Finally, sections were mounted on slides and cover slipped with ProLong Gold Antifade Mountant (ThermoFisher). Imaging of Iba1‐positive cells in the SN was performed using a fluorescence microscope (20X objectives; Nikon Ti2E Inverted). Microglial activation in the SNc and SNr was quantified using FIJI ImageJ software (U.S. National Institutes of Health) to calculate the percentage area (%Area) and mean fluorescent intensity (Au) of Iba1 staining. %Area indicates the density and expression of fluorescent cells in a defined area. Au measures brightness and is used to ensure background fluorescence does not influence %Area data.
Microglial morphology was assessed following methods by Reddaway et al. (2023) and Savage, Carrier, and Tremblay (2019) and characterised as resting, hyper‐ramified or reactive. Resting microglia have small somata with thin branching processes. Hyper‐ramified microglia are at an intermediate state between resting and reactive morphologies, appearing ‘bushy’ with thickened processes. Reactive, or activated, microglia have retracted processes with large somata.
2.6.5. Multiplex Inflammation Assay
Plasma samples underwent cytokine analysis using the LEGENDplex rat inflammation panel with V‐bottom plate (LEGENDplexTM Rat Panel; BioLegend). The inflammatory markers assessed were IL‐1α, IL‐17A, IL‐18, IL‐33, CCL2 (MCP‐1) and GM‐CSF. The assay was performed following the manufacturer's protocol using biotinylated detection antibodies. Plasma cytokine levels were quantified using flow cytometry (BD LSRFortessa Cell Analyzer; BD Biosciences, California) and analysed using LEGENDplex data analysis software (BioLegend).
2.7. Statistical Analysis
Data are displayed as means ± standard error of the mean (SEM). According to tests of normality, data were normally distributed. One‐way ANOVAs with Holm–Šidák post hoc tests were applied to cylinder test data, colon length, histological damage score, number of TH‐positive cells in lesioned and nonlesioned SNc and plasma cytokine levels. Additionally, a Spearman's correlation coefficient was calculated to determine the relationship between colon length and histological damage score. Two‐way ANOVAs with Holm–Šidák post hoc tests were applied to stool consistency and bleeding data, step test and gait data and %Area and Au of Iba1 fluorescence in lesioned and nonlesioned SNc and SNr. Mixed‐effects models and Holm–Šidák post hoc tests were applied to reaching data and each open‐field parameter.
3. Results
3.1. DSS‐Induced Gut Dysfunction
DSS (1%) produced time‐dependent increases in scores for stool consistency and blood in stools (Figure 1). Control rats maintained normal stool consistency and had no blood in their stools throughout the observation period. 6‐OHDA rats showed no changes in stool bleeding, however, did show a relatively small, albeit nonsignificant, increase in stool consistency at Weeks 7 and 8. Importantly, DSS + 6‐OHDA rats exhibited a marked and progressive change, with soft, bloody stools from Week 3 (two‐way ANOVA, p < 0.0001).
FIGURE 1.

Effect of 1% DSS treatment and/or 6‐OHDA lesion on stool characteristics: (A) stool consistency and (B) bleeding, in control, 6‐OHDA and DSS + 6‐OHDA rats. Data are displayed as mean ± SEM, n = 6–7. Holm–Šidák post hoc test: control vs. DSS + 6‐OHDA (#### p < 0.0001); 6‐OHDA vs. DSS + 6‐OHDA (†††† p < 0.0001). DSS treatment commenced in Week 1, lesion surgery occurred in Week 4 and DSS treatment ceased in Week 7.
Differences in colon lengths were observed across the groups (Figure 2). Compared to controls (18.1 cm), 6‐OHDA rats showed a significant (14%) decrease in colon length. DSS + 6‐OHDA rats exhibited the shortest colon length, which was 30% shorter than controls (Figure 2A; two‐way ANOVA, p = 0.0125 and p < 0.0001, compared to 6‐OHDA and controls). Control rats had histologically normal colons (Figure 3). Colons of 6‐OHDA rats showed minimal gut inflammation (Figures 2B and 3). In contrast, the colons of DSS + 6‐OHDA rats had the highest mean histological damage score, exhibiting significant loss of epithelial layers and branched crypts, crypt and mucosa atrophy, inflammatory cell infiltration, goblet cell deletion and increased muscle thickness (Figures 2B and 3, Table 3; one‐way ANOVA, p < 0.0001). Finally, a significant nonlinear inverse correlation was found between colon length and histological damage score across the groups (Figure 2C). Control rats had the longest colons and lowest histological damage score, sequentially followed by 6‐OHDA rats and finally DSS + 6‐OHDA rats with the shortest colons and greatest histological damage score (Spearman's correlation, r = −0.6474, p = 0.0027).
FIGURE 2.
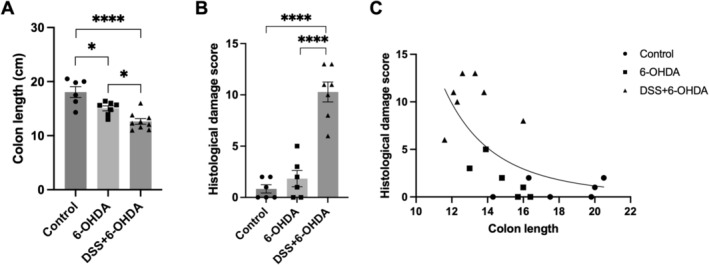
Effect of 1% DSS treatment and/or 6‐OHDA lesion on the distal colon of control, 6‐OHDA and for‐peer‐review DSS + 6‐OHDA rats. Length (A) and histology damage scores (B) were differentially affected but strongly correlated (C), across the groups. Data are displayed as mean ± SEM, n = 6–7. (A, B) Holm–Šidák post hoc test: *p < 0.05; **** p < 0.0001. (C) Spearman's correlation coefficient (n = 19): r = −0.6474, p = 0.0027; a log–log line was used.
FIGURE 3.

Effect of 1% DSS treatment and/or 6‐OHDA lesion on distal colon morphology. Representative images of H&E staining of the distal colon of control (A, D; black box), 6‐OHDA (B) and DSS + 6‐OHDA (C, E, F) rats, showing (A) normal crypt architecture (nc); (D) normal muscularity (nm) and normal goblet cells (ng); (B) crypt architecture disruption (cd), goblet cell depletion (gd) and inflammatory cell infiltration (ic); (C) crypt architecture disruption (cd), inflammatory cell infiltration (ic) and goblet cell depletion (gd); (E) muscle thickening (mt); and (F) crypt abscess (ca). The scale bars indicate 200 μm.
TABLE 3.
Quantification of distal colon histological damage and inflammation parameters in control, 6‐OHDA and DSS + 6‐OHDA rats. Data are displayed as mean ± SEM, n = 6–7.
| Parameter | Control | 6‐OHDA | DSS + 6‐OHDA |
|---|---|---|---|
| Crypt architecture | 0.5 ± 0.2 | 0.5 ± 0.2 | 2.3 ± 0.3 |
| Crypt abscess | 0.0 ± 0.0 | 0.2 ± 0.2 | 2.7 ± 0.2 |
| Inflammatory cell infiltration | 0.0 ± 0.0 | 0.5 ± 0.3 | 2.1 ± 0.1 |
| Goblet cell depletion | 0.2 ± 0.2 | 0.3 ± 0.2 | 1.7 ± 0.4 |
| Muscle thickness | 0.2 ± 0.2 | 0.3 ± 0.3 | 1.4 ± 0.3 |
| Total histological damage score | 0.9 ± 0.0 | 1.8 ± 0.1 | 10.2 ± 0.1 |
3.2. 6‐OHDA‐Induced Dopaminergic Neurodegeneration
As shown in Table 4 and Figure 4, when compared to controls, both 6‐OHDA and DSS + 6‐OHDA rats exhibited a similarly marked decrease, approximately 60%, in TH‐expressing cells in the lesioned SN (one‐way ANOVA, p = 0.0013, respectively).
TABLE 4.
Quantification of SN TH‐expressing cells following sham or 6‐OHDA lesion in control, 6‐OHDA and DSS + 6‐OHDA rats. Data are displayed as mean ± SEM, n = 6–7, 8–10 sections per animal.
| Injected hemisphere | Noninjected hemisphere | |
|---|---|---|
| Control | 26,307 ± 9184 | 25,803 ± 5525 |
| 6‐OHDA | 11,311 ± 2543 | 32,131 ± 3253 |
| DSS + 6‐OHDA | 10,207 ± 2899 | 44,006 ± 13,190 |
FIGURE 4.

Dopaminergic neuron degeneration by sham or 6‐OHDA lesion in control, 6‐OHDA and DSS + 6‐OHDA rats. Representative images of TH histological staining in coronal SN sections (approximately −5.20 mm from bregma) of (A, E) control, (B, F) 6‐OHDA and (C, G) DSS + 6‐OHDA rats. Note the right‐hand side is the hemisphere lesioned with vehicle or 6‐OHDA. (D) Stereological quantification of DA neuron degeneration in the SNc from control, 6‐OHDA and DSS + 6‐OHDA rats. TH expression in the lesioned SNc is presented as a proportion of TH expression in the nonlesioned hemisphere. Data are displayed as mean ± SEM, n = 6–7 rats, 8–10 sections per animal. Holm–Šidák post hoc test: **p < 0.005.
3.3. Motor Function
3.3.1. Reaching
To assess forelimb akinesia, reaching was assessed prelesion and 1 and 3 or 4 weeks postlesion (Figure 5A). Control animals exhibited consistent reaching performance across the three time points, making 84 ± 7 dominant paw reaches per experiment. Following 6‐OHDA lesion, and when compared with control rats, the number of dominant paw reaches decreased in 6‐OHDA and DSS + 6‐OHDA rats, with the latter exhibiting a greater reduction (61 ± 7 and 23 ± 4 dominant reaches per experiment, respectively). A mixed‐effects analysis highlighted a significant effect of group (F (2, 17) = 5.243, p = 0.0168), time point (F (2, 28) = 21.37, p < 0.0001) and group × time point interaction (F (4, 28) = 4.767, p = 0.0046). Post hoc analyses revealed that DSS treatment further exacerbated reaching impairment 1 week postlesion (p = 0.0453) and also at Weeks 3 and 4 (p = 0.0191) when compared with 6‐OHDA rats. These data indicated a significant interaction between DSS treatment and 6‐OHDA lesion that impaired reaching performance.
FIGURE 5.

Forepaw performance prior to and following vehicle or 6‐OHDA lesion in control, 6‐OHDA and DSS + 6‐OHDA rats. (A) Dominant forelimb reaching. (B) Step test. (C, D) Cylinder test dominant and simultaneous forepaw touches. Data are displayed as mean ± SEM, n = 6–7. Holm–Šidák post hoc tests. For reaching: control vs. DSS + 6‐OHDA (## p < 0.005); 6‐OHDA vs. DSS + 6‐OHDA († p < 0.05). For the step test: control vs. 6‐OHDA (*p < 0.05, **p < 0.005); control vs. DSS + 6‐OHDA (# p < 0.05, ## p < 0.005); 6‐OHDA vs. DSS + 6‐OHDA († p < 0.05). For the cylinder test: **** p < 0.0001; ns = not significant.
3.3.2. Step Test
To assess forelimb akinesia, step tests were conducted prelesion and 1, 2 and 3 or 4 weeks postlesion (Figure 5B). Prior to the lesion, rats made 18 ± 7 adjusting steps with their dominant paw per experiment. Control animals exhibited consistent stepping performance across the four time points, making 19 ± 7 adjusting steps with their dominant paw per experiment. Following 6‐OHDA lesion, step performance was markedly decreased in 6‐OHDA and DSS + 6‐OHDA animals, when compared to prelesion and control animals. At postlesion Week 1, 6‐OHDA and DSS + 6‐OHDA animals made 4 ± 3 adjusting steps per experiment with their dominant paw. This effect was maintained across postlesion Weeks 2 and 3–4. A two‐way ANOVA revealed strong significant effects of group (F (2, 17) = 18.59, p < 0.0001), time point (F (3, 51) = 38.90, p < 0.0001) and a group × time point interaction (F (6, 51) = 12.87, p < 0.0001). Post hoc tests confirmed a significant akinetic effect of DSS treatment on 6‐OHDA lesion forelimb akinesia at postlesion Weeks 1 and 2 (p = 0.0434 and p = 0.0115, respectively) but no significant difference at Weeks 3 and 4 (p = 0.2044).
3.3.3. Cylinder Test
The final test of forelimb akinesia, the cylinder test, was conducted once prior to euthanasia (Figure 5C,D). When compared to control rats, both 6‐OHDA and DSS + 6‐OHDA rats exhibited a decrease in the proportion of dominant paw touches (10.1 ± 2.2). A one‐way ANOVA indicated a strong significant effect of the treatment group on the cylinder test performance of the dominant paw (F (2, 17) = 31.11, p < 0.0001). Post hoc tests confirmed a significant decrease in dominant paw touches between control rats and 6‐OHDA or DSS + 6‐OHDA rats (p < 0.0001 and p < 0.0001, respectively). There was no significant difference in dominant paw cylinder test performance between 6‐OHDA and DSS + 6‐OHDA rats (p = 0.4964). There was no observed difference in simultaneous paw touches observed between groups (39.1 ± 1.8, p = 0.0834).
3.3.4. Gait Analysis
CatWalk gait analysis was conducted to assess dominant and nondominant hindlimb performance (Figure 6). DSS + 6‐OHDA rats displayed the lowest performance in stride length and swing speed for both dominant and nondominant hindlimbs, when compared to control and 6‐OHDA rats. Although, all groups showed an increase in nondominant hindlimb swing speed, the postlesion dominant hindlimb swing speed of DSS + 6‐OHDA was slower than controls and 6‐OHDA rats. Finally, dominant hindlimb intensity (weight bearing) decreased for all groups between prelesion to postlesion Week 2.
FIGURE 6.

CatWalk hindlimb gait parameters of control, 6‐OHDA and DSS + 6‐OHDA rats. (A, B) Stride length (mm), (C, D) swing speed (m/s) and (E, F) intensity of the dominant and nondominant hindlimbs prelesion and 2 weeks postlesion. Data are displayed as mean ± SEM, n = 6–7. Holm–Šidák post hoc tests: control vs. DSS + 6‐OHDA (# p < 0.05); 6‐OHDA vs. DSS + 6‐OHDA († p < 0.05); ns = not significant.
A two‐way ANOVA identified a significant group effect for dominant hindlimb swing speed (F (2, 17) = 4.689, p = 0.0239). Post hoc tests confirmed a significant decrease in the dominant swing speed of DSS + 6‐OHDA rats when compared to controls at postlesion Week 2 (p = 0.0335). A two‐way ANOVA also identified a significant time effect for nondominant hindlimb swing speed (F (2, 17) = 12.50, p = 0.0025). Post hoc tests confirmed significant differences in prelesion nondominant swing speed between DSS + 6‐OHDA rats and controls and 6‐OHDA rats, respectively (p = 0.0408 and p = 0.0408, respectively). A two‐way ANOVA revealed a significant time effect for nondominant hindlimb intensity (F (1, 17) = 5.183, p = 0.0360). Post hoc tests confirmed a significant difference in prelesion nondominant intensity between DSS + 6‐OHDA and 6‐OHDA (p = 0.0275). However, this was not observed postlesion. Finally, no postlesion differences were found between groups or time points in nondominant swing speed, stride length or intensity, following two‐way ANOVAs and post hoc tests.
3.3.5. Open‐Field
No significant effects of 6‐OHDA or DSS + 6‐OHDA were observed in total distance travelled, average velocity or duration of total rearing across postlesion time points.
3.4. Neuroinflammation
3.4.1. Iba1 Histology
To evaluate CNS inflammation, histological staining of Iba1‐expressing microglia was quantified and compared between the SN of control, 6‐OHDA and DSS + 6‐OHDA rats. Figure 7 shows representative images of Iba1 staining in the lesioned hemisphere of the SN, and magnified individual microglia, of control (Figure 7A,D), 6‐OHDA (Figure 7B,E) and DSS + 6‐OHDA (Figure 7C,F) rats. Microglia of control rats were less densely stained and appeared to be in the resting state, with few processes and branching (Figure 7A,D). Microglia of 6‐OHDA rats exhibited high‐density staining and appeared to be in the hyper‐ramified, active state with increased processes and branching (Figure 7B,E). Finally, microglia of DSS + 6‐OHDA rats exhibited a similar staining density to control rats (Figure 7C). However, the microglia of DSS + 6‐OHDA rats were more similar to the morphology observed in 6‐OHDA microglia, rather than control microglia, that is, an active state with increased processes and branching (Figure 7F).
FIGURE 7.

Microglial activation in the SN of control, 6‐OHDA and DSS + 6‐OHDA rats. Representative images of Iba1 histological staining in the lesioned hemisphere of coronal SN sections (approximately −5.20 mm from bregma) of (A) control, (B), 6‐OHDA and (C) DSS + 6‐OHDA rats. The scale bar is 500 μm. Magnified image of SNc microglia, showing morphology and density, of (D) control, (E) 6‐OHDA and (F) DSS + 6‐OHDA rats. The scale bar is 25 μm. Quantification of microglial activation (G–J). Percent area of the SNc and SNr of lesioned and nonlesioned hemispheres occupied by Iba1‐positive cells (G, I). Mean intensity of Iba1 expression in SNc and SNr, normalised to control expression, in the lesioned and nonlesioned hemisphere (H, J). Data are displayed as mean ± SEM, n = 6–7. Holm–Šidák post hoc test: control vs. 6‐OHDA (**p < 0.005); 6‐OHDA vs. DSS + 6‐OHDA (†† p < 0.005); ns = not significant.
When compared to controls and DSS + 6‐OHDA rats, 6‐OHDA rats exhibited an increase in %Area of Iba1 staining in both the SNc and SNr of the lesioned hemisphere (Figure 7G,I). The mean intensity in SNc and SNr, measured to ensure background fluorescence did not influence %Area data, did not differ between groups (Figure 7H,J). Two‐way ANOVAs found a significant group effect in the SNc and SNr (F (2, 34) = 5.909, p = 0.0063; F (2, 34) = 10.49, p = 0.0003, respectively). Post hoc tests confirmed a larger %Area of Iba1 expression in the lesioned SNc of 6‐OHDA rats compared to DSS + 6‐OHDA rats (p = 0.0085) and lesioned SNr compared to control and DSS + 6‐OHDA rats (p = 0.0083; p = 0.0012, respectively), respectively. No significant differences were found in %Area of Iba1 expression in the nonlesioned SNc or SNr. These data indicated that although 6 weeks of DSS treatment did not worsen microglial activation in the lesioned or nonlesioned SN, morphological differences may indicate a change in microglial state and pathology.
3.4.2. Plasma Cytokine Assay
To identify differences in inflammatory markers between groups, cytokine assay analysis was conducted on plasma samples of control, 6‐OHDA and DSS + 6‐OHDA rats (Figure 8). One‐way ANOVAs revealed a significant effect for IL‐17A (F (2, 14) = 4.184, p = 0.0376)). Post hoc confirmed that DSS + 6‐OHDA exhibited decreased plasma IL‐17A when compared to 6‐OHDA (p = 0.0409). All other cytokines, IL‐1α, IL‐18, IL‐33, CCL2 (MCP‐1) and GM‐CSF, were not affected by DSS + 6‐OHDA or 6‐OHDA. For completeness, data are shown in Figure 8.
FIGURE 8.

Quantification of plasma inflammatory markers in control, 6‐OHDA and DSS + 6‐OHDA rats. Inflammatory markers included (A) IL‐17A, (B) IL‐1α, (C) IL‐33, (D) MCP‐1, (E) IL‐18 and (F) GM‐CSF. Data are displayed as mean ± SEM, n = 4–6, 2 replicates per animal. One DSS + 6‐OHDA sample was not measurable for IL‐1α and similarly one 6‐OHDA for IL‐33. Holm–Šidák post hoc test. *p < 0.05, ns = no significant differences across the three groups.
4. Discussion
This study evaluated the behavioural and histopathological features of a new rat model of PD produced by combining DSS‐induced colitis and 6‐OHDA‐induced neurotoxic dopaminergic lesion. Results show that the DSS + 6‐OHDA model displayed greater gut and forelimb motor dysfunction when compared to the 6‐OHDA model. This was despite similar SN DA neurodegeneration and less SN microglial activation. These findings suggest that the DSS + 6‐OHDA model may represent a potential future tool for investigating the role of the gut–brain axis in PD, although the mechanisms underlying the exacerbation of motor dysfunction in DSS + 6‐OHDA rats require further clarification.
4.1. DSS + 6‐OHDA Rats Exhibit Progressive Gut Dysfunction
DSS (1%) treatment induced significant GI dysfunction in a progressive but high‐grade manner, similar to clinical observations of GI dysfunction in people with IBD or PD. This was evident in worse stool consistency and bleeding scores, decreased colon length and increased histological colon damage. The observed histological changes in distal colon crypt architecture, inflammatory infiltrates, goblet cells and muscularity indicated that GI inflammation had occurred (Ghattamaneni, Panchal, and Brown 2019; Kim et al. 2012). Previous studies have reported similar levels of gut inflammation following 6 weeks of treatment with 1% DSS, specifically stool consistency, blood in stool and histological damage (Ghattamaneni, Panchal, and Brown 2019).
Interestingly, 6‐OHDA rats exhibited minor levels of gut dysfunction. Existing research provides some evidence for GI inflammation following 6‐OHDA lesions (Anderson et al. 2007; Feng et al. 2019; Garrido‐Gil et al. 2018; O'Donovan et al. 2020). However, the finding of decreased colon length in the 6‐OHDA model is novel. This finding is particularly notable as it supports the ‘top–down’ gut–brain theory of PD pathogenesis, namely, that parkinsonian CNS factors can induce peripheral ENS inflammation. Moreover, in Ghattamaneni, Panchal, and Brown (2019), rats treated with 1% DSS for 6 weeks had longer colons than the DSS + 6‐OHDA rats in the present study. From this, in conjunction with the functional bidirectionality of the gut–brain axis (Smith and Parr‐Brownlie 2019), we elucidated a synergistic interaction between DSS treatment and the 6‐OHDA lesion on gut pathology and integrity.
4.2. 6‐OHDA and DSS + 6‐OHDA Animals Showed Similar DA Neurodegeneration
A notable finding was the comparable level of dopaminergic neurodegeneration in the SNc of both 6‐OHDA and DSS + 6‐OHDA rats. One interpretation is that DSS treatment may not affect the potency of the 6‐OHDA lesion at 3–4 weeks postlesion. This finding contrasts with previous studies that indicate DSS treatment and peripheral inflammation does increase nigrostriatal dopaminergic neurodegeneration in other PD models (Garrido‐Gil et al. 2018; Gil‐Martínez et al. 2019; Kishimoto et al. 2019). Two potential explanations arise for this discrepancy: DSS concentration and length of treatment. Firstly, although higher DSS concentrations have been shown to alter nigrostriatal DA networks, a higher concentration of DSS would not benefit the model as a more severe level of gut inflammation would no longer reflect the clinical state and would potentially carry animal welfare concerns.
Secondly, the gut–brain interactions resulting from DSS treatment and 6‐OHDA lesioning via their effect on nigrostriatal degeneration may take longer to fully develop than our study permitted. There is evidence for GI dysfunction both preceding clinical parkinsonism by 10 to 15 years and developing as a consequence of PD nigrostriatal degeneration (Hilton et al. 2014; Kang et al. 2021; Shannon, Keshavarzian, Dodiya, et al. 2012; Shannon, Keshavarzian, Mutlu, et al. 2012). This aspect of the study focused on observing the bottom‐up effects of DSS treatment on 6‐OHDA‐induced SN DAergic degeneration. It is possible that 3 weeks of DSS treatment prior to lesioning may not have been sufficient to exacerbate the nigrostriatal lesion or that a longer post‐6‐OHDA lesion and DSS period is needed for DA neuron degeneration to be completed. Nevertheless, these findings indicate that the DSS + 6‐OHDA model exhibits DA neurodegeneration consistent with established models.
4.3. DSS Treatment Worsened Forelimb Motor Function
Behavioural experiments provided evidence that DSS treatment worsens the reaching and stepping performance of 6‐OHDA rats. DSS treatment caused a minimal change in hindlimb gait but did not alter open‐field parameters or cylinder test performance compared to 6‐OHDA rats. Overall, these results isolate the motor effect of DSS treatment on 6‐OHDA lesions to the forelimbs, which may have utility in modelling the brachial akinesia experienced by PD patients (Boonstra et al. 2008; Jankovic 2008).
A few studies have isolated the effect of DSS treatment on rodent motor function. Dwyer et al. (2021) found that DSS treatment alone (25% for 5 days) decreased locomotor activity but did not affect rotarod performance in mice. Kishimoto et al. (2019) and Gil‐Martínez et al. (2019) both found that DSS treatment alone (0.5% for 12 weeks and 2%–2.5% for 8 days, respectively) did not affect rotarod performance, grip strength or stride length in mice. Thus, previous data in conjunction with results found in the current study show an additive detrimental effect of DSS and 6‐OHDA on motor performance that is greater than 6‐OHDA or DSS alone.
It should be noted that despite a lack of exacerbated SNc dopaminergic atrophy, DSS + 6‐OHDA rats exhibited greater motor impairment than 6‐OHDA rats. One hypothesis for this effect is the action of pro‐inflammatory cytokines on dopaminergic signalling. Brugger et al. (2015) proposed a pathway in which peripheral pro‐inflammatory cytokines from GI and systemic inflammation increase the leakiness of the blood–brain barrier (Felger and Miller 2012; Galea 2021). Subsequently, cytokines disrupt DA transmission via impaired DA vesicle packaging and downregulation of DA receptors (Felger and Miller 2012; Felger et al. 2013; Kazumori et al. 2004). As a result, dopaminergic basal ganglia motor circuit is less effective, and motor dysfunction is heightened, without increased DA neuron death (Brugger et al. 2015). Although we found minimal changes in pro‐inflammatory cytokines in the DSS + 6‐OHDA group, it may instead be the cumulative effect of these, and other, nonsignificant factors that underlie enhanced motor deficits.
Alternate hypotheses for this effect involve the role of nondopaminergic effects of peripheral inflammation on the CNS motor circuit. Cabrera‐Pastor et al. (2019) found that peripheral inflammation in hepatic encephalopathy induces neuroinflammation that alters neurotransmission and results in motor dysfunction. This study showed that increased circulating pro‐inflammatory cytokines promoted cerebellar neuroinflammation, which increased cerebellar GABAergic tone, and subsequently reduced motor coordination and function. Interestingly, hepatic encephalopathy presents with many motor deficits similar to PD, including hypokinesia, stiff movements and tremor (Butterworth 2003). An additional explanation may be the role of toll‐like receptor 4 (TLR4), a factor associated with motor dysfunction in neurodegenerative conditions (Abg Abd Wahab et al. 2019). TLR4 activation, associated with increased peripheral inflammation, promotes neuroinflammation and exacerbates the motor symptoms of PD (Abg Abd Wahab et al. 2019; Campolo et al. 2019). Nonetheless, these findings indicate that the DSS + 6‐OHDA model of PD exhibits worsened motor dysfunction when compared to the 6‐OHDA model, and the mechanisms warrant further investigation.
4.4. DSS + 6‐OHDA Rats Showed Limited Changes in Systemic and Neurological Inflammation
The study found that DSS treatment did not increase microglial activation in 6‐OHDA lesioned SNc or SNr. No difference was observed between groups in nonlesioned SNc and SNr. In contrast, Iba1 expression was elevated in the SNc and SNr of 6‐OHDA rats, when compared to control and DSS + 6‐OHDA rats. These findings contradict existing literature reporting that DSS‐treated parkinsonian animals show increased central pro‐inflammatory markers, including elevated nigrostriatal microglial activation (Garrido‐Gil et al. 2018; Gil‐Martínez et al. 2019; Kishimoto et al. 2019). However, the hyper‐ramified morphology of microglia in DSS + 6‐OHDA rats may be indicative of neuroinflammation at a different inflammatory stage than that observed in 6‐OHDA rats (Reddaway et al. 2023; Savage, Carrier, and Tremblay 2019).
Potential hypotheses for this dichotomy include the effect of colitis on microglia and cessation of DSS treatment. Sroor et al. (2019) found that in a mouse model of IBD, 7 days of DSS (2%) treatment significantly reduced Iba1 immunoreactivity in the medial amygdala, dentate gyrus, paraventricular nucleus of the hypothalamus and medial prefrontal cortex, specifically in the infralimbic cortex and cingulate cortex. They posited a state of colitis‐induced microglial ‘deactivation’ underlies this effect. Although focused on the limbic system, these findings highlight a potential competing effect of DSS treatment against 6‐OHDA lesions that may account for the present findings.
Another confounding factor was the early cessation of DSS treatment, 1 week prior to euthanasia. Although gut dysfunction was already established, stool consistency and bleeding scores decreased following treatment cessation, indicating a reduction in enteric inflammation. In turn, this may have impacted levels of SN neuroinflammation due to bidirectional gut–brain axis signalling.
Finally, inflammation assays revealed limited differences in plasma cytokine concentrations in DSS + 6‐OHDA rats, when compared to 6‐OHDA and control rats. A significant decrease was observed in IL‐17A of DSS + 6‐OHDA animals, indicating less neutrophilic inflammation than in control and 6‐OHDA rats (Zenobia and Hajishengallis 2015). However, as animals ceased DSS treatment 1 week prior to blood sampling, these findings may not reliably represent the complete inflammatory state of the DSS + 6‐OHDA model.
4.5. Evaluation of the DSS + 6‐OHDA Rat Model of PD
This study found that the DSS + 6‐OHDA rat model of PD exhibited many of the clinical hallmarks of PD, including SNc dopaminergic neurodegeneration, motor deficits and progressive GI dysfunction. Although the level of SNc DA cell loss was comparable to the 6‐OHDA rat model, parkinsonian forelimb akinesia and GI dysfunction were significantly increased in the DSS + 6‐OHDA model. A prominent point of difference was the lack of SN microglial activation and limited change in circulating cytokines in the DSS + 6‐OHDA model; however, further investigation into this result is required.
One key discrepancy between our model and clinical PD is the presence of diarrhoea, rather than constipation, which is the predominant GI symptom in clinical PD. Although the two are opposed manifestations, both are symptoms of a reduction of GI function and are characterised by microbiome dysbiosis (Iancu et al. 2023; Vandeputte et al. 2016). Thus, although this feature of the model varies from the clinical condition, the GI dysfunction reported here represents an important step towards modelling parkinsonian GI pathology.
Overall, the DSS + 6‐OHDA rat model of PD represents a unique and novel gut–brain approach to modelling PD.
Author Contributions
Grace E. Kendall: data curation, formal analysis, investigation, methodology, visualization, writing – original draft. Conor F. Underwood: conceptualization, data curation, formal analysis, funding acquisition, investigation, methodology, project administration. Louise C. Parr‐Brownlie: conceptualization, formal analysis, methodology, project administration, resources, supervision, visualization, writing – original draft.
Conflicts of Interest
The authors declare no conflicts of interest.
Peer Review
The peer review history for this article is available at https://www.webofscience.com/api/gateway/wos/peer‐review/10.1111/ejn.16667.
Acknowledgements
We would like to thank Gemma Laws from Otago University for her excellent assistance in the inflammation assay. The study was supported by funding received from Brain Health Research Centre, New Zealand.
Grace E. Kendall and Conor F. Underwood are joint first authors.
Edited by: Yoland Smith
Funding: This work was supported by Brain Health Research Centre, New Zealand, Accelerator Grant.
Data Availability Statement
The data that support the findings of this study are available from the corresponding author upon reasonable request.
References
- Abg Abd Wahab, D. Y. , Gau C. H., Zakaria R., et al. 2019. “Review on Cross Talk Between Neurotransmitters and Neuroinflammation in Striatum and Cerebellum in the Mediation of Motor Behaviour.” BioMed Research International 2019: 1767203. 10.1155/2019/1767203. [DOI] [PMC free article] [PubMed] [Google Scholar]
- Ahmed, Z. , Shaw G., Sharma V. P., Yang C., McGowan E., and Dickson D. W.. 2007. “Actin‐Binding Proteins Coronin‐1a and IBA‐1 Are Effective Microglial Markers for Immunohistochemistry.” Journal of Histochemistry and Cytochemistry 55, no. 7: 687–700. [DOI] [PubMed] [Google Scholar]
- Anderson, G. , Noorian A. R., Taylor G., et al. 2007. “Loss of Enteric Dopaminergic Neurons and Associated Changes in Colon Motility in an MPTP Mouse Model of Parkinson's Disease.” Experimental Neurology 207, no. 1: 4–12. [DOI] [PMC free article] [PubMed] [Google Scholar]
- Bloem, B. R. , Okun M. S., and Klein C.. 2021. “Parkinson's Disease.” Lancet 397, no. 10291: 2284–2303. [DOI] [PubMed] [Google Scholar]
- Boonstra, T. A. , Van Der Kooij H., Munneke M., and Bloem B. R.. 2008. “Gait Disorders and Balance Disturbances in Parkinson's Disease: Clinical Update and Pathophysiology.” Current Opinion in Neurology 21, no. 4: 461–471. [DOI] [PubMed] [Google Scholar]
- Bosch‐Bouju, C. , Smither R. A., Hyland B. I., and Parr‐Brownlie L. C.. 2014. “Reduced Reach‐Related Modulation of Motor Thalamus Neural Activity in a Rat Model of Parkinson's Disease.” Journal of Neuroscience 34, no. 48: 15836–15850. [DOI] [PMC free article] [PubMed] [Google Scholar]
- Brugger, F. , Erro R., Balint B., Kägi G., Barone P., and Bhatia K. P.. 2015. “Why Is There Motor Deterioration in Parkinson's Disease During Systemic Infections—A Hypothetical View.” NPJ Parkinson's Disease 1, no. 1: 1–5. [DOI] [PMC free article] [PubMed] [Google Scholar]
- Butterworth, R. F. 2003. “Hepatic Encephalopathy.” Alcohol Research and Health 27, no. 3: 240–246. [PMC free article] [PubMed] [Google Scholar]
- Cabrera‐Pastor, A. , Llansola M., Montoliu C., et al. 2019. “Peripheral Inflammation Induces Neuroinflammation That Alters Neurotransmission and Cognitive and Motor Function in Hepatic Encephalopathy: Underlying Mechanisms and Therapeutic Implications.” Acta Physiologica 226, no. 2: e13270. 10.1111/apha.13270. [DOI] [PubMed] [Google Scholar]
- Campolo, M. , Paterniti I., Siracusa R., Filippone A., Esposito E., and Cuzzocrea S.. 2019. “TLR4 Absence Reduces Neuroinflammation and Inflammasome Activation in Parkinson's Diseases In Vivo Model.” Brain, Behavior, and Immunity 76: 236–247. 10.1016/j.bbi.2018.12.003. [DOI] [PubMed] [Google Scholar]
- Damier, P. , Hirsch E. C., Agid Y., and Graybiel A. M.. 1999. “The Substantia Nigra of the Human Brain: II. Patterns of Loss of Dopamine‐Containing Neurons in Parkinson's Disease.” Brain 122, no. 8: 1437–1448. 10.1093/brain/122.8.1437. [DOI] [PubMed] [Google Scholar]
- Devos, D. , Lebouvier T., Lardeux B., et al. 2013. “Colonic Inflammation in Parkinson's Disease.” Neurobiology of Disease 50: 42–48. [DOI] [PubMed] [Google Scholar]
- Dwyer, Z. , Chaiquin M., Landrigan J., et al. 2021. “The Impact of Dextran Sodium Sulphate and Probiotic Pre‐Treatment in a Murine Model of Parkinson's Disease.” Journal of Neuroinflammation 18: 1–15. [DOI] [PMC free article] [PubMed] [Google Scholar]
- Felger, J. C. , and Miller A. H.. 2012. “Cytokine Effects on the Basal Ganglia and Dopamine Function: The Subcortical Source of Inflammatory Malaise.” Frontiers in Neuroendocrinology 33, no. 3: 315–327. [DOI] [PMC free article] [PubMed] [Google Scholar]
- Felger, J. C. , Mun J., Kimmel H. L., et al. 2013. “Chronic Interferon‐α Decreases Dopamine 2 Receptor Binding and Striatal Dopamine Release in Association With Anhedonia‐Like Behavior in Nonhuman Primates.” Neuropsychopharmacology 38, no. 11: 2179–2187. [DOI] [PMC free article] [PubMed] [Google Scholar]
- Feng, X.‐Y. , Yan J.‐T., Zhang X.‐L., and Zhu J.‐X.. 2019. “Gastrointestinal Non‐Motor Dysfunction in Parkinson's Disease Model Rats With 6‐Hydroxydopamine.” Physiological Research 68, no. 2: 295–303. [DOI] [PubMed] [Google Scholar]
- Galea, I. 2021. “The Blood–Brain Barrier in Systemic Infection and Inflammation.” Cellular & Molecular Immunology 18, no. 11: 2489–2501. 10.1038/s41423-021-00757-x. [DOI] [PMC free article] [PubMed] [Google Scholar]
- Garrido‐Gil, P. , Rodriguez‐Perez A. I., Dominguez‐Meijide A., Guerra M. J., and Labandeira‐Garcia J. L.. 2018. “Bidirectional Neural Interaction Between Central Dopaminergic and Gut Lesions in Parkinson's Disease Models.” Molecular Neurobiology 55, no. 9: 7297–7316. [DOI] [PubMed] [Google Scholar]
- Ghattamaneni, N. K. , Panchal S. K., and Brown L.. 2019. “An Improved Rat Model for Chronic Inflammatory Bowel Disease.” Pharmacological Reports 71: 149–155. [DOI] [PubMed] [Google Scholar]
- Giladi, N. , Alcalay R. N., Cutter G., et al. 2023. “Safety and Efficacy of Venglustat inGBA1‐Associated Parkinson's Disease: An International, Multicentre, Double‐Blind, Randomised, Placebo‐Controlled, Phase 2 Trial.” Lancet Neurology 22, no. 8: 661–671. 10.1016/S1474-4422(23)00205-3. [DOI] [PubMed] [Google Scholar]
- Gil‐Martínez, A.‐L. , Estrada C., Cuenca L., et al. 2019. “Local Gastrointestinal Injury Exacerbates Inflammation and Dopaminergic Cell Death in Parkinsonian Mice.” Neurotoxicity Research 35, no. 4: 918–930. 10.1007/s12640-019-0010-z. [DOI] [PubMed] [Google Scholar]
- Gorecki, A. M. , Preskey L., Bakeberg M. C., et al. 2019. “Altered Gut Microbiome in Parkinson's Disease and the Influence of Lipopolysaccharide in a Human α‐Synuclein Over‐Expressing Mouse Model.” Frontiers in Neuroscience 13: 839. [DOI] [PMC free article] [PubMed] [Google Scholar]
- Hasegawa, S. , Goto S., Tsuji H., et al. 2015. “Intestinal Dysbiosis and Lowered Serum Lipopolysaccharide‐Binding Protein in Parkinson's Disease.” PLoS ONE 10, no. 11: e0142164. 10.1371/journal.pone.0142164. [DOI] [PMC free article] [PubMed] [Google Scholar]
- Hilton, D. , Stephens M., Kirk L., et al. 2014. “Accumulation of α‐Synuclein in the Bowel of Patients in the Pre‐Clinical Phase of Parkinson's Disease.” Acta Neuropathologica 127, no. 2: 235–241. [DOI] [PubMed] [Google Scholar]
- Hor, J. W. , Lim S. Y., Khor E. S., et al. 2022. “Fecal Calprotectin in Parkinson's Disease and Multiple System Atrophy.” Journal of Movement Disorders 15, no. 2: 106–114. 10.14802/jmd.21085. [DOI] [PMC free article] [PubMed] [Google Scholar]
- Hyland, B. I. , Seeger‐Armbruster S., Smither R. A., and Parr‐Brownlie L. C.. 2019. “Altered Recruitment of Motor Cortex Neuronal Activity During the Grasping Phase of Skilled Reaching in a Chronic Rat Model of Unilateral Parkinsonism.” Journal of Neuroscience 39, no. 48: 9660–9672. [DOI] [PMC free article] [PubMed] [Google Scholar]
- Iancu, M. A. , Profir M., Roşu O. A., Ionescu R. F., Cretoiu S. M., and Gaspar B. S.. 2023. “Revisiting the Intestinal Microbiome and Its Role in Diarrhea and Constipation.” Microorganisms 11, no. 9: 2177. [DOI] [PMC free article] [PubMed] [Google Scholar]
- Jankovic, J. 2008. “Parkinson's Disease: Clinical Features and Diagnosis.” Journal of Neurology, Neurosurgery and Psychiatry 79, no. 4: 368–376. [DOI] [PubMed] [Google Scholar]
- Kang, X. , Ploner A., Roelstraete B., et al. 2021. “Association Between Microscopic Colitis and Parkinson's Disease in a Swedish Population.” Movement Disorders 36, no. 8: 1919–1926. [DOI] [PubMed] [Google Scholar]
- Kazumori, H. , Ishihara S., Rumi M. A., Ortega‐Cava C. F., Kadowaki Y., and Kinoshita Y.. 2004. “Transforming Growth Factor‐α Directly Augments Histidine Decarboxylase and Vesicular Monoamine Transporter 2 Production in Rat Enterochromaffin‐Like Cells.” American Journal of Physiology. Gastrointestinal and Liver Physiology 286, no. 3: G508–G514. [DOI] [PubMed] [Google Scholar]
- Keshavarzian, A. , Green S. J., Engen P. A., et al. 2015. “Colonic Bacterial Composition in Parkinson's Disease.” Movement Disorders 30, no. 10: 1351–1360. 10.1002/mds.26307. [DOI] [PubMed] [Google Scholar]
- Kim, J. J. , Shajib M. S., Manocha M. M., and Khan W. I.. 2012. “Investigating Intestinal Inflammation in DSS‐Induced Model of IBD.” JoVE (Journal of Visualized Experiments) 60: e3678. [DOI] [PMC free article] [PubMed] [Google Scholar]
- Kip, E. , and Parr‐Brownlie L. C.. 2022. “Reducing Neuroinflammation via Therapeutic Compounds and Lifestyle to Prevent or Delay Progression of Parkinson's Disease.” Ageing Research Reviews 78: 101618. 10.1016/j.arr.2022.101618. [DOI] [PubMed] [Google Scholar]
- Kip, E. , and Parr‐Brownlie L. C.. 2023. “Healthy Lifestyles and Wellbeing Reduce Neuroinflammation and Prevent Neurodegenerative and Psychiatric Disorders.” Frontiers in Neuroscience 17: 1092537. 10.3389/fnins.2023.1092537. [DOI] [PMC free article] [PubMed] [Google Scholar]
- Kishimoto, Y. , Zhu W., Hosoda W., Sen J. M., and Mattson M. P.. 2019. “Chronic Mild Gut Inflammation Accelerates Brain Neuropathology and Motor Dysfunction in α‐Synuclein Mutant Mice.” Neuromolecular Medicine 21: 239–249. [DOI] [PMC free article] [PubMed] [Google Scholar]
- Klein, A. , Wessolleck J., Papazoglou A., Metz G. A., and Nikkhah G.. 2009. “Walking Pattern Analysis After Unilateral 6‐OHDA Lesion and Transplantation of Foetal Dopaminergic Progenitor Cells in Rats.” Behavioural Brain Research 199, no. 2: 317–325. [DOI] [PubMed] [Google Scholar]
- Lewandowsky, M. 1912. “Handbuch Der Neurologie.” Journal of Nervous and Mental Disease 39, no. 6: 427. [Google Scholar]
- O'Donovan, S. M. , Crowley E. K., Brown J. R. M., et al. 2020. “Nigral Overexpression of α‐Synuclein in a Rat Parkinson's Disease Model Indicates Alterations in the Enteric Nervous System and the Gut Microbiome.” Neurogastroenterology and Motility 32, no. 1: e13726. [DOI] [PubMed] [Google Scholar]
- Olsson, M. , Nikkhah G., Bentlage C., and Bjorklund A.. 1995. “Forelimb Akinesia in the Rat Parkinson Model: Differential Effects of Dopamine Agonists and Nigral Transplants as Assessed by a New Stepping Test.” Journal of Neuroscience 15, no. 5: 3863–3875. [DOI] [PMC free article] [PubMed] [Google Scholar]
- Pagano, G. , Taylor K. I., Anzures‐Cabrera J., et al. 2022. “Trial of Prasinezumab in Early‐Stage Parkinson's Disease.” New England Journal of Medicine 387, no. 5: 421–432. 10.1056/NEJMoa2202867. [DOI] [PubMed] [Google Scholar]
- Park, S. , Kim J., Chun J., et al. 2019. “Patients With Inflammatory Bowel Disease Are at an Increased Risk of Parkinson's Disease: A South Korean Nationwide Population‐Based Study.” Journal of Clinical Medicine 8, no. 8: 1191. 10.3390/jcm8081191. [DOI] [PMC free article] [PubMed] [Google Scholar]
- Parr‐Brownlie, L. C. , Itoga C. A., Walters J. R., and Underwood C. F.. 2022. “Oscillatory Waveform Sharpness Asymmetry Changes in Motor Thalamus and Motor Cortex in a Rat Model of Parkinson's Disease.” Experimental Neurology 354: 114089. [DOI] [PMC free article] [PubMed] [Google Scholar]
- Paxinos, G. , and Watson C.. 2006. The Rat Brain in Stereotaxic Coordinates: Hard Cover Edition. San Diego, CA: Elsevier. [Google Scholar]
- Peter, I. , Dubinsky M., Bressman S., et al. 2018. “Anti‐Tumor Necrosis Factor Therapy and Incidence of Parkinson Disease Among Patients With Inflammatory Bowel Disease.” JAMA Neurology 75, no. 8: 939–946. 10.1001/jamaneurol.2018.0605. [DOI] [PMC free article] [PubMed] [Google Scholar]
- Reddaway, J. , Richardson P. E., Bevan R. J., Stoneman J., and Palombo M.. 2023. “Microglial Morphometric Analysis: So Many Options, so Little Consistency.” Frontiers in Neuroinformatics 17: 1211188. 10.3389/fninf.2023.1211188. [DOI] [PMC free article] [PubMed] [Google Scholar]
- Savage, J. C. , Carrier M., and Tremblay M.‐È.. 2019. “Morphology of Microglia Across Contexts of Health and Disease.” In Microglia: Methods and Protocols, edited by Garaschuk O. and Verkhratsky A., 13–26. New York: Springer. 10.1007/978-1-4939-9658-2_2. [DOI] [PubMed] [Google Scholar]
- Schallert, T. , and Tillerson J. L.. 2000. “Intervention Strategies for Degeneration of Dopamine Neurons in Parkinsonism: Optimizing Behavioral Assessment of Outcome.” In Central Nervous System Diseases: Innovative Animal Models From Lab to Clinic, 131–151. Totowa, NJ: Springer. [Google Scholar]
- Schwiertz, A. , Spiegel J., Dillmann U., et al. 2018. “Fecal Markers of Intestinal Inflammation and Intestinal Permeability Are Elevated in Parkinson's Disease.” Parkinsonism & Related Disorders 50: 104–107. [DOI] [PubMed] [Google Scholar]
- Shannon, K. M. , Keshavarzian A., Dodiya H. B., Jakate S., and Kordower J. H.. 2012a. “Is Alpha‐Synuclein in the Colon a Biomarker for Premotor Parkinson's Disease? Evidence From 3 Cases.” Movement Disorders 27, no. 6: 716–719. [DOI] [PubMed] [Google Scholar]
- Shannon, K. M. , Keshavarzian A., Mutlu E., et al. 2012b. “Alpha‐Synuclein in Colonic Submucosa in Early Untreated Parkinson's Disease.” Movement Disorders 27, no. 6: 709–715. [DOI] [PubMed] [Google Scholar]
- Smith, L. M. , and Parr‐Brownlie L. C.. 2019. “A Neuroscience Perspective of the Gut Theory of Parkinson's Disease.” European Journal of Neuroscience 49, no. 6: 817–823. 10.1111/ejn.13869. [DOI] [PubMed] [Google Scholar]
- Sroor, H. M. , Hassan A. M., Zenz G., et al. 2019. “Experimental Colitis Reduces Microglial Cell Activation in the Mouse Brain Without Affecting Microglial Cell Numbers.” Scientific Reports 9, no. 1: 1–12. [DOI] [PMC free article] [PubMed] [Google Scholar]
- Tamás, A. , Lubics A., Szalontay L., Lengvári I., and Reglődi D.. 2005. “Age and Gender Differences in Behavioral and Morphological Outcome After 6‐Hydroxydopamine‐Induced Lesion of the Substantia Nigra in Rats.” Behavioural Brain Research 158, no. 2: 221–229. [DOI] [PubMed] [Google Scholar]
- Unger, M. M. , Spiegel J., Dillmann K.‐U., et al. 2016. “Short Chain Fatty Acids and Gut Microbiota Differ Between Patients With Parkinson's Disease and Age‐Matched Controls.” Parkinsonism & Related Disorders 32: 66–72. 10.1016/j.parkreldis.2016.08.019. [DOI] [PubMed] [Google Scholar]
- Vandeputte, D. , Falony G., Vieira‐Silva S., Tito R. Y., Joossens M., and Raes J.. 2016. “Stool Consistency Is Strongly Associated With Gut Microbiota Richness and Composition, Enterotypes and Bacterial Growth Rates.” Gut 65, no. 1: 57–62. [DOI] [PMC free article] [PubMed] [Google Scholar]
- Xu, T. , Dong W., Liu J., et al. 2024. “Disease Burden of Parkinson's Disease in China and Its Provinces From 1990 to 2021: Findings From the Global Burden of Disease Study 2021.” Lancet Regional Health – Western Pacific 46: 101078. 10.1016/j.lanwpc.2024.101078. [DOI] [PMC free article] [PubMed] [Google Scholar]
- Zenobia, C. , and Hajishengallis G.. 2015. “Basic Biology and Role of Interleukin‐17 in Immunity and Inflammation.” Periodontology 2000 69, no. 1: 142–159. 10.1111/prd.12083. [DOI] [PMC free article] [PubMed] [Google Scholar]
- Zhou, M. , Zhang W., Chang J., et al. 2015. “Gait Analysis in Three Different 6‐Hydroxydopamine Rat Models of Parkinson's Disease.” Neuroscience Letters 584: 184–189. [DOI] [PubMed] [Google Scholar]
Associated Data
This section collects any data citations, data availability statements, or supplementary materials included in this article.
Data Availability Statement
The data that support the findings of this study are available from the corresponding author upon reasonable request.