

Abstract
Control of insulin mRNA translation is crucial for energy homeostasis, but the mechanisms remain largely unknown. We discovered that insulin mRNAs across invertebrates, vertebrates and mammals feature the modified base N6-methyladenosine (m6A). In flies, this RNA modification enhances insulin mRNA translation by promoting the association of the transcript with polysomes. Depleting m6A in Drosophila melanogaster insulin 2 mRNA (dilp2) directly through specific 3′ untranslated region (UTR) mutations, or indirectly by mutating the m6A writer Mettl3, decreases dilp2 protein production, leading to aberrant energy homeostasis and diabetic-like phenotypes. Together, our findings reveal adenosine mRNA methylation as a key regulator of insulin protein synthesis with notable implications for energy balance and metabolic disease.
m6A is an abundant internal modification of eukaryotic mRNAs involved in regulating mRNA stability, turnover and translation1,2. Recent studies have implicated this pathway in the regulation of energy homeostasis and the pathogenesis of type 2 diabetes. Specifically, genetic depletion of m6A levels in mammalian insulin β cells resulted in higher circulating glucose and diabetic phenotypes3–5 and lower insulin-cell maturation in vitro4; reduced m6A levels were also observed in the pancreatic β cells of humans with type 2 diabetes6,7. Moreover, insulin biosynthesis is thought to be critically controlled at the translational level, but the mechanism remains uncharacterized8,9. Here, we took advantage of the ancestral conservation of the m6A (ref. 10) and insulin systems in invertebrates11 to identify the molecular mechanisms through which m6A regulates glucose homeostasis and contributes to metabolic health.
In fruit flies (Drosophila melanogaster), 14 neuroendocrine cells in the pars intercerebralis (Fig. 1a) regulate hemolymph glycemia and energy homeostasis by producing three insulin-like hormones12. Of these, the Drosophila insulin-like 2 peptide (dilp2), which has the highest homology to human insulin, is necessary and sufficient to regulate hemolymph glycemia and fat levels in adult flies11,13–15. In line with this, mutations in the dilp2 gene, or ablation of the insulin-producing cells, elevate hemolymph sugar and impair metabolic homeostasis, phenotypes rescued by injection of human insulin11–14. The anatomical and genetic accessibility of the fly insulin cells makes this a uniquely suited system to investigate the in vivo function of the m6A pathway in energy homeostasis.
Fig. 1 |. Mettl3 is required for glucose balance and energy homeostasis in the insulin-producing cells.

a, Diagram showing the location and anatomy of insulin-producing cells in the fly brain and the methylation of adenosine by the Mettl3 protein. b, The circulating hemolymph glycemia (n = 6, 5) of fasted Mettl3−/− and w1118CS control flies. P = 0.027. c, Triglyceride levels normalized to protein in male w1118CS and mutant Mettl3−/− flies. n = 8; P < 0.0001. d, Triglyceride levels normalized to protein in male flies with cell-specific rescue of (dilp2>Mettl3) Mettl3−/− mutant flies. n = 8 pools of two flies; rescue flies n = 4. Two-way analysis of variance (ANOVA) with Tukey’s multiple comparisons test. ns, not significant (0.387). Adjusted P = 0.0001. e, The hemolymph glycemia (n = 6) of starved dilp2>Mettl3RNAi and transgenic control flies. P = 0.009. f, Triglyceride levels normalized to protein in flies with cell-specific knockdown of Mettl3 (dilp2>Mettl3RNAi). n = 8 pools of two flies; P < 0.0001. g, Representative confocal images of immunofluorescence of dilp2 protein in control (w1118CS) and Mettl3−/− mutant flies. Scale bar, 20 μm. Quantification of median dilp2 fluorescence (arbitrary units) of individual insulin-producing cells from Mettl3 mutants and w1118CS control flies. n = 15 brains. Male flies were starved for 16 h prior to dissection and collected in three independent sets. P < 0.0001. h, Representative polysome profile from sucrose gradient of control (w1118CS) and Mettl3−/− mutant fly heads. i, The proportion of dilp2 mRNA in sucrose gradient fractions 5–12 normalized to spike-in RNA from control (w1118CS) and Mettl3−/− mutant flies. n = 2, 400 heads per sample. Shading represents s.e.m. Unpaired two-tailed Student’s t-test unless otherwise noted. *P < 0.05; **P < 0.005.
If the m6A pathway were important for energy balance in flies, we would expect that mutations in the conserved m6A methyltransferase writer Mettl31 would increase circulating glucose and fat-to-lean mass (Fig. 1a). Consistent with this, Mettl3 homozygous loss-of-function mutants16 showed higher fasted circulating sugar levels (Fig. 1b) and triglycerides than control flies (Fig. 1c). These effects were rescued by expression of a wild-type Mettl3 transgene only in the insulin-producing cells with Dilp2-GAL4 and phenocopied by Mettl3 knockdown exclusively in these cells (Fig. 1d–f and Extended Data Fig. 1a). Thus, Mettl3 is specifically required in the fly insulin cells to regulate glucose and energy homeostasis. Importantly, these effects were not due to developmental alterations, as knocking down Mettl3 only in posteclosion adult insulin cells (dilp2>Mettl3RNAi; tubulin-GAL80ts) resulted in the same phenotypes as dilp2>Mettl3RNAi animals (Extended Data Fig. 1b).
The energy homeostasis phenotypes of Mettl3−/− flies are similar to those observed in dilp2 mutants14; we thus examined the levels of dilp2 mRNA and protein in Mettl3−/− animals. We found no changes in the abundance of dilp2 mRNA between homozygous Mettl3−/− and control flies (Extended Data Fig. 2a), or in the mRNAs for dilp3 and dilp5, the other insulin-like mRNAs produced in these cells (Extended Data Fig. 2b,c). However, there was a marked reduction in dilp2 protein in Mettl3−/− mutant flies (Fig. 1g), without accompanying alterations in the number and morphology of the insulin cells or the amount of other dilp hormones (Extended Data Fig. 2d,e). m6A regulates RNA stability, turnover and translation in a context-dependent manner2; thus, lower dilp2 protein levels, in the absence of corresponding changes in mRNA abundance, could result from deficits in translation. To test this hypothesis, we fractionated polysomes from the heads of control and Mettl3−/− mutants and measured the amount of dilp2 transcript associated with each fraction (Fig. 1h,i). In control flies, 89% of the dilp2 mRNAs cosedimented with polysome fractions, suggesting active and efficient translation (Fig. 1i, gray). Strikingly, this pattern was reversed in Mettl3−/− flies, in which only 19% of dilp2 mRNA was found in the heavier fractions; instead, 80% of this mRNA was associated with early fractions, representing individual ribosomal subunits and monosomes (Fig. 1i, green). Thus, m6A is required for the association of the dilp2 mRNA with polysomes and the proper translation of the dilp2 mRNA into protein. Of note, the 80S ribosome peak was lower in Mettl3−/− flies, which could result in lower translation, as suggested by ref. 17 (Fig. 1h).
To understand how Mettl3 mutations decrease dilp2 translation, we used m6A ultraviolet light-induced crosslinking and immunoprecipitation (miCLIP) to uncover transcripts marked by m6A in fly heads18. The three miCLIP biological replicates demonstrated robust reproducibility with a mean correlation of 0.95 (Extended Data Fig. 3a) and revealed 4,506 m6A peaks corresponding to 1,828 genes involved in brain processes such as development and plasticity (Extended Data Fig. 3b and Supplementary Data 1). Of these, 58% of transcripts coincided with those previously detected by m6A-CLIP and m6A RNA immunoprecipitation (m6A-RIP) in fly heads19, including the Syntaxin 1A, aaquetzalli, female lethal d, and pumilio genes (Supplementary Data 1). The majority of m6A peaks were located in the 5′ UTR of transcripts, whereas a substantial smaller fraction appeared in the 3′ UTR, particularly in close proximity to the stop codon (Extended Data Fig. 3c). These peaks were enriched in an RRAC (R, purine) sequence motif at C-to-T crosslinking-induced mutation sites (CIMS), which represent m6A sites from CLIP/RIP data16–19 (Extended Data Fig. 3d and Supplementary Data 1). In contrast to mammals20,21, the location of m6As along the transcript and the modest sequence enrichment are consistent with previous reports in flies17,19.
Among the regions methylated in vivo, we uncovered an m6A peak in the 3′ UTR of dilp2 shortly after the stop codon (Fig. 2a); mRNAs for other insulin-like peptides dilp3 and dilp5 showed no methylation (Extended Data Fig. 3e,f). To better characterize the location of the modified adenosines in the dilp2 mRNA, we turned to direct RNA sequencing (Oxford Nanopore), in which different bases are identified by changes in current flow through nanopores22–24. To first ensure that we could faithfully detect the presence of methylated A, we sequenced in vitro transcribed RNAs with only one methylated or unmethylated A (position 239) and used EpiNano to detect the modified A (Extended Data Fig. 4a); this algorithm identifies m6As by detecting deviations in base calls caused by current intensity changes between modified and unmodified nucleotides23. Indeed, EpiNano flagged the current shift near A239 (Extended Data Fig. 4b) as a base-calling deviation (Extended Data Fig. 4c), showing that it can reliably detect methylated A. To identify m6As in the native dilp2 mRNA from fly heads, we first enriched for transcripts specifically expressed in the insulin-producing cells by translating ribosome affinity purification (TRAP) (Dilp2-GAL4 >RPL3::FLAG25). We then direct RNA sequenced the immunoprecipitated poly(A) + RNA and used EpiNano to detect deviations between base calls of in vitro transcribed and native dilp2 RNA23. This analysis uncovered a significant difference in the 3′ UTR between the in vitro transcribed and native dilp2 mRNAs (Fig. 2b and Extended Data Fig. 4d), with three bases in the 3′ UTR (positions G519, C614 and C664) showing significantly higher base-call deviations. Position G519 is near a putative methylated AC contained within the CLIP peak, and position C664 is part of AC dinucleotides (Fig. 2b and Supplementary Table 2). The remaining peak did not include an AC and is therefore unlikely to be methylated (Supplementary Table 2). Together with the results from miCLIP, the direct RNA sequencing results show that at least two specific ACs in the 3′ UTR of the dilp2 mRNA are methylated in vivo in D. melanogaster.
Fig. 2 |. Mettl3 is required for the translation of dilp2 mRNA.
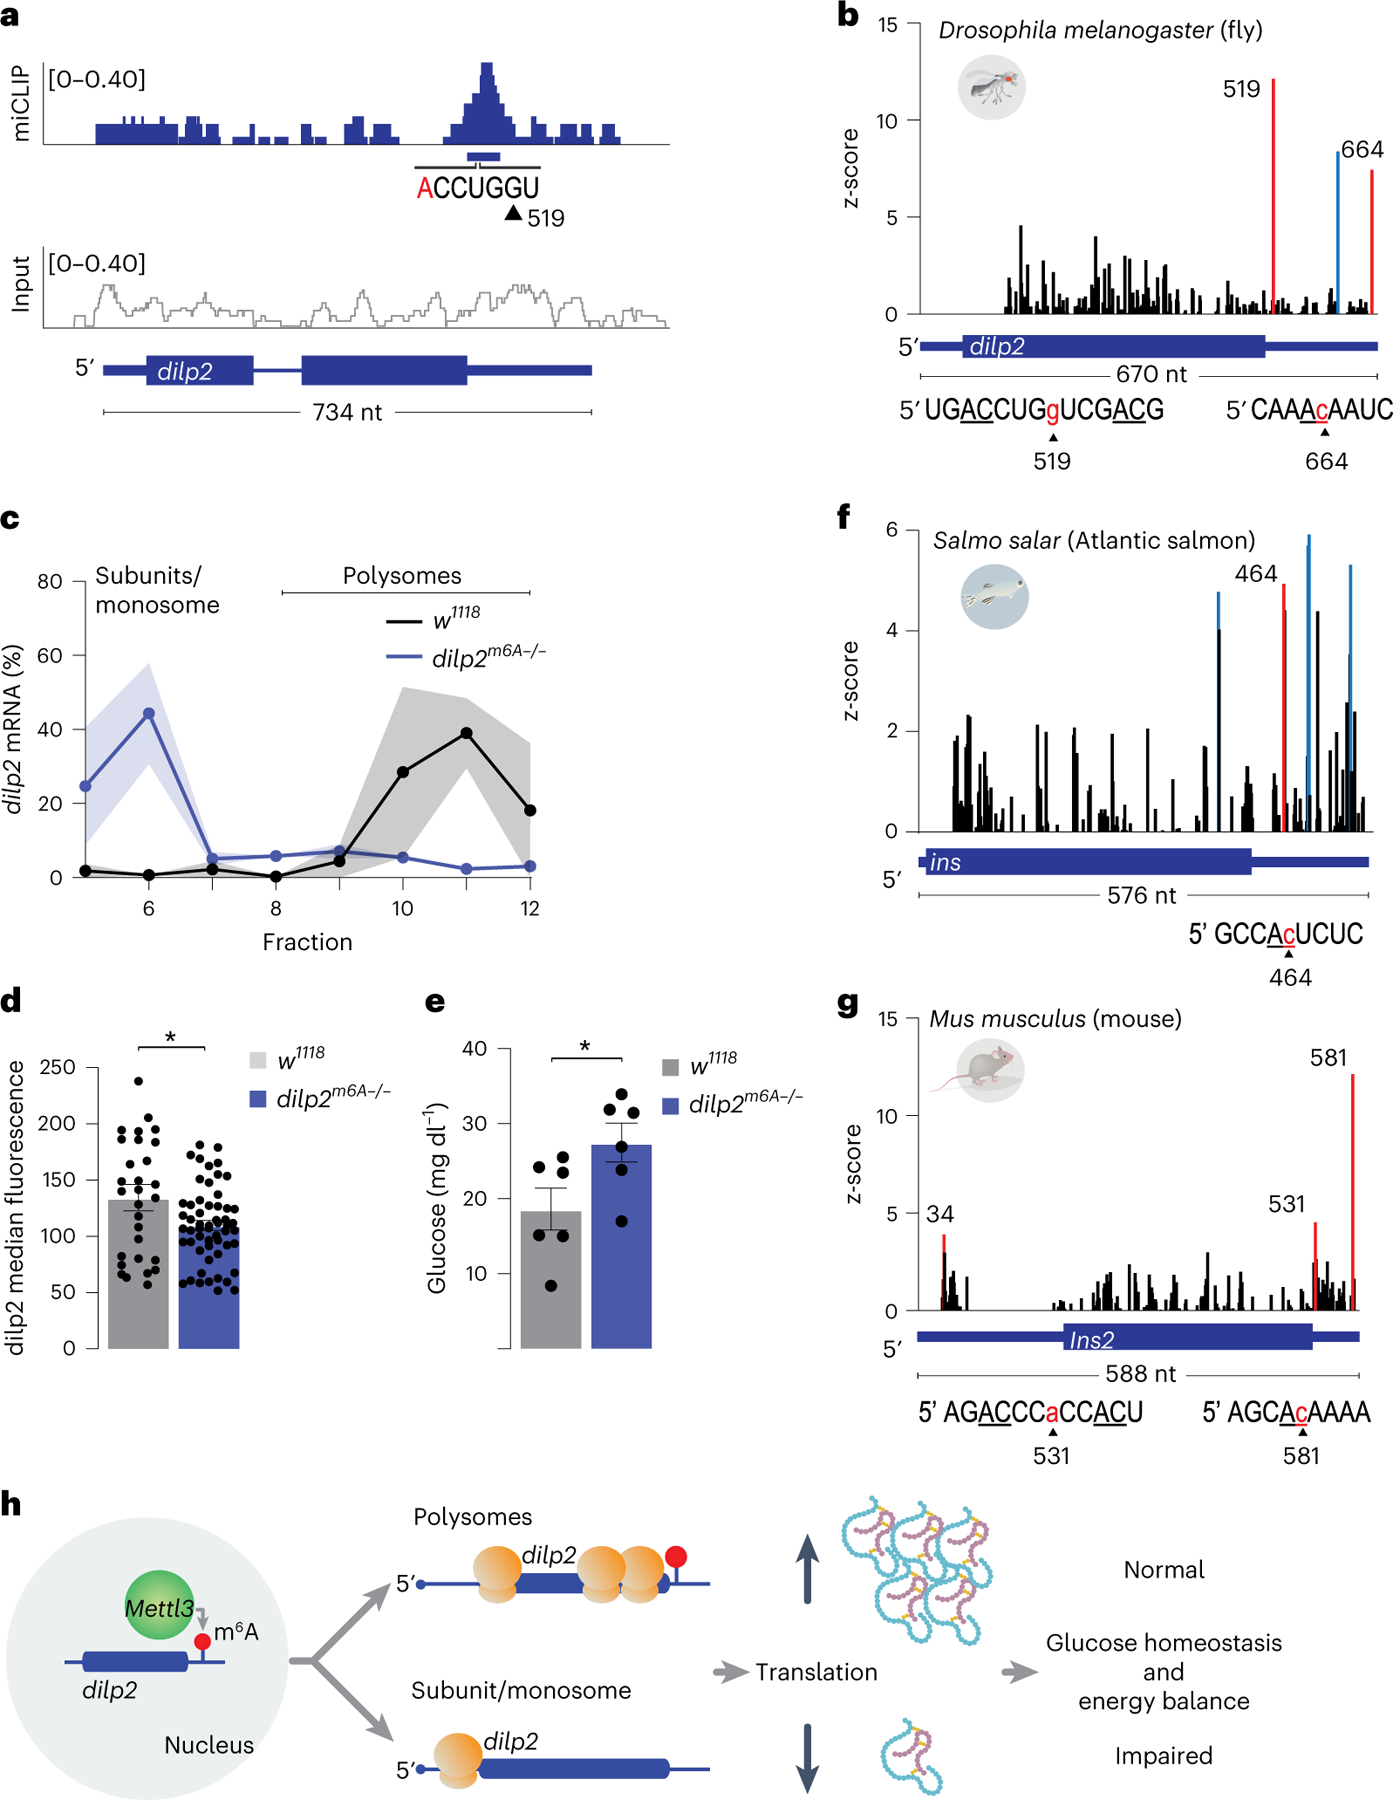
a, miCLIP (top, blue) and the no immunoprecipitation input control (bottom, gray) traces mapped to the dilp2 locus. The blue horizontal bar indicates the CLIP peak (false discovery rate (FDR) < 0.05) and the base composition flanking a putative m6A site near position 519. b, EpiNano significance trace showing the nucleotide positions that are significantly different (red or blue bars, z-score > 6) between native and in vitro transcribed dilp2 RNAs. Red bars represent significantly different nucleotides near AC dinucleotides, and blue bars represent significant scores at nucleotides that do not contact ACs. Sequence context for positions 519 and 664 of dilp2 are shown under the gene model. The sequence context for position 614 is in Supplementary Table 2. c, The proportion of dilp2 mRNA in sucrose gradient fractions 5–12 normalized to spike-in RNA from control (w1118CS) and dilp2m6A−/− flies. n = 2, 3 samples of 400 heads each. Shading represents s.e.m. d, Quantification of median dilp2 fluorescence of individual insulin-producing cells from n = 6 brains from control (w1118) and dilp2m6A−/− mutant fly heads. Error bars represent s.e.m. Unpaired two-tailed Student’s t-test, P = 0.021. e, The circulating hemolymph glycemia (n = 6) of fasted dilp2m6A−/− and w1118 control flies. Error bars represent s.e.m. Unpaired two-tailed Student’s t-test, P = 0.042. f, g, Direct RNA sequencing significance trace comparing in vitro transcribed salmon ins (f) or mouse Ins2 (g) RNA to native mRNA isolated from salmon pancreatic tissue (f) or mouse pancreatic islets (g). Red or blue bars represent the significantly different nucleotides near AC dinucleotides (red) or not at AC nucleotides (blue) (z-scores > 4 or >5) between native and in vitro transcribed RNAs. Sequence context for positions ins 464 and Ins2 531 and 581 are shown under the gene model. Sequence context for the remaining positions is in Supplementary Table 2. h, Model of translational control of dilp2 mRNA by m6A. *P < 0.05; **P < 0.005.
To investigate whether m6A of the dilp2 3′ UTR directly affected its translation, we generated transgenic flies that lacked ‘methylatable’ adenosines in the 3′ UTR (dilp2m6A−/−). Guided by the miCLIP and direct RNA sequencing analyses, we selected 11 AC nucleotides to mutate into UC (Extended Data Fig. 5a), including the ACs near G519 with the strongest methylation signal (Fig. 2a,b); A663 could not be removed for technical reasons. Transgenic fly line 236–4 was selected for further study after confirming all A>U mutations by Sanger sequencing (Extended Data Fig. 5b). In control flies matched to the genetic background of the dilp2m6A−/− mutants, 90% of the dilp2 mRNAs were in the heavier polysome fractions; however, in dilp2m6A−/− flies, 74% of dilp2 mRNAs were associated with early fractions (Fig. 2c and Extended Data Fig. 6a,b). Importantly, the ratios of 60S and 80S ribosomes were similar between control and mutant files, showing that the effect on dilp2 translation is direct and not due to overall changes in translation (Extended Data Fig. 6a,b). Consistent with this, quantification of the total levels of dilp2 protein with anti-dilp2 antibodies in the insulin cells of fasted flies revealed a ~20% decrease in dilp2m6A−/− mutants compared with genetic background controls (Fig. 2d and Extended Data Fig. 6c). Strikingly, dilp2m6A−/− mutants recapitulated the deficits in glucose and energy homeostasis observed in Mettl3 mutant flies, with an increase in fasting glucose levels and triglycerides (Fig. 2e and Extended Data Fig. 6d). Thus, m6A modification of the dilp2 mRNA directly controls the effective translation, and thus synthesis, of the insulin hormone in flies.
Elements in the 3′ UTR of mammalian insulin are thought to play an important role in its translation8,9. Given the conservation of the insulin and m6A pathways in metazoa, we asked if signatures of m6A were also present in vertebrate insulin mRNAs. We obtained poly(A)-selected mRNAs from Atlantic salmon (Salmo salar) pancreatic tissue and mouse (Mus musculus) pancreatic islet cells and examined them by direct RNA sequencing. EpiNano analysis of 5,000 and 10,000 reads mapped to the ins (salmon) and Ins2 (mouse) insulin genes identified three sites with base-call deviations within three bases from AC dinucleotides in the 3′ UTR of both genes: C464 for salmon ins (5′ GCCAc464UCUC) (Fig. 2f and Supplementary Table 2) and A531 (5′ AGACCCa531CCACU) and C581 (5′ AGCAc581AAAA) for mouse Ins2 (Fig. 2g and Supplementary Table 2); base-call deviations not near AC dinucleotides are listed in Supplementary Table 2. To corroborate the direct RNA sequencing data, we enriched for m6A methylated mRNAs from these tissues and assayed for insulin mRNAs by quantitative PCR (m6A-RIP-qPCR). This resulted in a robust enrichment of insulin mRNAs compared with no-antibody controls for salmon ins and mouse Ins2 pancreatic mRNA (Extended Data Fig. 7a,b). Thus, like the fly dilp2, vertebrate insulin mRNAs are marked by m6A sites in the 3′ UTR. Finally, to examine if human insulin (INS) mRNA was also methylated, we analyzed recently published RIP sequencing data from pancreatic islets6. Consistent with our vertebrate data, we observed an enrichment in INS mRNA reads in the m6A-RIP compared with input (Extended Data Fig. 7c).
Taken together, our data and analyses indicate that N6-adenosine methylation of insulin mRNAs is conserved from flies to humans. We propose that this RNA modification controls the synthesis of the insulin protein (Fig. 2h). This idea is directly supported by experiments in flies, in which methylation of specific adenosines near the stop codon enhanced translation by promoting the association of the transcript with polysomes. To this end, previous studies have shown that enhanced physiological translation of the mammalian insulin transcript depends on regulatory elements in the 3′ UTR, but the mechanisms are not understood8,9. In our experiments, dilp2 mRNAs without m6A marks in their 3′ UTR remained associated with the 40S ribosome fractions, suggesting that this modification is important for translational initiation. As m6A levels have been linked to cellular metabolism and signaling2,26, this epitranscriptomic mark in the insulin 3′ UTR could tie translation with specific physiological signals, such as glucose influx or depolarization.
Beyond discovering a new mechanism that controls insulin translation, our work also uncovers a specific cause for the alterations in glucose homeostasis observed in mammals with mutations in the m6A complex4–6,27. As with mice, flies with loss-of-function mutations in Mettl3 or with knockdown of this enzyme in the insulin cells had marked deficits in energy homeostasis, including high glycemia. These phenotypes were recapitulated in flies with ‘unmethylatable’ dilp2 mRNA, showing that these alterations in energy balance directly arise from impaired insulin translation. However, we do not exclude that additional mRNA targets may be involved. For example, we found m6A signatures in mRNAs that are also methylated in human islet cells and/or murine tissues and could play a role in energy homeostasis6,28, such as Hexokinase A (Hex-A), Phosphatase and tensin homolog (Pten), and forkhead box, sub-group O (Foxo).
In conclusion, our work unveils a fundamental role for RNA methylation in the synthesis of insulin and the control of energy homeostasis. Future studies combining the unique advantages of invertebrate and vertebrate models will advance our understanding of the role of epitranscriptomics and translation control in metabolism, with critical implications for the prevention and treatment of chronic diseases.
Methods
Fly lines and husbandry
All flies were maintained at 25 °C in a humidity-controlled incubator with a 12 h/12 h light/dark cycle. Animals were fed Bloomington Food B (cornmeal-glucose) ad libitum and provided fresh food every other day. For all experiments, flies were collected under CO2 anesthesia 2–4 days following eclosion, and housed in groups of 20–30 to age until testing (6–10 days old). The stocks used are listed in Supplementary Table 3. The Mettl3 null mutants16 were backcrossed six times to w1118 Canton-S (w1118CS) flies (Benzer Laboratory, California Institute of Technology) and compared with this genetic control, whereas Dilp2m6A mutants were generated in the w1118 background and compared with it (Rainbow Transgenic Flies).
RNA extraction
Standard methods to isolate total RNA were used for qPCR, CLIP and direct RNA sequencing. In brief, heads from 10–20 flies were dissected and immediately frozen on dry ice for qPCR. Eight hundred fly heads were isolated from bodies by sieving for CLIP and direct RNA sequencing. All samples were stored at −80 °C until extraction. Phenol–chloroform (Invitrogen, 15596018) and RIPA buffer (150 mm NaCl, 1% Nonidet P-40 (NP-40), 0.5% sodium deoxycholate, 0.1% SDS, 50 mM Tris pH 7.5) were added to frozen samples and homogenized by bead bashing (Bead Ruptor, Omni, 19–040E). RNA extracted by phenol–chloroform was precipitated by isopropanol with GlycoBlue coprecipitant (Invitrogen, AM9515). RNA was stored at −80 °C until further processing.
Crosslinking immunoprecipitation (CLIP)
Library preparation.
We adapted miCLIP18 to use infrared-dye-conjugated irCLIP adaptors29. In brief, 20 μg of poly(A)-selected (Invitrogen, 61012) RNA for each biological replicate from 800 heads of w1118CS flies was used as input to the CLIP, no-antibody control, and input-only (no-CLIP) reactions. Fragmented RNA (Ambion, E6150S) was incubated for 2 h at 4 °C with 10 μl of antibody against m6A (Abcam, ab151230), UV-crosslinked, then immunoprecipitated with magnetic beads (Invitrogen, 10004D) as in ref. 18. Pre-adenylated dye-conjugated linkers were ligated (New England Biolabs, M0351S) to dephosphorylated 3′ ends of RNA fragments overnight at 16 °C (Supplementary Table 1). RNA was extracted with NuPAGE SDS buffer and separated by NuPAGE gel (Invitrogen, NP0321), transferred to nitrocellulose membrane and visualized for excision at 800 nm. RNA–antibody complexes were released from the membrane by proteinase K digestion, and RNA was purified with phenol–chloroform extraction. RNA was reverse transcribed (Invitrogen, 18080085), circularized (Lucigen, CL4111K) and PCR-amplified (Thermo Scientific, F530S) following the published protocol18. Libraries were subjected to 151 bp paired-end sequencing according to the manufacturer’s protocol on an Illumina NovaSeq 6000 at the University of Michigan Genomics Core.
Bioinformatics.
Sequencing reads were demultiplexed using bcl2fastq2 Conversion Software (Illumina). 5′-end unique molecular identifiers (UMIs; 9 nucleotide (nt) random sequence) were used to remove PCR duplicates with a custom script. Then, UMIs, sequences and sequencing adapters were removed (fastx_clipper v0.0.14). Reads were mapped to the Ensembl D. melanogaster genome (BDGP6) using STAR (v2.7.5a)30 with default settings (Supplementary Table 4). Aligned reads were peak-called using Piranha (v1.2.1)31 (Supplementary Data 1). Metagene analysis was performed using MetaPlotR32. Pearson’s correlation coefficient (r) was calculated using R. CIMS analysis was performed as in ref. 18. The sequence logo was generated using WebLogo (v2.8.2)33. Gene ontology (GO) analysis was performed using gene set enrichment analysis (GSEA) implemented in the clusterProfiler R package v4.2.234. We used the Benjamini–Hochberg method to correct for multiple hypothesis testing, and ‘biological process’ from the org.Dm.eg.db Bioconductor package v3.8.2 for GSEA35.
Polysome fractionation
Polysome profiles were performed as previously described36. In brief, 300 fly heads were homogenized using a bead beater (Omni, 19–040E) in 800 μl of polysome extraction buffer (300 mM NaCl, 50 mM Tris-HCl pH 7.5, 10 mM MgCl2, 200 mg ml−1 heparin, 400 U ml−1 RNasin, 1.0 mM phenylmethylsulfonyl fluoride, 0.2 mg ml−1 cycloheximide, 1% Triton X-100, 0.1% sodium deoxycholate), then incubated for 10 min on ice. Lysate was cleared by centrifugation at 10,000 × g for 10 min at 4 °C. Equal A260 units were layered onto a 10–50% sucrose gradient in resolving buffer (20 mM Tris-HCl pH 7.5, 150 mM NaCl, 15 mM MgCl2, 1 mM DTT, 100 μg ml−1 cycloheximide) and separated using a Beckman SW 41 Ti rotor (30,000 r.p.m. for 3 h at 4 °C). The absorbance (254 nm) was monitored, and 750 μl fractions were collected using a Brandel pump set to a flow rate of 1.5 ml min−1. Equal molar concentrations of Saccharomyces cerevisiae enolase-2 (Eno2) transcript were added to all fractions before RNA isolation. Nucleic acid was precipitated from each fraction, and pellets were then resuspended in water and extracted using phenol–chloroform, following the manufacturer’s protocol (Invitrogen, 15596026). The RNA was precipitated with isopropanol and GlycoBlue. RNA was resuspended in 10 μl of water, and equal volumes from each fraction were reverse transcribed following the manufacturer’s recommendations (Invitrogen, 18080085). Fractions 5–12 were probed for dilp2 and Eno2 RNA by qPCR (Supplementary Table 1).
qPCR
Reverse transcription was performed using SuperScript III (Invitrogen, 18080085) with 1 μg of total RNA as input and primed with oligo(dT) (Invitrogen, 18418012) according to the manufacturer’s protocol for transcript abundance analysis. qPCR was performed following the manufacturer’s directions (Applied Biosystems, 4367659) for all experiments. Primers were added at a concentration of 2.5 μM in 20 μl reactions. Reactions were run on the StepOnePlus Real-Time PCR System (Applied Biosystems), and quantifications were normalized relative to the reference gene ribosomal protein 49 (Rp49) for transcript abundance or spike-in, Eno2, for polysome fractionation (delta Ct method).
Fat and lean mass analysis
Colorimetric measurements of triglycerides (Stanbio, SB-2100–430) and protein (Pierce, PI23225) were done as previously described37, where one biological replicate n = 2 male flies. Flies were collected 3–5 days after eclosion and homogenized with a Bead Ruptor. Standard curves were generated for each to normalize the concentration of the samples. Samples were quantified using a Tecan Spark plate reader at 562 nm for protein or 500 nm for triglycerides.
Immunofluorescence
Immunofluorescence was done essentially as in ref. 38. Male flies 3–5 days after eclosion were sorted, then aged for 2–5 days on standard food. Flies were then fasted in vials with a wetted Kimwipe for 16–18 h before dissection. Brains were dissected in PBS, fixed (4% paraformaldehyde aqueous solution in 1x PBS), blocked (10% normal goat serum, 2% Triton X-100, 1x PBS), and then incubated overnight in primary anti-body (rat anti-dilp2 (1:500)39, rabbit anti-dilp3 (1:500)40). After washing (3% NaCl, 1% Triton X-100, 1x PBS), brains were incubated overnight at 25 °C in secondary antibody: either goat anti-rat Alexa Fluor 647 (Invitrogen, A-21247) or goat anti-rabbit Alexa Fluor 488 (Invitrogen, A-11008). Brains were mounted in FocusClear (CelExplorer, FC-101) on coverslips, and the cell bodies were imaged using an Olympus FV1200 confocal microscope with a ×20 objective. The median intensity of individual insulin-producing cells was quantified using Fiji41.
In vitro transcription for direct RNA sequencing
DNA insulin templates were synthesized by Integrated DNA Technologies based on transcripts FBtr0076329 (fly Dilp2) and NM_001185083.2 (mouse Ins2), as well as two randomized sequences containing only one adenine (Supplementary Table 2). To generate the salmon ins template, we PCR-amplified (Thermo Scientific, F530S) from complementary DNA and Sanger sequence-verified the product (XM_014198195.2). Each template DNA sequence was used for in vitro transcription (Invitrogen, AM1334). To generate the randomized DNA template ‘rand-A’, the reaction mixture contained bases adenosine, uracil, cytosine and guanosine, whereas the randomized DNA template ‘rand-m6A’ used N6-methyladenosine in the place of adenosine. All other in vitro transcription reactions used only the standard bases. The reactions were performed overnight following the manufacturer’s protocol.
Direct RNA sequencing
RNA was immunoprecipitated from the heads of flies expressing Dilp2-GAL4 UAS-RpL3::FLAG transgene (TRAP) as previously reported42 with anti-Flag antibody (Sigma, F1804) (3 μg). RNA was extracted using phenol–chloroform (TRIzol), then poly(A)-selected (Invitrogen, 61011). RNA from Atlantic salmon pancreatic tissue and mouse islet cells were poly(A)-selected. Poly(A)-selected RNA or a total of 500 ng of pooled in vitro transcribed RNA was used for library preparation following the manufacturer’s protocol (Oxford Nanopore, SQK-RNA002, vDRS_9080_v2_revB_22Nov2018). In brief, the reverse transcriptase adapter was ligated to the RNA, reverse transcription was performed, and the RNA–cDNA hybrids were purified. Next, the second adapter was ligated to the RNA, and the hybrids were again purified. The libraries were loaded onto the MinION flow cell (R9.4.1). The Oxford Nanopore sequencer was run for 24–36 h. Data were base-called using Oxford Nanopore’s Guppy (v3.1.5) and aligned to the reference sequences using Minimap2 -ax splice -uf -k14 (v2.17)43. Only reads that passed filtering and that mapped to the reference were considered for further analysis. Next, aligned reads from biological samples (modified) and matched in vitro transcribed RNAs (unmodified) were used as input to EpiNano (EpiNano-Error, v1.2) to determine the positions of modifications23. We plotted the data from the longest transcript (NM_001185083.2) for EpiNano mouse data. The Tombo suite of tools was used to visualize reads44.
Circulating glucose assay
Hemolymph was collected by centrifugation from 40–50 starved (12–16 h) male flies per replicate. Circulating glucose levels were measured as previously described45. In brief, 0.5 μl of hemolymph was added to 100 μl of HexoKinase (HK) reagent (Sigma, GAHK20) and incubated for 15 min at room temperature. Then, absorbance at 340 nm was measured on a Tecan Spark plate reader.
Generation of dilp2 m6A mutant flies
CRISPR constructs were synthesized and micro-injected into w1118 flies by Rainbow Transgenic Flies. The pScarless donor vector (dsRed marker) was introduced to remove the endogenous dilp2 3′ UTR and replace it with a mutant dilp2 3′ UTR that replaced 11 AC dinucleotides to TC (Extended Data Fig. 4a). F1 progeny were screened for transformation with dsRed fluorescence. Positive transformants were Sanger sequenced (see Sanger sequencing) to verify the correct insertion.
Sanger sequencing
Genomic DNA was extracted by silica column purification (Invitrogen, K182002) from two male flies from each fly line with positive dsRed expression. The dilp2 locus was PCR-amplified (Thermo Scientific, F-530XL), and PCR products were purified and normalized to 5 ng μl−1 with 10 pmol μl−1 of the appropriate primer added. Samples were submitted to Eurofins Genomics for sequencing, and traces were analyzed with Benchling software.
Mouse islet isolation
Islet cells were collected from two to four fasted male mice from Vil-Cre backcrossed nine times to C57 by the University of Michigan Islet Isolation Core. The pooled tissue was added directly to TRIzol (Invitrogen, 15596018) and stored at −80 °C.
Salmon pancreatic tissue isolation
The Atlantic salmon used was approximately 2 years old and postsmolt. The pancreatic tissue from one individual was isolated from the surrounding pyloric caeca. Upon removal, the tissue was immediately added to TRIzol and stored at −80 °C.
m6A methylated RNA immunoprecipitation qPCR (m6A-RIP-qPCR)
Poly(A)-selected (Invitrogen, 61011) RNA was incubated with IgG Dynabeads (Invitrogen) (mock) or beads pre-incubated with antibody against m6A (Abcam, ab151230) for 2 h at 4 °C, then washed with binding buffer (150 mM NaCl, 10 mM Tris-HCl pH 7.5, 0.1% NP-40). RNA was eluted with 100 μl of 20 mM m6A (Sigma, M2780) for 2 h at 4 °C and then purified following the manufacturer’s protocol (TRIzol, Invitrogen). qPCR was performed as above with 10% of the starting material as input. The normalized Ct values were calculated as follows: Ct of mock RIP or RIP – adjusted Ct of input. All primers are listed in Supplementary Table 1. Previously published data from human m6A RIP sequencing were obtained from the Gene Expression Omnibus (GEO; accession number GSE120024)6. Normalized counts of transcripts per kilobase million (TPM) for INS were precomputed by GEO2R, and two-way paired t-test was performed in GraphPad Prism.
Statistics and reproducibility
No statistical method was used to predetermine sample size. No data were excluded from the analyses. The experimental groups were randomized, and the investigators were blinded when determining regions of interest for fluorescence measurements, but not during experiments and outcome assessment.
Reporting summary
Further information on research design is available in the Nature Portfolio Reporting Summary linked to this article.
Extended Data
Extended Data Fig. 1 |. The effects of Mettl3 KD on energy homeostasis are not developmental.
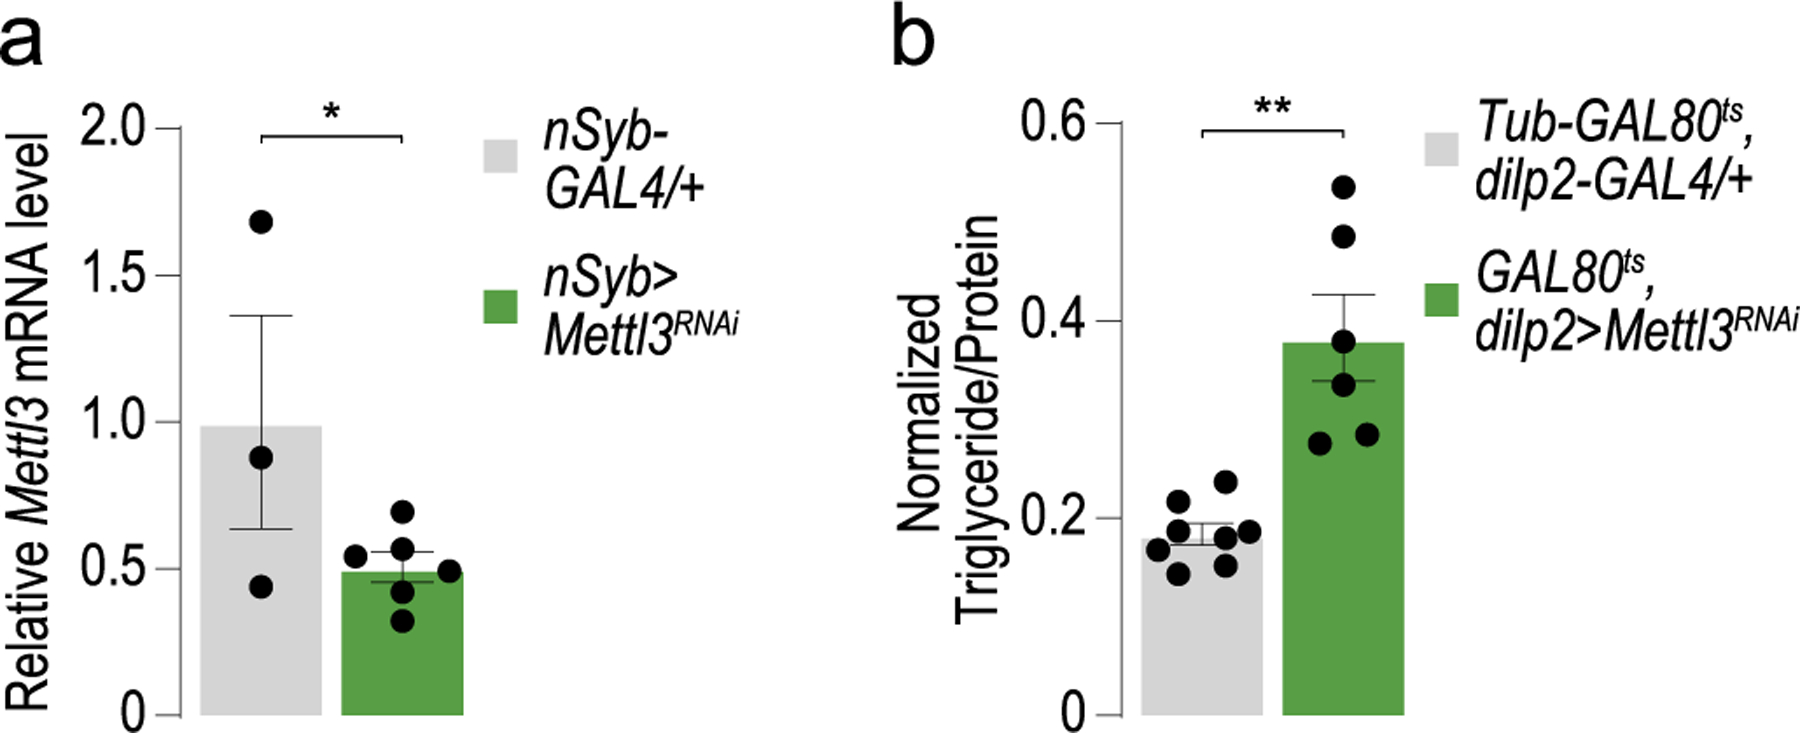
(a) Quantification of Mettl3 mRNA from heads of control nSyb > w1118CS (n = 3 sets of 20 flies) and nSyb > Mettl3RNAi flies (n = 6 sets of 20 flies). Unpaired two-tailed Student’s t-test, p = 0.045. (b) Triglyceride levels normalized to protein in male control (Tubulin-GAL80ts, dilp2-GAL4 / +) and Tubulin-GAL80ts; dilp2 > Mettl3RNAi flies. n = 8, 6 pools of two flies. Unpaired two-tailed Student’s t-test, p = 0.0003. Error bars are SEM. * p < 0.05, ** p < 0.005.
Extended Data Fig. 2 |. Additional phenotyping of Mettl3 mutants.
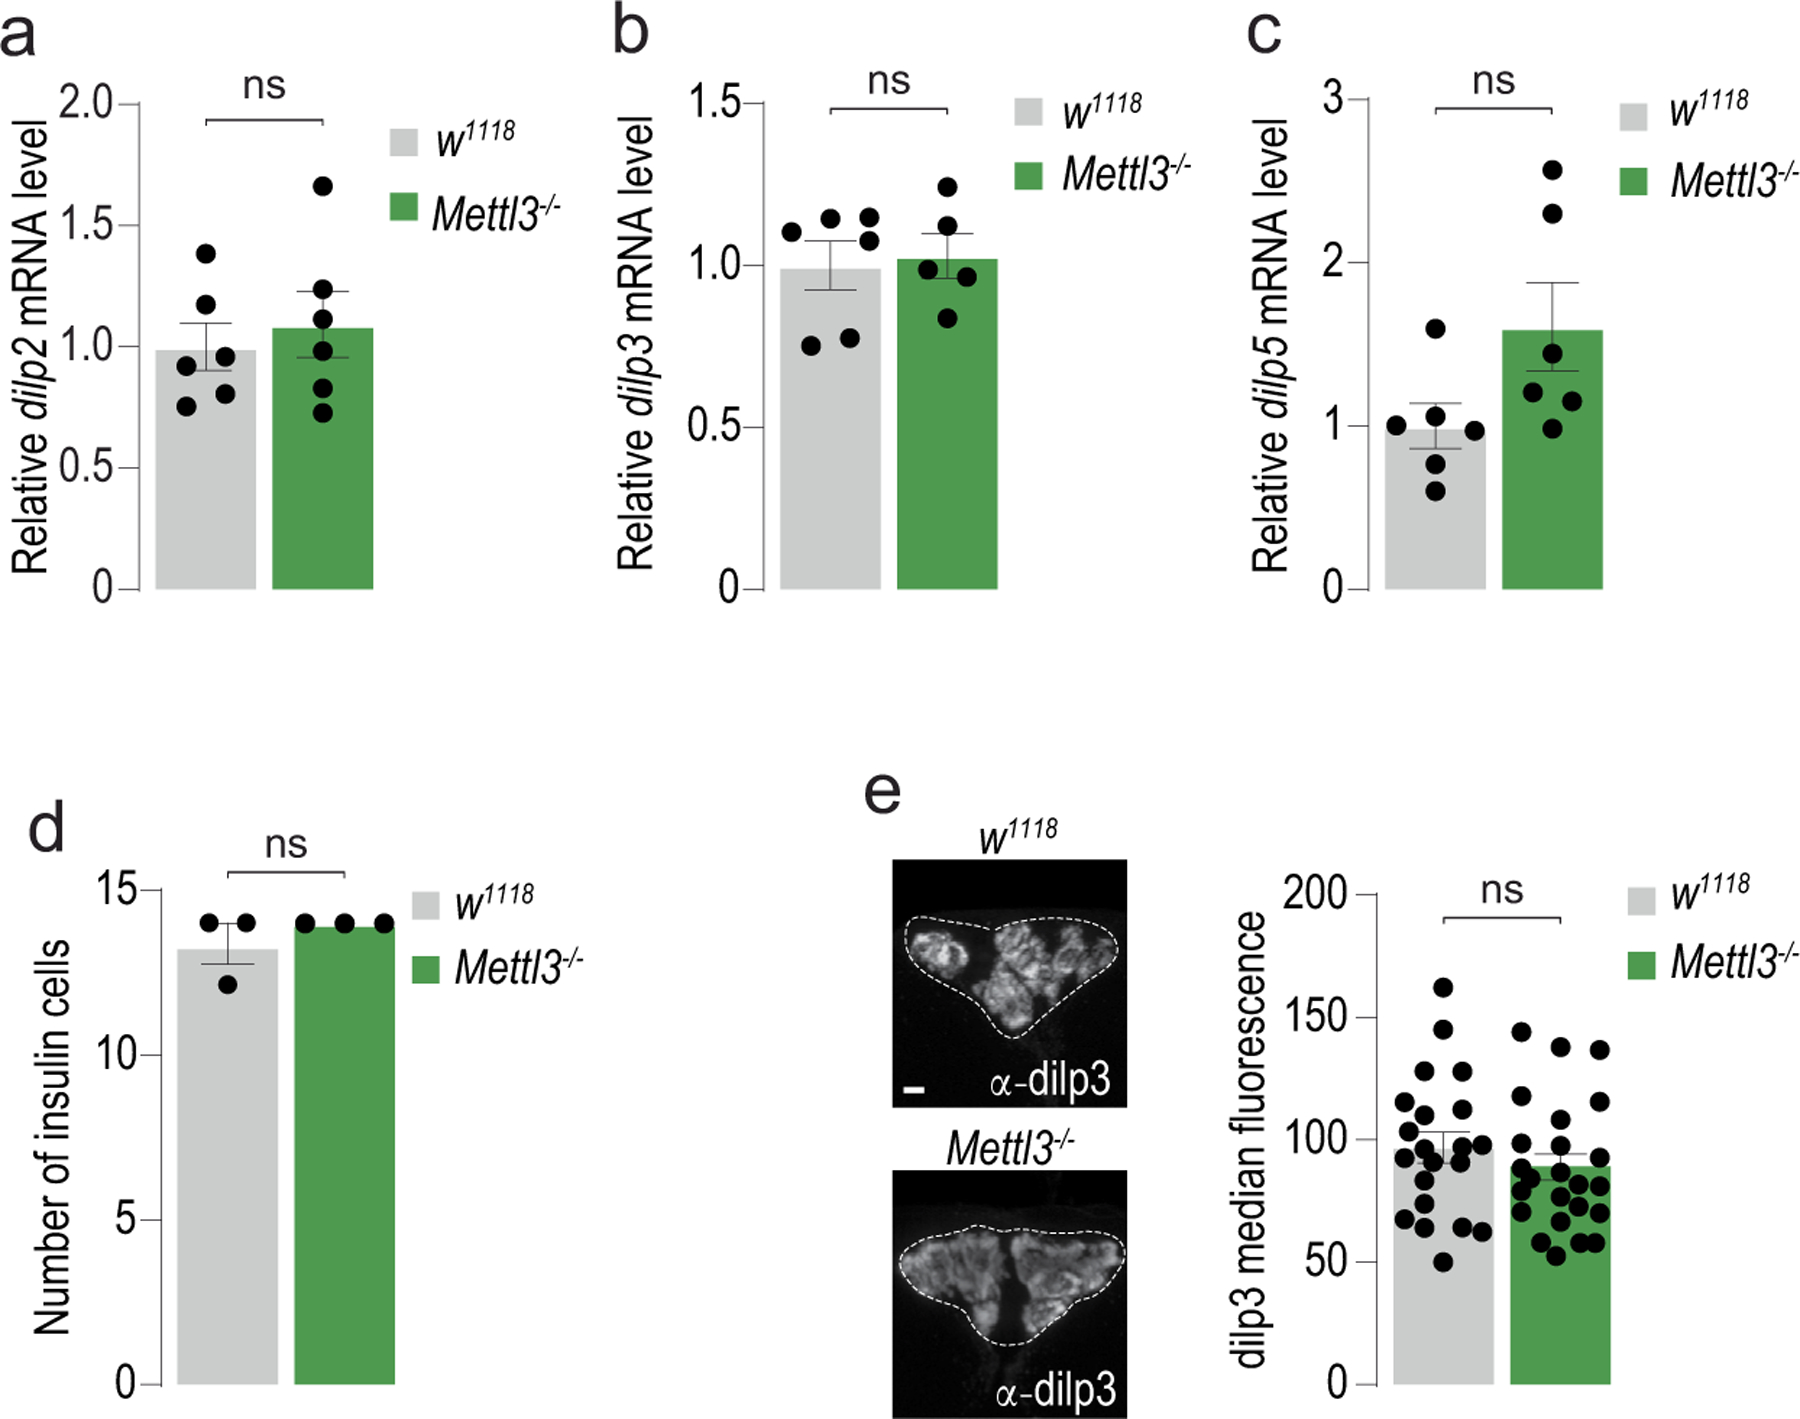
(a, b, c) Quantification of (a) dilp2, (b) dilp3, and (c) dilp5 mRNA from heads of control (w1118CS) and Mettl3−/− mutant flies. n = 6 sets of 20 flies. Unpaired two-tailed Student’s t-test; p = 0.594 (a), p = 0.778 (b), and p = 0.073 (c). (d) Quantification of insulin cells n = 3 brains. Unpaired two-tailed Student’s t-test, p = 0.374. (e) Representative confocal images of immunofluorescence of dilp3 protein in control (w1118CS) and Mettl3−/− mutant flies. Scale bar, 20um. Quantification of median dilp3 fluorescence of individual insulin-producing cells from (d), n = 6 brains per genotype. Unpaired two-tailed Student’s t-test, p = 0.333. Error bars are SEM. ns = not significant.
Extended Data Fig. 3 |. Reproducibility of biological CLIP replicates.

(a) Correlation plots of log2 normalized reads per CLIP peak. Each dot represents a CLIP peak found in all three biological replicates. Pearson’s correlation coefficient (r). (b) Gene ontology (GO) enrichment analysis of genes that harbor a CLIP peak. Circle size represents the number of genes with CLIP peaks in the corresponding GO categories. The color represents the significance of the enrichment (Benjamini–Hochberg corrected p-value from Gene Set Enrichment Analysis (GSEA)). (c) Metagene plot of CLIP peaks from D. melanogaster head mRNA. Representing the position of 4,506 CLIP peaks. (d) The sequence context of 5,485 cross-linked mutational sites (CIMS) contained within CLIP peaks. (e, f) miCLIP (blue) and input (gray) traces mapped to the dilp3 (e) and dilp5 (f) loci (Reads Per Million mapped reads, RPM).
Extended Data Fig. 4 |. Direct RNA sequencing of in vitro transcribed control RNAs and dilp2 RNA.

(a) Schematic of the randomly generated random-1 (rand1) in vitro transcribed RNAs. The RNAs were transcribed with A (gray) and m6A (red). The sequences were identical except for the 6 nt molecular barcode depicted by the green block to distinguish between the unmethylated and methylated RNA unambiguously. (b) Normalized direct RNA sequencing signal derived from in vitro transcribed RNA with A (gray) and with m6A (red). n = 50 reads plotted. Green triangles represent the expected current level based on the base calling mode (see Methods). (c) EpiNano significance trace across the in vitro transcribed RNA sequence. Significant position 239 (red) corresponds to the base following the methylated A (238). Other significant bases labeled ‘barcode’ correspond to the green barcode in (a). (d) Normalized direct-RNA sequencing signal derived from in vitro transcribed dilp2 RNA (left, gray, n = 50 reads) and native dilp2 mRNA from fly heads (right, red n = 50 reads) of the region corresponding to the miCLIP peak in (Fig. 2a). Green triangles represent the expected current level based on the base calling model.
Extended Data Fig. 5 |. Creation of dilp2m6A mutant flies.

(a) Diagram of CRISPR strategy to replace 11 AC dinucleotides in 3′ UTR of the dilp2 transcript (dilp2m6A−/− gray). (b) Sanger sequencing of genomic DNA from positive transgenic line 364–4 showing all 11 AC dinucleotides replaced with UC.
Extended Data Fig. 6 |. Polysome profiles of control and dilp2m6A−/− mutant flies.
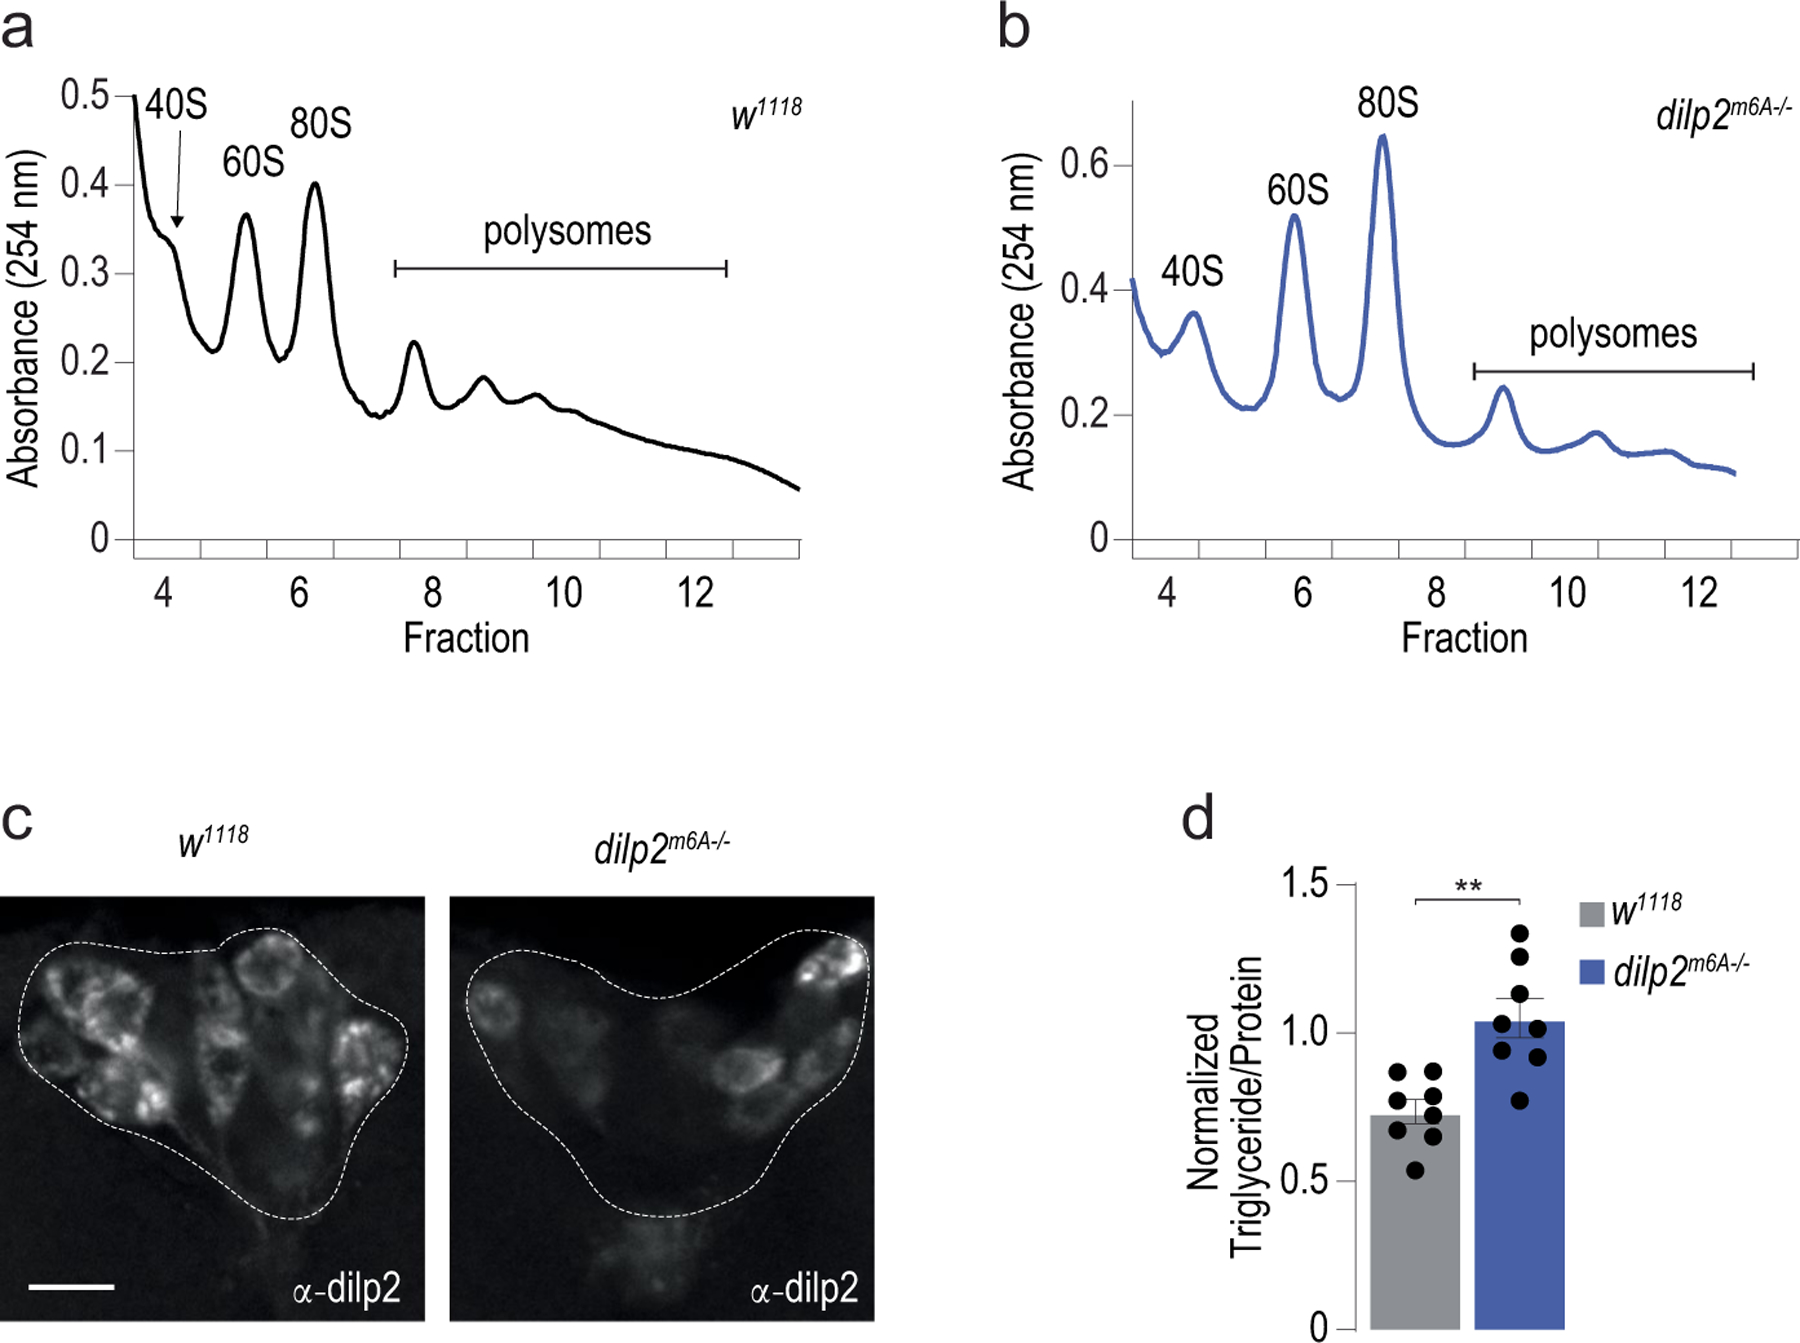
(a, b) Representative polysome profile from sucrose gradient of (a) control (w1118) and (b) dilp2m6A−/− mutant fly heads in Fig. 2c. (c) Representative confocal images of immunofluorescence of dilp2 protein in control (w1118CS) and Mettl3−/− mutant flies. Scale bar, 20um. (d) Triglyceride levels normalized to protein in control (w1118) and mutant dilp2m6A−/− flies. n = 8. Error bars SEM. Unpaired two-sided Student’s t-test, p = 0.001. ** p<0.005.
Extended Data Fig. 7 |. Vertebrate insulin mRNA is enriched by m6A RIP.

(a, b) Quantification of salmon ins (a) and mouse Ins2 (b) mRNA by qPCR from mock-treated or m6A RIP samples of pancreatic tissue. n = 3 salmon and n = 3 of groups of two male mice. Error bars SEM. Unpaired two-tailed Student’s t-test, p <0.0001 (a) and p = 0.001 (b). (c) Normalized Transcripts Per Kilobase Million (TPM) counts of RNA-sequencing reads from the human insulin (INS) gene6. Paired two-tailed Student′s t-test p <0.0001. *p < 0.05, ** p < 0.005.
Supplementary Material
Acknowledgements
We thank P. Léopold (Institut Curie) for the kind gift of the dilp2 antibody, P. Callaerts (KU Leuven) for the gift of the dilp3 antibody, R. Seeley and C. Cras-Méneur for mouse islets (University of Michigan), B. Peterson (National Cold Water Marine Aquaculture Center) for salmon tissue, J.-Y. Roignant (University of Lausanne) for Mettl3 mutant flies, and the Bloomington Drosophila Stock Center for other flies used in this study. We are grateful to P. Todd and S. Miller for training and the use of their polysome fractionation equipment, C. Lapointe for thoughtful comments on the manuscript, and C. Duan for advice. We also thank J. Kuhl for designing some of the graphics in this manuscript. This work was supported by National Institutes of Health grants R00 DK-097141 (M.D.), 1DP2DK-113750 (M.D.), T32 DA007268 (D.W.), P30 DK089503 (M.D. and D.W.), and K99 DK128539 (D.W.); the Rita Allen Foundation (M.D.); and National Science Foundation CAREER 1941822 (M.D.).
Footnotes
Online content
Any methods, additional references, Nature Portfolio reporting summaries, source data, extended data, supplementary information, acknowledgements, peer review information; details of author contributions and competing interests; and statements of data and code availability are available at https://doi.org/10.1038/s41594-023-01048-x.
Code availability
All custom scripts for data analysis can be found at https://github.com/dwilinski/m6A-fly-insulin.git.
Competing interests
The authors declare no competing interests.
Additional information
Extended data is available for this paper at https://doi.org/10.1038/s41594-023-01048-x.
Supplementary information The online version contains supplementary material available at https://doi.org/10.1038/s41594-023-01048-x.
Peer review information Nature Structural & Molecular Biology thanks the anonymous reviewers for their contribution to the peer review of this work. Carolina Perdigoto and Dimitris Typas were the primary editors on this article and managed its editorial process and peer review in collaboration with the rest of the editorial team. Peer reviewer reports are available.
Data availability
All data are available in the main text or supplementary materials. RNA sequencing reads were deposited in GEO under accession number GSE207547. dilp2 3′ UTR mutants are available upon request. The D. melanogaster genome sequence is available in Ensembl under BDGP6.32, Mus musculus Ins2 is available in GenBank under NM_001185083.2, and Salmo salar ins is available in GenBank under XM_014198195.2. Source data are provided with this paper.
References
- 1.Zaccara S, Ries RJ & Jaffrey SR Reading, writing and erasing mRNA methylation. Nat. Rev. Mol. Cell Biol 20, 608–624 (2019). [DOI] [PubMed] [Google Scholar]
- 2.He PC & He C m6A RNA methylation: from mechanisms to therapeutic potential. EMBO J 40, e105977 (2021). [DOI] [PMC free article] [PubMed] [Google Scholar]
- 3.Men L, Sun J, Luo G & Ren D Acute deletion of METTL14 in β-cells of adult mice results in glucose intolerance. Endocrinology 160, 2388–2394 (2019). [DOI] [PMC free article] [PubMed] [Google Scholar]
- 4.Liu J et al. METTL14 is essential for β-cell survival and insulin secretion. Biochim. Biophys. Acta Mol. Basis Dis 1865, 2138–2148 (2019). [DOI] [PubMed] [Google Scholar]
- 5.Li X, Yang Y & Chen Z Downregulation of the m6A reader protein YTHDC1 leads to islet β-cell failure and diabetes. Metabolism 138, 155339 (2023). [DOI] [PubMed] [Google Scholar]
- 6.De Jesus DF et al. m6A mRNA methylation regulates human β-cell biology in physiological states and in type 2 diabetes. Nat. Metab 1, 765–774 (2019). [DOI] [PMC free article] [PubMed] [Google Scholar]
- 7.Yang Y et al. Glucose is involved in the dynamic regulation of m6A in patients with type 2 diabetes. J. Clin. Endocrinol. Metab 104, 665–673 (2019). [DOI] [PubMed] [Google Scholar]
- 8.Jahr H, Schröder D, Ziegler B, Ziegler M & Zühlke H Transcriptional and translational control of glucose-stimulated (pro)insulin biosynthesis. Eur. J. Biochem 110, 499–505 (1980). [DOI] [PubMed] [Google Scholar]
- 9.Magro MG & Solimena M Regulation of β-cell function by RNA-binding proteins. Mol. Metab 2, 348–355 (2013). [DOI] [PMC free article] [PubMed] [Google Scholar]
- 10.Lence T, Soller M & Roignant J-Y A fly view on the roles and mechanisms of the m6A mRNA modification and its players. RNA Biol 14, 1232–1240 (2017). [DOI] [PMC free article] [PubMed] [Google Scholar]
- 11.Das R & Dobens LL Conservation of gene and tissue networks regulating insulin signalling in flies and vertebrates. Biochem. Soc. Trans 43, 1057–1062 (2015). [DOI] [PubMed] [Google Scholar]
- 12.Rulifson EJ, Kim SK & Nusse R Ablation of insulin-producing neurons in flies: growth and diabetic phenotypes. Science 296, 1118–1120 (2002). [DOI] [PubMed] [Google Scholar]
- 13.Kannan K & Fridell Y-WC Functional implications of Drosophila insulin-like peptides in metabolism, aging, and dietary restriction. Front. Physiol 4, 288 (2013). [DOI] [PMC free article] [PubMed] [Google Scholar]
- 14.Semaniuk UV et al. Insulin-like peptides regulate feeding preference and metabolism in Drosophila. Front. Physiol 9, 1083 (2018). [DOI] [PMC free article] [PubMed] [Google Scholar]
- 15.Brogiolo W et al. An evolutionarily conserved function of the Drosophila insulin receptor and insulin-like peptides in growth control. Curr. Biol 11, 213–221 (2001). [DOI] [PubMed] [Google Scholar]
- 16.Lence T et al. m6A modulates neuronal functions and sex determination in Drosophila. Nature 540, 242–247 (2016). [DOI] [PubMed] [Google Scholar]
- 17.Kan L et al. The m6A pathway facilitates sex determination in Drosophila. Nat. Commun 8, 15737 (2017). [DOI] [PMC free article] [PubMed] [Google Scholar]
- 18.Grozhik AV, Linder B, Olarerin-George AO & Jaffrey SR Mapping m6A at individual-nucleotide resolution using crosslinking and immunoprecipitation (miCLIP). Methods Mol. Biol 1562, 55–78 (2017). [DOI] [PMC free article] [PubMed] [Google Scholar]
- 19.Kan L et al. A neural m6A/Ythdf pathway is required for learning and memory in Drosophila. Nat. Commun 12, 1458 (2021). [DOI] [PMC free article] [PubMed] [Google Scholar]
- 20.Dominissini D et al. Topology of the human and mouse m6A RNA methylomes revealed by m6A-seq. Nature 485, 201–206 (2012). [DOI] [PubMed] [Google Scholar]
- 21.Meyer KD et al. Comprehensive analysis of mRNA methylation reveals enrichment in 3′ UTRs and near stop codons. Cell 149, 1635–1646 (2012). [DOI] [PMC free article] [PubMed] [Google Scholar]
- 22.Garalde DR et al. Highly parallel direct RNA sequencing on an array of nanopores. Nat. Methods 15, 201–206 (2018). [DOI] [PubMed] [Google Scholar]
- 23.Liu H et al. Accurate detection of m6A RNA modifications in native RNA sequences. Nat. Commun 10, 4079 (2019). [DOI] [PMC free article] [PubMed] [Google Scholar]
- 24.Parker MT et al. Nanopore direct RNA sequencing maps the complexity of Arabidopsis mRNA processing and m6A modification. eLife 9, e49658 (2020). [DOI] [PMC free article] [PubMed] [Google Scholar]
- 25.Chen X & Dickman D Development of a tissue-specific ribosome profiling approach in Drosophila enables genome-wide evaluation of translational adaptations. PLoS Genet 13, e1007117 (2017). [DOI] [PMC free article] [PubMed] [Google Scholar]
- 26.Kim J & Lee G Metabolic control of m6A RNA modification. Metabolites 11, 80 (2021). [DOI] [PMC free article] [PubMed] [Google Scholar]
- 27.Li X, Jiang Y, Sun X, Wu Y & Chen Z METTL3 is required for maintaining β-cell function. Metabolism 116, 154702 (2021). [DOI] [PubMed] [Google Scholar]
- 28.Zhong H, Tang H-F & Kai Y N6-methyladenine RNA modification (m6A): an emerging regulator of metabolic diseases. Curr. Drug Targets 21, 1056–1067 (2020). [DOI] [PubMed] [Google Scholar]
- 29.Zarnegar BJ et al. irCLIP platform for efficient characterization of protein–RNA interactions. Nat. Methods 13, 489–492 (2016). [DOI] [PMC free article] [PubMed] [Google Scholar]
- 30.Dobin A et al. STAR: ultrafast universal RNA-seq aligner. Bioinformatics 29, 15–21 (2013). [DOI] [PMC free article] [PubMed] [Google Scholar]
- 31.Uren PJ et al. Site identification in high-throughput RNA–protein interaction data. Bioinformatics 28, 3013–3020 (2012). [DOI] [PMC free article] [PubMed] [Google Scholar]
- 32.Olarerin-George AO & Jaffrey SR MetaPlotR: a Perl/R pipeline for plotting metagenes of nucleotide modifications and other transcriptomic sites. Bioinformatics 33, 1563–1564 (2017). [DOI] [PMC free article] [PubMed] [Google Scholar]
- 33.Crooks GE, Hon G, Chandonia J-M & Brenner SE WebLogo: a sequence logo generator. Genome Res 14, 1188–1190 (2004). [DOI] [PMC free article] [PubMed] [Google Scholar]
- 34.Yu G, Wang L-G, Han Y & He Q-Y clusterProfiler: an R package for comparing biological themes among gene clusters. OMICS 16, 284–287 (2012). [DOI] [PMC free article] [PubMed] [Google Scholar]
- 35.Carlson M org.Dm.eg.db: genome wide annotation for Fly. Bioconductor 10.18129/B9.BIOC.ORG.DM.EG.DB (2017). [DOI] [Google Scholar]
- 36.Essers P et al. Reduced insulin/insulin-like growth factor signaling decreases translation in Drosophila and mice. Sci. Rep 6, 30290 (2016). [DOI] [PMC free article] [PubMed] [Google Scholar]
- 37.Wilinski D et al. Rapid metabolic shifts occur during the transition between hunger and satiety in Drosophila melanogaster. Nat. Commun 10, 4052 (2019). [DOI] [PMC free article] [PubMed] [Google Scholar]
- 38.May CE et al. High dietary sugar reshapes sweet taste to promote feeding behavior in Drosophila melanogaster. Cell Rep 27, 1675–1685.e7 (2019). [DOI] [PMC free article] [PubMed] [Google Scholar]
- 39.Géminard C, Rulifson EJ & Léopold P Remote control of insulin secretion by fat cells in Drosophila. Cell Metab 10, 199–207 (2009). [DOI] [PubMed] [Google Scholar]
- 40.Buhler K et al. Growth control through regulation of insulin signalling by nutrition-activated steroid hormone in Drosophila. Development 145, dev165654 (2018). [DOI] [PubMed] [Google Scholar]
- 41.Schindelin J et al. Fiji: an open-source platform for biological-image analysis. Nat. Methods 9, 676–682 (2012). [DOI] [PMC free article] [PubMed] [Google Scholar]
- 42.Vaziri A et al. Persistent epigenetic reprogramming of sweet taste by diet. Sci. Adv 6, eabc8492 (2020). [DOI] [PMC free article] [PubMed] [Google Scholar]
- 43.Li H Minimap2: pairwise alignment for nucleotide sequences. Bioinformatics 34, 3094–3100 (2018). [DOI] [PMC free article] [PubMed] [Google Scholar]
- 44.Stoiber M et al. De novo identification of DNA modifications enabled by genome-guided nanopore signal processing. Preprint at bioRxiv 10.1101/094672 (2017). [DOI] [Google Scholar]
- 45.Tennessen JM, Barry WE, Cox J & Thummel CS Methods for studying metabolism in Drosophila. Methods 68, 105–115 (2014). [DOI] [PMC free article] [PubMed] [Google Scholar]
Associated Data
This section collects any data citations, data availability statements, or supplementary materials included in this article.
Supplementary Materials
Data Availability Statement
All data are available in the main text or supplementary materials. RNA sequencing reads were deposited in GEO under accession number GSE207547. dilp2 3′ UTR mutants are available upon request. The D. melanogaster genome sequence is available in Ensembl under BDGP6.32, Mus musculus Ins2 is available in GenBank under NM_001185083.2, and Salmo salar ins is available in GenBank under XM_014198195.2. Source data are provided with this paper.