

Abstract
We report the cloning and characterization of a cancer-associated cell membrane glycoprotein recognized by mAb NCC-3G10. The antibody showed strong reactivity to a wide variety of cancer cells, but only to a limited number of normal cells including lymphocytes, endothelial cells, and basal cells of stratified squamous epithelium. The cDNA for the antigen encodes 178 aa, which includes a putative signal sequence, a potential O-glycosylated extracellular domain, a single transmembrane domain, and a short cytoplasmic tail. Transfection of the cDNA into PLC/PRF/5 liver cancer cells resulted in reduced cell–cell adhesiveness, based on both morphology and results of Ca2+-dependent cell aggregation assay. In transfected cells, E-cadherin was markedly decreased at the protein level in inverse proportion to the expression level of the antigen recognized by NCC-3G10, but not at the mRNA level. Aggregation of the antigen by NCC-3G10-coated beads triggered accumulation of actin, suggesting some interplay between this antigen and E-cadherin through actin. When metastatic ability was examined in severe combined immunodeficient mice by injecting PLC/PRF/5 cells into the spleen, the transfectants formed a markedly higher number of metastatic nodules in comparison with controls. We have named this cell membrane glycoprotein, which down-regulates E-cadherin and promotes metastasis, dysadherin.
The cadherins are members of a large family of transmembrane glycoproteins that mediate calcium-dependent, homophilic cell–cell adhesion and play an important role in the maintenance of normal tissue architecture (1). Cadherins are connected indirectly to the actin cytoskeleton by means of a group of proteins known as the catenins. The transmembrane cadherin is associated with either β-catenin or plakoglobin, which in turn associates with α-catenin, and then α-catenin mediates the interaction between the cadherin–catenin complex and the actin cytoskeleton (2–4). Numerous studies have demonstrated the importance of the E-cadherin/catenin complex in normal development, maintenance, and repair of tissue and tumor development. Early studies showed that inhibition of E-cadherin activity with function-perturbing antibodies altered the morphology of Madin–Darby canine kidney cells and conferred on them the ability to invade collagen gels and embryonic chicken heart tissue (5, 6). Invasive fibroblast-like carcinoma cells could be converted to a noninvasive phenotype by transfection with a cDNA encoding E-cadherin (7). Several studies have reported a correlation between decreased function of the E-cadherin/catenin complex and the initiation and progression of human tumors. Several mechanisms for the irreversible and reversible inactivation of the E-cadherin/catenin complex in human tumors have been reported (8). Mutations have been reported in the genes for E-cadherin and α- and β-catenins (9–12). Transcriptional inactivation of E-cadherin expression was shown to occur by deoxycytidylate-phosphate-deoxyguanylate methylation around the promoter region (13). Tyrosine phosphorylation of β-catenin, which was shown to interact with c-erbB2 or the epidermal growth factor receptor, was also reported to inactivate E-cadherin function (14).
Here we report the cloning and characterization of a cancer-associated cell membrane glycoprotein recognized by the mAb NCC-3G10. The antigen distribution and results of transfection of the cDNA indicated that this antigen inactivates E-cadherin function in a posttranscriptional manner and plays an important role in tumor progression and metastasis. We have called this cell membrane glycoprotein dysadherin and suggest that there is another mechanism of inactivation of E-cadherin, inactivation through this “anti-adhesion molecule.”
Materials and Methods
Cell Cultures and Production of mAb.
Human hepatoma Li-7 cell line (15), a human umbilical vein endothelial cell immortalized with simian virus 40 large T antigen (HUVECT), colon cancer NCC Co31 cell line (16), and mouse L cells transfected with E-cadherin (LE cells) (17) all were established in our laboratory. PLC/PRF/5 and HT29 were obtained from American Type Culture Collection. PC10, a human squamous lung cancer cell line, was generously provided by Y. Hayata, Tokyo Medical College, Tokyo. Cells were cultured in DMEM (GIBCO/BRL) supplemented with 10% FBS (GIBCO/BRL) in a humidified atmosphere of 5% CO2 and 95% air. BALB/c mice were immunized with the Li-7 cells, and hybridomas were produced as described (18). The mAb NCC-3G10 was selected on the basis of strong membrane staining in several cancer tissues and cell lines.
cDNA Cloning.
A λgt11 expression library (Stratagene) constructed from NCC-CO31 cell poly(A)+ RNA was screened with the mAb NCC-3G10 (19). A full-length cDNA (L3 cDNA) was obtained from a human leukocyte cDNA library (Life Technologies, Rockville, MD) by using a partial cDNA clone as a probe. The cDNA was sequenced by using an Applied Biosystems PRISM 377 DNA sequencer (Perkin–Elmer). The nucleotide and the amino acid sequences were analyzed by using the genetyx-mac genetic information processing software (Software Development, Tokyo) and the mpsearch and psort ii programs.
Western Blot Analysis.
Cells were lysed on ice for 30 min with lysis buffer (10 mM PBS, pH 7.4/0.5% Triton X-100/2 mM CaCl2/1 mM PMSF/10 μg/ml leupeptin/2 μg/ml pepstatin A/10 μg/ml aprotinin). After centrifugation (15,000 rpm for 30 min) the supernatant was collected as the Triton X-100 soluble fraction. The pellet was resuspended in 50 μl of Laemmli sample buffer. After centrifugation (10,000 g for 30 min), the supernatant was used as the Triton X-100 insoluble fraction.
Samples of 20 μg protein per lane were separated by SDS/PAGE (20) and then transferred to a poly(vinylidene difluoride) membrane (Immobilon; Millipore) as described (21). After blocking, the filters were incubated with primary antibodies followed by incubation with peroxidase-conjugated secondary antibodies (Amersham Pharmacia). Peroxidase-labeled bands were visualized by using an ECL kit (Amersham Pharmacia).
Northern Blot Analysis.
Total RNAs were extracted from cells by using the Trizol Reagent (Life Technologies), and Northern blot analysis was performed essentially as described by Maniatis et al. (19). The L3 cDNA was 32P-labeled with the ready-prime DNA labeling system (Amersham Pharmacia) and used as a probe. A 172-bp nucleotide sequence located within the fifth extracellular subdomain (EC5) of E-cadherin was amplified as described (9) and used as a probe specific to E-cadherin. The quality and quantity of electrophoresed mRNA was determined by rehybridization of the same blot with a human glyceraldehyde-3-phosphate dehydrogenase cDNA (CLONTECH).
cDNA Transfection.
A cDNA fragment of dysadherin containing the entire ORF without a stop codon was amplified by using L3 cDNA as a template by PCR and subcloned into a mammalian expression vector pcDNA3 (Invitrogen) with a C-terminal herpes simplex virus (HSV) tag sequence (Novagen). This construct, L3 HSV/pcDNA3, was sequenced to exclude mismatches. Transfection of L3 HSV/pcDNA3 or vector alone into PLC/PRF/5 and LE cells (14) was performed by using the Lipofectamine Reagent (Life Technologies). Stable transfectants were selected by incubation with geneticin (G418; GIBCO/BRL) and screened for dysadherin expression by immunofluorescent staining and immunoblotting. L3 cDNA was also subcloned into pGEX vector (Amersham Pharmacia) to produce glutathione S-transferase fusion protein.
Immunocytochemistry, Immunohistochemistry, and Electron Microscopy.
Cells were grown on glass coverslips up to subconfluence, then fixed with 2% paraformaldehyde containing 2% sucrose in PBS on ice. Coverslips were washed briefly in PBS and incubated with primary antibody. After washes in PBS, the samples were incubated with FITC-labeled secondary antibody. All antibodies were diluted in 2% normal swine serum. The samples were then washed extensively in PBS, mounted with Perma Fluor (Lipshaw Immunon, Pittsburgh). Cy2-labeled NCC-3G10 and biotinylated HECD-1 (anti-E-cadherin) (22) followed by Rhodamin avidin D (Vector Laboratories) or rhodamin-labeled phalloidin were used for double staining. CD3, T cell marker (NovoCastra, Newcastle, U.K.) and CD79a, B cell marker (Dako) antibodies were used to determine a lymphocyte subtype. As a negative control, cells were incubated with 2% normal swine serum instead of primary antibodies. Samples were examined with a Zeiss Axiophot photomicroscope or a Zeiss LSM 410 confocal laser-scanning microscope.
For bead assay, latex beads were coated with NCC-3G10 and incubated with cells as described by Braga et al. (23) and analyzed. Immunohistochemistry was performed on routinely processed formalin-fixed, paraffin-embedded human and mouse tissues by using an avidin-biotin peroxidase complex method (24). Specimens were classed as −, negative; +, positive in <20%, or ++, positive in >20% of cancer cells, according to the percentage of cells with membrane staining. For electron microscope analysis, glutaraldehyde-fixed cells were dehydrated in a graded ethanol series, and then specimens were embedded in LR-white resin. Ultrathin sections were cut and collected on nickel grids covered with apolvinyl formvar film. After overnight incubation with NCC-3G10, the sections were treated with 5-nm gold-conjugated goat anti-mouse IgG (British BioCell, Cardiff, U.K.). The immunolabeled thin sections were stained with uranyl acetate and lead citrate and examined on a JEOL-1010 electron microscope at an accelerating voltage of 80 kV.
Ca2+-Dependent Aggregation Assay.
The cell–cell adhesion ability was quantified in an aggregation assay as described (25). In brief, cultures were dissociated into single-cell suspensions under E-cadherin-saving conditions. They were incubated under Gyratory shaking at 80 rpm for 30 min in 10 mM Hepes (pH 7.4), 150 mM NaCl containing 1% BSA and 5 mM Ca2+. The aggregation index was expressed as 1-(N30/N0), where N0 and N30 indicate the initial number of particles and the number of particles after 30 min of aggregation as measured by a hemocytometer, respectively. All N0 and N30 measurements were done in triplicate, and the experiments were repeated at least three times.
Liver Metastasis Assay.
Severe combined immunodeficient male mice (6 weeks of age) were obtained from CLEA Japan (Tokyo) and maintained in a specific pathogen-free environment. Experimental metastatic assay was done as described by Giavazzi et al. (26).
Briefly, severe combined immunodeficient mice were given intrasplenic injection of 1 × 10⁶ of AL3 or mock transfectants as a control in 50 μl medium. Local or metastatic tumor formation was macroscopically evaluated 2 weeks later. The experiments were repeated at least twice. Organs were then fixed in acetone and processed for histological examination and immunohistochemical analysis.
Statistical Analysis.
The postsurgical curves for a total of 58 patients with stage II breast cancer were expressed as described by Kaplan and Meier (27). Statistical significance was determined by the Cox–Mantel test (28).
Results
Establishment and Characterization of mAb NCC-3G10.
The mAb NCC-3G10 (IgG1,k) was selected on the basis of its strong membrane staining in several cancer tissues and cell lines. The antibody showed strong reactivity to a wide variety of cancer cells, but only to a limited number of normal cells such as lymphocytes, endothelial cells, and basal cells of stratified squamous epithelium (Fig. 1, Table 1). The antigen recognized by NCC-3G10 was distributed mainly on the cell membrane of cancer cells. Double immunostaining with anti-E-cadherin antibody showed that both antibodies reacted at the point of cell–cell contact between carcinoma cells but only NCC-3G10 reacted with the free surface of cells at the periphery or dissociating cells. NCC-3G10 did not always react at regions of cell–cell contact, but tended to react more strongly with dissociated cells or infiltrative tumor nests than with well-differentiated tumor nests. The NCC-3G10-positive lymphocytes were indicated to be T cells because they reacted with the T cell marker CD3 but not with the B cell marker CD79a.
Figure 1.

Immunohistochemical staining of NCC-3G10 in human tissues. Positive staining is observed in invasive bladder carcinoma (A) and invasive colon cancer (B). In normal tissues, basal cells of esophageal epithelum, endothelial cells, and some lymphocytes are positively stained (C). Double immunofluorecence reaction with Cy2-labeled NCC-3G10 (green) and biotinylated HECD-1, avidin-rhodamin (red) of infiltrating ductal carcinoma of the breast (D), is shown. Arrows indicate dissociating cancer cells stained only with NCC-3G10. (Magnifications: A and C, ×70; B and D, ×90.)
Table 1.
Expression of dysadherin in several types of cancer and normal tissues
| Tissues | Cases | Reactivity of NCC-3G10
|
||
|---|---|---|---|---|
| ++(%) | +(%) | −(%) | ||
| Cancer tissues | ||||
| Breast | 74 | 45 (61) | 0 (0) | 29 (39) |
| Cervix | 22 | 13 (59) | 9 (41) | 0 (0) |
| Lung | 19 | 12 (63) | 1 (5) | 6 (32) |
| Esophagus | 11 | 8 (73) | 1 (5) | 2 (18) |
| Stomach | 34 | 19 (51) | 1 (3) | 15 (45) |
| Colon | 37 | 18 (52) | 9 (24) | 9 (25) |
| Bladder | 15 | 13 (87) | 2 (13) | 0 (0) |
| Normal tissues immunoreactive to NCC-3G10 | ||||
| Endothelial cells | ||||
| T cell lymphocytes | ||||
| Basal cell of squamous epithelium | ||||
Specimens were classed as −, negative; +, positive in <20% and ++, positive in >20% of cancer cells, according to the cells with cell surface membrane staining.
cDNA Cloning.
A partial cDNA clone encoding the epitope recognized by the mAb NCC-3G10 was isolated by immunoscreening of a λgt11 cDNA expression library. The cDNA clone L3, which contained the entire ORF and the longest 5′ end region, was isolated from a human leukocyte cDNA library by using the partial cDNA clone as a probe.
The cDNA clone L3 comprised 872 bp with a poly(A) tail and covered the entire ORF, which encoded 178 aa (Fig. 2A). The nucleotide sequence of another clone, L64, contained an additional 60 bp before the initiation codon but did not affect the ORF. The deduced amino acid sequence consisted of two hydrophobic regions corresponding to a signal peptide and a transmembrane domain, a serine-, threonine-, and proline-rich extracellular domain, which is a target for O-glycosylation, and a short cytoplasmic region containing positively charged amino acid residues. Comparison with the known sequences revealed that dysadherin (antigen recognized by NCC-3G10) closely resembled mouse RIC (related to ion channels) (29). The signal peptide, the extracellular domain, the transmembrane domain, and the cytoplasmic region of dysadherin showed 81%, 26%, 100%, and 69% similarity, respectively, with that of mouse RIC. The transmembrane domain of dysadherin and mouse RIC especially showed a very high degree of similarity to other ion channels such as Mat-8 chloride channel, phospholemman, which is the major plasma membrane substrate for cAMP-dependent protein kinase and protein kinase C, and the γ subunit of Na+,K+-ATPase (Fig. 2B).
Figure 2.

(A) Full-length cDNA sequence of dysadherin and its homology to related proteins. An in-frame TGA stop codon (*). Two hydrophobic regions (underlined) and amino acids 146–162 encompass the putative transmembrane domain. (B) Identity among Dysadherin, mouse RIC and other related ion channels, Mat-8, human phospholemman (PLM), and human gamma Na+,K+-ATPase.
The cDNA produced a 45-kDa glutathione S-transferase-fusion protein when expressed in Escherichia coli (Fig. 3A, lane 2) and a 55-kDa protein when expressed in mammalian cells (Fig. 3B, lane 7), both of which were recognized by NCC-3G10. In several cell lines, the mAb NCC-3G10 recognized proteins of slightly different molecular size ranging between 50 and 55 kDa (Fig. 3B). A difference of molecular size in these cells and between deduced size (20-kDa molecule expressed in E. coli) and actual size (50-to 55-kDa molecule expressed in mammalian cells) was thought to be caused by a different level of O-glycosylation, which is supported by sequence data and direct detection of glycosylation (data not shown).
Figure 3.

Western blot analysis of recombinant and native dysadherin. (A) Glutathione S-transferase fusion protein expressed in E. coli reacted with NCC-3G10 (lane 2) and the negative control without primary antibody (lane 1). (B) Cell lysates from the cell lines indicated were prepared, and 20 μg/lane protein aliquots were subjected to Western blot analysis. Lane 1: Li-7. Lane 2: PC-10. Lane 3: HT29. Lane 4: NCC-Co31. Lane 5: HUVECT. Lane 6: PLC/PRF/5. Lane 7: PLC/PRF/5 transfected with L3-herpes simplex virus/pcDNA3 (AL3–1).
Introduction of Dysadherin Down-Regulates E-Cadherin Function.
We screened expression of dysadherin by Western blot in more than 30 cell lines including stomach, colon, pancreas, and liver cancer cell lines and found that most cell lines expressed dysadherin at variable levels. In liver cancer cell lines, expression levels were relatively low compared with other cell lines, and we found that PLC/PRF/5 liver cancer cells do not express it at either the protein or mRNA level. Therefore we introduced L3 cDNA into PLC/PRF/5 cells to determine the biological function of dysadherin. Three stable transfectants (AL3–1, -6, and -7) and two mock transfectants (AV1 and AV11) were established and analyzed. Immunocytochemical staining demonstrated negative staining in parent or mock transfectants, but detected dysadherin along the cell membrane in L3 cDNA transfectants (Fig. 4). On phase-contrast micrographs, L3 cDNA transfectants had abundant cytoplasm and distinct cell–cell borders compared with mock transfectants (Fig. 4). Further observation with immunoelectron microscopy demonstrated tight cell–cell contact with intercellular junctions in mock transfectants, whereas L3 cDNA transfectants had intercellular spaces filled with numerous microvilli (Fig. 5 A and B). Furthermore, dysadherin was observed on the surface cell membrane of L3 cDNA transfectants (Fig. 5C). These morphological changes in L3 cDNA transfectants suggested decreased cell–cell adhesiveness, so expression of E-cadherin and catenins was analyzed (Fig. 6). Expression of E-cadherin and α-catenin protein was remarkably decreased in L3 cDNA transfectants compared with mock transfectants on Western blots, but expression of β- and γ-catenins was not changed (Fig. 6A). Equal loading of protein in each lane was confirmed by Coomassie staining of blotting membranes, and the levels of E-cadherin expression were confirmed by serial dilution of loading amounts of protein in each cell. On Northern blots, E-cadherin was expressed at equivalent levels in L3 cDNA transfectants and with mock transfectants, suggesting posttranscriptional modification of E-cadherin by dysadherin (Fig. 6B). We next examined E-cadherin function by cell aggregation assay. In accordance with decreased expression of E-cadherin protein, Ca2+-dependent cell aggregation was down-regulated in L3 cDNA transfectants compared with mock transfectans (Fig. 6C). We stably introduced L3 cDNA into LE cells (mouse fibroblast L cell transfected with E-cadherin) and again found that E-cadherin expression is decreased at the protein level by means of functional inactivation in inverse proportion to the level of dysadherin expression (Fig. 7). To examine the posttranscriptional modification of E-cadherin by dysadherin, we added beads coated with NCC-3G10 antibody to cells. NCC-3G10-coated beads accumulated dysadherin, which further recruited actin filaments shown by phalloidin staining around the beads, whereas BSA-coated beads had no effect (Fig. 8).
Figure 4.
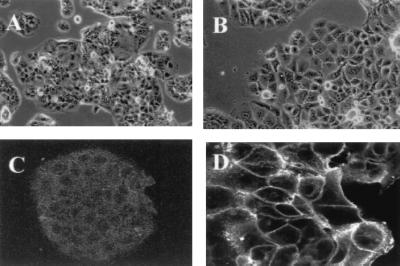
Morphology of the mock transfectant and L3 cDNA-transfected cell lines. Phase-contrast micrograph of mock transfectant AV1 (A) and L3 cDNA transfectant AL3–7 (B). Immunostaining with NCC-3G10 in mock transfectant AV1 (C) and L3 cDNA transfectant AL3–7 (D). (Magnifications: A and B, ×70; C, ×90; D, ×120.)
Figure 5.
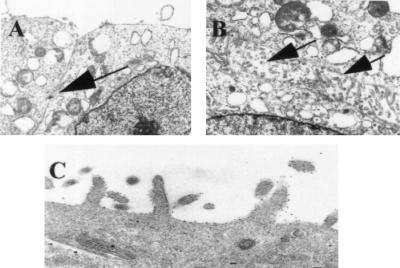
Electron micrograph of L3 cDNA transfectant. Tight cell–cell contact in mock transfectant, AV1 with intercellular junction (arrow) (A). L3 cDNA transfectant AL3–7 with abundant microvilli (arrows) on the cell surface membrane (B). Immunoelectronmicroscopy of the L3 cDNA transfectant AL3–1 indicates localization of dysadherin on the cell membrane (C). (Magnifications: A and B, ×2,000; C, ×10,000.)
Figure 6.

Expression and function of E-cadherin in L3 cDNA transfectants. Protein expression of E-cadherin, catenins, and dysadherin in parent cells, mock transfectants (AV1 and AV11), and L3 cDNA transfectants (AL3–1, -6, and -7). Indicated are the relative expression level of E-cadherin and α-, β-, γ-catenins in L3 cDNA transfectants and mock transfectants compared with parent cells by densitometry (A). Northern blot analysis for E-cadherin and dysadherin (B). The cell aggregation assay was carried out as described in Materials and Methods (C).
Figure 7.

Dysadherin down-regulates E-cadherin in LE cells. Expression of mouse E-cadherin and dysadherin in mock (clones V7 and V9) and L3 cDNA transfectants (clones 2, 20, 6, and 16) (A). Aggregation assay for E-cadherin function (B).
Figure 8.

Recruitment of actin by dysadherin accumulation in bead assay. HUVECT were incubated for 30 min with a suspension of latex beads coated with BSA (A) or NCC-3G10 (B and C). Cells were stained with NCC-3G10 (B) or double-stained with NCC-3G10 (green) and phalloidin (red) (C). (Magnifications: A, ×90; B and C, ×150.)
Metastatic Activity of AL3 Transfectants.
Inactivation of cadherin-mediated cell–cell adhesion is supposed to be involved in metastasis of cancer, so we examined the metastatic activity of the L3 cDNA transfectants and mock transfectants by injecting cells into the spleen of severe combined immunodeficient mice. L3 cDNA transfectants (AL3–1, -6, and -7) formed more colonies in the liver than parental cells or mock transfectants (AV1 and AV11) (Fig. 9). Tumor cells in metastatic nodules of L3 cDNA transfectants were positive for dysadherin but negative for E-cadherin (Fig. 9 D and E). We also examined expression of this antigen in surgically resected breast cancer tissues and compared this to postsurgical outcome of patients. Kaplan–Meier analysis revealed that metastasis-free survival was significantly longer in patients negative for dysadherin expression (P < 0.05) (Fig. 10).
Figure 9.

Liver metastasis of Dysadherin transfectants. (A) Number of colonies of liver metastases in PLC/PRF/5 cells, mock AV1, AV11, and L3 cDNA transfectants (AL3–1, -6, and -7). L3 cDNA transfectants (AL3–7) formed multiple metastases in the liver after intrasplenic injection (B), but mock transfectants (AV11) did not (C). Immunohistochemical staining of dysadherin (D) and E-cadherin (E) in liver metastasis of L3 cDNA transfectants (AL3–7) (B). (Magnifications: D and E, ×70.)
Figure 10.

Kaplan–Meier survival curve of breast cancer stage II patients. A significant difference in disease-free survival is observed between dysadherin-positive and -negative cases. Statistical difference was determined by the Cox–Mantel test, P < 0.05.
Discussion
In this study, we used a mAb to isolate a membrane type of glycoprotein named dysadherin, which is overexpressed in many types of cancer and down-regulates E-cadherin. Homology search revealed that human dysadherin closely resembled mouse RIC (29). The RIC gene is activated transcriptionally in NIH 3T3 cells transformed by E2a-Pbxl. The transmembrane domain of dysadherin in particular showed a high degree of similarity to RIC and other ion channels. These are small single-span membrane proteins containing a 35-aa signature sequence that includes seven invariant amino acids before, and just after the membrane span, and they were named the FXYD family (30). Therefore dysadherin could be an additional member of this family. At present, it is not clear whether RIC and dysadherin have any role as ion channels, but elevated expression of RIC mRNA in NIH 3T3 cells transformed by v-Ras, Neu, or v-Src suggests commonn transcriptional regulation with dysadherin, which is also elevated in many types of cancer. Recently, a cDNA sequence almost identical to that of dysadherin was isolated from the library of human CD34+ hematopoietic stem/progenitor cells (HSPC 113, GenBank accession no. AF161462) (31) and registered without functional information.
Histologically, dysadherin tended to be expressed where the cell–cell contact is loose. Dysadherin transfection induced decreased protein expression and function of E-cadherin without affecting its expression of the mRNA level. These findings suggested dysadherin has some role in posttranscriptional down-regulation of E-cadherin. At present this regulatory mechanism is not clear, but the present findings suggest that abundant glycosylation, microvilli formation, and interaction with actin could modify E-cadherin function. Dysadherin contains a Ser-Thr-Pro-rich extracellular domain that is typical to cell membrane-associated mucins and is known to be subjected to extensive O-linked glycosylation, sialylation, and sulfation (32). Episialin (MUC1) is reported to suppress E-cadherin function by means of its highly glycosylated extracellular domain (33). Therefore study is ongoing on the importance of the extracellular domain of dysadherin. Electron microscopy revealed that numerous microvilli developed in the intercellular space of dysadherin transfectants. At present it is not clear whether these microvilli are a cause or effect of down-regulation of E-cadherin, but possible interaction of dysadherin and actin suggests that dysadherin could have some role in microvilli formation. The interaction of dysadherin and actin also might affect E-cadherin function through competing with actin bound to E-cadherin by means of catenins.
In conclusion, we suggest that the membrane glycoprotein dysadherin is involved in down-regulation of E-cadherin, which plays important roles in tumor development and metastasis. Limited expression of dysadherin in normal cells also suggests a physiological role for this antigen.
Acknowledgments
This work was supported by the Second Term Comprehensive 10-Year Strategy for Cancer Control from the Ministry of Health, Labor, and Welfare of Japan.
Abbreviation
- RIC
related to ion channels
Footnotes
This paper was submitted directly (Track II) to the PNAS office.
Data deposition: The sequence reported in this paper has been deposited in the GenBank database (accession no. AB072911).
References
- 1.Takeichi M. Annu Rev Biochem. 1990;59:237–252. doi: 10.1146/annurev.bi.59.070190.001321. [DOI] [PubMed] [Google Scholar]
- 2.Nagafuchi A, Ishihara S, Tsukita S. J Cell Biol. 1994;127:235–245. doi: 10.1083/jcb.127.1.235. [DOI] [PMC free article] [PubMed] [Google Scholar]
- 3.Knudsen K A, Soler A P, Johnson K R, Wheelock M J. J Cell Biol. 1995;130:67–77. doi: 10.1083/jcb.130.1.67. [DOI] [PMC free article] [PubMed] [Google Scholar]
- 4.Rimm D L, Koslov E R, Kebriaei P, Cianci C D, Morrow J S. Proc Natl Acad Sci USA. 1995;92:8813–8817. doi: 10.1073/pnas.92.19.8813. [DOI] [PMC free article] [PubMed] [Google Scholar]
- 5.Behrens J, Mareel M M, Van Roy F M, Birchmeier W. J Cell Biol. 1989;108:2435–2447. doi: 10.1083/jcb.108.6.2435. [DOI] [PMC free article] [PubMed] [Google Scholar]
- 6.Chen W C, Obrink B. J Cell Biol. 1991;114:319–327. doi: 10.1083/jcb.114.2.319. [DOI] [PMC free article] [PubMed] [Google Scholar]
- 7.Frixen U H, Behrens J, Sachs M, Eberle G, Voss B, Warda A, Lochner D, Birchmeier W. J Cell Biol. 1991;113:173–185. doi: 10.1083/jcb.113.1.173. [DOI] [PMC free article] [PubMed] [Google Scholar]
- 8.Hirohashi S. Am J Pathol. 1998;153:333–339. doi: 10.1016/S0002-9440(10)65575-7. [DOI] [PMC free article] [PubMed] [Google Scholar]
- 9.Oda T, Kanai Y, Oyama T, Yoshiura K, Shimoyama Y, Birchmeier W, Sugimura T, Hirohashi S. Proc Natl Acad Sci USA. 1994;91:1858–1862. doi: 10.1073/pnas.91.5.1858. [DOI] [PMC free article] [PubMed] [Google Scholar]
- 10.Machado J C, Soares P, Carneiro F, Rocha A, Beck S, Blin N, Berx G, Sobrinho-Simoes M. Lab Invest. 1999;79:459–465. [PubMed] [Google Scholar]
- 11.Hirano S, Kimoto N, Shimoyama Y, Hirohashi S, Takeichi M. Cell. 1992;70:293–301. doi: 10.1016/0092-8674(92)90103-j. [DOI] [PubMed] [Google Scholar]
- 12.Fukuchi T, Sakamoto M, Tsuda H, Maruyama K, Nozawa S, Hirohashi S. Cancer Res. 1998;58:3526–3528. [PubMed] [Google Scholar]
- 13.Yoshiura K, Kanai Y, Ochiai A, Shimoyama Y, Sugimura T, Hirohashi S. Proc Natl Acad Sci USA. 1995;92:7416–7419. doi: 10.1073/pnas.92.16.7416. [DOI] [PMC free article] [PubMed] [Google Scholar]
- 14.Hoschuetzky H, Aberle H, Kemler R. J Cell Biol. 1994;127:1375–1380. doi: 10.1083/jcb.127.5.1375. [DOI] [PMC free article] [PubMed] [Google Scholar]
- 15.Hirohashi S, Shimosato Y, Kameya T, Koide T, Mukojima T, Taguchi Y, Kageyama K. Cancer Res. 1979;39:1819–1828. [PubMed] [Google Scholar]
- 16.Yasui N, Sakamoto M, Ochiai A, Ino Y, Akimoto S, Orikasa A, Kitajima M, Hirohashi S. Invasion Metastasis. 1997;17:259–269. [PubMed] [Google Scholar]
- 17.Shimoyama Y, Takeda H, Yoshihara S, Kitajima M, Hirohashi S. J Biol Chem. 1999;274:11987–11994. doi: 10.1074/jbc.274.17.11987. [DOI] [PubMed] [Google Scholar]
- 18.Hirohashi S, Watanabe M, Shimosato Y, Sekine T. Gann. 1984;75:485–488. [PubMed] [Google Scholar]
- 19.Maniatis T, Efstratiadis A, Sim G K, Kafatos F. Natl Cancer Inst Monogr. 1978;48:9–10. [PubMed] [Google Scholar]
- 20.Laemmli U K. Nature (London) 1970;227:680–685. doi: 10.1038/227680a0. [DOI] [PubMed] [Google Scholar]
- 21.Towbin H, Staehelin T, Gordon J. Proc Natl Acad Sci USA. 1979;76:4350–4354. doi: 10.1073/pnas.76.9.4350. [DOI] [PMC free article] [PubMed] [Google Scholar]
- 22.Shimoyama Y, Hirohashi S, Hirano S, Noguchi M, Shimosato Y, Takeichi M, Abe O. Cancer Res. 1989;49:2128–2133. [PubMed] [Google Scholar]
- 23.Braga V M, Machesky L M, Hall A, Hotchin N A. J Cell Biol. 1997;137:1421–1431. doi: 10.1083/jcb.137.6.1421. [DOI] [PMC free article] [PubMed] [Google Scholar]
- 24.Hsu S M, Raine L, Fanger H. J Histochem Cytochem. 1981;29:577–580. doi: 10.1177/29.4.6166661. [DOI] [PubMed] [Google Scholar]
- 25.Shimoyama Y, Nagafuchi A, Fujita S, Gotoh M, Takeichi M, Tsukita S, Hirohashi S. Cancer Res. 1992;52:5770–5774. [PubMed] [Google Scholar]
- 26.Giavazzi R, Campbell D E, Jessup J M, Cleary K, Fidler I J. Cancer Res. 1986;46:1928–1933. [PubMed] [Google Scholar]
- 27.Kaplan E L, Meier P. J Am Stat Assoc. 1958;53:457–481. [Google Scholar]
- 28.Katagiri A, Watanabe R, Tomita Y. Br J Cancer. 1995;71:376–379. doi: 10.1038/bjc.1995.76. [DOI] [PMC free article] [PubMed] [Google Scholar]
- 29.Fu X, Kamps M P. Mol Cell Biol. 1994;17:1503–1512. doi: 10.1128/mcb.17.3.1503. [DOI] [PMC free article] [PubMed] [Google Scholar]
- 30.Sweadner K J, Rael E. Genomics. 2000;68:41–56. doi: 10.1006/geno.2000.6274. [DOI] [PubMed] [Google Scholar]
- 31.Zhang Q H, Ye M, Wu X Y, Ren S X, Zhao M, Zhao C J, Fu G, Shen Y, Fan H Y, Lu G, et al. Genome Res. 2000;10:1546–1560. doi: 10.1101/gr.140200. [DOI] [PMC free article] [PubMed] [Google Scholar]
- 32.Hilkens J, Ligtenberg M J, Vos H L, Litvinov S V. Trends Biochem Sci. 1992;17:359–363. doi: 10.1016/0968-0004(92)90315-z. [DOI] [PubMed] [Google Scholar]
- 33.Makiguchi Y, Hinoda Y, Imai K. Jpn J Cancer Res. 1996;87:505–511. doi: 10.1111/j.1349-7006.1996.tb00252.x. [DOI] [PMC free article] [PubMed] [Google Scholar]