

Abstract
Brain microvascular endothelial cells, which lie at the interface between blood and brain, are critical to brain energetics. These cells must precisely balance metabolizing nutrients for their own demands with transporting nutrients into the brain to sustain parenchymal cells. It is essential to understand this integrated metabolism and transport so that we can develop better diagnostics and therapeutics for neurodegenerative diseases such as Alzheimer’s disease, multiple sclerosis, and traumatic brain injury. In this chapter, we first describe brain microvascular endothelial cell metabolism and how these cells regulate both blood flow and nutrient transport. We then explain the impact of brain microvascular endothelial cell metabolism on the integrity of the blood-brain barrier, as well as how metabolites produced by the endothelial cells impact other brain cells. We detail some ways that cell metabolism is typically measured experimentally and modeled computationally. Finally, we describe changes in brain microvascular endothelial cell metabolism in aging and neurodegenerative diseases. At the end of the chapter, we highlight areas for future research in brain microvascular endothelial cell metabolism. The goal of this chapter is to underscore the importance of nutrient metabolism and transport at the brain endothelium for cerebral health and neurovascular disease treatment.
1. Introduction and brain microvascular endothelial cell metabolism overview
Brain microvascular endothelial cells (BMEC) lie at the border between blood and brain and are therefore essential to ensuring that the brain gets the nutrients it needs. BMEC take up nutrients, including glucose, amino acids, and fatty acids from the blood. They then metabolize these nutrients or transport them on to cells in the brain. BMEC tightly control their own metabolism, since altered BMEC metabolism contributes to disruption of the brain endothelial barrier. BMEC also tightly control what nutrients they transport into the brain, since too much of essential nutrients can be damaging to brain parenchymal cells. The delicate balance among nutrient uptake, metabolism, and transport can be disrupted in disease and contribute to the progression of neurological diseases such as Alzheimer’s disease and Parkinson’s disease. It is therefore important to mechanistically study interrelated BMEC metabolism and nutrient transport to develop new diagnostics and therapies for neurological diseases.
Endothelial cells primarily use glycolysis for ATP production, even in the presence of oxygen (De Bock et al., 2013; Krützfeldt, Spahr, Mertens, Siegmund, & Piper, 1990; Weber et al., 2022). In glycolysis, cells metabolize glucose to pyruvate in a cytoplasmic process that is regulated by several rate-limiting enzymes (e.g., hexokinase, phosphofructokinase). Pyruvate can then be converted to acetyl-CoA, imported into the mitochondria, and metabolized in the TCA cycle. Alternatively, pyruvate can be converted to lactate and exported from the cell. There are also several important glycolysis side branches, including the pentose phosphate pathway and the hexosamine biosynthetic pathway. In the pentose phosphate pathway, which is catalyzed by the rate-limiting enzyme glucose-6-phosphate dehydrogenase (G6PD), glucose-6-phosphate is metabolized to form antioxidants and nucleotide synthesis precursors. In the hexosamine biosynthetic pathway, fructose-6-phosphate is metabolized into uridine diphosphate N-acetyl glucosamine (UDP-GlcNac) via the rate-limiting enzyme glutamine fructose-6-phosphate aminotransferase (GFAT). UDP-GlcNac is then the substrate for protein glycosylation reactions.
Although they are highly glycolytic, endothelial cells depend on mitochondrial oxidative metabolism for energy and to modulate intracellular processes through, for example, changes in calcium or oxidative stress. Endothelial cells fuel the TCA cycle primarily through the amino acid glutamine (Kim, Li, Jang, & Arany, 2017). Glutaminase converts glutamine to glutamate, which is then converted to α-ketoglutarate to enter the TCA cycle. Glutamine also serves as an important source of carbons and nitrogens for protein synthesis. Endothelial cells can also use fatty acid oxidation to fuel the TCA cycle. Fatty acids are shuttled from the cytoplasm into the mitochondria, where they are oxidized to produce ATP. Indeed, endothelial cells with different phenotypes tend to use different metabolites. For example, migrating endothelial cells rely heavily on glucose, proliferating endothelial cells depend on glutamine, and quiescent endothelial cells increase fatty acid oxidation (Kalucka et al., 2018; Kim et al., 2017). Thus, the metabolic may both fuel and determine endothelial function.
In this chapter, we detail the impacts of BMEC metabolism on endothelial barrier function. We first describe how BMEC support brain metabolism by dynamically altering brain blood flow and selectively transporting nutrients into the brain. We then describe how BMEC metabolism supports BMEC barrier function and the function of other cerebral cell types. We further illustrate the different ways in which BMEC metabolism can be measured and modeled in vitro, in vivo, and using computational techniques. We also explain how BMEC metabolic function may play an important role in aging and disease. Finally, we describe future opportunities and challenges in BMEC metabolism research. We hope this chapter will inspire more researchers to explore BMEC metabolism as a potential way to better understand cerebral function and develop new therapies for neurodegenerative diseases.
2. BMEC support brain metabolism
BMEC play a critical role in supporting brain metabolism by precisely regulating cerebral blood flow and by selectively transporting essential nutrients such as glucose into the brain. These cells are uniquely positioned to dictate metabolite availability for other brain cells and just as importantly, remove toxic metabolic byproducts produced by parenchymal cells. Nutrient regulation is a dynamic process in which BMECs respond to cues from other cell types to fulfill the brain’s energetic needs. In this section, we explore how brain endothelial cells supply and dynamically respond to the metabolic needs of other brain cell types by managing blood flow and nutrient transport.
2.1. Neurovascular coupling
Neurovascular coupling (NVC), also known as functional hyperemia, is a complex physiological phenomenon that regulates cerebral blood flow in response to metabolic demand in the brain (Fig. 1). Cerebral blood flow (CBF) must be tightly regulated as hypoperfusion can lead to ischemia and tissue damage, while hyperperfusion can increase intracranial pressure and lead to tissue compression (Venkat, Chopp, & Chen, 2016). NVC is therefore a crucial mechanism to safely maintain brain metabolic homeostasis. NVC is typically initiated by neuronal or glial activation; involves multiple cell types of the neurovascular unit (NVU), including BMECs, neurons, pericytes, and smooth muscle cells; and is regulated at vascular hierarchies ranging from capillaries to arterioles.
Fig. 1.

In, neurovascular coupling, endothelial cells adjust blood flow in response to signals received from cerebral parenchymal cells. (1) Under states of high activity, neurons release potassium ions (K+). (2) Extracellular potassium is detected by potassium ion channels (most notably KIR2.1 in BMEC), which causes BMEC hyperpolarization. (3) The hyperpolarization signal propagates upstream in the vessel via gap junctions connecting adjacent endothelial cells. (4) When the hyperpolarization signal reaches upstream arterioles, it induces vasorelaxation and arteriolar dilation, which subsequently increases blood flow. The increased blood flow brings increased glucose, oxygen, and other important metabolic substrates to the brain. Figure created with BioRender.
The traditional NVC paradigm postulated that parenchymal artery smooth muscle cells (SMCs) were the primary target of vasodilatory factors such as ATP, nitric oxide (NO), prostaglandin, and potassium ions (Zhu, Neuhaus, Beard, Sutherland, & DeLuca, 2022). These agents were proposed to trigger SMC relaxation, leading to arteriolar dilation and increased downstream blood flow. However, this paradigm would require vasodilatory factors to traverse long distances in the brain to reach and then dilate the relatively sparse upstream arterioles (Longden et al., 2017). Therefore, a new paradigm was proposed that placed capillary vessels and BMEC at the center of NVC. Capillaries form dense vascular networks in the brain that are in close physical proximity to other brain cells. On average, the distance that a signaling molecule must travel between neuronal cell body and a capillary is only 15 μM (Longden et al., 2017). In this paradigm, neural activity leads to potassium ion (K+) accumulation. BMEC inward-rectifier K+ (KiR) channels, primarily the KIR2.1 isoform, then open in response to the high K+ concentration. BMEC activation and membrane hyperpolarization induced by KIR2.1 generates electrical signals that rapidly travel upstream from capillaries to arterioles through intercellular gap junctions (Fig. 1). These electrical signals then cross into arteriolar SMCs through gap junctions, where they induce SMC relaxation, arteriolar vasodilation, and increased local CBF and hence nutrient delivery (Longden et al., 2017). Throughout this process, BMEC act as dynamic sensors that rapidly react to local neuronal activity changes.
Disrupted KIR2.1 activity has been observed in several neurological diseases. Transgenic mice overexpressing amyloid precursor protein (APP; as a model of Alzheimer’s disease) or a constitutively active form of transforming growth factor β1 (TGF-β1, as a model of cerebrovascular inflammation) achieved only 37% and 10%, respectively, of the KIR2.1-mediated vasodilation observed in wild type mice (Lacalle-Aurioles, Trigiani, Bourourou, Lecrux, & Hamel, 2022). Antioxidant and anti-inflammatory treatments restored KIR2.1-mediated vasodilation, suggesting that KIR2.1 function is modulated by both oxidative stress and inflammation. In a murine model of a cerebral small vessel disease called cerebral autosomal dominant arteriopathy with subcortical infarcts and leukoencephalopathy (CADASIL), brain capillary endothelial cells demonstrated decreased KIR2.1 activity caused by decreased synthesis of the membrane phospholipid phosphatidylinositol 4,5-bisphosphate (PIP2), which is essential for KIR2.1 activity (Dabertrand et al., 2021). Similarly in a mouse model of familial Alzheimer’s disease (5xFAD), impaired NVC occurred along with decreased KIR2.1 activity (Mughal, Harraz, Gonzales, Hill-Eubanks, & Nelson, 2021). In both murine models, soluble PIP2 injection partially corrected these NVC deficiencies (Dabertrand et al., 2021; Mughal et al., 2021).
Recent studies have uncovered other important signaling agents that are involved in BMEC-mediated NVC. Transient receptor potential ankyrin 1 (TRPA1) channels in BMECs were recently found to produce a calcium (Ca2+) electrical current that propagates upstream to trigger arteriolar vasodilation, similar to the previously described potassium electrical current. However, in this model, metabolically active neurons, astrocytes, and pericytes are proposed to generate extracellular reactive oxygen species (ROS), which enter BMECs and trigger production of the TRPA1 agonist 4-hydroxynonenal (4-HNE) (Thakore et al., 2021). It is likely that both of the aforementioned mechanisms play a role in BMEC-mediated NVC, as redundant and overlapping mechanisms are expected to regulate this critical process. Further work is required to elucidate other mechanisms involved in BMEC-mediated NVC.
2.2. Nutrient transport
BMEC are responsible for transporting nutrients from the circulation into the brain. The brain endothelium is connected by tight junction proteins, which allow only small intercellular gaps (1.4–1.8 nm) and make the blood vessels essentially impermeable to paracellular transport (Zhang, Li, Meng, Wang, & Liao, 2016). Therefore, BMEC primarily use facilitative transport for nutrient uptake and transport because caveolae-mediated transport is suppressed in the healthy brain endothelium (Andreone et al., 2017). Since nutrients must first be selectively taken up by BMEC and then selectively secreted basolaterally for use by brain parenchymal cells, BMEC nutrient transporter expression, regulation, and localization dictates parenchymal nutrient availability. In this section, we detail important brain nutrients, the relevant transporters, and how they are altered in disease (Fig. 2).
Fig. 2.

BMECs use different mechanisms to transport vital nutrients into the brain. Glucose is primarily transported through GLUT1 located on both apical and basolateral membranes. Through GLUT1, glucose can be directly shuttled into the interstitial fluid. Glucose may also enter neighboring pericytes and astrocytes by diffusing through gap junctions that link these cells with endothelial cells. Glucose can also be converted into lactate via glycolysis and then fuel pericytes. Parenchymal brain cells produce lactate, which can become neurotoxic at high levels. MCT1 is crucial for BMEC-mediated efflux of lactate. Fatty acids can passively diffuse into BMECs by dissociating from albumin. Proteins such as FABP help stabilize fatty acids intracellularly and can also mediate their transport to the interstitial fluid. Another route for fatty acid uptake is through uptake of lipoprotein particles, such as low-density lipoprotein particles (LDL), which are infused with lipids. LDL is taken up through receptor mediated endocytosis and internalized into the lysosome, where it is hydrolyzed to release fatty acids. Free fatty acids can then be transported into the brain. Figure created with BioRender.
2.2.1. Glucose
Glucose is the primary energy source in the brain, and therefore its transport has been extensively characterized (Mergenthaler, Lindauer, Dienel, & Meisel, 2013). Glucose cannot diffuse across the brain endothelium and must enter the brain through BMEC glucose transporters. Glucose transport is regulated so that cerebral glucose levels only reach 20% of blood glucose levels, which is just sufficient for neuronal demand (Barros et al., 2017). This tight glucose regulation is hypothesized to balance the reliance of the brain on glucose for energy while simultaneously preventing potential neurotoxic glucose effects (Barros et al., 2017). Glucose transported across the brain endothelium is either released into the cerebrospinal fluid (CSF) or diffuses into the gap junctions of astrocytes that are in contact with BMEC.
The most prominent BMEC glucose transporter is GLUT1, a sodium-independent glucose transporter. GLUT1 is found at much higher levels in BMECs than in peripheral endothelial cells (Winkler et al., 2015). The importance of GLUT1 in cerebral glucose transport was shown by the fact that CSF glucose concentrations were low (<2.5 mmol/L) in patients with GLUT1 deficiency syndrome compared to the reference range for healthy individuals (2.5–3.7 mmol/L) (Leen et al., 2010). Approximately 12% of BMEC GLUT1 is on the apical (blood-facing) cell membrane, while 48% of BMEC GLUT1 is on the basolateral cell membrane, and the remaining 40% of BMEC GLUT1 resides in the cytosol (Farrell & Pardridge, 1991). BMEC have other glucose transporters such as GLUT3 and GLUT4, as well as sodium-dependent glucose transporters such as SGLT1; however, these are less important for glucose transport (Al-Ahmad, 2017). For example, haploinsufficient GLUT3 mice had normal glucose uptake (Stuart et al., 2011). Glucose movement across all of these glucose transporters occurs through facilitated diffusion due to the glucose concentration gradient across BMEC (Koepsell & De, 2020).
GLUT1 is regulated by other cell types and secondary factors. Rat BMECs increased GLUT1 expression following treatment with conditioned-media from astrocytes cultured in glucose-deprived conditions (Régina et al., 2001). Hypoxia inducible factor 1α (HIF-1α), a master transcriptional regulator of the cellular hypoxic response, may modulate GLUT1 levels. Endothelial-specific HIF-1α KO mice had reduced cerebral brain glucose uptake, as evidenced by a lower cerebral:blood glucose ratio. Additionally, HIF-1α-deficient endothelial cells showed reduced glucose uptake in vitro, which was rescued through forced GLUT1 expression (Huang et al., 2012).
Reduced BMEC glucose transport can lead to cerebral glucose hypometabolism, which is associated with neurodegeneration and has even been proposed to be a driver of neuropathology (Daulatzai, 2017; Mosconi, Pupi, & de Leon, 2008). A murine endothelial GLUT1 knockout triggered severe neuroinflammation and reduced brain-derived neurotrophic factor. This effect was exaggerated when the GLUT1 knockout was induced neonatally. Furthermore, murine GLUT1 haploinsufficiency reduced extracellular brain glucose by 90% and also reduced brain-derived neurotrophic factor (BDNF), a protein essential to neuronal survival and growth (Tang et al., 2021). Indeed, in another study an endothelial-specific GLUT1 KO in mice had reduced neuronal density and widespread brain inflammation (Veys et al., 2020). Therefore, dysregulated BMEC glucose transport can have devastating effects for the brain.
2.2.2. Lactate
While glucose is thought to be the primary fuel source in the brain, lactate may also be an essential fuel source especially when it is exchanged among cerebral cells with different glycolytic and oxidative metabolic rates (Bergersen, 2015; Brooks, 2009). At rest, BMEC transport lactate out of the brain; however, when blood lactate levels increase, BMEC transport lactate from the blood into the brain (Rasmussen et al., 2010). Lactate is transported across the brain endothelium by monocarboxylate transporter 1 (MCT1), a medium-high affinity isoform equally localized to the apical cell membrane, basolateral cell membrane, and cytosol (Bergersen, 2007; Froberg et al., 2001; Gerhart, Enerson, Zhdankina, Leino, & Drewes, 1997). Lactate transport across BMEC MCT1 depends on the lactate and pH gradients (Dienel, 2012).
Lactate may be a crucial nutrient for pericytes, which wrap around cerebral blood vessels and share basement membranes with BMEC. BMEC-specific GLUT1 deletion decreased lactate concentrations in the CSF of mice and reduced pericyte coverage around the brain vasculature due to increased apoptotic pericyte cell death. Pericytes cultured in vitro were incubated with the glycolytic inhibitor iodoacetic acid to minimize their own basal lactate production and then co-cultured with GLUT1-knockout or control BMECs. Pericytes cultured with GLUT1-KO BMECs had markedly reduced lactate, indicating that decreased BMEC lactate production also decreased pericyte lactate. Administration of exogenous lactate to BMEC-specific GLUT1 null mice rescued pericyte coverage, showing the importance of this endothelial-derived metabolite for pericyte function (Lee et al., 2022).
In contrast, lactate may be cytotoxic for neurons. Phosphatase and tensin homolog (PTEN) upregulates the lactate transporter MCT1 in BMEC. Mice with PTEN-deficient BMEC showed increased brain lactate concentration, which was caused by decreased MCT1 and significantly lower lactate efflux. Lactate accumulation impaired neurogenesis and cognitive function in mice, which was attenuated by restoring MCT1 in BMEC (Wang et al., 2019). Thus, BMEC may need to carefully regulate lactate transport to feed pericytes while maintaining neuron viability.
2.2.3. Amino acids
BMEC maintain the concentration of most amino acids tenfold lower in the brain than in the plasma with the exception of glutamine, which is present in a similar concentration in the brain and plasma. Amino acid transport across BMEC is regulated by ten amino acid transporter systems, including some that are facilitative Na+ independent transporters and some that are Na+ dependent. L amino acid transporter 1 (LAT1) transports large, neutral amino acids such as leucine and phenylalanine into the cell in exchange for intracellular glutamine. LAT1 is highly expressed in BMEC, where it is found in a 2:1 ratio in the apical and basolateral cell membranes (Asano et al., 2007; Duelli, Enerson, Gerhart, & Drewes, 2000; Sánchez del Pino, Peterson, & Hawkins, 1995; Yanagida et al., 2001). Cationic amino acid transporter 1 (CAT1) is responsible for arginine transport from the blood into the brain (Stoll, Wadhwani, & Smith, 1993).
Apical facilitative Na+ independent transporters control glutamate efflux from brain to blood, as well as glutamine and cysteine transport from blood to brain. Glutamine is the most abundant amino acid in both blood and CSF and is a precursor for both the excitatory neurotransmitter glutamate and the inhibitory neurotransmitter γ-aminobutyric acid (GABA). Since LAT1 inhibition did not inhibit glutamine transport into the brain, it is thought that there exists another glutamine facilitative transporter (system n). Glutamate is transported out of the brain by a Na+-independent transporter on the basolateral BMEC membrane and a facilitative carrier on the apical BMEC cell membrane (system ) (Hawkins & Viña, 2016; Lee, Hawkins, Viña, & Peterson, 1998). Indeed, this transporter exchanges extracellular cysteine for intracellular glutamate. In addition, five Na+-dependent amino acid transporter systems couple amino acid transport out of the brain with Na+ import into the brain. The Na+ gradient is then maintained by a Na+ pump at the endothelial basolateral membrane.
Disruption of amino acid transport across the brain endothelium has neurological consequences. A LAT1 mutation was recently identified as a rare cause of autism spectrum disorders (Tărlungeanu et al., 2016). While an endothelial-specific LAT1 knockout model has not yet been examined, systemic LAT1 deletion causes embryonic lethality in mice (Ohgaki et al., 2017). LAT1 mRNA decreased in mouse BMEC following lipopolysaccharide (LPS) administration, suggesting that inflammation may downregulate BMEC amino acid transport (Wittmann et al., 2015). By ablating LAT1 in the cerebral cortex, Knaus et al. showed that deficiency of large neutral endogenous amino acids shortly after birth changed cortical neuron lipid metabolism, excitability, and survival (Knaus et al., 2023). Together, these studies highlight a need to further investigate BMEC LAT1, especially in the context of neurodegeneration.
2.2.4. Fatty acids
Lipids constitute nearly 50% of the brain’s dry weight (Svennerholm, Boström, & Jungbjer, 1997) yet the brain has a limited capacity to synthesize fatty acids and must instead import them from circulation. Lipids enter the circulation through dietary absorption, through production in the liver, or through release from adipose tissue. Due to their hydrophobic nature, lipids must bind to soluble proteins such as albumin or be integrated into lipoprotein complexes to remain in circulation. Lipoproteins have a hydrophilic outer shell and an internal core composed of cholesterol and triglycerides, which are formed of three fatty acids and glycerol. Lipids form a major part of brain cell membranes, and two key fatty acids, arachidonic acid and docosahexaenoic acid (DHA), play extensive roles in neuroprotection, brain development, synaptogenesis, and neural differentiation (Sambra, Echeverria, Valenzuela, Chouinard-Watkins, & Valenzuela, 2021).
Free fatty acids (FFAs) can passively diffuse across the BMEC membrane even though they are at low concentration close to the endothelium (7.5 nM) (Mitchell, On, Del Bigio, Miller, & Hatch, 2011; Murphy, 2017). First, the fatty acids dissociate from their carrier proteins through hydrolysis by membrane-associated lipases. The FFAs then adsorb to the endothelium and flip from the outer plasma membrane to the cytosolic plasma membrane. However, the flippase activity that facilitates FFA movement across the membrane is thermodynamically unfavorable, and fatty acid translocase (FAT, CD36) or fatty acid transport proteins (FATP) are needed to make FFA transport into BMEC possible (Mitchell et al., 2011). Once inside the cell, FFAs are ferried through the cytoplasm by fatty acid binding proteins (FABP). For example, FABP5 binds to and carries DHA across BMEC (Pan et al., 2015). Once the FFAs reach the basolateral BMEC plasma membrane, they flip across to diffuse to other cerebral cells (Murphy, 2017). FFA transport rate depends on several factors, including the fatty acid/albumin dissociation rate as well as the fatty acid size and lipophilicity. Longer chain fatty acids are less lipophilic and therefore typically have decreased transport (Mitchell et al., 2011).
Lipids can also be moved across BMEC by clathrin dependent transcytosis and transport proteins (Dehouck et al., 1997). Low-density lipoprotein (LDL) is taken up by BMEC via clathrin dependent transcytosis after binding to the LDL receptor (LDLR) or LDLR-related protein 1 (LRP1). LDL particles are then directed to the lysosome where they are degraded and released as cholesterol and fatty acids. Interestingly, while BMEC internalize LDL, they do not transport cholesterol into the brain (Kakava et al., 2022). For transport protein-mediated movement, FFAs are incorporated into lysophosphatidylcholine (lysoPC), which is then transported across the plasma membrane by monocarboxylic acid transporters (MCTs) or FATPs. LysoPC can also be transported by Mfsd2a, specifically lysoPC that contains DHA (Lacombe, Chouinard-Watkins, & Bazinet, 2018). Mfsd2a appears to be involved in maintaining DHA levels in BMEC and in other brain cells, and therefore Mfsd2a loss inhibited NVU function and caused neuronal loss, cognitive deficits, and microcephaly (Ben-Zvi, 2014; Andreone, 2017; Nguyen, 2014; Zhou, 2019; Razmara, 2020; Wong & Silver, 2020; Alakbarzade et al., 2015).
Alterations in lipid transport across BMEC may play a role in aging and disease. Indeed, the brain loses 42% of its phospholipids and 47% of its cholesterol between the ages of 20 and 100 (Svennerholm et al., 1997). Cerebral DHA transport was studied in mice with the human apolipoprotein 4 (APOE4) allele, a main genetic risk factor for late onset Alzheimer’s disease. The DHA uptake rate was 24% lower in APOE4 mice (Vandal et al., 2014). Similarly, in the 3x-TG mouse model of Alzheimer’s disease, DHA cerebral transport was 25% lower (Calon, 2011).
3. BMEC metabolism impacts barrier integrity and cerebral function
3.1. Glucose
Both in vitro and in vivo evidence suggest that glucose transport via GLUT1 plays an important role in brain endothelial barrier function. Barrier integrity was characterized in induced pluripotent stem cell derived BMECs (iPSC-BMECs) with GLUT1 knocked out via CRISPR-Cas9 in vitro. GLUT1 KO decreased iPSC-BMEC transendothelial electrical resistance (TEER) compared to control; however, no tight junction morphology differences were observed (Pervaiz, Zahra, Mikelis, & Al-Ahmad, 2022). Likewise, glucose deprivation diminished iPSC-BMEC barrier integrity. The barrier loss was maintained even following supplementation with ketone bodies, which are used by the brain during glucose deprivation (Pervaiz, Mehta, Sherill, Patel, & Al-Ahmad, 2023). In vivo, GLUT1-KO zebra fish had decreased BMEC tight junction proteins and increased barrier permeability (Zheng et al., 2010). Global GLUT1 haploinsufficiency reduced tight junction proteins and increased endogenous plasma protein leakage in the brain of 2-week-old mice. In mice overexpressing amyloid β-peptide, a transgenic Alzheimer’s disease model, endothelial-specific GLUT1 KO initiated brain barrier breakdown (Winkler et al., 2015). However, endothelial-specific GLUT1-KO mice (1-week old) did not show differences in brain barrier integrity, specifically in terms of brain water content, Evans Blue or gadolinium permeability, or tight junction morphology (Veys et al., 2020). The differences in in vivo brain endothelial barrier integrity with GLUT1 KO may be age dependent, as a later study found no permeability changes in 5-day endothelial-GLUT1-KO mice but found increased permeability in 10-day old mice (Lee et al., 2022).
High glucose, which is studied to understand the neurological effects of diabetes, has also been shown to impair BMEC barrier function. In primary human BMECs, exposure to high glucose (25 mM D-glucose) media increased BMEC permeability to 150 kDa dextran, reduced TEER, and decreased tight junction protein expression. These changes were not observed with osmotically-controlled media. High glucose decreased AMPK activation, and increasing AMPK attenuated barrier changes in high glucose (Liu, Wu, & Zou, 2012). In mouse BMECs, high glucose upregulated HIF-1α, increased permeability, and decreased tight junction proteins. These changes were blunted with a HIF-1α inhibitor (Yan, Zhang, & Shi, 2012). Methylglyoxal, a reactive carbonyl species that is a precursor to advanced glycation end products, also led to BMEC barrier dysfunction. The reduced TEER was exacerbated by high glucose or reduction in the antioxidant glutathione but abrogated by addition of the antioxidant N-acetyl cysteine (Li, Maloney, & Aw, 2015). Thus oxidative stress, described later in this chapter, may be an important regulator of brain endothelial barrier function.
Glucose metabolism is critical for angiogenesis (De Bock, Georgiadou, & Carmeliet, 2013; De Bock, Georgiadou, Schoors, et al., 2013). Cerebral angiogenesis is particularly important during early development. Endothelial-specific GLUT-1 deletion in 1–3 day old mice decreased BMEC proliferation, the number of tip cells, and blood vessel length (Veys et al., 2020). In another study, endothelial-specific GLUT1 haploinsufficiency induced in two-day old mice led to later reduced brain CSF, sparser capillary density, and fewer tip cells compared to age-matched controls (Tang et al., 2021). Thus, alterations in glucose metabolism during development may alter the brain vasculature, and hence cerebral function.
3.2. Glutamate
Glutamate, derived primarily from the amino acid glutamine, acts as both a metabolic intermediate that feeds the TCA cycle and as a vital neurotransmitter in the brain. Glutamate concentrations usually range from 50 to 100 μM in the plasma and 0.5–2 μM in extracellular fluids (Hawkins, 2009). BMEC take up glutamate via bidirectional glutamate transporters, including SLC1A1, SLC1A2, SLC1A3, and SLC1A6. Cytosolic glutamate can then be used to synthesize glutathione and amino acids. Mitochondrial glutamate is converted to alpha-ketoglutarate and then used for ATP generation, NADPH generation, and fatty acid synthesis. BMEC are estimated to have 2–4x the mitochondrial volume of other endothelial cell types (Oldendorf, Cornford, & Brown, 1977), which may enable them to have higher glutamate metabolic rates.
BMEC can also bind glutamate to ionotropic receptors such as N-methyl-D-aspartate (NMDA) receptors that regulate ion flux and membrane potentials (Kim, Jeon, Kim, Lee, & Kim, 2022; Sharp et al., 2003) and metabotropic glutamate receptors (e.g., mGluR5) that initiate intracellular signaling cascades through second messengers (Beard, Reynolds, & Bearden, 2012). Glutamate binding to NMDA receptors induced calcium influx into immortalized human BMEC (Negri et al., 2021). As cytosolic calcium rose, calcium entry into mitochondria also increased thereby elevating mitochondrial membrane potential. This increased mitochondrial potential drove increased flux through oxidative phosphorylation that produced increased ROS that eventually led to cell death (Widlansky & Gutterman, 2011). Though there are few studies to validate this mechanism in human primary BMEC, glutamate concentrations as low as 250 μM decreased transgenic rat BMEC viability, likely as a result of excitotoxicity and downstream oxidative stress (Lee & Kang, 2018). In mouse hippocampal neurons, cellular oxygen consumption, a measure of mitochondrial metabolism, increased following 24-hours of treatment with 4 mM glutamate (Kumari, Mehta, & Li, 2012). In these same cells, tetramethylrhodamine (TMRM) staining indicated that 4 mM extracellular glutamate hyperpolarized the mitochondrial membrane which in turn elevated ROS production (Kumari et al., 2012).
In mouse BMEC, glutamate-induced increases in intracellular calcium also increased nitric oxide production (Zuccolo et al., 2019). However, this is likely because glutamate treatment reduced endothelial nitric oxide synthase (eNOS) RNA and increased inducible nitric oxide synthase (iNOS) RNA (Lee & Kang, 2018). While eNOS is generally considered vasoprotective and produces nitric oxide to initiate vasodilation, iNOS produces large bursts of nitric oxide in oxidative environments. Through this mechanism, iNOS leads to ROS production and downstream inflammation and apoptosis.
High glutamate concentrations can damage brain endothelial barrier function. 30 min of exposure to 1 mM extracellular glutamate, which is much higher than the physiological concentration, increased in vivo rat brain endothelial permeability by almost 20% (Vazana et al., 2016). In immortalized cerebral endothelial cells, 1 mM glutamate and 1 mM NMDA both significantly decreased barrier function, as shown by lower TEER. The barrier loss was inhibited by MK-801, an NMDA receptor antagonist (Sharp et al., 2003). These studies indicate that glutamate decreases BMEC barrier function through an NMDA receptor-mediated mechanism.
3.3. Fatty acids
Disturbances in fatty acid metabolism have been linked to neurodegenerative diseases (Estes, Lin, Khera, & Davis, 2021; Vesga-Jiménez et al., 2022). Fatty acids are taken up by BMEC and can then be fated for metabolism or stored as cytosolic lipid droplets (Mallick & Duttaroy, 2022). The specific fatty acid metabolism pathway depends on the fatty acid length. Very long chain fatty acids (VLCFA, carbons > = 22) are metabolized via β-oxidation in the peroxisome, while shorter chain fatty acids are first converted into acyl-CoA in the cytosol and then transported into the mitochondria for β-oxidation (Wanders, 2014).
While fatty acid metabolism is thought to provide only a small portion of endothelial ATP production, fatty acids support other critical endothelial cell functions such as nucleotide synthesis, post-translational protein modifications, signal transduction pathway activation, and gene regulation (Liu & Dai, 2022). Quiescent peripheral endothelial cells, including cells exposed to physiological shear stress, had higher expression of carnitine-palmitoyl transferase (CPT1A), which controls mitochondrial fatty acid import and is the rate limiting step of fatty acid oxidation. Quiescent endothelial cells also had higher fatty acid oxidation than proliferating endothelial cells. Fatty acid oxidation was dispensable for energy production and biomass synthesis but was critical for redox homeostasis. CPT1A inhibition or knockout dramatically increased endothelial ROS, which then led to endothelial dysfunction and increased leukocyte adhesion and permeability through VE-cadherin disruption (Kalucka et al., 2018; Patella et al., 2015). Cellular supplementation with acetate, which is metabolized into the fatty acid downstream product acetyl-CoA, decreased ROS in CPT1A-knockdown peripheral endothelial cells and reduced leukocyte infiltration into the lungs (Kalucka et al., 2018).
While few studies address fatty acid oxidation in BMECs specifically, current evidence suggests an important role for fatty acid oxidation in maintaining barrier function. Fatty acid metabolism byproducts and intermediates can directly mediate the BMEC barrier. Palmitoylation, the covalent attachment of fatty acids to protein cysteine residues, is particularly important for claudin-5, a key tight junction protein. Palmitoylated claudin-5 translocated to cholesterol-rich lipid rafts, where it dimerized and restricted paracellular permeability to enhance brain endothelial barrier function (Rajagopal, Irudayanathan, & Nangia, 2019a, 2019b). Although fatty acid oxidation may be essential for barrier maintenance, high serum lipids can damage the NVU. BMECs exposed to elevated postprandial triglyceride-rich lipoproteins, a risk factor for vascular dementia, had elevated ROS and increased expression of the stress-responsive protein ATF3 (Aung et al., 2016). A follow up study showed that triglyceride-rich lipoprotein treatment increased mitochondrial oxidative stress and protein leakage, but this effect could be reduced by CPT1A1 siRNA knockdown (Nyunt et al., 2019).
3.4. Oxidative stress
ROS, including superoxide and hydrogen peroxide, are natural byproducts of aerobic metabolism and are produced at low levels when cells are in homeostatic conditions. The major superoxide production pathways include the mitochondrial electron transport chain through complexes I and III, decoupled eNOS, uric acid production, and as a byproduct of NADPH conversion to NADP+ by NADPH oxidase (NOX). The enzyme superoxide dismutase can then convert superoxide to hydrogen peroxide.
Glutathione, one of the primary antioxidants in cells, scavenges ROS to reduce oxidative stress. Cytosolic glutamate and cysteine converge to form y-glutamyl-cysteine that combines with glycine to form glutathione. In the process of scavenging ROS, glutathione is oxidized to glutathione disulfide. Glutathione disulfide can then be recycled back to glutathione by glutathione reductase and NADPH (Fig. 3) (Mailloux, McBride, & Harper, 2013).
Fig. 3.
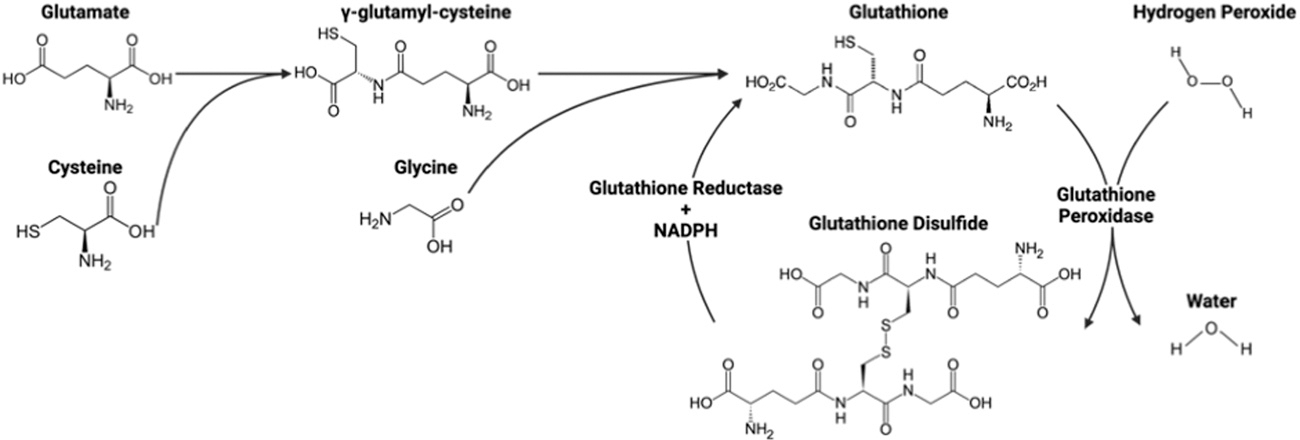
Glutathione formation and ROS scavenging. Amino acids glutamate, cysteine, and glycine form glutathione. Two glutathione molecules then remove an oxygen from hydrogen peroxide to form water and glutathione disulfide, which can be converted back to glutathione by glutathione reductase and NADPH. Figure created with BioRender.
Elevated ROS can induce endothelial inflammation and apoptosis as well as increase vascular permeability and vasoconstriction. DMNQ, a cell-permeable redox cycling agent known to induce superoxide and hydrogen peroxide formation, acutely reduced murine BMEC barrier function, as measured through TEER (Krizbai et al., 2005). Similarly, in iPSC-BMECs, even an acute exposure to hydrogen peroxide (1–10 mM) decreased TEER for up to 10 days (Chung et al., 2022). In the same iPSC-BMECs, chronic exposure to 1- or 10-mM hydrogen peroxide enriched genes associated with immune cell trafficking (Chung et al., 2022). In tissue engineered brain vessels, both chronic and acute hydrogen peroxide exposure induced delamination (detaching of BMEC from the hydrogel scaffold) and focal leaks (holes in the endothelium) (Chung et al., 2022).
ROS are also implicated in NVU damage in disease and injury. During reoxygenation after hypoxia, BMEC demonstrated increased heat shock protein-70 (HSP-70, which is associated with oxidative stress), increased permeability of the brain endothelium, and tight junction protein redistribution (Lochhead et al., 2010). Following traumatic brain injury (TBI) due to a blast, rat cerebral blood vessels showed reduced tight junction proteins and increased brain barrier permeability. This was attenuated using apocynin, a selective NOX1 inactivator (Kuriakose et al., 2019), indicating that ROS play a role in BMES dysfunction following TBI.
4. In vitro, in vivo, and computational BMEC metabolic measurements and models
4.1. In vitro models
BMEC can be studied in vitro using 2D and 3D models of the brain vasculature, including tissue culture, flow chambers, Transwell inserts, hydrogels, microfluidics, and organoids (Fig. 4). Metabolism can then be measured using medium metabolite recordings using a YSI instrument (Weber et al., 2022) or a colorimetric metabolite detection system (Leippe, Sobol, Vidugiris, Cali, & Vidugiriene, 2017), real-time Seahorse assays (Raut, Patel, Pervaiz, & Al-Ahmad, 2022; Sakamuri et al., 2022; Sheikh et al., 2020; Sure et al., 2018; Weber et al., 2022), Oroboros Oxygraph-2 k (O2k) high resolution respirometry (Dobi et al., 2021; Tyrrell, Blin, Song, Wood, & Goldstein, 2020), metabolomics (Cohen, Gecki, & Toker, 2020; Weber et al., 2022) and transcriptomics (Weber et al., 2022)(Fig. 5).
Fig. 4.

2D and 3D BMEC models for metabolic analysis. 2D models include BMEC grown in static conditions on tissue culture polystyrene and in flow chambers such as parallel plate or cone and plate systems. 3D models include BMEC seeded on Transwell inserts for metabolite transport analysis as well as BMEC lining channels in microfluidic devices and hydrogels, and vascularized organoids. Figure created with BioRender.
Fig. 5.

BMEC metabolic analysis methods. Black-box techniques including YSI, Seahorse, and Oroboros O2k analyses measure metabolite inputs and outputs in cell culture but do not give insight into intracellular metabolic processes. Clear-box techniques, such as transcriptomics and metabolomics, give insight into the metabolic reactions within the cells. Computational techniques, such as flux balance analysis and metabolic flux analysis, can be used to estimate metabolite fluxes through specific metabolic pathways. Figure created with BioRender.
In the YSI assay, media samples are collected at multiple time points from a cell culture system into a 96-well plate. The YSI uses analyte-specific immobilized enzyme electrodes to quantify extracellular metabolites such as glucose, lactate, glutamine, and glutamate in liquid samples. We previously used a YSI to show that primary and iPSC-BMEC had different levels of glucose uptake and lactate production over 24-hours (Weber et al., 2022). We also used a YSI to demonstrate polarization of glucose and glutamine to the apical compartment and lactate and glutamate to the basolateral compartment in primary BMEC cultured on Transwells (Fig. 6). To our knowledge, YSI has not been used to quantify intracellular metabolite concentrations, but colorimetric assays such as Promega’s Glucose-Glo™ Assay can be used to quantify both intra- and extracellular glucose, lactate, glutamine, and glutamate concentrations (Leippe et al., 2017). While the YSI can be used to analyze extracellular metabolite changes over long time periods (on the scale of hours to days), it’s limited resolution prevents it from being useful in measuring acute metabolic changes.
Fig. 6.

BMEC polarized metabolites over a 24-hour culture period. (A) Primary BMEC cultured in media supplemented with 5.5 mM glucose and 4.5 mM glutamine polarized lactate and glutamate to the apical chamber (B, D) and glucose and glutamate to the basolateral chamber (C, E). n = 3 biological replicates. (A) Created with BioRender.
While the YSI can effectively measure extracellular metabolite changes over long time periods (hours to days), acute and dynamic changes in glycolysis and mitochondrial metabolism are more accurately detected via real-time assays such as the Agilent Seahorse Glycolytic Rate Assay, Mitochondrial Stress Test, and ATP Rate Assay, or the Oroboros O2k system. Seahorse assays detect changes in media acidification and oxygen consumption rate to calculate relative rates of glycolysis and mitochondrial metabolism, as well as estimate ATP production from each metabolic process. In BMEC, the ATP rate assay was used to demonstrate that higher passage primary BMEC (p15) had a higher mitochondrial:glycolytic ATP ratio than lower passage primary BMEC (p7). These studies may indicate that cellular senescence decreases BMEC glycolysis (Sakamuri et al., 2022), though these metabolic changes could also be due to extended culture periods. Glycolytic and Mitochondrial Stress Tests on iPSC-BMEC treated with Amyloid β (Aβ)-42 showed that Aβ42 impaired BMEC bioenergetics by decreasing glycolytic capacity and reserve while simultaneously increasing non-mitochondrial oxygen consumption and mitochondrial spare respiratory capacity (Raut et al., 2022). Similarly, the Glycolytic Stress Test was used to show that sera from relapsing-remitting multiple sclerosis patients decreased basal glycolysis, glycolytic capacity, and glycolytic reserve in hCMEC/D3 immortalized BMEC (Sheikh et al., 2020).
Some researchers have also begun using Seahorse Analyzers for real-time metabolic measurements of tissues, including brain microvessels. Brain microvessels isolated from older (18 months) mice had decreased mitochondrial basal and maximal respiration, spare respiratory capacity, proton leak, and non-mitochondrial respiration relative to microvessels isolated from younger (3 months) mice, as measured via Mitochondrial Stress Test (Sure et al., 2018). The advantages of Seahorse assays are that they are high-throughput and relatively simple to use. However, Seahorse assays are limited in that only 4 compounds can be added to the cells per trial, limiting the number of questions that can be answered by each assay (Walsh, Musci, Jacobs, & Hamilton, 2023). Seahorse assays are also sensitive to cell number, which should be determined after each assay is completed.
The Oroboros O2k high resolution respirometry system can measure oxygen consumption similar to the Seahorse mitochondrial stress test, but can also be used in tandem with fluorometric assays to simultaneously measure ROS and ATP production, mitochondrial membrane potential, and calcium concentration (Walsh et al., 2023). The O2k also has flexibility in experimental design, enabling the use of substrate and inhibitor titrations that facilitate the examination of specific aspects of respiration. In isolated mouse BMEC, the O2k system was used alongside the Seahorse Mitochondrial Stress Test to demonstrate that advanced glycation end products formed as a result of hyperglycemia in Type 2 Diabetes Mellitus (T2DM) decreased spontaneous and maximal mitochondrial respiration (Dobi et al., 2021). The O2k system was also used to examine how aging impacts mitochondrial respiration in isolated mouse cerebral vessels. Tyrrell et al. isolated cerebral vessels from young (2–3 month) and old (18–19 month) mice and showed that the vessels from young mice had elevated oxygen consumption rates relative to the vessels from old mice (Tyrrell et al., 2020). The O2k system does have limitations, including that it is relatively complex, low throughput, and requires time intensive calibrations and cleanings (Walsh et al., 2023). Currently, few studies used the O2k system in BMEC although it is a powerful tool for in vitro and ex vivo mitochondrial metabolic measurements.
Recent advances in -omics approaches allow a more in-depth examination of BMEC metabolism. Metabolomics, whether via targeted or untargeted mass spectrometry, can be used to obtain a detailed view of how intracellular metabolites change in response to specific stimuli. For example, metabolomics was used to demonstrate that following hypoxia, microvascular endothelial cells decreased cysteine-derived metabolite and nucleotide abundances (Cohen et al., 2020). To further increase the power of metabolomics approaches, heavy isotope labeling can be used to track movement of common elements (carbon, nitrogen, hydrogen, oxygen, etc.) through metabolic pathways. By investigating labeling patterns of specific metabolites, researchers can quantify metabolite flux through metabolic pathways. Similarly, transcriptomics can be used to analyze metabolic enzyme gene expression. For example, when we compared glucose metabolism between primary BMEC and iPSC-BMEC, RNA-sequencing was used to demonstrate that iPSC-BMEC had elevated hexokinase 2, a rate-limiting glycolytic enzyme, compared to primary BMEC (Weber et al., 2022).
These in vitro metabolic measurement techniques can be expanded to include cells exposed to shear stress or in 3D culture. Using a metabolomics approach, we previously showed that physiological laminar shear stress decreased endothelial cell glucose metabolism and glucose flux through the hexosamine biosynthetic pathway (Basehore et al., 2021). Transcriptomic analysis of BMEC following laminar shear stress also showed decreased expression of lactate dehydrogenase and higher expression of pyruvate dehydrogenase (Cucullo, Hossain, Puvenna, Marchi, & Janigro, 2011), which indicates increased TCA cycle activity following shear stress. While hydrogel, microfluidic, and organoid models are used rarely for metabolic analysis because cellular extraction is complicated by the 3D structure, Brown et al. treated a microfluidic NVU with inflammatory stimuli and then used metabolic mass spectrometry to study pyrimidine and amino acid metabolic pathways (amongst others) (Brown et al., 2016). To our knowledge, vascularized organoids were only used in one study to evaluate metabolism. An electrochemical sensor was integrated into the organoid to detect changes in oxygen consumption rate as a measure of mitochondrial metabolism (Nashimoto et al., 2023). Future metabolomics studies in 3D systems will be essential to understanding how NVU metabolic demands vary in health and disease in a more biomimetic environment.
4.2. In vivo models
In vivo approaches have the potential to improve our understanding of BMEC nutrient transport and metabolism in a physiologically relevant environment. However, a challenge to understanding BMEC metabolism in vivo is to delineate the specific role of BMEC. Historically, in vivo approaches used techniques such as positron emission tomography (PET) or fluorescently labeled glucose to understand whole brain glucose metabolism. However, these techniques do not have the specificity or resolution to delineate BMEC metabolism from the metabolism of other brain cells. We therefore need to develop more sophisticated tools to understand metabolic changes in BMEC specifically.
Cell-specific gene knockouts have potential to advance our understanding of how specific metabolic transporters and enzymes impact BMEC nutrient transport and metabolism in vivo. Cre/lox animal models allowed researchers to create the BMEC-specific GLUT-1 and PTEN knockout mice that were previously described (Tang et al., 2021; Winkler et al., 2015). While these animals provided useful information, creating Cre/lox mouse models can be both time-consuming and labor intensive as they often require cross breeding across generations to obtain cell-specific knockouts. Adeno-associated viral vectors (AAV) offer a powerful alternative approach to knock out specific BMEC metabolic transporters and enzymes. Currently, three AAV vectors can transduce BMEC: AAV-PHP.V1 (Ravindra Kumar et al., 2020), AAV-BR1 (Körbelin et al., 2016), and AAV-BI30 (Krolak et al., 2022). AAV-PHP.V1 transduces BMEC but can also transduce astrocytes (Ravindra Kumar et al., 2020). AAV-BR1 targets brain capillary endothelial cells but not arterial or venous endothelial cells (Körbelin et al., 2016). Finally, AAV-BI30 targets all brain endothelial cells regardless of vessel (Krolak et al., 2022). Recently, another vector, AAV-X1, was developed which efficiently transduces brain endothelial cells in mice from various genetic backgrounds, as well as non-human primates and ex vivo human brain slices (Chen et al., 2023). AAV may offer a simpler way to test BMEC metabolism in vivo through gene knockout. In addition, AAV can be used to knock in genes for disease or mutant models, in particular to determine whether restoration of BMEC gene expression restores barrier function.
Fluorescent metabolic markers can also be used to indicate cell-specific changes in metabolite transport and concentration. For example, bacterial periplasmic binding proteins (PBP), which bind specific metabolites such as glutamate, GABA, acetylcholine, and glucose with high affinity, can be modified by inserting fluorescent tags such as green fluorescent protein (GFP). These sensors have shown promise in their potential to monitor a variety of metabolites both in vitro and in vivo (Fehr, Frommer, & Lalonde, 2002). In a recent example, Drosophila transgenic lines with pan-neuronal expression of GFP-Glucose binding protein (GBP) showed glucose transport across a rostral-caudal path in the brain. The same approach was used to visualize glucose levels in skeletal muscle and brain tissue in zebrafish (Keller et al., 2021). Brain endothelial-specific expression of metabolite-binding proteins may prove useful in monitoring BMEC specific metabolism in vivo.
Intracranial imaging and two-photon microscopy combined with superfusion enable us to dynamically study NVC in live animals. In this method, a cranial window is opened in an anesthetized animal, which allows two-photon microscopy imaging of the brain and its vessels. Pharmacological or metabolic substrates and inhibitors can be superinfused onto the cranial surface or directly sprayed onto a brain capillary. Using this approach, Harihan et al. investigated the role of the pericyte KATP channels in regulating endothelial KIR2.1 channel activity (Hariharan, Robertson, Garcia, & Longden, 2022). When the GLUT1-specific inhibitor BAY-876 was applied to capillaries, pericyte hyperpolarization occurred. This then triggered endothelial cell firing and signal propagation, resulting in increased regional blood flow. When mice were treated with the KATP blocker glibenclamide or had genetic inactivation of the pericyte KATP channel, the vasodilatory response and cerebral blood flow changes with glucose deprivation were abrogated (Hariharan et al., 2022). This study highlights how intracranial imaging can be used to understand the endothelial impact on brain metabolism in a complex physiologically-relevant environment.
4.3. Computational metabolic modeling
Computational metabolic models can be divided into two core categories: stoichiometric models that represent metabolism at steady-state, and kinetic models that account for time-dependent changes in cell metabolism. In both cases, the computational models are generated by integrating information from experiments and the existing literature to reconstruct a set of reactions and metabolites (e.g., a metabolic network) present in the tissue of interest. A key advantage of these network models is that they integrate multiple reactions into an interconnected network and can account for complex metabolic interactions. Once constructed, these models can be used to interpret experimental data that is difficult to understand otherwise, generate new hypotheses by testing specific conditions in silico, and model phenomena that cannot be experimentally determined. In this section, we explore how these metabolic models can be used to investigate BMEC metabolism.
4.3.1. Steady-state/stoichiometric models
MFA derives intracellular flux rates from experimental data. The simplest approach is a purely stoichiometric MFA (sMFA) model, which uses a simplified algebraic model to derive intracellular fluxes based on measured extracellular flux values. Internal fluxes must be quantified from extracellular flux data (e.g., glucose uptake or oxygen consumption) alone. This approach allows for flux estimation in simple networks; however, it cannot accurately decipher intracellular fluxes, many of which are reversible, exchange, and cyclic fluxes.
In isotope-assisted metabolic flux analysis (iMFA), cells are incubated with heavy carbon isotope labeled nutrients (e.g., 13C-glucose). The labeled carbons are incorporated into downstream products, creating isotope-labeled forms of each downstream metabolite, which are known as isotopologues. For each metabolite, the relative abundance of every isotopologue is quantified with mass spectrometry or nuclear magnetic resonance. The iMFA model then integrates these data along with extracellular metabolic fluxes into a stoichiometric mathematical model to predict metabolic reaction flux values and confidence intervals for each flux in a given metabolic network (Moiz et al., 2021).
iMFA uses the mathematical relationship between flux and isotopologue labeling patterns to estimate fluxes. It starts with an initial guess for all metabolic fluxes in the network and simulates the relative abundance of each isotopologue in the metabolic model. Simulated isotopologue labeling patterns are then compared with the experimentally derived values, and the residual error is calculated. The metabolic fluxes are then refined to minimize the error between the experimental and simulated data (Rahim et al., 2022). When the error reaches a statistically acceptable value, the best-fit metabolic fluxes are returned.
iMFA can be divided into three subtypes. Steady-state iMFA is the most computationally simple version and requires that the system is at metabolic steady-state (no net metabolite accumulation or consumption) as well as isotopic steady state (isotopologue patterns do not change). Instationary isotopic MFA (INST-MFA) is used to predict fluxes in systems that are at metabolic steady-state but not isotopic steady state. This allows modeling of biological systems with large metabolic pools that do not achieve isotopic steady state within reasonable experimental time constraints. Finally, dynamic MFA is a relatively new and computationally intensive method that predicts fluxes in systems that fail to achieve either metabolic or isotopic steady state.
A key advantage of iMFA is that it allows quantification of otherwise non-observable intracellular fluxes. Metabolic systems have reversible, cyclic, and exchange fluxes, which greatly complicate labeling patterns. Furthermore, while increased metabolite labeling may indicate increased metabolic pathway absolute flux or activity, this may not be the case in mammalian cells that have numerous carbon inputs. For example, the TCA cycle takes in carbons from glucose, fatty acids, and amino acids. In a glucose labeling experiment, the relative percentage of glucose-labeled TCA intermediates can decrease due to lower pyruvate transport, higher unlabeled amino acid influx, or both (Moiz, Li, Padmanabhan, Sriram, & Clyne, 2022; Moiz, Sriram, & Clyne, 2023). In addition, iMFA can incorporate large datasets and highlight poorly fitting data, which typically occurs either due to measurement errors or erroneous assumptions about the metabolic system.
Currently, there are no published studies of BMEC iMFA models. However, a recent study examined the impact of glycolytic inhibitors on human umbilical vein endothelial cell (HUVEC) metabolism. HUVECs treated with glycolytic side branch inhibitors showed decreased glucose labeling in TCA cycle metabolites. The iMFA model revealed that there was actually increased unlabeled amino acid influx and increased overall TCA cycle activity (Moiz et al., 2021). Thus, the iMFA analysis elucidated complex metabolic changes in endothelial cells.
MFA is limited to only the subset of metabolic reactions with metabolites that can be measured experimentally; however, genome-scale metabolic models account for all biochemical reactions, metabolites, and genes involved in metabolism. Human metabolic models have been curated and are publicly available (Brunk et al., 2018). The models can be contextualized using -omics data to only include reactions and genes that are expressed in endothelial cells and further constrained with parameters such as measured extracellular fluxes and media components. Following curation and contextualization, the models can be validated to ensure they perform essential tasks, such as generating the correct amount of ATP from glucose in both aerobic and anaerobic conditions. Endothelial models can also be tested for endothelial-specific functions, such as nitric oxide production.
Following validation, the genome-scale metabolic models can be used to estimate metabolic fluxes. Flux balance analysis (FBA) is the most commonly used approach. This method assumes an “objective function,” defined as a reaction that the cell seeks to optimize such as biomass growth or ATP yield. FBA then returns the set of fluxes that best optimize the chosen objective function. This approach is commonly used for prokaryotic organisms or cancer cells, in which growth rate may be a reasonable objective function. However, the objective function of most mammalian cells is difficult to define, and this approach is therefore prone to bias. For this reason, it may be preferable to use flux sampling, an approach which instead generates a distribution of possible flux solutions. Various flux sampling methods exist, but all generate pseudo random samples from within the potential flux boundaries. The solution spaces between different experimental conditions can then be compared.
Currently, there are no genome scale metabolic models focused on BMEC. However, there are several genome scale metabolic models of other cerebral cells such as astrocytes and neurons. These models were used to identify metabolic changes in potential pathogenic states, specifically the metabolic changes incurred by palmitate-induced astrocytic inflammation (Osorio, Pinzón, Martín-Jiménez, Barreto, & González, 2020). In addition, Thiele et al. constructed a whole-body metabolic model to study exchange reactions between the blood and different organs. This approach could potentially be adapted to specifically study metabolite exchange and consumption in an NVU (Thiele et al., 2020).
4.3.2. Kinetic and transport models
Kinetic models use parameters such as enzyme turnover, saturation, rate laws, and allosteric regulation to understand changes in metabolic concentrations and reaction fluxes over time (Islam, Schroeder, & Saha, 2021). Kinetic models offer the advantage of capturing non-steady state metabolism. While kinetic models have been used to characterize intracellular metabolism in other cell types such as red blood cells (Afshar, Safaei, Nickerson, Hunter, & Suresh, 2019), there are no current examples of kinetic metabolic metabolism in BMEC. Instead, most of the kinetic modeling research in BMECs has focused on metabolite transport.
Kinetic models enabled researchers to interrogate complex transport kinetics. For example, in vivo and in vitro transport assays cannot sufficiently characterize bidirectional BMEC amino acid transport, specifically accounting for competitive ligand binding and cellular polarity. To address these limitations, Taslimifar et al. developed a computational model of large neutral amino acid transporters (LNAAs) to evaluate LAT1-mediated transport across BMEC (Taslimifar, Buoso, Verrey, & Kurtcuoglu, 2018). They modeled the neurovascular unit with four compartments: BMECs, neurons, astrocytes, and cerebrospinal fluid. Amino acids were modeled to move from the plasma into BMECs and then into the cerebral spinal fluid. From there, the amino acids could enter either neurons or astrocytes. The authors also accounted for LAT1 sodium dependency, apical-basolateral polarization, and competition between different LNAAs for leucine, valine, isoleucine, tryptophan, histidine, and methionine. Initially, a symmetrical apical/basolateral transport rate was assumed, and model results were compared to previously published in vivo experimental results on L-tyrosine and L-phenylalanine transport in rat brain. However, the computational model showed transport rates that were too high. The authors then tested whether asymmetrical kinetics between the apical and basolateral membranes would explain the transport observed in vivo. The authors tested this by either increasing the asymmetrical bidirectional kinetic constant or changing the LAT1 ratio between apical and basolateral sides. The results showed that increasing asymmetry of both kinetics and apical/basolateral expression enabled the computational model to better fit the experimental results. This model was used in a follow up study to determine the relative contributions of different amino acid transporters to L-leucine transport. The model determined that immortalized BMECs depended on 4 out of 8 possible amino acid transporters for leucine transport (Taslimifar et al., 2018; Taslimifar, Faltys, Kurtcuoglu, Verrey, & Makrides, 2022). The kinetic approach enabled the identification of critical transporters for brain nutrient influx that could not be delineated experimentally.
Kinetic approaches can also be used to investigate glucose transport in cells, which would be very relevant for BMEC. Afshar et al. created a glucose transport model to interrogate the relative contributions of SLGT1 and GLUT2 for glucose uptake in enterocytes (Afshar et al., 2019). Their model showed that SLGT1 is prominent at low glucose concentrations and short glucose exposure times, while the reverse is true for GLUT2. The model structure was designed for easy adaptability, which makes it potentially applicable to BMEC glucose transport (Afshar et al., 2019).
5. BMEC metabolic dysfunction in aging and disease
5.1. Aging
BMEC metabolism may be altered through the natural aging process in absence of disease. In fact, deregulated nutrient sensing and mitochondrial dysfunction are two hallmarks of the aging process (López-Otín, Blasco, Partridge, Serrano, & Kroemer, 2013). Camici et al. outlined several mechanisms hypothesized to contribute to aging in the vasculature, including ROS accumulation and subsequent oxidative damage; decreased sirtuin proteins that contribute to reduced nitric oxide production, insulin sensitivity, and mitochondrial metabolism; and increased mitochondrial adaptor protein p66Shc that similarly increases ROS production and reduces nitric oxide bioavailability (Camici, Savarese, Akhmedov, & Lüscher, 2015).
Studies of metabolic aging in the brain endothelium are currently limited to in vitro and animal models, which means that these data must be extrapolated to the human brain. In vitro, cell passage number is often used to mimic cellular aging by replicating the telomere shortening that occurs in human aging. However, extended cell culture is not an ideal model of aging since it also reduces tight junction protein and transporter expression, which could impact cellular metabolism (Goldeman, Ozgür, & Brodin, 2020). Sakamuri et al. used a Seahorse Glycolytic Rate Assay to show that glycolytic rate decreased with cellular age and an ATP Rate Assay to show that oxidative consumption rate (OCR) increased with cellular age (Sakamuri et al., 2022). They then used a Seahorse Mito Fuel Flex test to show that elevated fatty acid oxidation increased OCR in aged cells, despite similar glucose metabolism and decreased glutamine metabolism in the TCA cycle with age (Sakamuri et al., 2022). In vivo, single cell RNA sequencing of brain endothelial cells from young (2–3 months) compared to old (18–20 months) mice showed that aging downregulated genes associated with glucose/energy metabolism and the mitochondrial electron transport chain (Zhao et al., 2020).
5.2. Alzheimer’s disease
Alzheimer’s disease (AD) is a neurodegenerative disease characterized by the accumulation of Aβ plaques, neurofibrillary tau tangles (NFTs), loss of endothelial barrier function, and cerebral glucose hypometabolism (de Leon et al., 1983; Mosconi, De Santi, Rusinek, Convit, & de Leon, 2004; Sheehan et al., 1997; Small et al., 2000). Due to these pathologies, AD patients experience memory loss, mood dysregulation, speech deficits, and issues with balance and coordination. Whether metabolic dysfunction and brain barrier breakdown are a cause or effect of Aβ plaques and NFTs remains unknown; understanding the relationship between BMEC dysfunction and AD pathology is essential to understanding and developing new therapeutics for AD.
Aβ42 forms the major component of AD-associated Aβ plaques. iPSC-BMEC treated with 100 nM Aβ42 for 48 h had decreased glucose uptake, GLUT1 and GLUT3, glycolytic capacity, and glycolytic reserve. Aβ42 treatment also increased non-mitochondrial respiration and spare respiratory capacity, as measured by Seahorse Mito Stress Test. 2′,7′-dichlorofluorescein diacetate (DCFDA) labeling showed elevated ROS following Aβ42 treatment (Raut et al., 2022). In a different approach, the genes encoding for presenilin 1 and 2 (PSEN1, PSEN2), were mutated in iPSC-BMEC to induce alternative splicing of amyloid precursor protein and thereby increase Aβ42 production. These mutations decreased iPSC-BMEC tight junction proteins, glucose uptake, and glycolytic reserve while increasing ROS production (Raut, Patel, & Al-Ahmad, 2021). Another genetic risk factor for AD, the apolipoprotein E (APOE) 4 isoform, is associated with reduced glucose uptake and lactate production in transgenic mouse BMEC compared to the APOE3 isoform, which harbors a neutral risk for AD (Marottoli et al., 2021). APOE4 BMEC had elevated superoxide and hydroxyl radical accompanied by a lower GSH:GSSG ratio, indicative of increased ROS. Reduced glycolysis and increased ROS in APOE4 BMEC correlated with reduced barrier function (Marottoli et al., 2021). Finally, metabolic abnormalities such as hyperglycemia and low circulating high density lipoproteins may also be correlated with increased AD risk (Ezkurdia, Ramírez, & Solas, 2023; Ferreiro et al., 2020; Marsillach et al., 2020). Treatment of mouse brain endothelial cells with the saturated fatty acid palmitate decreased the tight junction protein claudin-5 (Tyagi, Mirita, Shah, Reddy, & Pugazhenthi, 2021). Similarly, feeding mice a high-fat, high-protein, high-carbohydrate western diet reduced claudin-5 in cortical brain samples, and this reduction was exacerbated in a mouse model of AD (Tyagi et al., 2021). Altogether, these data indicate that AD risk factors such as Aβ42, APOE4, and metabolic syndrome contribute to BMEC metabolic dysfunction and oxidative stress.
5.3. Multiple sclerosis
Multiple sclerosis (MS) is a chronic neurodegenerative disease primarily caused by immune cell infiltration into the brain, which leads to axon demyelination. Patients with MS experience vision loss, dizziness, muscle weakness, fatigue, and cognitive dysfunction. Brain endothelial barrier breakdown is associated with MS. The barrier may transiently break down, allowing increased leukocyte extravasation into the brain before tight junctions form again (Harris, Frank, Patronas, McFarlin, & McFarland, 1991). Thus, it is important to understand how BMEC barrier function changes in MS.
Relatively little is known about BMEC metabolism in multiple sclerosis development and progression. One study used a Seahorse Glycolytic Stress Test to investigate the impact of serum from patients with relapsing-remitting multiple sclerosis (RRMS) on immortalized hCMEC/D3 BMEC (Sheikh et al., 2020). BMEC treated with RRMS patient serum had reduced basal glycolysis, glycolytic capacity, and glycolytic reserve, which was accompanied by reduced GLUT1 compared to cells treated with serum from healthy donors. Serum from RRMS patients had no effect on BMEC basal OCR, mitochondrial ATP production, or proton leak in a Seahorse Mito Stress Test, but the cells treated with serum from RRMS patients showed reduced maximal mitochondrial respiration and spare capacity relative to cells treated with healthy control serum. ROS were also increased in the BMEC treated with RRMS serum compared to cells treated with healthy control serum. These metabolic changes were accompanied by a reduction in TEER, occludin, and VE-cadherin, as well as an increase in inflammatory proteins VCAM1 and ICAM1 (Sheikh et al., 2020). These data suggest that BMEC in MS patients may have reduced glycolysis and increased ROS, which could then disrupt the BMEC barrier and increase vascular inflammation.
5.4. Parkinson’s disease
Parkinson’s disease (PD) is a neurodegenerative disorder that causes motor symptoms including tremor, rigidity, and loss of balance. PD can also cause non-motor symptoms including issues with cognition, sleep, and abnormal behaviors. The primary driver of motor symptoms of PD is the loss of dopaminergic neurons in the substantia nigra (SN) in the midbrain. Metabolic dysfunction is likely a driver of PD onset and/or progression. Mann et al. demonstrated a 37% reduction in complex I activity in the electron transport chain in the SN of patients with PD compared to healthy patients; however, complex I activity was maintained in all other brain regions (Mann et al., 1992). Additionally, Sian et al. showed a 40% reduction in glutathione in the SN of patients with PD compared to control subjects (Sian et al., 1994), suggesting that oxidative stress is elevated and may contribute to the disease pathology.
Despite the association between PD and SN metabolic dysfunction, the role of cerebrovascular metabolic and barrier dysfunction in PD is not well defined. The number of brain endothelial cells is elevated by 20–250% in individuals with PD, depending on the brain region (Barcia et al., 2005; Carvey et al., 2005; Elabi, Cunha, Gaceb, Fex, & Paul, 2021; Faucheux, Agid, Hirsch, & Bonnet, 1999; Westin et al., 2006). Proliferating endothelial cells in other vascular beds have elevated glycolytic and TCA cycle enzyme expression and reduced fatty acid oxidation and pentose phosphate pathway activity relative to quiescent endothelial cells (Kalucka et al., 2018). Therefore, BMEC in individuals with PD could also have increased glycolysis and TCA metabolism relative to BMEC in their healthy counterparts. Patients with PD also have elevated angiogenic growth factors such as vascular endothelial growth factor (VEGF) and placental growth factor (P1GF). These growth factors could contribute to BMEC proliferation, and they also correlated with increased BMEC permeability, as measured through the cerebrospinal fluid to plasma albumin ratio (Janelidze et al., 2015).
5.5. Traumatic brain injury (TBI)
TBI is classified as a brain injury caused by an external force such as a fall or a car accident. The reported impacts of TBI on BMEC metabolism vary depending on the model used to initiate TBI. In humans with moderate-to-severe TBI, cerebral blood flow was significantly decreased in gray matter 6- and 12-months post injury, as measured using arterial spin labeled perfusion magnetic resonance imaging (Gaggi et al., 2023). Cerebral hypoperfusion reduced BMEC access to vital nutrients, impairing both nutrient metabolism and transport to surrounding tissues. Isolated microvessels from rats 4- and 12-hours following TBI had reduced GLUT1 immunostaining (Balabanov et al., 2001), indicating that glucose metabolism and transport may be impaired immediately following TBI.
Cerebral ischemia following TBI is frequently modeled using an oxygen-glucose deprivation model in which cells are incubated in a hypoxic environment and in glucose-free medium. The cells are then changed to a normoxic environment with glucose-containing medium. Using this model, mouse BMEC had a reduced oxygen consumption rate following reoxygenation (Zhang et al., 2020), indicating that TCA metabolism may be impaired. These data from the oxygen glucose deprivation model, however, conflict with data derived from an in vitro acoustic blast TBI model, which showed upregulation of electron transport chain genes NDUFV1 and ND1 (Schmitt et al., 2023). In the in vitro blast model, primary human BMEC also had elevated calcium uptake and CM-H2DCFDA ROS labeling. The differences in these studies may occur because the oxygen-glucose deprivation model represents the long-term cerebral hypoperfusion effects of TBI, while the acoustic blast model represents both immediate and long-term effects of TBI. However, both of these in vitro models are simplifications of the complex physiological mechanisms underlying TBI and require validation in rodent and human models.
6. Emerging topics
6.1. Sex differences
Neurodegenerative diseases have clinically significant sexual dimorphisms, with diseases such as AD disproportionately affecting women and diseases such as PD disproportionately affecting men (for additional information, the reader is referred to the review by Weber et al.) (Weber & Clyne, 2021). Sex differences in BMEC metabolism are not well characterized, though some attempts have been made to assess sex differences in other endothelial cell types. In 2020, Oliva et al. used the Genotype-Tissue Expression (GTEx) Project to catalog sex differences across 44 human tissue sources, including brain tissue. 37% of all genes assayed in the GTEx database showed sex-biased gene expression (Oliva et al., 2020). Building off this work, Lee et al. investigated the sex bias of metabolic genes from human brain tissue in the GTEx database and found that between 1–2% of all differentially expressed genes between male and female brain tissue samples were metabolic genes (Lee, Profant, & Wang, 2022). Phosphoglucomutase (PGM1, converts glycogen to glucose-6-phosphate for glycolysis), pyruvate dehydrogenase (PDH; converts pyruvate to acetyl-CoA), isocitrate dehydrogenase 2 (IDH2; converts isocitrate to α-ketoglutarate), glutamate dehydrogenase (GLUD1; converts glutamate to alpha-ketoglutarate), and oxoglutarate dehydrogenase (OGDH; converts alpha-ketoglutarate to succinyl-CoA) were all elevated in female brain tissue. Phosphofructokinase (PFK; converts fructose-6-phosphate to fructose-1,6-phosphate) was the only enzyme in glycolysis or the TCA cycle showing higher expression in male brain tissue (Lee et al., 2022). Transcriptomic analysis of female rat brain microvessels showed pathway enrichment of genes involved in the respiratory chain/respiratory electron transport and chylomicron-mediated lipid transport, while male rat brain microvessels showed enrichment of pathways for cholesterol biosynthesis and glucokinase regulation (Chandra et al., 2021).
Sex differences in BMEC metabolism are likely a result of the combined effects of sex hormones and escape from X-chromosome inactivation (XCI). Sex hormones, and estrogen in particular, have metabolic effects on endothelial cells. 17-β-estradiol (E2) is the most potent estrogen in humans, and as such its effects are the most widely studied. In both male and female human coronary artery endothelial cells, E2 exposure increased mitochondrial calcium uptake, tetramethyl rhodamine, and mitochondrial mass (Damacena de Angelis et al., 2022). These data may be indicative of increased mitochondrial metabolism with estrogen. Furthermore, E2 exposure in primary BMEC increased superoxide and cytochrome c, an enzyme in the electron transport chain (Razmara et al., 2008), suggesting that estrogen elevates mitochondrial respiration.
Another possible mechanism of sex differences in BMEC metabolism is escape from XCI. During female embryonic development, one of the two X-chromosomes should be randomly and permanently inactivated so that X-chromosome gene expression is equal between cells with one and two X-chromosomes. However, approximately 15% of genes on the inactivated X-chromosome escape from inactivation, thereby doubling the gene expression in individuals with two X-chromosomes. The metabolic impacts of escape from XCI are not well characterized in any cell type. Recent papers from Tukiainen et al., Cotton et al. and Carrel and Willard explored the escape status of X-chromosome genes (Carrel & Willard, 2005; Cotton et al., 2013; Tukiainen et al., 2017). By merging the list of genes that escape XCI (in >78% of women) or variably escape XCI (22–78% of women) (Tukiainen et al., 2017) with a complete metabolic gene list (Brunk et al., 2018), we identified metabolic genes expressed in endothelial cells that escape from XCI and therefore may contribute to sex differences in BMEC metabolism (Table 1). Genes for SLC25A6, CA5B, and COX7B, which contribute to mitochondrial metabolism, and HS6ST2 and RENBP, which contribute to glycosaminoglycan metabolism, are of particular interest for future study.
Table 1.
Metabolic genes that escape XCI.
| Gene ID | Gene name | Escape status | Metabolic pathway |
|---|---|---|---|
| SLC25A6 | Solute carrier family 25 member 6 | Escape | Mitochondrial metabolism |
| ASMT | Acetylserotonin O-Methyltransferase | Escape | Tryptophan metabolism |
| GYG2 | Glycogenin 2 | Escape | Glycogen metabolism |
| STS | Steroid sulfatase | Escape | Steroid metabolism |
| PNPLA4 | Patatin like phospholipase domain containing 4 | Escape | Triglyceride hydrolysis/Renin metabolism |
| ACE2 | Angiotensin I converting enzyme 2 | Escape | Thermogenesis/Energy metabolism |
| CA5B | Carbonic anhydrase 5B | Escape | Mitochondrial metabolism |
| MAOA | Monoamine oxidase A | Escape | Neurotransmitter metabolism |
| HS6ST2 | Heparine sulfate 6-O-sulfotransferase 2 | Escape | Glycosamineoglycan metabolism |
| RENBP | Renin binding protein | Escape | Glycosamineoglycan metabolism |
| CTPS2 | CTP synthase 2 | Variable | Nucelotide synthesis |
| OTC | Ornithine carbomoyltransferase | Variable | Nitrogen metabolism (urea cycle) |
| COX7B | Cytochrome C oxidase subunit 7B | Variable | Mitochondrial metabolism (ETC) |
6.2. Integrated transport and metabolism
Endothelial cell metabolism is tightly linked to metabolite transport. Metabolomics advances have awakened our interest in and expanded our ability to study endothelial cell metabolism (Eelen, de Zeeuw, Simons, & Carmeliet, 2015; Goveia, Stapor, & Carmeliet, 2014; Li, Sun, & Carmeliet, 2019). However, endothelial cell metabolism studies primarily use a single cell type cultured on an impermeable substrate (Cantelmo et al., 2016; De Bock et al., 2013; Dumas, García-Caballero, & Carmeliet, 2020; Huang et al., 2017; Kalucka et al., 2018; Schoors et al., 2014, 2015). These experiments improved our understanding of how endothelial cell metabolism does more than provide the cell with energy. Indeed, we now know that endothelial cells use glycolysis to produce ATP even under oxidative conditions and consume different metabolites to support proliferation, migration, and quiescence (Dumas et al., 2020). However, these traditional experimental systems do not account for the fact that endothelial cells must both metabolize nutrients for their own needs and transport nutrients to cells in the vascular wall or the parenchymal tissue. Since endothelial cells actively transport metabolites across the cell, which metabolites get transported and in what quantities likely depends on both the state of the endothelial cells and the needs of the cells on the other side (Tumova, Kerimi, Porter, & Williamson, 2016). Future studies should integrate BMEC metabolism and transport using both experimental and computational approaches to better understand how these two processes are balanced in the vascular wall.
Co-culture studies with metabolism, transport, and intercellular communication are vital for understanding NVU metabolic functions. However, metabolic studies of co-cultures are complex to resolve. Co-cultures can be studied through physical separation of different cell types or by purification of the different cell types after mixed co-culture. However, the time required for purification could disrupt metabolic measurements. Computational methods such as iMFA could analyze fluxes for cells in co-culture without separating cells experimentally. In a recent study, co-cultured cells were modeled as separate compartments (Gebreselassie & Antoniewicz, 2015). Each compartment had a complete set of metabolic reactions, metabolite exchange occurred between the compartments. Future work could focus on improving computational techniques to deconvolute co-culture data, as well as refining experimental co-culture techniques.
6.3. Computational models
Steady-state metabolic models are powerful tools to estimate fluxes in complex metabolic networks; however, these models lack the temporal resolution needed to delineate metabolic changes in mammalian cells as they differentiate, activate, proliferate, and/or undergo pharmacological treatment (Campit & Chandrasekaran, 2020). To address this gap, dynamic metabolic flux analysis (DMFA) methods have been developed. One model used a “piecewise” approach, in which time-course metabolomic data was collected and the experimental time course was divided into biologically relevant phases (Fig. 7A) (Altamirano, Illanes, Becerra, Cairó, & Gòdia, 2006; Niklas, Schräder, Sandig, Noll, & Heinzle, 2011). For example, extracellular lactate, pyruvate, glucose, and amino acid concentrations were measured in the liver cancer cell line HepG2 in low, normal, and high glucose conditions at four different time points (0, 24, 48, 72, and 144 h). The authors then used a piecewise FBA (pwFBA) approach to identify different metabolic phases and their associated fluxes and growth rates. Extracellular flux data were used to constrain a liver-specific GSSM, and FBA was used to estimate the maximum growth rate for each phase (Nilsson et al., 2020). The resulting flux and growth estimates were subsequently input into a system of ordinary differential equations (ODE) to predict metabolite concentrations. Upon reaching predefined concentration thresholds (e.g., complete metabolite depletion at 0 mM), the fluxes and maximum growth rate were then recalculated using new growth and exchange parameters. By integrating ODE systems and FBA, the authors identified four critical metabolite phases, determined that glutamine depletion was primarily responsible for growth reduction, and predicted temporal changes in vitamins or cofactor concentration that could not be measured experimentally (Nilsson et al., 2020).
Fig. 7.

Dynamic flux metabolic analysis (DMFA) can estimate temporal flux data from both metabolite abundance and isotope labeling data. (A) Initial approaches to DMFA use discrete metabolic phases during which metabolite fluxes are at relative steady-state. Flux analysis is performed for each phase and pieced together to examine flux change across time. This method does not utilize isotope labeling data and is typically used in combination with GSMM/FBA. (B) Dynamic iMFA integrate isotope labeling data across time during non-metabolic steady state conditions and use advanced sophisticated computational techniques (such as B-splines) to estimate fluxes over time.
A limitation of the aforementioned approach is that they only incorporated metabolite abundance data but not enrichment data, which would have provided more accurate information about the underlying metabolic fluxes. However, performing DMFA using enrichment data is an intractable and computationally expensive problem when using traditional ODE methods. To overcome this limitation, B-spline polynomial functions can be used to enable faster calculations that can be adapted for a variety of possible flux scenarios. In one example, insulin-treated adipocytes were fed U-13C6 glucose and measured across six time points. DMFA showed that adipocyte glycolytic pathways responded more quickly to insulin treatment than TCA cycle pathways, which meant that the adipocytes converted more glucose influx to lactate within the experimental timeframe (Quek et al., 2020). This work highlights the ability of DMFA using improved mathematical techniques to resolve non-stable fluxes in human cells (Fig. 7B).
7. Conclusions and key takeaways
BMEC metabolism is vital to maintaining endothelial barrier function, and BMEC must precisely balance their own metabolic needs with transporting metabolites to the rest of the brain. The cited studies show the importance of BMEC nutrient metabolism and transport for cerebral health and in the development of new treatments for neurovascular disease. In this chapter, we highlighted the mechanisms by which BMEC metabolism impacts barrier function, as well as how BMEC alter nutrient transport by modulating brain blood flow and specific membrane transporters to support other cerebral cells. We describe how to measure BMEC metabolism and its potential role in aging and disease. Finally, we delineate opportunities and challenges in BMEC metabolism research. Key takeaways from the chapter include:
BMEC are primarily glycolytic but can also use and transport glutamine, glutamate, and fatty acids to power cellular functions.
BMEC metabolism in vitro can be measured in 2D monoculture systems or in more complex 3D Transwell, hydrogel, organ-on-a-chip, or organoid systems incorporating other cells of the NVU using methods like YSI, Seahorse, Oroboros O2k, metabolomics, and transcriptomics.
In vivo BMEC metabolism can be delineated using gene editing methods and fluorescent metabolite sensors combined with intracranial imaging. However, most current methods still quantify whole brain metabolism rather than brain endothelial-specific metabolism.
Computational methods to investigate metabolism can be classified into steady-state or kinetic approaches. A key advantage of models is their ability to account for complex interactions in large, non-trivial metabolic networks. These models can be used to explore BMEC metabolism, particularly in the context of BMEC interactions with other cells of the NVU.
BMEC metabolic dysfunction is associated with neurological diseases including AD, MS, PD, and TBI. More research is needed to better understand how metabolic dysfunction contributes to decreased barrier function and contributes to dysfunction of other cells in the NVU.
Future research should focus on how BMEC contribute to sexual dimorphisms in neurological disease, as well as development of integrated experimental and computational models of BMEC metabolism and transport under dynamic biological conditions.
References
- Afshar N, Safaei S, Nickerson DP, Hunter PJ, & Suresh V (2019). Computational modeling of glucose uptake in the enterocyte. Frontiers in Physiology, 10. 10.3389/fphys.2019.00380. [DOI] [PMC free article] [PubMed] [Google Scholar]
- Al-Ahmad AJ (2017). Comparative study of expression and activity of glucose transporters between stem cell-derived brain microvascular endothelial cells and hCMEC/D3 cells. American Journal of Physiology—Cell Physiology, 313(4), C421–C429. 10.1152/ajpcell.00116.2017. [DOI] [PMC free article] [PubMed] [Google Scholar]
- Alakbarzade V, Hameed A, Quek DQY, Chioza BA, Baple EL, Cazenave-Gassiot A, … Crosby AH (2015). A partially inactivating mutation in the sodium-dependent lysophosphatidylcholine transporter MFSD2A causes a non-lethal microcephaly syndrome. Nature Genetics, 47(7), 814–817. 10.1038/ng.3313. [DOI] [PubMed] [Google Scholar]
- Altamirano C, Illanes A, Becerra S, Cairó JJ, & Gòdia F (2006). Considerations on the lactate consumption by CHO cells in the presence of galactose. Journal of Biotechnology, 125(4), 547–556. 10.1016/j.jbiotec.2006.03.023. [DOI] [PubMed] [Google Scholar]
- Andreone BJ, Chow BW, Tata A, Ginty DD, Clish CB, & Gu C (2017). Blood-brain barrier permeability is regulated by lipid transport-dependent suppression of caveolae-mediated transcytosis. Neuron, 94(3), 581–594. 10.1016/j.euron.2017.03.043. [DOI] [PMC free article] [PubMed] [Google Scholar]
- Asano S, Kameyama M, Oura A, Morisato A, Sakai H, Tabuchi Y, … Kanai Y (2007). L-type amino acid transporter-1 expressed in human astrocytomas, U343MGa. Biological and Pharmaceutical Bulletin, 30(3), 415–422. 10.1248/bpb.30.415. [DOI] [PubMed] [Google Scholar]
- Aung HH, Altman R, Nyunt T, Kim J, Nuthikattu S, Budamagunta M, … Villablanca AC (2016). Lipotoxic brain microvascular injury is mediated by activating transcription factor 3-dependent inflammatory and oxidative stress pathways. Journal of Lipid Research, 57(6), 955–968. 10.1194/jlr.M061853. [DOI] [PMC free article] [PubMed] [Google Scholar]
- Balabanov R, Goldman H, Murphy S, Pellizon G, Owen C, Rafols J, & Dore-Duffy P (2001). Endothelial cell activation following moderate traumatic brain injury. Neurological Research, 23(2–3), 175–182. 10.1179/016164101101198514. [DOI] [PubMed] [Google Scholar]
- Barcia C, Bautista V, Sánchez-Bahillo Á, Fernández-Villalba E, Faucheux B, Poza y Poza M, … Herrero M-T (2005). Changes in vascularization in substantia nigra pars compacta of monkeys rendered parkinsonian. Journal of Neural Transmission, 112(9), 1237–1248. 10.1007/s00702-004-0256-2. [DOI] [PubMed] [Google Scholar]
- Barros LF, San Martín A, Ruminot I, Sandoval PY, Fernández-Moncada I, Baeza-Lehnert F, … Alegría K (2017). Near-critical GLUT1 and neurodegeneration. Journal of Neuroscience Research, 95(11), 2267–2274. 10.1002/jnr.23998. [DOI] [PubMed] [Google Scholar]
- Basehore SE, Bohlman S, Weber C, Swaminathan S, Zhang Y, Jang C, … Clyne AM (2021). Laminar flow on endothelial cells suppresses eNOS O-GlcNAcylation to promote eNOS activity. Circulation Research, 129(11), 1054–1066. 10.1161/CIRCRESAHA.121.318982/FORMAT/EPUB. [DOI] [PMC free article] [PubMed] [Google Scholar]
- Beard RS, Reynolds JJ, & Bearden SE (2012). Metabotropic glutamate receptor 5 mediates phosphorylation of vascular endothelial cadherin and nuclear localization of β-catenin in response to homocysteine. Vascular Pharmacology, 56(3–4), 159–167. 10.1016/j.vph.2012.01.004. [DOI] [PMC free article] [PubMed] [Google Scholar]
- Ben-Zvi A, Lacoste B, Kur E, Andreone BJ, Mayshar Y, Yan H, & Gu C (2014). Mfsd2a is critical for the formation and function of the blood-brain barrier. Nature, 509(7501), 507–511. 10.1038/nature133242. [DOI] [PMC free article] [PubMed] [Google Scholar]
- Bergersen LH (2007). Is lactate food for neurons? Comparison of monocarboxylate transporter subtypes in brain and muscle. Neuroscience, 145(1), 11–19. 10.1016/j.neuroscience.2006.11.062. [DOI] [PubMed] [Google Scholar]
- Bergersen LH (2015). Lactate transport and signaling in the brain: Potential therapeutic targets and roles in body—Brain interaction. Journal of Cerebral Blood Flow & Metabolism, 35(2), 176–185. 10.1038/jcbfm.2014.206. [DOI] [PMC free article] [PubMed] [Google Scholar]
- Brooks GA (2009). Cell–cell and intracellular lactate shuttles. The Journal of Physiology, 587(23), 5591–5600. 10.1113/jphysiol.2009.178350. [DOI] [PMC free article] [PubMed] [Google Scholar]
- Brown JA, Codreanu SG, Shi M, Sherrod SD, Markov DA, Neely MD, … Wikswo JP (2016). Metabolic consequences of inflammatory disruption of the blood-brain barrier in an organ-on-chip model of the human neurovascular unit. Journal of Neuroinflammation, 13(1), 10.1186/s12974-016-0760-y. [DOI] [PMC free article] [PubMed] [Google Scholar]
- Brunk E, Sahoo S, Zielinski DC, Altunkaya A, Dräger A, Mih N, … Palsson BO (2018). Recon3D enables a three-dimensional view of gene variation in human metabolism. Nature Biotechnology, 36(3), 272–281. 10.1038/nbt.4072. [DOI] [PMC free article] [PubMed] [Google Scholar]
- Calon F (2011). Omega-3 polyunsaturated fatty acids in Alzheimers disease: Key questions and partial answers. Current Alzheimer Research, 8(5), 470–478. 10.2174/156720511796391881. [DOI] [PubMed] [Google Scholar]
- Camici GG, Savarese G, Akhmedov A, & Lüscher TF (2015). Molecular mechanism of endothelial and vascular aging: Implications for cardiovascular disease. European Heart Journal, 36(48), 3392–3403. 10.1093/euheartj/ehv587. [DOI] [PubMed] [Google Scholar]
- Campit S, & Chandrasekaran S (2020). Inferring metabolic flux from time-course metabolomics. Springer; 299–313. 10.1007/978-1-0716-0159-4_13. [DOI] [PubMed] [Google Scholar]
- Cantelmo AR, Conradi L-C, Brajic A, Goveia J, Kalucka J, Pircher A, … Carmeliet P (2016). Inhibition of the glycolytic activator PFKFB3 in endothelium induces tumor vessel normalization, impairs metastasis, and improves chemotherapy. Cancer Cell, 30(6), 968–985. 10.1016/j.ccell.2016.10.006. [DOI] [PMC free article] [PubMed] [Google Scholar]
- Carrel L, & Willard HF (2005). X-inactivation profile reveals extensive variability in X-linked gene expression in females. Nature, 434(7031), 400–404. 10.1038/nature03479. [DOI] [PubMed] [Google Scholar]
- Carvey PM, Zhao CH, Hendey B, Lum H, Trachtenberg J, Desai BS, … Ling ZD (2005). 6-Hydroxydopamine-induced alterations in blood–brain barrier permeability. European Journal of Neuroscience, 22(5), 1158–1168. 10.1111/j.1460-9568.2005.04281.x. [DOI] [PubMed] [Google Scholar]
- Chandra PK, Cikic S, Baddoo MC, Rutkai I, Guidry JJ, Flemington EK, … Busija DW (2021). Transcriptome analysis reveals sexual disparities in gene expression in rat brain microvessels. Journal of Cerebral Blood Flow and Metabolism, 41(9), 2311–2328. 10.1177/0271678X21999553. [DOI] [PMC free article] [PubMed] [Google Scholar]
- Chen X, Wolfe DA, Bindu DS, Zhang M, Taskin N, Goertsen D, … Gradinaru V (2023). Functional gene delivery to and across brain vasculature of systemic AAVs with endothelial-specific tropism in rodents and broad tropism in primates. Nature Communications, 14(1), 10.1038/s41467-023-38582-7. [DOI] [PMC free article] [PubMed] [Google Scholar]
- Chung TD, Linville RM, Guo Z, Ye R, Jha R, Grifno GN, & Searson PC (2022). Effects of acute and chronic oxidative stress on the blood–brain barrier in 2D and 3D in vitro models. Fluids and Barriers of the CNS, 19(1), 10.1186/s12987-022-00327-x. [DOI] [PMC free article] [PubMed] [Google Scholar]
- Cohen EB, Gecki RC, & Toker A (2020). Metabolic pathway alterations in microvascular endothelial cells in response to hypoxia. PLoS One, 15(7 July 2020), 10.1371/journal.pone.0232072. [DOI] [PMC free article] [PubMed] [Google Scholar]
- Cotton AM, Ge B, Light N, Adoue V, Pastinen T, & Brown CJ (2013). Analysis of expressed SNPs identifies variable extents of expression from the human inactive X chromosome. Genome Biology, 14(11), R122. 10.1186/gb-2013-14-11-r122. [DOI] [PMC free article] [PubMed] [Google Scholar]
- Cucullo L, Hossain M, Puvenna V, Marchi N, & Janigro D (2011). The role of shear stress in Blood-Brain Barrier endothelial physiology. BMC Neuroscience, 12. 10.1186/1471-2202-12-40. [DOI] [PMC free article] [PubMed] [Google Scholar]
- Dabertrand F, Harraz OF, Koide M, Longden TA, Rosehart AC, Hill-Eubanks DC, … Nelson MT (2021). PIP2 corrects cerebral blood flow deficits in small vessel disease by rescuing capillary Kir2.1 activity. Proceedings of the National Academy of Sciences, 118(17), 10.1073/pnas.2025998118. [DOI] [PMC free article] [PubMed] [Google Scholar]
- Damacena de Angelis C, Endoni BT, Nuno D, Lamping K, Ledolter J, Koval OM, & Grumbach IM (2022). Sex-specific differences in endothelial function are driven by divergent mitochondrial Ca2+ handling. Journal of the American Heart Association, 11(13), 10.1161/JAHA.121.023912. [DOI] [PMC free article] [PubMed] [Google Scholar]
- Daulatzai MA (2017). Cerebral hypoperfusion and glucose hypometabolism: Key pathophysiological modulators promote neurodegeneration, cognitive impairment, and Alzheimer’s disease. Journal of Neuroscience Research, 95(4), 943–972. 10.1002/jnr.23777. [DOI] [PubMed] [Google Scholar]
- de Leon MJ, Ferris SH, George AE, Christman DR, Fowler JS, Gentes C, … Wolf AP (1983). Positron emission tomographic studies of aging and Alzheimer disease. AJNR. American Journal of Neuroradiology, 4(3), 568–571. [PMC free article] [PubMed] [Google Scholar]
- De Bock K, Georgiadou M, & Carmeliet P (2013). Role of endothelial cell metabolism in vessel sprouting. Cell Metabolism, 18(5), 634–647. 10.1016/j.cmet.2013.08.001. [DOI] [PubMed] [Google Scholar]
- De Bock K, Georgiadou M, Schoors S, Kuchnio A, Wong BW, Cantelmo AR, … Carmeliet P (2013). Role of PFKFB3-driven glycolysis in vessel sprouting. Cell, 154(3), 651–663. 10.1016/j.cell.2013.06.037. [DOI] [PubMed] [Google Scholar]
- Dehouck B, Fenart L, Dehouck M-P, Pierce A, Torpier G, & Cecchelli R (1997). A new function for the LDL receptor: Transcytosis of LDL across the blood–brain barrier. The Journal of Cell Biology, 138(4), 877–899. 10.1083/jcb.138.4.877. [DOI] [PMC free article] [PubMed] [Google Scholar]
- Dienel GA (2012). Brain lactate metabolism: The discoveries and the controversies. Journal of Cerebral Blood Flow & Metabolism, 32(7), 1107–1138. 10.1038/jcbfm.2011.175. [DOI] [PMC free article] [PubMed] [Google Scholar]
- Dobi A, Rosanaly S, Devin A, Baret P, Meilhac O, Jean Harry G, … Rondeau P (2021). Advanced glycation end-products disrupt brain microvascular endothelial cell barrier: The role of mitochondria and oxidative stress. Microvascular Research, 133, 104098. 10.1016/j.mvr.2020.104098. [DOI] [PMC free article] [PubMed] [Google Scholar]
- Duelli R, Enerson BE, Gerhart DZ, & Drewes LR (2000). Expression of large amino acid transporter LAT1 in rat brain endothelium. Journal of Cerebral Blood Flow & Metabolism, 20(11), 1557–1562. 10.1097/00004647-200011000-00005. [DOI] [PubMed] [Google Scholar]
- Dumas SJ, García-Caballero M, & Carmeliet P (2020). Metabolic signatures of distinct endothelial phenotypes. Trends in Endocrinology & Metabolism, 31(8), 580–595. 10.1016/j.tem.2020.05.009. [DOI] [PubMed] [Google Scholar]
- Eelen G, de Zeeuw P, Simons M, & Carmeliet P (2015). Endothelial cell metabolism in normal and diseased vasculature. Circulation Research, 116(7), 1231–1244. 10.1161/CIRCRESAHA.116.302855. [DOI] [PMC free article] [PubMed] [Google Scholar]
- Elabi OF, Cunha JPMCM, Gaceb A, Fex M, & Paul G (2021). High-fat diet-induced diabetes leads to vascular alterations, pericyte reduction, and perivascular depletion of microglia in a 6-OHDA toxin model of Parkinson disease. Journal of Neuroinflammation, 18(1), 175. 10.1186/s12974-021-02218-8. [DOI] [PMC free article] [PubMed] [Google Scholar]
- Estes RE, Lin B, Khera A, & Davis MY (2021). Lipid metabolism influence on neurodegenerative disease progression: Is the vehicle as important as the cargo? Frontiers in Molecular Neuroscience, 14. 10.3389/fnmol.2021.788695. [DOI] [PMC free article] [PubMed] [Google Scholar]
- Ezkurdia A, Ramírez MJ, & Solas M (2023). Metabolic syndrome as a risk factor for Alzheimer’s disease: A focus on insulin resistance. International Journal of Molecular Sciences, 24(5), 4354. 10.3390/ijms24054354. [DOI] [PMC free article] [PubMed] [Google Scholar]
- Farrell CL, & Pardridge WM (1991). Blood-brain barrier glucose transporter is asymmetrically distributed on brain capillary endothelial lumenal and ablumenal membranes: An electron microscopic immunogold study. Proceedings of the National Academy of Sciences, 88(13), 5779–5783. 10.1073/pnas.88.13.5779. [DOI] [PMC free article] [PubMed] [Google Scholar]
- Faucheux BA, Agid Y, Hirsch EC, & Bonnet A-M (1999). Blood vessels change in the mesencephalon of patients with Parkinson’s disease. The Lancet, 353(9157), 981–982. 10.1016/S0140-6736(99)00641-8. [DOI] [PubMed] [Google Scholar]
- Fehr M, Frommer WB, & Lalonde S (2002). Visualization of maltose uptake in living yeast cells by fluorescent nanosensors. Proceedings of the National Academy of Sciences, 99(15), 9846–9851. https://doi.org/10/1073/pnas.142089199. [DOI] [PMC free article] [PubMed] [Google Scholar]
- Ferreiro E, Lanzillo M, Canhoto D, Carvalho da Silva AM, Mota SI, Dias IS, … Rego AC (2020). Chronic hyperglycemia impairs hippocampal neurogenesis and memory in an Alzheimer’s disease mouse model. Neurobiology of Aging, 92, 98–113. 10.1016/j.neurobiolaging.2020.04.003. [DOI] [PubMed] [Google Scholar]
- Froberg MK, Gerhart DZ, Enerson BE, Manivel C, Guzman-Paz M, Seacotte N, & Drewes LR (2001). Expression of monocarboxylate transporter MCT1 in normal and neoplastic human CNS tissues. Neuroreport, 12(4), 761–765. 10.1097/00001756-200103260-00030. [DOI] [PubMed] [Google Scholar]
- Gaggi NL, Ware JB, Dolui S, Brennan D, Torrellas J, Wang Z, … Kim JJ (2023). Temporal dynamics of cerebral blood flow during the first year after moderate-severe traumatic brain injury: A longitudinal perfusion MRI study. NeuroImage: Clinical, 37, 103344. 10.1016/j.nicl.2023.103344. [DOI] [PMC free article] [PubMed] [Google Scholar]
- Gebreselassie NA, & Antoniewicz MR (2015). 13C-metabolic flux analysis of co-cultures: A novel approach. Metabolic Engineering, 31, 132–139. 10.1016/j.ymben.2015.07.005. [DOI] [PMC free article] [PubMed] [Google Scholar]
- Gerhart DZ, Enerson BE, Zhdankina OY, Leino RL, & Drewes LR (1997). Expression of monocarboxylate transporter MCT1 by brain endothelium and glia in adult and suckling rats. American Journal of Physiology-Endocrinology and Metabolism, 273(1), E207–E213. 10.1152/ajpendo.1997.273.1.E207. [DOI] [PubMed] [Google Scholar]
- Goldeman C, Ozgür B, & Brodin B (2020). Culture-induced changes in mRNA expression levels of efflux and SLC-transporters in brain endothelial cells. Fluids and Barriers of the CNS, 17, 32. 10.1186/s12987-020-00193-5. [DOI] [PMC free article] [PubMed] [Google Scholar]
- Goveia J, Stapor P, & Carmeliet P (2014). Principles of targeting endothelial cell metabolism to treat angiogenesis and endothelial cell dysfunction in disease. EMBO Molecular Medicine, 6(9), 1105–1120. 10.15252/emmm.201404156. [DOI] [PMC free article] [PubMed] [Google Scholar]
- Hariharan A, Robertson CD, Garcia DCG, & Longden TA (2022). Brain capillary pericytes are metabolic sentinels that control blood flow through a KATP channel-dependent energy switch. Cell Reports, 41(13), 111872. 10.1016/j.celrep.2022.111872. [DOI] [PMC free article] [PubMed] [Google Scholar]
- Harris JO, Frank JA, Patronas N, McFarlin DE, & McFarland HF (1991). Serial gadolinium-enhanced magnetic resonance imaging scans in patients with early, relapsing-remitting multiple sclerosis: Implications for clinical trials and natural history. Annals of Neurology, 29(5), 548–555. 10.1002/ana.410290515. [DOI] [PubMed] [Google Scholar]
- Hawkins RA (2009). The blood-brain barrier and glutamate. The American Journal of Clinical Nutrition, 90(3), 867S–874S. 10.3945/ajcn.2009.27462BB. [DOI] [PMC free article] [PubMed] [Google Scholar]
- Hawkins R, & Viña J (2016). How glutamate is managed by the blood–brain barrier. Biology, 5(4), 37. 10.3390/biology5040037. [DOI] [PMC free article] [PubMed] [Google Scholar]
- Huang H, Vandekeere S, Kalucka J, Bierhansl L, Zecchin A, Brüning U, … Carmeliet P (2017). Role of glutamine and interlinked asparagine metabolism in vessel formation. The EMBO Journal, 36, 2334–2352. 10.15252/embj.201695518. [DOI] [PMC free article] [PubMed] [Google Scholar]
- Huang Y, Lei L, Liu D, Jovin I, Russell R, Johnson RS, … Giordano FJ (2012). Normal glucose uptake in the brain and heart requires an endothelial cell-specific HIF-1-dependent function. Proceedings of the National Academy of Sciences, 109(43), 17478–17483. 10.1073/pnas.1209281109. [DOI] [PMC free article] [PubMed] [Google Scholar]
- Islam MM, Schroeder WL, & Saha R (2021). Kinetic modeling of metabolism: Present and future. Current Opinion in Systems Biology, 26, 72–78. 10.1016/j.coisb.2021.04.003. [DOI] [Google Scholar]
- Janelidze S, Lindqvist D, Francardo V, Hall S, Zetterberg H, Blennow K, … Hansson O (2015). Increased CSF biomarkers of angiogenesis in Parkinson disease. Neurology, 85(21), 1834–1842. 10.1212/WNL.0000000000002151. [DOI] [PMC free article] [PubMed] [Google Scholar]
- Kakava S, Schlumpf E, Panteloglou G, Tellenbach F, von Eckardstein A, & Robert J (2022). Brain endothelial cells in contrary to the aortic do not transport but degrade low-density lipoproteins via both LDLR and ALK1. Cells, 11(19), 10.3390/cells11193044. [DOI] [PMC free article] [PubMed] [Google Scholar]
- Kalucka J, Bierhansl L, Conchinha NV, Missiaen R, Elia I, Brüning U, … Carmeliet P (2018). Quiescent endothelial cells upregulate fatty acid β-oxidation for vasculoprotection via redox homeostasis. Cell Metabolism, 28(6), 881–894.e13. 10.1016/J.CMET.2018.07.016. [DOI] [PubMed] [Google Scholar]
- Keller JP, Marvin JS, Lacin H, Lemon WC, Shea J, Kim S, … Looger LL (2021). In vivo glucose imaging in multiple model organisms with an engineered single-wavelength sensor. Cell Reports, 35(12), 109284. 10.1016/j.celrep.2021.109284. [DOI] [PubMed] [Google Scholar]
- Kim B, Li J, Jang C, & Arany Z (2017). Glutamine fuels proliferation but not migration of endothelial cells. The EMBO Journal, 36, 2321–2333. 10.15252/embj.201796436. [DOI] [PMC free article] [PubMed] [Google Scholar]
- Kim K-S, Jeon MT, Kim ES, Lee CH, & Kim D-G (2022). Activation of NMDA receptors in brain endothelial cells increases transcellular permeability. Fluids and Barriers of the CNS, 19(1), 70. 10.1186/s12987-022-00364-6. [DOI] [PMC free article] [PubMed] [Google Scholar]
- Knaus LS, Basilico B, Malzl D, Gerykova Bujalkova M, Smogavec M, Schwarz LA, … Novarino G (2023). Large neutral amino acid levels tune perinatal neuronal excitability and survival. Cell, 186(9), 1950–1967.e25. 10.1016/j.cell.2023.02.037. [DOI] [PubMed] [Google Scholar]
- Koepsell H, & De H (2020). Glucose transporters in brain in health and disease. Pflügers. Archiv-European Journal of Physiology, 472, 1299–1343. 10.1007/s00424-020-02441-x/Published. [DOI] [PMC free article] [PubMed] [Google Scholar]
- Körbelin J, Dogbevia G, Michelfelder S, Ridder DA, Hunger A, Wenzel J, … Trepel M (2016). A brain microvasculature endothelial cell-specific viral vector with the potential to treat neurovascular and neurological diseases. EMBO Molecular Medicine, 8(6), 609–625. 10.15252/emmm.201506078. [DOI] [PMC free article] [PubMed] [Google Scholar]
- Krizbai IA, Bauer H, Bresgen N, Eckl PM, Farkas A, Szatmári E, … Bauer H-C (2005). Effect of oxidative stress on the junctional proteins of cultured cerebral endothelial cells. Cellular and Molecular Neurobiology, 25(1), 129–139. 10.1007/s10571-004-1378-7. [DOI] [PMC free article] [PubMed] [Google Scholar]
- Krolak T, Chan KY, Kaplan L, Huang Q, Wu J, Zheng Q, … Deverman BE (2022). A high-efficiency AAV for endothelial cell transduction throughout the central nervous system. Nature Cardiovascular Research, 1(4), 389–400. 10.1038/s44161-022-00046-4. [DOI] [PMC free article] [PubMed] [Google Scholar]
- Krützfeldt A, Spahr R, Mertens S, Siegmund B, & Piper HM (1990). Metabolism of exogenous substrates by coronary endothelial cells in culture. Journal of Molecular and Cellular Cardiology, 22(12), 1393–1404. 10.1016/0022-2828(90)90984-A. [DOI] [PubMed] [Google Scholar]
- Kumari S, Mehta SL, & Li PA (2012). Glutamate induces mitochondrial dynamic imbalance and autophagy activation: Preventive effects of selenium. PLoS One, 7(6), 39382. 10.1371/journal.pone.0039382. [DOI] [PMC free article] [PubMed] [Google Scholar]
- Kuriakose M, Younger D, Ravula AR, Alay E, Rama Rao KV, & Chandra N (2019). Synergistic role of oxidative stress and blood-brain barrier permeability as injury mechanisms in the acute pathophysiology of blast-induced neurotrauma. Scientific Reports, 9(1), 7717. 10.1038/s41598-019-44147-w. [DOI] [PMC free article] [PubMed] [Google Scholar]
- Lacalle-Aurioles M, Trigiani LJ, Bourourou M, Lecrux C, & Hamel E (2022). Alzheimer’s disease and cerebrovascular pathology alter inward rectifier potassium (KIR2.1) channels in endothelium of mouse cerebral arteries. British Journal of Pharmacology, 179(10), 2259–2274. 10.1111/bph.15751. [DOI] [PMC free article] [PubMed] [Google Scholar]
- Lacombe RJS, Chouinard-Watkins R, & Bazinet RP (2018). Brain docosahexaenoic acid uptake and metabolism. Molecular Aspects of Medicine, 64, 109–134. 10.1016/j.mam.2017.12.004. [DOI] [PubMed] [Google Scholar]
- Lee H, Xu Y, Zhu X, Jang C, Choi W, Bae H, … Simons M (2022). Endothelium-derived lactate is required for pericyte function and blood–brain barrier maintenance. The EMBO Journal, 41(9), 10.15252/embj.2021109890. [DOI] [PMC free article] [PubMed] [Google Scholar]
- Lee JW, Profant M, & Wang C (2022). Metabolic sex dimorphism of the brain at the gene, cell, and tissue level. The Journal of Immunology, 208(2), 212–220. 10.4049/jimmunol.2100853. [DOI] [PubMed] [Google Scholar]
- Lee KE, & Kang YS (2018). L-Citrulline restores nitric oxide level and cellular uptake at the brain capillary endothelial cell line (TR-BBB cells) with glutamate cytotoxicity. Microvascular Research, 120, 29–35. 10.1016/j.mvr.2018.05.010. [DOI] [PubMed] [Google Scholar]
- Lee W-J, Hawkins RA, Viña JR, & Peterson DR (1998). Glutamine transport by the blood-brain barrier: A possible mechanism for nitrogen removal. American Journal of Physiology-Cell Physiology, 274(4), C1101–C1107. 10.1152/ajpcell.1998.274.4.C1101. [DOI] [PubMed] [Google Scholar]
- Leen WG, Klepper J, Verbeek MM, Leferink M, Hofste T, Van Engelen BG, … Willemsen MA (2010). Glucose transporter-1 deficiency syndrome: The expanding clinical and genetic spectrum of a treatable disorder. Brain, 133(3), 655–670. 10.1093/brain/awp336. [DOI] [PubMed] [Google Scholar]
- Leippe D, Sobol M, Vidugiris G, Cali JJ, & Vidugiriene J (2017). Bioluminescent assays for glucose and glutamine metabolism: High-throughput screening for changes in extracellular and intracellular metabolites. SLAS Discovery, 22(4), 366–377. 10.1177/1087057116675612. [DOI] [PubMed] [Google Scholar]
- Li W, Maloney RE, & Aw TY (2015). High glucose, glucose fluctuation and carbonyl stress enhance brain microvascular endothelial barrier dysfunction: Implications for diabetic cerebral microvasculature. Redox Biology, 5, 80–90. 10.1016/j.redox.2015.03.005. [DOI] [PMC free article] [PubMed] [Google Scholar]
- Li X, Sun X, & Carmeliet P (2019). Hallmarks of endothelial cell metabolism in health and disease. Cell Metabolism, 30(3), 414–433. 10.1016/j.cmet.2019.08.011. [DOI] [PubMed] [Google Scholar]
- Liu B, & Dai Z (2022). Fatty acid metabolism in endothelial cell. Genes, 13(12), 2301. 10.3390/genes13122301. [DOI] [PMC free article] [PubMed] [Google Scholar]
- Liu C, Wu J, & Zou MH (2012). Activation of AMP-activated protein kinase alleviates High-glucose-induced dysfunction of brain microvascular endothelial cell tight-junction dynamics. Free Radical Biology and Medicine, 53(6), 1213–1221. 10.1016/j.freeradbiomed.2012.07.003. [DOI] [PMC free article] [PubMed] [Google Scholar]
- Lochhead JJ, McCaffrey G, Quigley CE, Finch J, Demarco KM, Nametz N, & Davis TP (2010). Oxidative stress increases blood-brain barrier permeability and induces alterations in occludin during hypoxia-reoxygenation. Journal of Cerebral Blood Flow and Metabolism, 30(9), 1625–1636. 10.1038/jcbfm.2010.29. [DOI] [PMC free article] [PubMed] [Google Scholar]
- Longden TA, Dabertrand F, Koide M, Gonzales AL, Tykocki NR, Brayden JE, … Nelson MT (2017). Capillary K+-sensing initiates retrograde hyperpolarization to increase local cerebral blood flow. Nature Neuroscience, 20(5), 717–726. 10.1038/nn.4533. [DOI] [PMC free article] [PubMed] [Google Scholar]
- López-Otín C, Blasco MA, Partridge L, Serrano M, & Kroemer G (2013). The hallmarks of aging. Cell, 153, 1194–1217. 10.1016/j.cell.2013.05.039. [DOI] [PMC free article] [PubMed] [Google Scholar]
- Mailloux RJ, McBride SL, & Harper M-E (2013). Unearthing the secrets of mitochondrial ROS and glutathione in bioenergetics. Trends in Biochemical Sciences, 38(12), 592–602. 10.1016/j.tibs.2013.09.001. [DOI] [PubMed] [Google Scholar]
- Mallick R, & Duttaroy AK (2022). Modulation of endothelium function by fatty acids. Molecular and Cellular Biochemistry, 477(1), 15–38. 10.1007/s11010-021-04260-9. [DOI] [PMC free article] [PubMed] [Google Scholar]
- Mann VM, Cooper JM, Krige D, Daniel SE, Schapira AH, & Marsden CD (1992). Brain, skeletal muscle and platelet homogenate mitochondrial function in Parkinson’s disease. Brain, 115(2), 333–342. 10.1093/brain/115.2.333. [DOI] [PubMed] [Google Scholar]
- Marottoli FM, Trevino TN, Geng X, Arbieva Z, Kanabar P, Maienschein-Cline M, … Tai LM (2021). Autocrine effects of brain endothelial cell-produced human apolipoprotein E on metabolism and inflammation in vitro. Frontiers in Cell and Developmental Biology, 9. 10.3389/fcell.2021.668296. [DOI] [PMC free article] [PubMed] [Google Scholar]
- Marsillach J, Adorni MP, Zimetti F, Papotti B, Zuliani G, & Cervellati C (2020). HDL proteome and Alzheimer’s disease: Evidence of a link. Antioxidants, 9(12), 1224. 10.3390/antiox9121224. [DOI] [PMC free article] [PubMed] [Google Scholar]
- Mergenthaler P, Lindauer U, Dienel GA, & Meisel A (2013). Sugar for the brain: The role of glucose in physiological and pathological brain function. Trends in Neurosciences, 36(10), 587–597. 10.1016/j.tins.2013.07.001. [DOI] [PMC free article] [PubMed] [Google Scholar]
- Mitchell RW, On NH, Del Bigio MR, Miller DW, & Hatch GM (2011). Fatty acid transport protein expression in human brain and potential role in fatty acid transport across human brain microvessel endothelial cells. Journal of Neurochemistry, 117, 735–746. 10.1111/j.1471-4159.2011.07245.x. [DOI] [PubMed] [Google Scholar]
- Moiz B, Garcia J, Basehore S, Sun A, Li A, Padmanabhan S, … Clyne AM (2021). 13C metabolic flux analysis indicates endothelial cells attenuate metabolic perturbations by modulating Tca activity. Metabolites, 11(4), 10.3390/metabo11040226. [DOI] [PMC free article] [PubMed] [Google Scholar]
- Moiz B, Li A, Padmanabhan S, Sriram G, & Clyne AM (2022). Isotope-assisted metabolic flux analysis: A powerful technique to gain new insights into the human metabolome in health and disease. Metabolites, 12(11), 1066. 10.3390/METABO12111066. [DOI] [PMC free article] [PubMed] [Google Scholar]
- Moiz B, Sriram G, & Clyne AM (2023). Interpreting metabolic complexity via isotope-assisted metabolic flux analysis. Trends in Biochemical Sciences, 48(6), 553–567. 10.1016/j.tibs.2023.02.001. [DOI] [PMC free article] [PubMed] [Google Scholar]
- Mosconi L, De Santi S, Rusinek H, Convit A, & de Leon MJ (2004). Magnetic resonance and PET studies in the early diagnosis of Alzheimer’s disease. Expert Review of Neurotherapeutics, 4(5), 831–849. 10.1586/14737175.4.5.831. [DOI] [PubMed] [Google Scholar]
- Mosconi L, Pupi A, & de Leon MJ (2008). Brain glucose hypometabolism and oxidative stress in preclinical Alzheimer’s disease. Annals of the New York Academy of Sciences, 1147, 180–195. 10.1196/annals.1427.007. [DOI] [PMC free article] [PubMed] [Google Scholar]
- Mughal A, Harraz OF, Gonzales AL, Hill-Eubanks D, & Nelson MT (2021). PIP2 improves cerebral blood flow in a mouse model of Alzheimer’s disease. Function, 2(2), 10.1093/function/zqab010. [DOI] [PMC free article] [PubMed] [Google Scholar]
- Murphy EJ (2017). The blood–brain barrier and protein-mediated fatty acid uptake: Role of the blood–brain barrier as a metabolic barrier. Journal of Neurochemistry, 141(3), 324–329. 10.1111/jnc.14000. [DOI] [PubMed] [Google Scholar]
- Nashimoto Y, Mukomoto R, Imaizumi T, Terai T, Shishido S, Ino K, … Shiku H (2023). Electrochemical sensing of oxygen metabolism for a three-dimensional cultured model with biomimetic vascular flow. Biosensors and Bioelectronics, 219. 10.1016/j.bios.2022.114808. [DOI] [PubMed] [Google Scholar]
- Negri S, Faris P, Maniezzi C, Pellavio G, Spaiardi P, Botta L, … Moccia DF (2021). NMDA receptors elicit flux-independent intracellular Ca2+ signals via metabotropic glutamate receptors and flux-dependent nitric oxide release in human brain microvascular endothelial cells. Cell Calcium, 99, 102454. 10.1016/j.ceca.2021.102454. [DOI] [PubMed] [Google Scholar]
- Nguyen LN, Ma D, Shui G, Wong P, Cazenave-Gassiot A, Zhang X, … Silver D (2014). Mfsd2a is a transporter for the essential omega-3 fatty acid docosahexaenoic acid. Nature, 509(7501), 503–506. 10.1038/nature132413. [DOI] [PubMed] [Google Scholar]
- Niklas J, Schräder E, Sandig V, Noll T, & Heinzle E (2011). Quantitative characterization of metabolism and metabolic shifts during growth of the new human cell line AGE1.HN using time resolved metabolic flux analysis. Bioprocess and Biosystems Engineering, 34(5), 533–545. 10.1007/s00449-010-0502-y. [DOI] [PMC free article] [PubMed] [Google Scholar]
- Nilsson A, Haanstra JR, Engqvist M, Gerding A, Bakker BM, Klingmüller U, … Nielsen J (2020). Quantitative analysis of amino acid metabolism in liver cancer links glutamate excretion to nucleotide synthesis. Proceedings of the National Academy of Sciences, 117(19), 10294–10304. 10.1073/pnas.1919250117. [DOI] [PMC free article] [PubMed] [Google Scholar]
- Nyunt T, Britton M, Wanichthanarak K, Budamagunta M, Voss JC, Wilson DW, … Aung HH (2019). Mitochondrial oxidative stress-induced transcript variants of ATF3 mediate lipotoxic brain microvascular injury. Free Radical Biology and Medicine, 143, 25–46. 10.1016/j.freeradbiomed.2019.07.024. [DOI] [PMC free article] [PubMed] [Google Scholar]
- Ohgaki R, Ohmori T, Hara S, Nakagomi S, Kanai-Azuma M, Kaneda-Nakashima K, … Kanai Y (2017). Essential roles of L-type amino acid transporter 1 in syncytiotrophoblast development by presenting fusogenic 4F2hc. Molecular and Cellular Biology, 37(11), 10.1128/MCB.00427-16. [DOI] [PMC free article] [PubMed] [Google Scholar]
- Oldendorf WH, Cornford ME, & Brown J (1977). The large apparent work capability of the blood-brain barrier: A study of the mitochondrial content of capillary endothelial cells in brain and other tissues of the rat. Annals of Neurology, 1(5), 409–417. 10.1002/ana.410010502. [DOI] [PubMed] [Google Scholar]
- Oliva M, Muñoz-Aguirre M, Kim-Hellmuth S, Wucher V, Gewirtz ADH, Cotter DJ, … Stranger BE (2020). The impact of sex on gene expression across human tissues. Science (New York, N. Y.), 369(6509), eaba3066. 10.1126/science.aba3066. [DOI] [PMC free article] [PubMed] [Google Scholar]
- Osorio D, Pinzón A, Martín-Jiménez C, Barreto GE, & González J (2020). Multiple pathways involved in palmitic acid-induced toxicity: A system biology approach. Frontiers in Neuroscience, 13, 1410. 10.3389/FNINS.2019.01410/FULL. [DOI] [PMC free article] [PubMed] [Google Scholar]
- Pan Y, Scanlon MJ, Owada Y, Yamamoto Y, Porter CJH, & Nicolazzo JA (2015). Fatty acid-binding protein 5 facilitates the blood–brain barrier transport of docosahexaenoic acid. Molecular Pharmaceutics, 12(12), 4375–4385. 10.1021/acs.molpharmaceut.5b00580. [DOI] [PubMed] [Google Scholar]
- Patella F, Schug ZT, Persi E, Neilson LJ, Erami Z, Avanzato D, … Zanivan S (2015). Proteomics-based metabolic modeling reveals that fatty acid oxidation (FAO) controls endothelial cell (EC) permeability. Molecular & Cellular Proteomics, 14(3), 621–634. 10.1074/mcp.M114.045575. [DOI] [PMC free article] [PubMed] [Google Scholar]
- Pervaiz I, Mehta Y, Sherill K, Patel D, & Al-Ahmad AJ (2023). Ketone bodies supplementation restores the barrier function, induces a metabolic switch, and elicits beta-hydroxybutyrate diffusion across a monolayer of iPSC-derived brain microvascular endothelial cells. Microvascular Research, 150, 104585. 10.1016/j.mvr.2023.104585. [DOI] [PubMed] [Google Scholar]
- Pervaiz I, Zahra FT, Mikelis CM, & Al-Ahmad AJ (2022). An in vitro model of glucose transporter 1 deficiency syndrome at the blood–brain barrier using induced pluripotent stem cells. Journal of Neurochemistry, 162(6), 483–500. 10.1111/jnc.15684. [DOI] [PubMed] [Google Scholar]
- Quek L-E, Krycer JR, Ohno S, Yugi K, Fazakerley DJ, Scalzo R, … Kuroda S (2020). Dynamic 13C flux analysis captures the reorganization of adipocyte glucose metabolism in response to insulin. iScience, 23(2), 100855. 10.1016/j.isci.2020.100855. [DOI] [PMC free article] [PubMed] [Google Scholar]
- Rahim M, Ragavan M, Deja S, Merritt ME, Burgess SC, & Young JD (2022). INCA 2.0: A tool for integrated, dynamic modeling of NMR- and MS-based isotopomer measurements and rigorous metabolic flux analysis. Metabolic Engineering, 69, 275–285. 10.1016/j.ymben.2021.12.009. [DOI] [PMC free article] [PubMed] [Google Scholar]
- Rajagopal N, Irudayanathan FJ, & Nangia S (2019a). Computational nanoscopy of tight junctions at the blood–brain barrier interface. International Journal of Molecular Sciences, 20(22), 5583. 10.3390/ijms20225583. [DOI] [PMC free article] [PubMed] [Google Scholar]
- Rajagopal N, Irudayanathan FJ, & Nangia S (2019b). Palmitoylation of claudin-5 proteins influences their lipid domain affinity and tight junction assembly at the blood-brain barrier interface. Journal of Physical Chemistry B, 123(5), 983–993. 10.1021/acs.jpcb.8b09535. [DOI] [PubMed] [Google Scholar]
- Rasmussen P, Nyberg N, Jaroszewski JW, Krogh-Madsen R, Secher NH, & Quistorff B (2010). Brain nonoxidative carbohydrate consumption is not explained by export of an unknown carbon source: Evaluation of the arterial and jugular venous metabolome. Journal of Cerebral Blood Flow & Metabolism, 30(6), 1240–1246. 10.1038/jcbfm.2010.25. [DOI] [PMC free article] [PubMed] [Google Scholar]
- Raut S, Patel R, & Al-Ahmad AJ (2021). Presence of a mutation in PSEN1 or PSEN2 gene is associated with an impaired brain endothelial cell phenotype in vitro. Fluids and Barriers of the CNS, 18(1), 10.1186/s12987-020-00235-y. [DOI] [PMC free article] [PubMed] [Google Scholar]
- Raut S, Patel R, Pervaiz I, & Al-Ahmad AJ (2022). Abeta peptides disrupt the barrier integrity and glucose metabolism of human induced pluripotent stem cell-derived brain microvascular endothelial cells. Neurotoxicology, 89, 110–120. 10.1016/j.neuro.2022.01.007. [DOI] [PubMed] [Google Scholar]
- Ravindra Kumar S, Miles TF, Chen X, Brown D, Dobreva T, Huang Q, … Gradinaru V (2020). Multiplexed Cre-dependent selection yields systemic AAVs for targeting distinct brain cell types. Nature Methods, 17(5), 541–550. 10.1038/s41592-020-0799-7. [DOI] [PMC free article] [PubMed] [Google Scholar]
- Razmara A, Sunday L, Stirone C, Wang XB, Krause DN, Duckles SP, & Procaccio V (2008). Mitochondrial effects of estrogen are mediated by estrogen receptor α in brain endothelial cells. Journal of Pharmacology and Experimental Therapeutics, 325(3), 782–790. 10.1124/jpet.107.134072. [DOI] [PMC free article] [PubMed] [Google Scholar]
- Razmara E, Azimi H, Tavasoli AR, Fallahi E, Sheida SV, Eidi M, … Garshasbi M (2020). Novel neuroclinical findings of autosomal recessive primary microcephaly 15 in a consanguineous Iranian family. European Journal of Medical Genetics, 63(12), 104096. 10.1016/j.ejmg2020.1040965. [DOI] [PubMed] [Google Scholar]
- Régina A, Morchoisne S, Borson ND, McCall AL, Drewes LR, & Roux F (2001). Factor(s) released by glucose-deprived astrocytes enhance glucose transporter expression and activity in rat brain endothelial cells. Biochimica et Biophysica Acta (BBA)—Molecular Cell Research, 1540(3), 233–242. 10.1016/S0167-4889(01)00133-1. [DOI] [PubMed] [Google Scholar]
- Sakamuri SSVP, Sure VN, Kolli L, Liu N, Evans WR, Sperling JA, … Katakam PVG (2022). Glycolytic and oxidative phosphorylation defects precede the development of senescence in primary human brain microvascular endothelial cells. GeroScience, 44(4), 1975–1994. 10.1007/s11357-022-00550-2. [DOI] [PMC free article] [PubMed] [Google Scholar]
- Sambra V, Echeverria F, Valenzuela A, Chouinard-Watkins R, & Valenzuela R (2021). Docosahexaenoic and arachidonic acids as neuroprotective nutrients throughout the life cycle. Nutrients, 13(3), 1–21. 10.3390/nu13030986. [DOI] [PMC free article] [PubMed] [Google Scholar]
- Sánchez del Pino MM, Peterson DR, & Hawkins RA (1995). Neutral amino acid transport characterization of isolated luminal and abluminal membranes of the blood-brain barrier. Journal of Biological Chemistry, 270(25), 14913–14918. 10.1074/jbc.270.25.14913. [DOI] [PubMed] [Google Scholar]
- Schmitt R, Qayum S, Pliss A, Kuzmin AN, Muthaiah VPK, Kaliyappan K, … Mahajan SD (2023). Mitochondrial dysfunction and apoptosis in brain microvascular endothelial cells following blast traumatic brain injury. Cellular and Molecular Neurobiology, 43(7), 3639–3651. 10.1007/s10571-023-01372-2. [DOI] [PMC free article] [PubMed] [Google Scholar]
- Schoors S, Bruning U, Missiaen R, Queiroz KCS, Borgers G, Elia I, … Carmeliet P (2015). Fatty acid carbon is essential for dNTP synthesis in endothelial cells. Nature, 520(7546), 192–197. 10.1038/nature14362. [DOI] [PMC free article] [PubMed] [Google Scholar]
- Schoors S, De Bock K, Cantelmo AR, Georgiadou M, Ghesquière B, Cauwenberghs S, … Carmeliet P (2014). Partial and transient reduction of glycolysis by PFKFB3 blockade reduces pathological angiogenesis. Cell Metabolism, 19(1), 37–48. 10.1016/j.cmet.2013.11.008. [DOI] [PubMed] [Google Scholar]
- Sharp CD, Hines I, Houghton J, Warren A, Jackson TH, Jawahar A, … Alexander JS (2003). Glutamate causes a loss in human cerebral endothelial barrier integrity through activation of NMDA receptor. American Journal of Physiology-Heart and Circulatory Physiology, 285(6), H2592–H2598. 10.1152/ajpheart.00520.2003. [DOI] [PubMed] [Google Scholar]
- Sheehan JP, Swerdlow RH, Miller SW, Davis RE, Parks JK, Parker WD, & Tuttle JB (1997). Calcium homeostasis and reactive oxygen species production in cells transformed by mitochondria from individuals with sporadic Alzheimer’s disease. The Journal of Neuroscience, 17(12), 4612–4622. 10.1523/JNEUROSCI.17-12-04612.1997. [DOI] [PMC free article] [PubMed] [Google Scholar]
- Sheikh MH, Henson SM, Loiola RA, Mercurio S, Colamatteo A, Maniscalco GT, … Solito E (2020). Immuno-metabolic impact of the multiple sclerosis patients’ sera on endothelial cells of the blood-brain barrier. Journal of Neuroinflammation, 17(1), 10.1186/s12974-020-01810-8. [DOI] [PMC free article] [PubMed] [Google Scholar]
- Sian J, Dexter DT, Lees AJ, Daniel S, Agid Y, Javoy-Agid F, … Marsden D (1994). Alterations in glutathione levels in Parkinson’s disease and other neurodegenerative disorders affecting basal ganglia. Annals of Neurology, 36(3), 348–355. 10.1002/ana.410360305. [DOI] [PubMed] [Google Scholar]
- Small GW, Ercoli LM, Silverman DHS, Huang S-C, Komo S, Bookheimer SY, … Phelps ME (2000). Cerebral metabolic and cognitive decline in persons at genetic risk for Alzheimer’s disease. Proceedings of the National Academy of Sciences, 97(11), 6037–6042. 10.1073/pnas.090106797. [DOI] [PMC free article] [PubMed] [Google Scholar]
- Stoll J, Wadhwani KC, & Smith QR (1993). Identification of the cationic amino acid transporter (system y+) of the rat blood-brain barrier. Journal of Neurochemistry, 60(5), 1956–1959. 10.1111/j.1471-4159.1993.tb13428.x. [DOI] [PubMed] [Google Scholar]
- Stuart CA, Ross IR, Howell MEA, McCurry MP, Wood TG, Ceci JD, … Wall J (2011). Brain glucose transporter (Glut3) haploinsufficiency does not impair mouse brain glucose uptake. Brain Research, 1384, 15–22. 10.1016/j.brainres.2011.02.014. [DOI] [PMC free article] [PubMed] [Google Scholar]
- Sure VN, Sakamuri SSVP, Sperling JA, Evans WR, Merdzo I, Mostany R, … Katakam PVG (2018). A novel high-throughput assay for respiration in isolated brain microvessels reveals impaired mitochondrial function in the aged mice. GeroScience, 40(4), 365–375. 10.1007/s11357-018-0037-8. [DOI] [PMC free article] [PubMed] [Google Scholar]
- Svennerholm L, Boström K, & Jungbjer B (1997). Changes in weight and compositions of major membrane components of human brain during the span of adult human life of Swedes. Acta Neuropathologica, 94(4), 345–352. 10.1007/s004010050717. [DOI] [PubMed] [Google Scholar]
- Tang M, Park SH, Petri S, Yu H, Rueda CB, Dale Abel E, … Monani UR (2021). An early endothelial cell-specific requirement for Glut1 is revealed in Glut1 deficiency syndrome model mice. JCI Insight, 6(3), 10.1172/JCI.INSIGHT.145789. [DOI] [PMC free article] [PubMed] [Google Scholar]
- Tărlungeanu DC, Deliu E, Dotter CP, Kara M, Janiesch PC, Scalise M, … Novarino G (2016). Impaired amino acid transport at the blood brain barrier is a cause of autism spectrum disorder. Cell, 167(6), 1481–1494.e18. 10.1016/j.cell.2016.11.013. [DOI] [PMC free article] [PubMed] [Google Scholar]
- Taslimifar M, Buoso S, Verrey F, & Kurtcuoglu V (2018). Functional polarity of microvascular brain endothelial cells supported by neurovascular unit computational model of large neutral amino acid homeostasis. Frontiers in Physiology, 9. 10.3389/fphys.2018.00171. [DOI] [PMC free article] [PubMed] [Google Scholar]
- Taslimifar M, Faltys M, Kurtcuoglu V, Verrey F, & Makrides V (2022). Analysis of L-leucine amino acid transporter species activity and gene expression by human blood brain barrier hCMEC/D3 model reveal potential LAT1, LAT4, B0AT2 and y+LAT1 functional cooperation. Journal of Cerebral Blood Flow & Metabolism, 42(1), 90–103. 10.1177/0271678X211039593. [DOI] [PMC free article] [PubMed] [Google Scholar]
- Thakore P, Alvarado MG, Ali S, Mughal A, Pires PW, Yamasaki E, … Earley S (2021). Brain endothelial cell TRPA1 channels initiate neurovascular coupling. eLife, 10, e63040. 10.7554/eLife.63040. [DOI] [PMC free article] [PubMed] [Google Scholar]
- Thiele I, Sahoo S, Heinken A, Hertel J, Heirendt L, Aurich MK, & Fleming RM (2020). Personalized whole-body models integrate metabolism, physiology, and the gut microbiome. Molecular Systems Biology, 16(5), 10.15252/msb.20198982. [DOI] [PMC free article] [PubMed] [Google Scholar]
- Tukiainen T, Villani A-C, Yen A, Rivas MA, Marshall JL, Satija R, … MacArthur DG (2017). Landscape of X chromosome inactivation across human tissues. Nature, 550(7675), 244–248. 10.1038/nature24265. [DOI] [PMC free article] [PubMed] [Google Scholar]
- Tumova S, Kerimi A, Porter KE, & Williamson G (2016). Transendothelial glucose transport is not restricted by extracellular hyperglycaemia. Vascular Pharmacology, 87, 219–229. 10.1016/j.vph.2016.11.001. [DOI] [PubMed] [Google Scholar]
- Tyagi A, Mirita C, Shah I, Reddy PH, & Pugazhenthi S (2021). Effects of lipotoxicity in brain microvascular endothelial cells during Sirt3 deficiency-potential role in comorbid Alzheimer’s disease. Frontiers in Aging Neuroscience, 13. 10.3389/fnagi.2021.716616. [DOI] [PMC free article] [PubMed] [Google Scholar]
- Tyrrell DJ, Blin MG, Song J, Wood SC, & Goldstein DR (2020). Aging impairs mitochondrial function and mitophagy and elevates interleukin 6 within the cerebral vasculature. Journal of the American Heart Association, 9, e017820. 10.1161/JAJA.120.017820. [DOI] [PMC free article] [PubMed] [Google Scholar]
- Vandal M, Alata W, Tremblay C, Rioux-Perreault C, Salem N, Calon F, & Plourde M (2014). Reduction in DHA transport to the brain of mice expressing human APOE4 compared to APOE2. Journal of Neurochemistry, 129(3), 516–526. 10.1111/jnc.12640. [DOI] [PubMed] [Google Scholar]
- Vazana U, Veksler R, Pell GS, Prager O, Fassler M, Chassidim Y, … Friedman A (2016). Glutamate-mediated blood–brain barrier opening: Implications for neuroprotection and drug delivery. Journal of Neuroscience, 36(29), 7727–7739. 10.1523/JNEUROSCI.0587-16.2016. [DOI] [PMC free article] [PubMed] [Google Scholar]
- Venkat P, Chopp M, & Chen J (2016). New insights into coupling and uncoupling of cerebral blood flow and metabolism in the brain. Croatian Medical Journal, 57(3), 223–228. 10.3325/cmj.2016.57.223. [DOI] [PMC free article] [PubMed] [Google Scholar]
- Vesga-Jiménez DJ, Martin C, Barreto GE, Aristizábal-Pachón AF, Pinzón A, & González J (2022). Fatty acids: An Insight into the pathogenesis of neurodegenerative diseases and therapeutic potential. International Journal of Molecular Sciences, 23(5), 2577. 10.3390/ijms23052577. [DOI] [PMC free article] [PubMed] [Google Scholar]
- Veys K, Fan Z, Ghobrial M, Bouché A, García-Caballero M, Vriens K, … De Bock K (2020). Role of the GLUT1 glucose transporter in postnatal CNS angiogenesis and blood-brain barrier integrity. Circulation Research, 127(4), 466–482. 10.1161/CIRCRESAHA.119.316463. [DOI] [PMC free article] [PubMed] [Google Scholar]
- Walsh MA, Musci RV, Jacobs RA, & Hamilton KL (2023). A practical perspective on how to develop, implement, execute, and reproduce high-resolution respirometry experiments: The physiologist’s guide to an Oroboros O2k. FASEB, 37(12), e23280. 10.1096/fj.202301644RR. [DOI] [PubMed] [Google Scholar]
- Wanders RJA (2014). Metabolic functions of peroxisomes in health and disease. Biochimie, 98, 36–44. 10.1016/j.biochi.2013.08.022. [DOI] [PubMed] [Google Scholar]
- Wang J, Cui Y, Yu Z, Wang W, Cheng X, Ji W, … Yang X (2019). Brain endothelial cells maintain lactate homeostasis and control adult hippocampal neurogenesis. Cell Stem Cell, 25(6), 754–767.e9. 10.1016/j.stem.2019.09.009. [DOI] [PubMed] [Google Scholar]
- Weber CM, & Clyne AM (2021). Sex differences in the blood–brain barrier and neurodegenerative diseases. APL Bioengineering, 5, 011509. 10.1063/5.0035610. [DOI] [PMC free article] [PubMed] [Google Scholar]
- Weber CM, Moiz B, Zic SM, Alpízar Vargas V, Li A, & Clyne AM (2022). Induced pluripotent stem cell-derived cells model brain microvascular endothelial cell glucose metabolism. Fluids and Barriers of the CNS, 19(1), 98. 10.1186/s12987-022-00395-z. [DOI] [PMC free article] [PubMed] [Google Scholar]
- Westin JE, Lindgren HS, Gardi J, Nyengaard JR, Brundin P, Mohapel P, & Cenci MA (2006). Endothelial proliferation and increased blood–brain barrier permeability in the basal ganglia in a rat model of 3,4-dihydroxyphenyl-l-alanine-induced dyskinesia. The Journal of Neuroscience, 26(37), 9448–9461. 10.1523/JNEUROSCI.0944-06.2006. [DOI] [PMC free article] [PubMed] [Google Scholar]
- Widlansky ME, & Gutterman DD (2011). Regulation of endothelial function by mitochondrial reactive oxygen species. Antioxidants & Redox Signaling, 15(6), 1517–1530. 10.1089/ars.2010.3642. [DOI] [PMC free article] [PubMed] [Google Scholar]
- Winkler EA, Nishida Y, Sagare AP, Rege SV, Bell RD, Perlmutter D, … Zlokovic BV (2015). GLUT1 reductions exacerbate Alzheimer’s disease vasculo-neuronal dysfunction and degeneration. Nature Neuroscience, 18(4), 521–530. 10.1038/nn.3966. [DOI] [PMC free article] [PubMed] [Google Scholar]
- Wittmann G, Szabon J, Mohácsik P, Nouriel SS, Gereben B, Fekete C, & Lechan RM (2015). Parallel regulation of thyroid hormone transporters OATP1c1 and MCT8 during and after endotoxemia at the blood-brain barrier of male rodents. Endocrinology, 156(4), 1552–1564. 10.1210/en.2014-1830. [DOI] [PMC free article] [PubMed] [Google Scholar]
- Wong BH, & Silver DL (2020). Mfsd2a: a physiologically important lysolipid transporter in the brain and eye. Advances in Experimental Medicine and Biology, 1276, 223–234. 10.1007/978-981-6082-8_146. [DOI] [PubMed] [Google Scholar]
- Yan J, Zhang Z, & Shi H (2012). HIF-1 is involved in high glucose-induced paracellular permeability of brain endothelial cells. Cellular and Molecular Life Sciences, 69(1), 115–128. 10.1007/s00018-011-0731-5. [DOI] [PMC free article] [PubMed] [Google Scholar]
- Yanagida O, Kanai Y, Chairoungdua A, Kim DK, Segawa H, Nii T, … Endou H (2001). Human L-type amino acid transporter 1 (LAT1): Characterization of function and expression in tumor cell lines. Biochimica et Biophysica Acta (BBA)—Biomembranes, 1514(2), 291–302. 10.1016/S0005-2736(01)00384-4. [DOI] [PubMed] [Google Scholar]
- Zhang B, Gao Y, Li Q, Sun D, Dong X, Li X, … Zhang J (2020). Effects of brain-derived mitochondria on the function of neuron and vascular endothelial cell after traumatic brain injury. World Neurosurgery, 138, e1–e9. 10.1016/j.wneu.2019.11.172. [DOI] [PubMed] [Google Scholar]
- Zhang T, Li W, Meng G, Wang P, & Liao W (2016). Strategies for transporting nanoparticles across the blood-brain barrier. Biomaterials Science, 4, 219–229. 10.1039/C5BM00383K. [DOI] [PubMed] [Google Scholar]
- Zhao L, Li Z, Vong JSL, Chen X, Lai H-M, Yan LYC, … Ko H (2020). Pharmacologically reversible zonation-dependent endothelial cell transcriptomic changes with neurodegenerative disease associations in the aged brain. Nature Communications, 11(1), 4413. 10.1038/s41467-020-18249-3. [DOI] [PMC free article] [PubMed] [Google Scholar]
- Zheng PP, Romme E, Van Der Spek PJ, Dirven CMF, Willemsen R, & Kros JM (2010). Glut1/SLC2A1 is crucial for the development of the blood-brain barrier in vivo. Annals of Neurology, 68(6), 835–844. 10.1002/ana.22318. [DOI] [PubMed] [Google Scholar]
- Zhou J, Chi X, Cheng M, Huang X, Liu X, Fan J, … Yang W (2019). Zika virus degrades the ω-3 fatty acid transporter Msfd2a in brain microvascular endothelial cells and impairs lipid homeostasis. Science Advances, 5(10), eaax7142. 10.1126/sciadv.aax71424. [DOI] [PMC free article] [PubMed] [Google Scholar]
- Zhu WM, Neuhaus A, Beard DJ, Sutherland BA, & DeLuca GC (2022). Neurovascular coupling mechanisms in health and neurovascular uncoupling in Alzheimer’s disease. Brain, 145(7), 2276–2292. 10.1093/brain/awac174. [DOI] [PMC free article] [PubMed] [Google Scholar]
- Zuccolo E, Kheder DA, Lim D, Perna A, Nezza FD, Botta L, … Moccia F (2019). Glutamate triggers intracellular Ca2+ oscillations and nitric oxide release by inducing NAADP- and InsP 3-dependent Ca2+ release in mouse brain endothelial cells. Journal of Cellular Physiology, 234(4), 3538–3554. 10.1002/jcp.26953. [DOI] [PubMed] [Google Scholar]