

Abstract
Background:
Millions worldwide are exposed to elevated levels of arsenic that significantly increase their risk of developing atherosclerosis, a pathology primarily driven by immune cells. While the impact of arsenic on immune cell populations in atherosclerotic plaques has been broadly characterized, cellular heterogeneity is a substantial barrier to in-depth examinations of the cellular dynamics for varying immune cell populations.
Objectives:
This study aimed to conduct single-cell multi-omics profiling of atherosclerotic plaques in apolipoprotein E knockout (ApoE–/–) mice to elucidate transcriptomic and epigenetic changes in immune cells induced by arsenic exposure.
Methods:
The ApoE–/– mice were fed a high-fat diet and were exposed to either arsenic in drinking water or a tap water control, and single-cell multi-omics profiling was performed on atherosclerotic plaque-resident immune cells. Transcriptomic and epigenetic changes in immune cells were analyzed within the same cell to understand the effects of arsenic exposure.
Results:
Our data revealed that the transcriptional profile of macrophages from arsenic-exposed mice were significantly different from that of control mice and that differences were subtype specific and associated with cell–cell interaction and cell fates. Additionally, our data suggest that differences in arsenic-mediated changes in chromosome accessibility in arsenic-exposed mice were statistically more likely to be due to factors other than random variation compared to their effects on the transcriptome, revealing markers of arsenic exposure and potential targets for intervention.
Discussion:
These findings in mice provide insights into how arsenic exposure impacts immune cell types in atherosclerosis, highlighting the importance of considering cellular heterogeneity in studying such effects. The identification of subtype-specific differences and potential intervention targets underscores the significance of understanding the molecular mechanisms underlying arsenic-induced atherosclerosis. Further research is warranted to validate these findings and explore therapeutic interventions targeting immune cell dysfunction in arsenic-exposed individuals. https://doi.org/10.1289/EHP14285
Introduction
More than 200 million people worldwide are exposed to elevated levels of arsenic, mainly through contaminated food and water.1,2 Mounting epidemiological evidence implicates arsenic toxicity as a modifiable risk factor for atherosclerosis, the etiology of the majority of cardiovascular diseases.3,4 Arsenic has been associated with increases in carotid intima-media thickness and plaque score, a measure of atherosclerotic plaque burden over time, in exposed populations.5,6 Moreover, arsenic exposure is implicated in increased stroke-related hospitalizations and cardiovascular mortalities, both consequences of atherosclerosis.7,8
Atherosclerosis is a chronic inflammatory disease of large arteries characterized by fibrous fatty lesions driven primarily by immune cells.9,10 Broadly, macrophages and dendritic cells in the plaque are known to engulf circulatory lipids, process them, and present the antigens to incoming T and B cells.11,12 T and B cells recognize these antigens and perform their respective effector functions, alongside recruiting more immune cells to the site of the plaque.13 This crosstalk between plaque-resident immune cells determines their activation states, the cocktail of cytokines they secrete, and, consequently, the progression or regression fates of the plaque. While the diversity of these immune cells and their interactions have been appreciated over the past several decades, the efforts to understand it have been limited by using canonical markers based mostly on in vitro or ex vivo approaches.14 Several studies have evaluated the modulatory effects of arsenic on the individual immune cell types known to constitute an atherosclerotic plaque.15 For instance, arsenic exposure increases the retention of cholesterol in macrophages in vitro by dampening the reverse cholesterol transport via liver X receptor (Lxr) inhibition.16 Arsenic can result in an altered cytokine profile and oxidative stress in both macrophages16 and T cells,17 both potential mechanisms of atherogenesis. In vivo, arsenic-enhanced atherosclerosis is modeled in apolipoprotein E knockout (ApoE–/–) mice.18,19 While there is an arsenic-induced increase in plaque size and lipid content in this mouse model, the percentage of macrophages in these plaques remains unaltered as shown in previous studies.18,19 To understand this observation, our lab investigated whether arsenic affects the gene expression of the plaque-resident macrophages using in vitro culture of bone marrow–derived macrophages.20 To this end, we observed that the macrophages polarized with interferon gamma (Ifn-γ) or interleukin 4 (Il-4) responded differently to arsenic exposure.20 However, atherosclerotic plaque is a mesh of different immune cells, and their intercellular interaction makes the plaque microenvironment unique. Therefore, more meaningful insights might be derived from analyzing macrophages resident within the plaque microenvironment.
Single-cell sequencing combines the robustness of next-generation sequencing with the sophistication of microfluidics to isolate individual cells, sequence them, and allow mapping of the transcriptional information to each cell.21,22 This technique, along with computational tools like unbiased dimensionality reduction and clustering algorithms, has fueled the discovery of previously unknown cell subsets at a much higher resolution.21 With the advent of single-cell studies, novel plaque-resident immune cell phenotypes have surfaced and are representative of the consortium of heterogeneous cell populations forming the atherosclerotic plaque.21,23 The ApoE–/– and low-density lipoprotein receptor knockout (Ldlr–/–) mice are widely used models of atherosclerosis, and single-cell sequencing of the plaques from these mice has resolved the diverse immune cell subsets present in its niche.23,24 For instance, numerous studies25,26 have assigned lesional macrophages to “resident-like,” “inflammatory,” “foamy,” and “Trem2hi-like” clusters based on their differential gene expression patterns. Importantly, this classification is more elaborate than the classically and alternatively activated M1 and M2 macrophage subtypes and lies along a spectrum of activation states.27 Additionally, three T cell subsets ( cytotoxic T cells, mixed T cells, and T cells), three dendritic cell subsets (monocyte-derived, plasmacytoid, and mature dendritic cells), and two B cells subsets (B1 and B2 type B cells) also have been identified in the atherosclerotic plaques of these mice, which is the same with previous studies.23,25
Leveraging high resolution single-cell technologies to bypass the limitations of bulk analyses, this study delves into the impacts of arsenic exposure on immune cell populations in the atherosclerotic plaque of ApoE–/– mice. Although single-cell RNA sequencing (scRNA-seq) offers detailed insights into cellular dynamics post arsenic exposure, its unimodal nature, focusing on gene expression, falls short of capturing the full complexity of cellular states, highlighting the essential role of single-cell multi-omics in achieving a deeper understanding of these dynamics. To address these limitations, our study integrated scRNA-seq with multi-omics [scRNA-seq and single-cell sequencing assay for transposase-accessible chromatin (scATAC-seq) from the same cell] approaches to more thoroughly investigate arsenic’s impact on immune cell responses and regulatory networks within plaques. scATAC-seq, as a technique for assessing DNA accessibility genome-wide, is considered an “omic” approach and, here, is combined with scRNA-seq (transcriptomics) contributing to the multi-omics nature of our study.28,29 Thus, we get a more comprehensive picture linking chromatin accessibility with mRNA levels within a single cell to highlight changes induced by arsenic within the atherosclerotic plaque.
Methods
Animal Housing and Exposure
All mice used were approved by the McGill Animal Care and Use Committee. Apolipoprotein E knockout C57BL/6 (Jackson Laboratory) mice were bred in the Lady Davis Institute Animal Facility or purchased directly from Jackson. Male mice, from multiple litters, were started on a purified high-fat diet (Teklad Custom diet TD.10,825: 2016 CB (choline bitartrate) Chol; ENVIGO) at weaning and were randomly assigned to either sodium arsenic (Sigma-Aldrich; purity) in the drinking water or control tap water at 5 wk of age and exposed for 13 wk. Mice were housed 4–5 mice per cage with the same exposure in a 12-hour light/dark cycle and given food and water ad libitum. Average temperature in the animal quarters was with 60% humidity. Solutions containing arsenic were refreshed every 2–3 d to minimize oxidation. We chose these parameters because they are a time and dose where we have previously shown arsenic-induced changes in plaque.18,19 The high-fat diet was used to further promote the development of atherosclerosis such that the starting material for scRNA-seq would be sufficient. The same experimental design was used for both scRNA-seq and single-cell multi-omics technology (scMultiome); however, four mice per group were used for the scRNA-seq, while eight mice per group were used for the scMultiome. For bone marrow–derived macrophages, wild-type C57BL/6 male mice between the ages of 8 and 10 wk were used. They were bred as mentioned above.
Plaque Cell Isolation
After 13-wk of exposure (i.e., at 18-wk of age), mice were injected with a BB515-conjugated anti-CD45 antibody (BD Horizon; catalog number 5644590, rat anti-mouse; dilution 1:20) via tail vein, and antibodies were allowed to stain circulating leukocytes for 10 min. Mice were euthanized using carbon dioxide () asphyxiation within the following 10 min. Aortas were perfused (intracardiac) with ice-cold phosphate-buffered saline (PBS). The aortic arch was carefully separated from the perivascular adipose tissue along with the brachiocephalic artery and the carotids, opened, and plaque was isolated. Next, the heart was dissected to isolate the plaque from the root of the aortic sinus. Both control and treated samples ( per exposure) were obtained by pooling the plaques from four mice each for scRNA sequencing, and no animals were excluded in this process. The isolated plaques were digested using a cocktail of enzymes ( liberase, collagenase, and hyaluronidase) at for an hour, then passed through a cell strainer to obtain single-cell suspensions. The cells were then blocked for 30 min at with anti-mouse CD16/CD32 (BD Biosciences; catalog number 553141; dilution 1:25) to block nonspecific binding of antibodies to Fc receptors, then stained for cells, but with an antibody conjugated with BV785 (Biolegend; catalog number 103149, rat anti-mouse; dilution 1:100) for 30 min at in the dark to distinguish plaque-resident leukocytes from those found in the blood. Lastly, 4′,6-diamidino-2-phenylindole (DAPI) was added to exclude dead cells. These plaque-resident live cells were sorted on a FACS (FACS Aria Fusion; BD Biosciences) sorter using a nozzle and sent to the Genome Quebec Centre for single-cell RNA sequencing. For scMultiome sequencing, the same isolation protocol as above was used and the isolate was sent to Genome Quebec Centre for sequencing.
Library Preparation and Sequencing to Obtain Original Sequencing Data
Cell counts and viability were determined by trypan blue exclusion. Subsequent library construction employed the Chromium Next GEM Single Cell 3 kit version 3.1 (10× Genomics), following the manufacturer’s recommended protocol, with a targeted cell recovery set at 2,000 cells. We utilized adapters and PCR primers sourced from 10× Genomics. Library quantification was conducted using the Kapa Illumina GA with Revised Primers-SYBR Fast Universal kit (Kapa Biosystems). The fragment average size was determined using the LabChip GXII instrument (PerkinElmer). Libraries were normalized and pooled, followed by denaturation in 0.05 N NaOH and neutralization using the HT1 buffer. The resulting library pool was loaded onto an Illumina NovaSeq SP Lane at a concentration of 225 pM, employing the Xp protocol as outlined by the manufacturer. The sequencing run was executed for cycles in paired-end mode. A PhiX library was incorporated as a control and mixed with the libraries at a 1% level. Base calling was carried out with RTA version 3.4.4, after which the bcl2fastq2 version 2.20 software was used to demultiplex samples and produce FASTQ reads.
For single-cell multiome sequencing, single-cell suspensions were washed and resuspended in PBS with 0.04% bovine serum albumin (BSA). An aliquot of cells was used for LIVE/DEAD viability testing (Thermo Fisher Scientific). Cells were lysed in lysis buffer ( TRIS-HCl, NaCl, , 0.1% Tween-20, 0.1% NP-40, 0.01% digitonin, 1% BSA, Dithiothreitol (DTT), RNAse inhibitor) and nuclei isolated according to Nuclei Isolation for Single Cell Multiome ATAC + Gene Expression Sequencing protocol from 10× Genomics (CG000365, Rev C). Afterward, nuclei were imaged and quantified with DRAQ5 dye (Thermo Fisher Scientific). Single-nuclei libraries were generated using the 10× Genomics Chromium Controller instrument and Chromium Next GEM Single Cell Multiome ATAC + Gene Expression kit (10× Genomics) according to the manufacturer’s protocol (CG000338, Rev E).
The sequencing-ready libraries were cleaned with SPRIselect Reagent kit (Beckman Coulter), quality controlled for size distribution and yield (LabChip GX Perkin Elmer), and quantified using quantitative real-time polymerase chain reaction (qPCR) (KAPA Biosystems Library Quantification kit for Illumina platforms).
Libraries were loaded on independent lanes in an Illumina NovaSeq SP flow cell and sequenced using the following parameters: Read1, Index1 (i7), Index2 (i5), and Read2. These cycles were chosen to accommodate both the gene expression library that requires at least 28-10-10-100 and the ATAC library, which requires at least 50-8-24-50.
The run demultiplexing was performed using bcl2fastq using a sample sheet. The gene expression lane was demultiplexed using 10-10 index cycles masking the extra bases for Index2. The ATAC lane was demultiplexed with in single index mode masking the extra bases and exporting the Index2 as a read containing the ATAC cell barcode. The demultiplexed read files were then processed using “cellranger-arc count” (10× Genomics), which performs the cell barcode and UMI correction, alignment, gene counting, and peak calling. Gene-barcode and peak-barcode matrices are then output for downstream analysis. 10× multiome sequencing allows for a comprehensive examination of transcriptome and epigenome from the same cell from within the immune cell populations in plaques.
Single-Cell Data Preprocessing to Obtain Normalized and Dimension Reduced Single-Cell Data
We processed our single-cell RNA-seq data using the Cell Ranger toolset (version 6.1.2), which involved demultiplexing raw base call (BCL) files from Illumina sequencers into FASTQ files and concatenating FASTQ files from the same library into a single file. The Cell Ranger toolset also handled read processing, including alignment to the mouse reference genome (mm10), filtering, barcode counting, and unique molecular identifier (UMI) tallying, to generate a comprehensive raw cell-by-gene expression matrix essential for downstream analyses.
The Scanpy library (version 1.8.2)30 was employed for quality control measures in our single-cell data analysis. Cells that expressed fewer than 200 or more than 2,500 genes, or those with more than 10% mitochondrial reads, were deemed of subpar quality and subsequently excluded from further analyses.
The cell-by-gene expression matrix, post-filtering, was normalized to adjust for library size differences using the Scanpy library (version 1.8.2)30 followed by a log transformation. Thereafter, the normalized expression matrix was subjected to a principal component analysis (PCA) to achieve linear dimension reduction. We initiated our exploratory analysis by selecting the leading 50 principal components. Following the selection of these principal components, we constructed a network of nearest neighbor cells using Euclidean distances within the multidimensional principal component space, setting neighbors for each cell. Finally, we applied the uniform manifold approximation and projection (UMAP) method31 for further dimension reduction, producing a two-dimensional (2D) representation.
Cell Population Identification and Cell Enrichment Analysis to Obtain Cell Distribution Status
The cell-by-gene expression matrix was clustered (by cells) to obtain the cell clusters (cell populations) using the Leiden32 method implemented in Scanpy.30 The Leiden algorithm is a method used for partitioning cells into distinct groups based on similarities in gene expression profiles. For each obtained cell cluster, the top expressed genes (potential signature genes) associated with the cluster were identified, and the cell type information was annotated using the Cellar tool33 that was previously developed with public databases such as CellMarker34 and GSEA35 to infer the cell identities. We then analyzed the percentage of arsenic-exposed cells in each cluster and conducted a hypergeometric test to determine whether the cluster was enriched with arsenic-exposed cells or control cells.
Differential Expression between Clusters to Obtain Differential Genes
Leveraging Scanpy (version 1.8.2),30 -tests were performed between specific clusters, leading to two comparisons: cluster 4 vs. cluster 10 and cluster 3 vs. cluster 2. In these assessments, genes exhibiting a log2 fold change either or , with a -value of , were classified as significant. They were processed with a rank hypergeometric overlap analysis36 on the gene lists derived from these two comparisons using the R package RRHO (version 1.40.0). Volcano plots were then generated via a free online data analysis website Cloudtutools (http://www.cloudtutu.com). Subsequently, pathway analyses were conducted using KEGG37 enrichment categories in Webgestalt.38 Pathways displaying a false discovery rate of were deemed significant.39
Cellular Trajectory Inference to Obtain the Trajectory Relations between Clusters
In our study, Velocyto (version 1.0)40 within the R (version 4.1.2) platform was utilized to probe the dynamic landscape of single-cell RNA sequencing data. This step was executed by applying the Binary Alignment Map (BAM) files from our samples and referring them to the mm10 mouse GTF file to create loom files. To integrate these loom files, we used the loompy (version 3.0.7) package in Python (version 3.7). Subsequently, scVelo (version 0.2.4) was employed to preprocess individual cells and calculate their momentum. In this study, we utilized RNA velocity to infer the dynamics of cellular state changes among the cell types or clusters of interest. To enhance our understanding of cellular trajectories, we supplemented the RNA velocity-based analysis with PAGA. To synthesize our findings, we integrated the insights from both RNA velocity and PAGA analyses using the scdiff2 method.41
Cell–Cell Interaction Analysis to Obtain the Cell Communications between Clusters
To elucidate ligand–receptor interactions and cell–cell communication within our scRNA-seq datasets, we employed CellChat (version 1.0.0)42 in conjunction with R (version 4.1.2). We began by consulting the Celldb.mouse ligand–receptor database to inform our analysis. Utilizing this database, we calculated communication probabilities and inferred cellular communication networks between cells using CellChat.42 Following the calculation of communication probabilities, we aggregated cell–cell communication networks across different clusters. For the visual representation of these complex interactions, CellChat42 was used to generate circular plots and heatmaps.
Inference of Gene Regulatory Network That Dictate the Cellular Trajectories (Transcription Factors) to Putative TFs
In our study, the gene regulatory network was inferred through a multifaceted approach. We leveraged various sources of information, ensuring our findings were well-supported and robust. Initially, the scdiff241 method was utilized. Alongside these differential genes, the transcription factors (TFs) that modulate their expression could also be determined. This application of scdiff2 provided a foundational understanding of the changes between these cell types. Subsequently, scdiff2 was expanded to the single-cell RNA-seq data from single-cell multi-omics technology [scRNA-seq (m)] data derived from multiome measurements to identify a set of key transcription factors from another independent perspective, adding an additional layer of verification to our findings.
To further hone our list of key transcription factors driving the shifts of resident macrophage cells, epigenomics were also analyzed. Transcription factors whose binding sites were enriched in the peaks detected by scATAC-seq with Homer243 were sought. This approach inferred crucial transcription factors from an epigenomic standpoint, which considered the influence of chromatin accessibility on gene regulation. Finally, the transcription factors identified from the various analyses mentioned above were integrated to determine a list of overlapping transcription factors. scATAC-seq is consistent with common practices in the field to infer functional relevance, as shown in previous studies.28,29
Receptor-TF Signaling Network to Obtain the Relations between Receptors and TFs
To elucidate the signaling network underlying expression differences between control and arsenic-enriched resident macrophages, we utilized the SDREM tool (version 1.2.0).44 Our objective was to map pathways from key cell receptors to transcription factors, integrating signal transduction with differential expression analysis. This approach began with defining source nodes (the receptors) and target nodes (the transcription factors explaining expression differences). The source receptors in our study were inferred from the cell–cell interactions analysis, while the target nodes (transcription factors) were identified based on the differential genes. SDREM44 efficiently constructed and refined the signaling network that connects receptors and differential genes, first by generating an initial network from known protein–protein interactions and then by identifying the most probable signal transduction paths that account for the observed gene expression patterns.
Following these steps, a well-defined signaling network providing an integrated view of the regulatory landscape was obtained. To enhance interpretability, Cytoscape (version 3.9.1),45 a popular bioinformatics software package, was used for visualizing molecular interaction networks. In the network, upstream receptors, depicted in blue, are considered the source nodes. The end target transcription factors responsible for the observed gene expression alterations are termed the network’s target nodes and are shown in green. Other proteins and transcription factors, which act as intermediaries in the signaling, are colored in orange. The color-coding facilitated the effective illustration of the signaling network, offering a tangible representation of the complex regulatory interconnections at play.
Alignment of the scRNA-Seq Dataset and the scRNA-Seq (m) to Obtain the Relationship between the scRNA-Seq Dataset and the scRNA-Seq (m)
In order to align two distinct scRNA-seq datasets, an initial data preprocessing step was performed as outlined above. Following this, the Scanpy function (version 1.8.2)30 “rank_genes_groups” was utilized to obtain the top 100 differentially expressed genes. These genes were then leveraged to evaluate the correspondence between clusters in the scRNA-seq dataset and those in the scRNA-seq (m) dataset. To quantitatively test the correlation between each pair of clusters across these two datasets, the SuperExactTest tool (https://network.shinyapps.io/superexacttest/)46 was used to identify the most highly correlated cluster pairs across the two datasets, which were subsequently aligned.
Single-Cell Multi-Omics ATAC Data Sequencing Analysis Workflow to Obtain the Preprocessed scATAC-Seq Data
The approach to infer regulatory networks from scATAC-seq data began with obtaining the samples, as described in the previous section. The data was preprocessed using cisTopic (version 2.1.0),47 which summarized peak data into a manageable number of topics. Here, “topics” represent clusters of genomic regions with similar patterns of accessibility and biologically signify distinct regulatory programs. By analyzing these topics, researchers can uncover insights into cell heterogeneity, differentiation processes, and regulatory dynamics.48,49
To correct for batch effects and achieve data integration, Scanorama (version 1.7.2)50 was utilized. UMAP for dimensionality reduction followed by the Leiden algorithm32 for cell clustering were then applied to the data. The cluster labels from scRNA-seq (m) data were transferred to scATAC-seq data with Scanpy (version 1.8.2).30
To visualize the distributions of cell topics within each cluster, cisTopic (version 2.1.0)47 was employed. We transformed the most predominant topic in a cluster into a list of genes using PAVIS2 (https://manticore.niehs.nih.gov/pavis2/)51 based on the peaks found within the topic. This gene list facilitated various downstream analyses. For example, pathway analysis was conducted for clusters 5 and 6 [with labels transferred from scRNA-seq (m)] using the ToppGene toolset.52 Additionally, transcription factor enrichment analysis for the scATAC-seq data, as previously discussed, utilized these derived genes.
Transcriptome and Epigenome Visualization to Visualize the Transcript
In our study, genomic data derived from our multi-omics datasets was visualized with a series of bioinformatics tools. Initially, the Binary Alignment Map (BAM) files from our multi-omics datasets were processed. For this, we employed the split function provided by Bamtools (version 2.5.1)53 to divide the BAM files into manageable segments. Following this, the bamCoverage function in Deeptools (version 1.5.12)54 was employed to normalize the BAM files and convert them into BigWig format, a binary format designed for dense, continuous data and preferred for its ease of visualization. Lastly, the Integrative Genomics Viewer (https://igv.org/),55 a high-performance genomics data visualization tool, was utilized to visualize the converted BigWig files. The mouse genome (mm10) was used as the reference during the visualization process.
Generating Bone Marrow–Derived Macrophages to Obtain the M1 and M2 Datasets
A bulk RNA-seq dataset comparing control and arsenic-treated, bone marrow–derived, proinflammatory (M1) or pro-resolving (M2) macrophage was previously described and published.20 Briefly, bone marrow cells from the femur and tibia of 8- to 10-wk-old male C57BL/6 mice were cultured in RPMI-1640 media (Wisent), supplemented with 10% fetal bovine serum (FBS) (Corning), 0.5% penicillin/streptomycin (Wisent), and 50 ng/ml recombinant murine macrophage colony-stimulating factor (M-CSF) (Peprotech). After 5 d, macrophages were polarized using either 50 ng/ml recombinant murine (Peprotech) or 10 ng/ml recombinant murine Il-4 (Peprotech) to polarize toward proinflammatory or pro-resolving macrophages, respectively. Cells were treated with () sodium arsenite (Sigma-Aldrich) or vehicle [filtered double-distilled water ()] during the 48 h of polarization.
Human Data Correlation to Obtain the Relationship between Arsenic Human and Murine Datasets
In an effort to validate our findings in human samples, a human single-cell dataset56 was employed for comparative analysis. The human data were preprocessed with the pipeline described above, ensuring compatibility and comparability with our mouse datasets. Dimensionality reduction via UMAP and the identification of differentially expressed genes were performed using Scanpy (version 1.8.2).30 These steps gave an overview of the human cellular landscape and identified genes driving differences between cell populations. Next, the SuperExactTest tool (https://network.shinyapps.io/superexacttest/)46 was employed to perform a hypergeometric test, examining the correlation between each pair of clusters in the human and mouse datasets. NCBI HomoloGene database (https://www.ncbi.nlm.nih.gov/homologene)57 was utilized to accurately align human and mouse gene identifiers. The lack of overlap can be attributed to the absence of scATAC-seq data in the human dataset and the poor correlation between human and mouse scRNA-seq data. This discrepancy limits our ability to directly compare and integrate findings. Our analysis has focused primarily on scRNA-seq data’s differential genes due to these limitations, which can indicate the potential to transfer our analysis to humans.
Results
scRNA-Seq to Delineate Immune Cell Populations in an Atherosclerotic Plaque of ApoE–/– Mice Exposed to Arsenic and Fed a High-Fat Diet
To test the hypothesis that arsenic may impact macrophage phenotype rather than quantity,19 we utilized scRNA-seq to examine the diversity of plaque-resident immune cells in ApoE–/– mice comparing control and arsenic-treatment. To do so, 5-wk-old male ApoE–/– mice were fed a high-fat diet and maintained on either tap water or arsenic-containing water for 13 wk. Female ApoE–/– mice have not been evaluated for arsenic-induced atherosclerosis, so we have focused this study on males. Atherosclerotic plaques were enzymatically digested, and live plaque-resident cells were isolated using FACS and used for scRNA-seq (Figures 1A; Figure S1). Post quality control, 1,211 cells from control mice and 1,392 cells from arsenic-exposed mice were analyzed. With our scRNA-seq data analysis, we identified 19 distinct cell clusters based on 16,636 gene expression patterns (Figures 1B; Excel Table S1). Monocyte/macrophage, dendritic cells, and T cells constituted the majority of cells. Macrophages, the most abundant cell type, constituted 62.7% of the total cells. Clusters with high expression of Cd3e, indicative of T cells/NKT cells, accounted for 10.3% of the dataset. B cells and dendritic cells made up 0.6% and 9.2% of total cells, respectively. Among the dendritic cells, cluster 7, the largest group, displayed high expression of Cd209, Ifitm1, Ifi30, and Klrd1, suggesting monocyte-derived or classical dendritic cells. Cluster 14, marked by high Ccr7 and Fscn1 expression, pointed toward mature dendritic cells, while cluster 15, expressing high levels of Ifi205, Dnase1l3, and Siglech, was associated with plasmacytoid dendritic cells.
Figure 1.
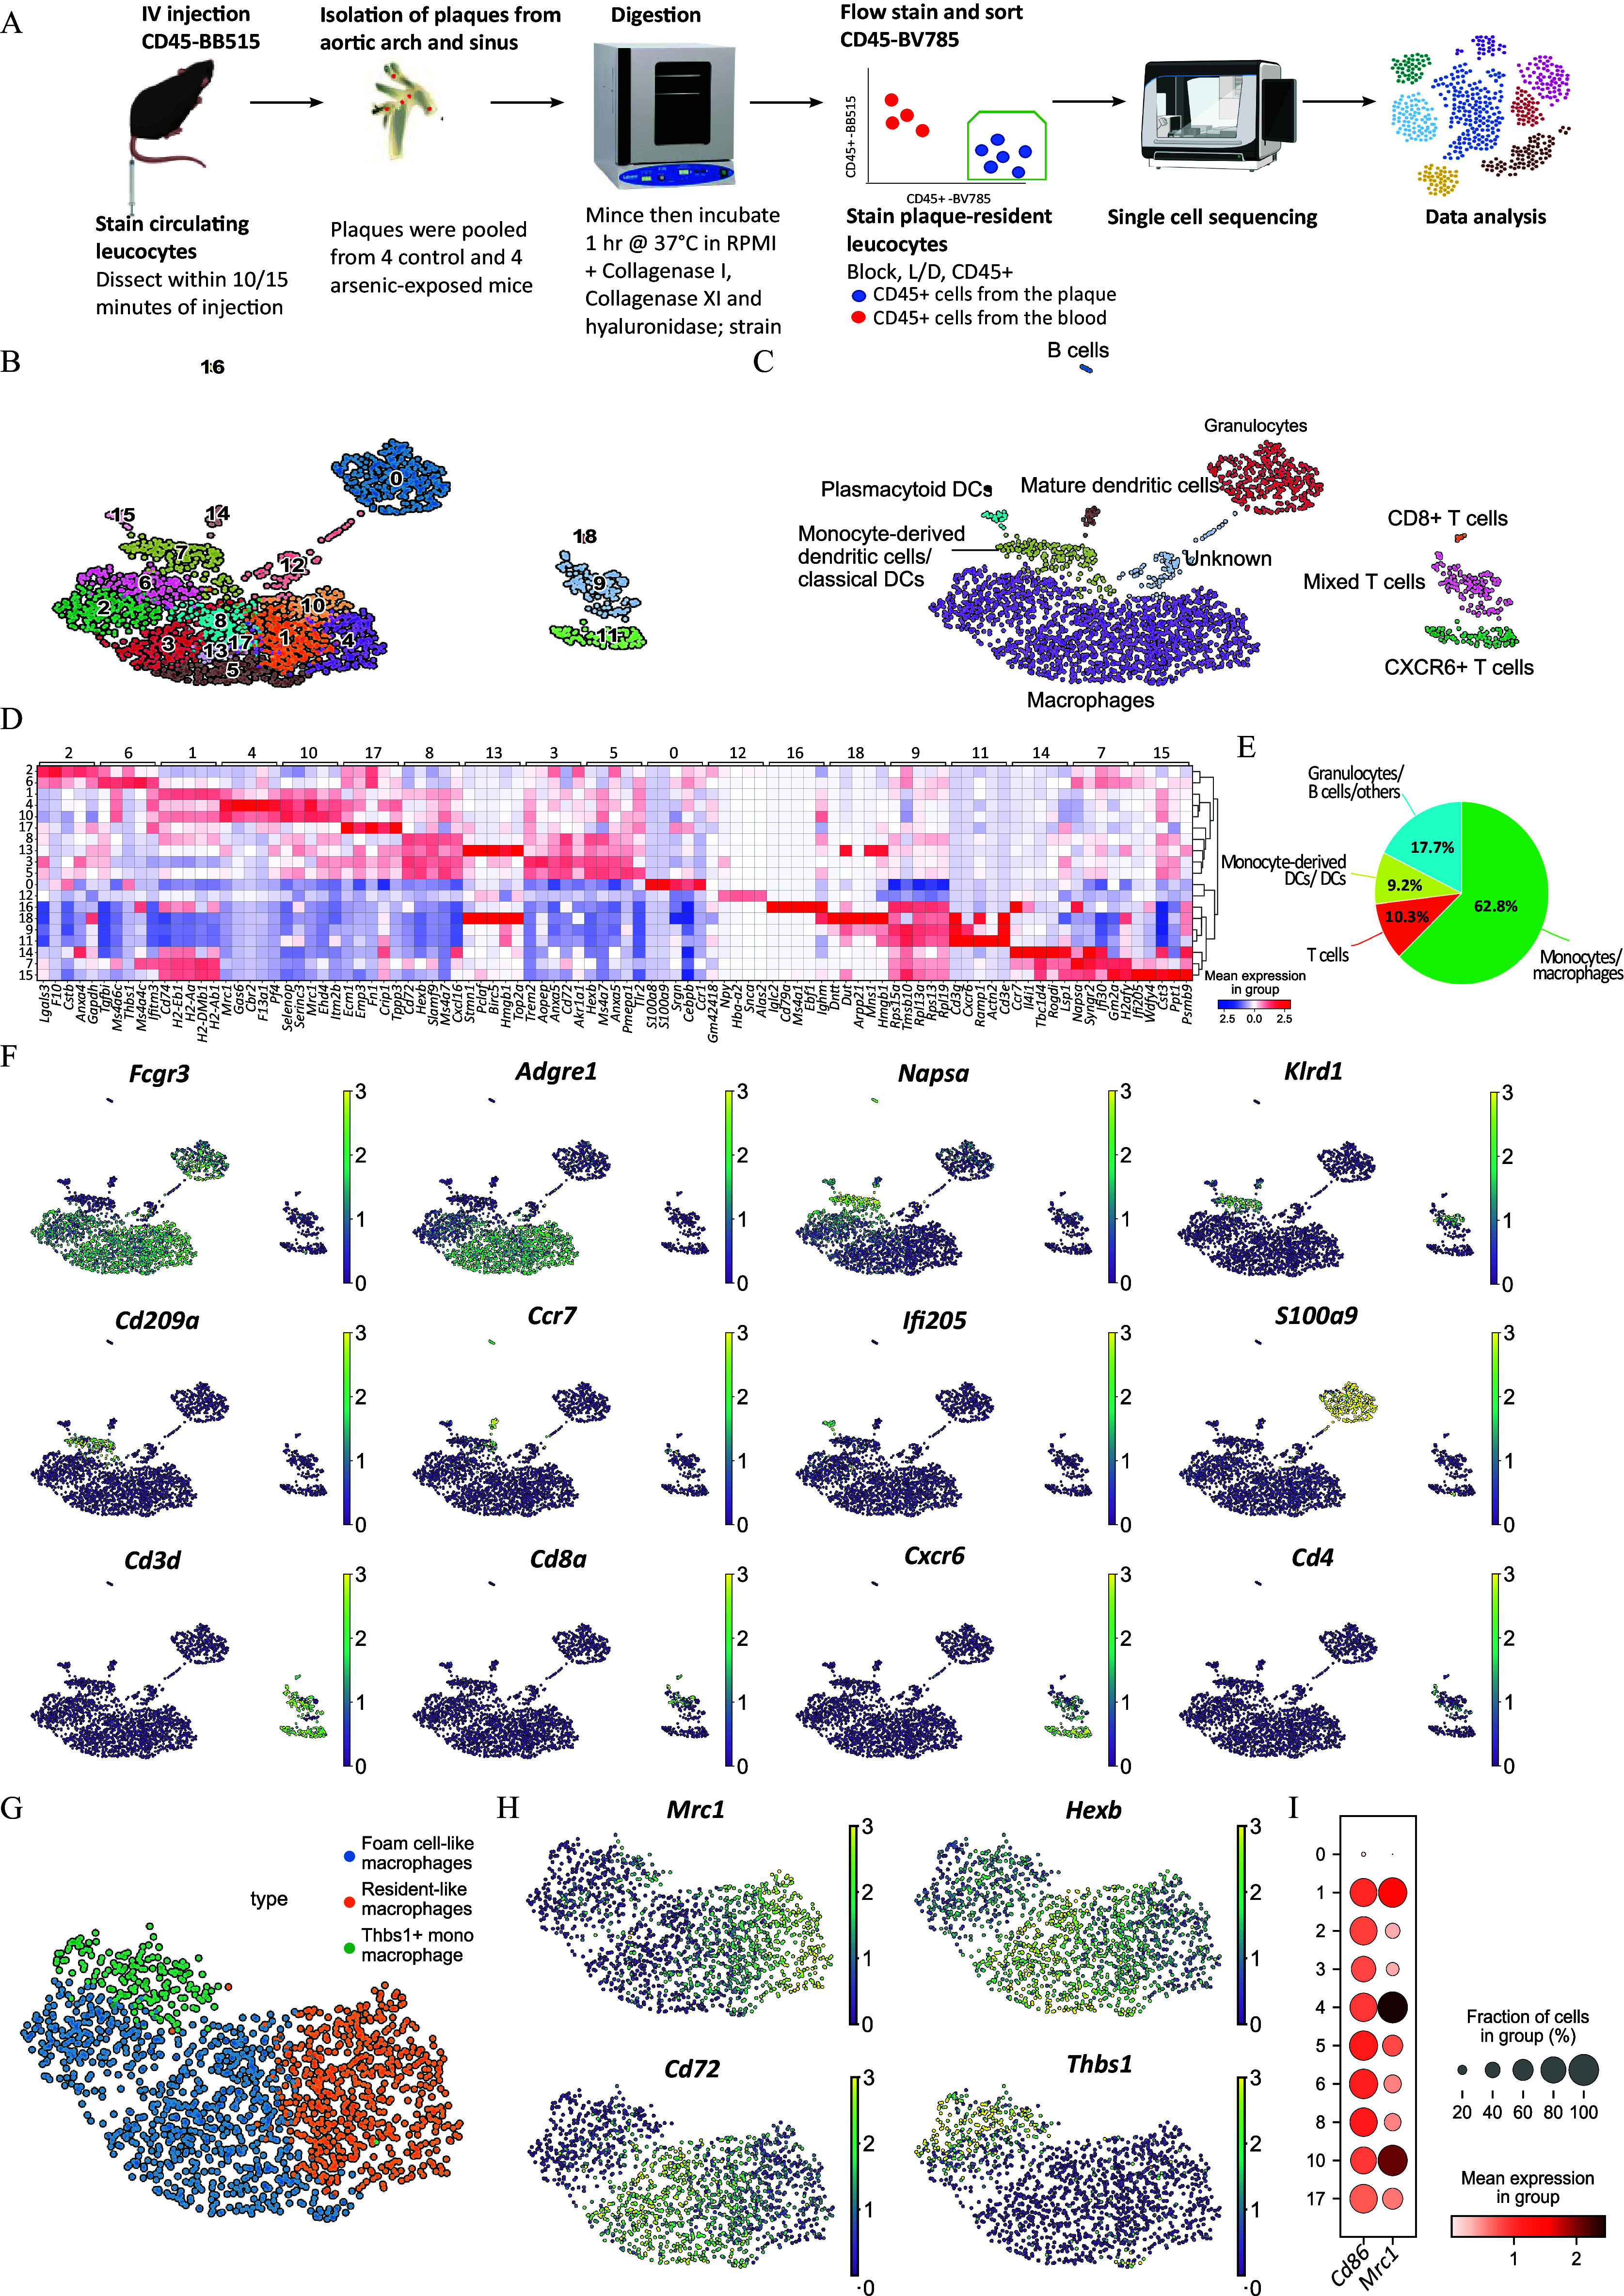
Characterization of immune cell populations in an atherosclerotic plaque. Schematic of the experimental design (A). Uniform manifold approximation and projection (UMAP) of the gene expression data in single cells extracted from atherosclerotic plaques of control and arsenic-exposed apolipoprotein E knockout (ApoE–/–) mice segregated into 19 clusters using unsupervised clustering (B) and annotated for the immune cell types (C). Heatmap showing the five most upregulated genes in each cluster defined in panel B, compared with other clusters. The shade of the color in the units indicates the normalized and scaled expression of genes in the corresponding cluster. The data was normalized and the left and top legend all indicated the cluster number in panel B (D). Relative abundance of the different immune cell types in the integrated dataset supported by Excel Table S1 (E). Normalized and scaled gene expression of Fcgr3, Agre1, Napsa, Klrd1, Cd209a, Ccr7, Ifi205, S100a8, Cd3d, Cd8a, Cxcr6, and Cd4 represent the cell types identified in panel C. The color represents the expression of genes in the dataset and the bright color of certain cells indicate the high expression of the gene. The number in the legend 0–3 indicates the normalized and scaled gene expression relative to rest of the genes (F). Macrophage subtypes present in the integrated dataset represented by gene expression data of all cells (G), as well as gene expression patterns of Mrc1, Hexb, Cd72, and Thbs1 on a UMAP. The details of this graph were the same as panel F (H). Evaluating Cd86 and Mrc1 gene expression, respectively (I). Note: DC, dendritic cell; IV, intravenous.
Due to their prevalence and diversity, we further delineated macrophage subtypes (Figures 1C–F; Excel Table S2). Based on previous scRNA-seq datasets, at least three different types of macrophages (foam-like macrophages, resident-like macrophages, and inflammatory macrophages) exist within murine plaques.23 Resident macrophages, found in clusters 1, 4, and 10, expressed higher levels of F13a1, Lyve1, and Mrc1. Clusters 2, 3, 5, 8, 13, and 17 highly expressed classical markers of foam-like macrophages (Figure 1G,H). Intriguingly, macrophage cluster 6 highly expressed Thbs1 and did not align with the known macrophage subtypes, and thus were labeled Thbs1+ macrophages. However, this cluster seemed to be a mix of monocytes and macrophages23,25 (Excel Table S2). Notably, none of the macrophage clusters could be classified as pro-inflammatory (M1; marked by Cd86 expression) or pro-resolving (M2; marked by Mrc1 expression),27 in line with other single-cell studies in mice23,25,58 (Figure 1I).
Relative Composition of Macrophages in Plaque-Resident Immune Cells of Control or Arsenic-Exposed apoE–/– Mice Fed a High-Fat Diet
We next segregated data and annotated cells based on treatment group, control vs. arsenic-exposed, in order to identify arsenic-induced alterations in the abundance of plaque-resident immune cells and their subtypes after normalization for total cell count (Figure 2A). The subsequent analysis was aimed at identifying any significant alterations in the abundance of plaque-resident immune cells and their subtypes within the plaques of arsenic-exposed mice, normalized for total cell count. Remarkably, the overall proportion of macrophages, T cells, and dendritic cells, among other immune cell populations within the plaques of control vs. the arsenic-exposed group were not significantly different (Figure 2B). However, there were notable differences between clusters that were enriched in either control or arsenic-exposed mice. Specifically, clusters 0, 2, 5, 6, and 10, henceforth termed as control-enriched clusters (CECs), were significantly enriched in cells from control samples, while clusters 1, 3, 4, 8, 12, 13, and 17, henceforth referred to as arsenic-enriched clusters (AECs), were enriched in cells from arsenic-exposed mice () (Figure 2C; Excel Table S3). Notably, nearly all of the differentially enriched clusters were of monocyte/macrophage origin, with no significant enrichment observed in dendritic cell, T cell, or B cell clusters. Upon aggregating the macrophage cells from both conditions, we discovered significantly more resident-like macrophages in arsenic-treated samples (control: 221 and arsenic-treated: 370; ). In contrast, the differences between treatment groups in foam cell–like macrophages were not statistically significant (control: 399 and arsenic-treated: 462; ).
Figure 2.
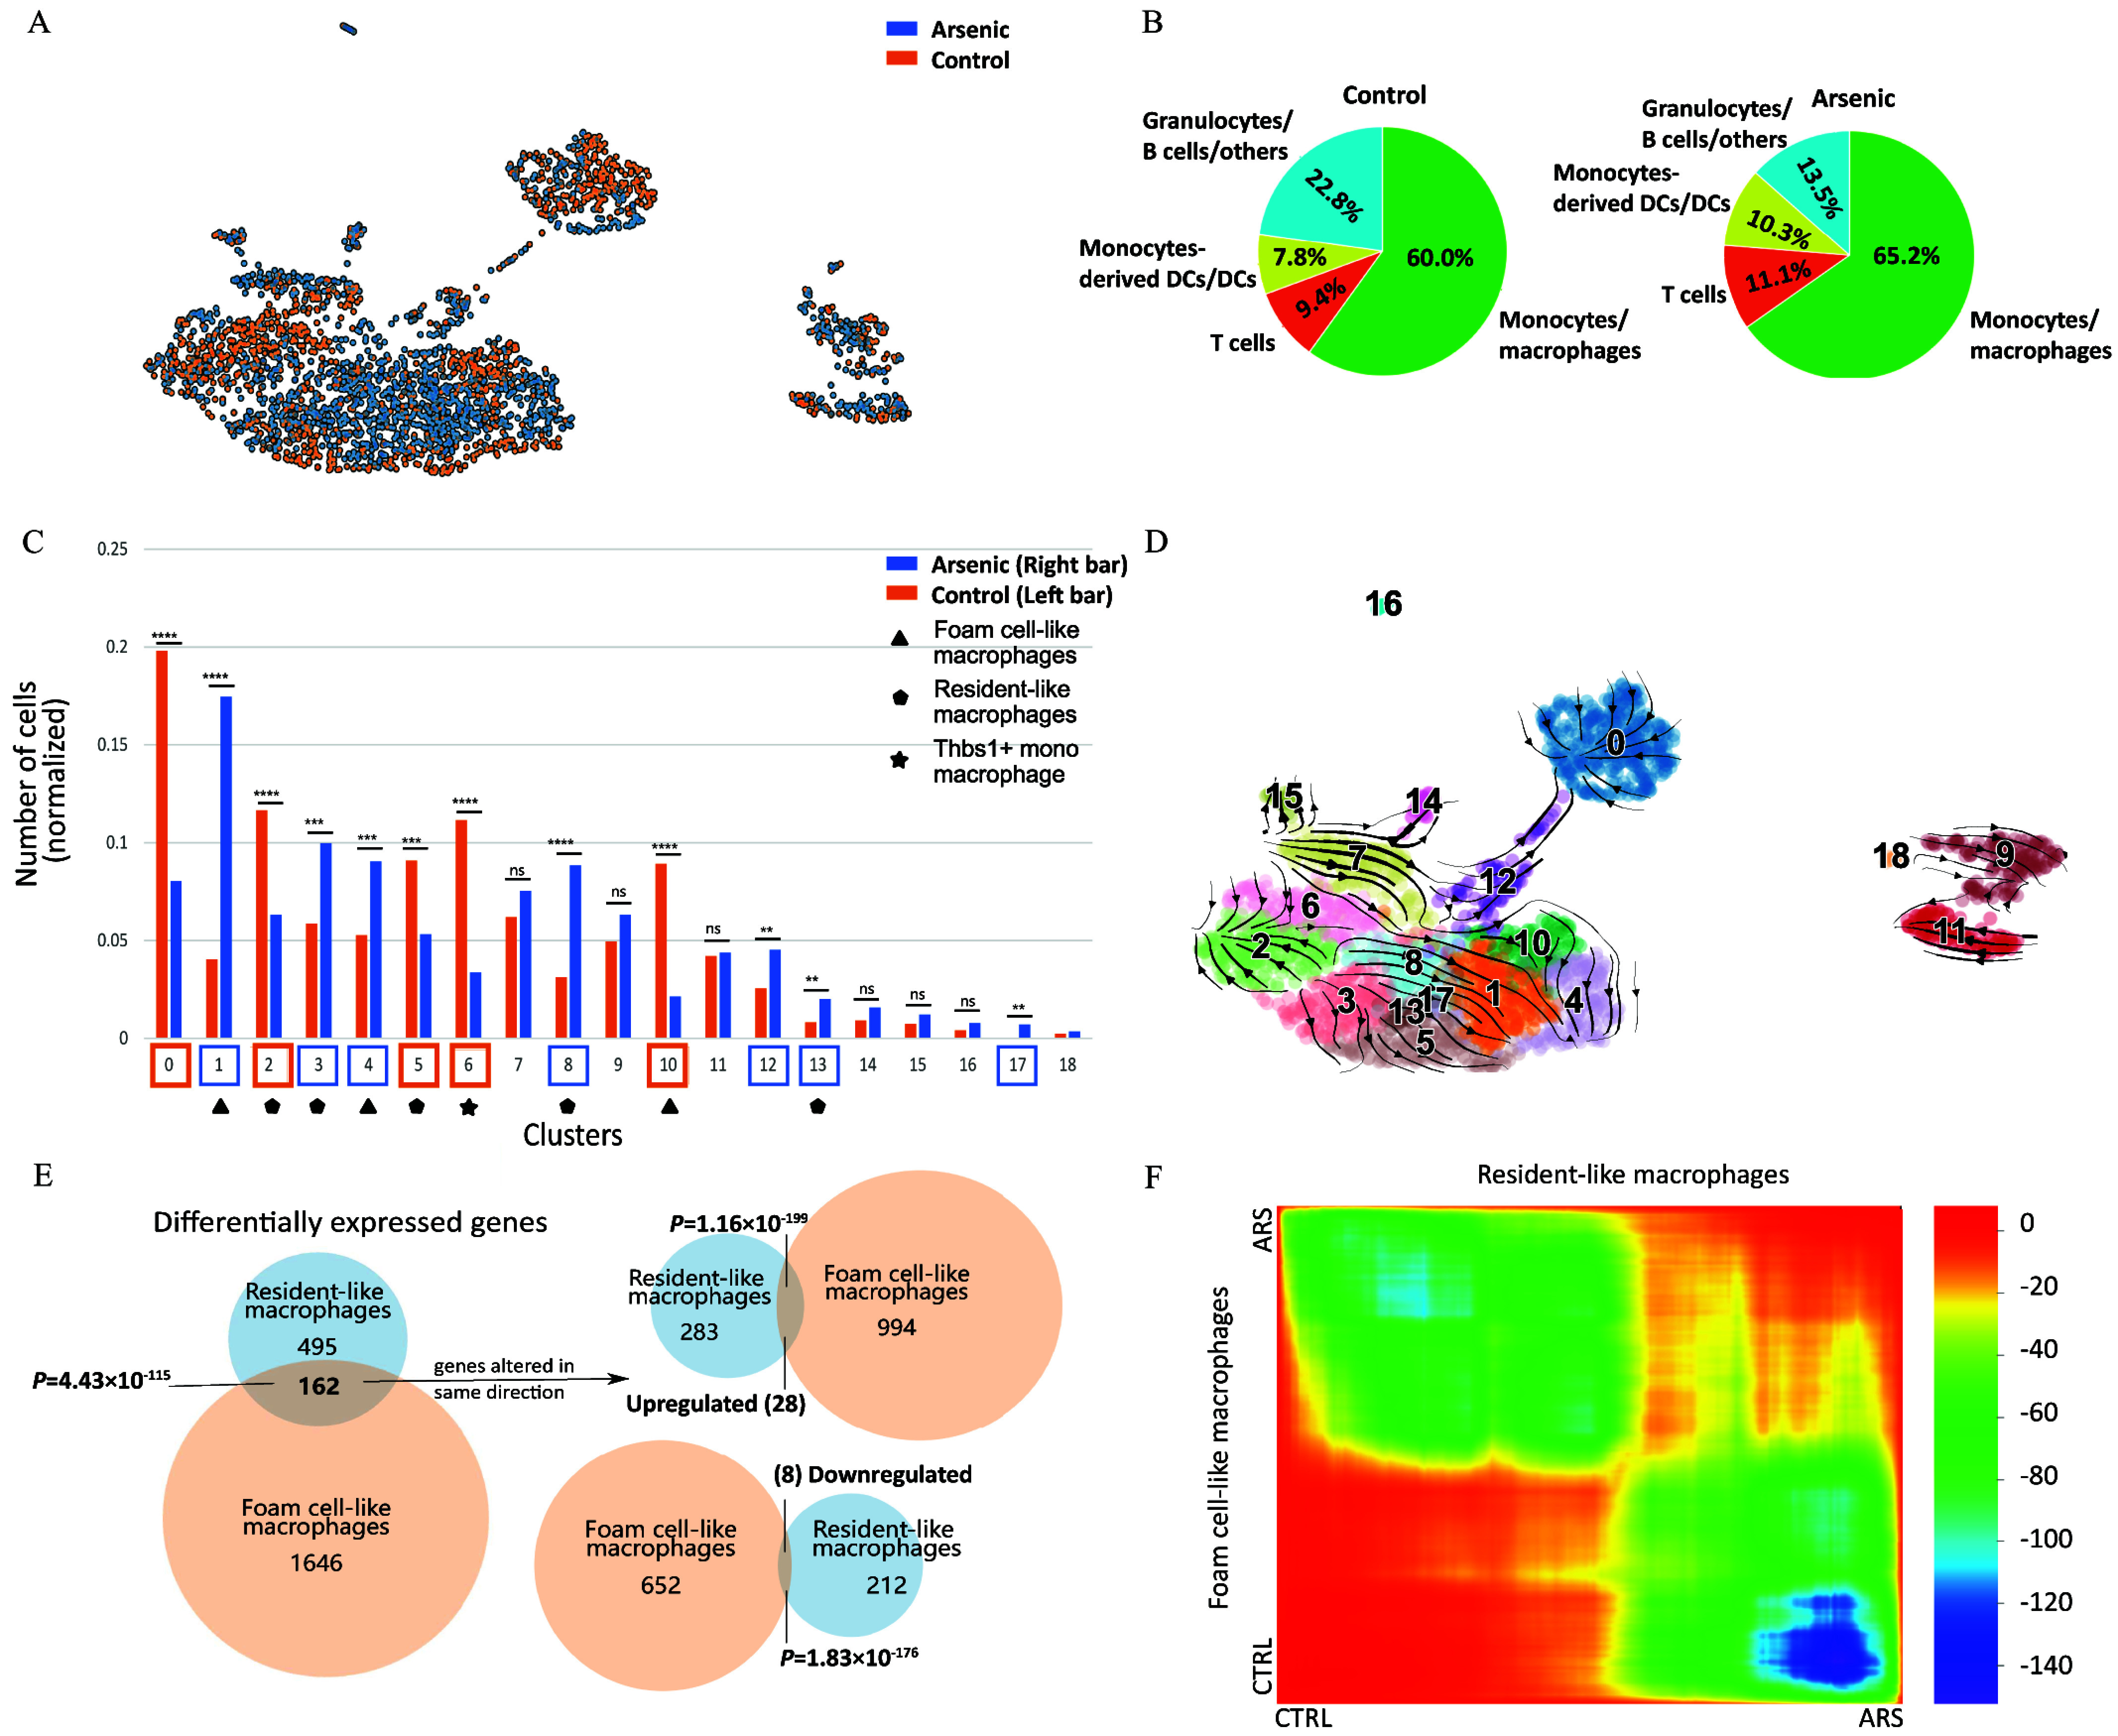
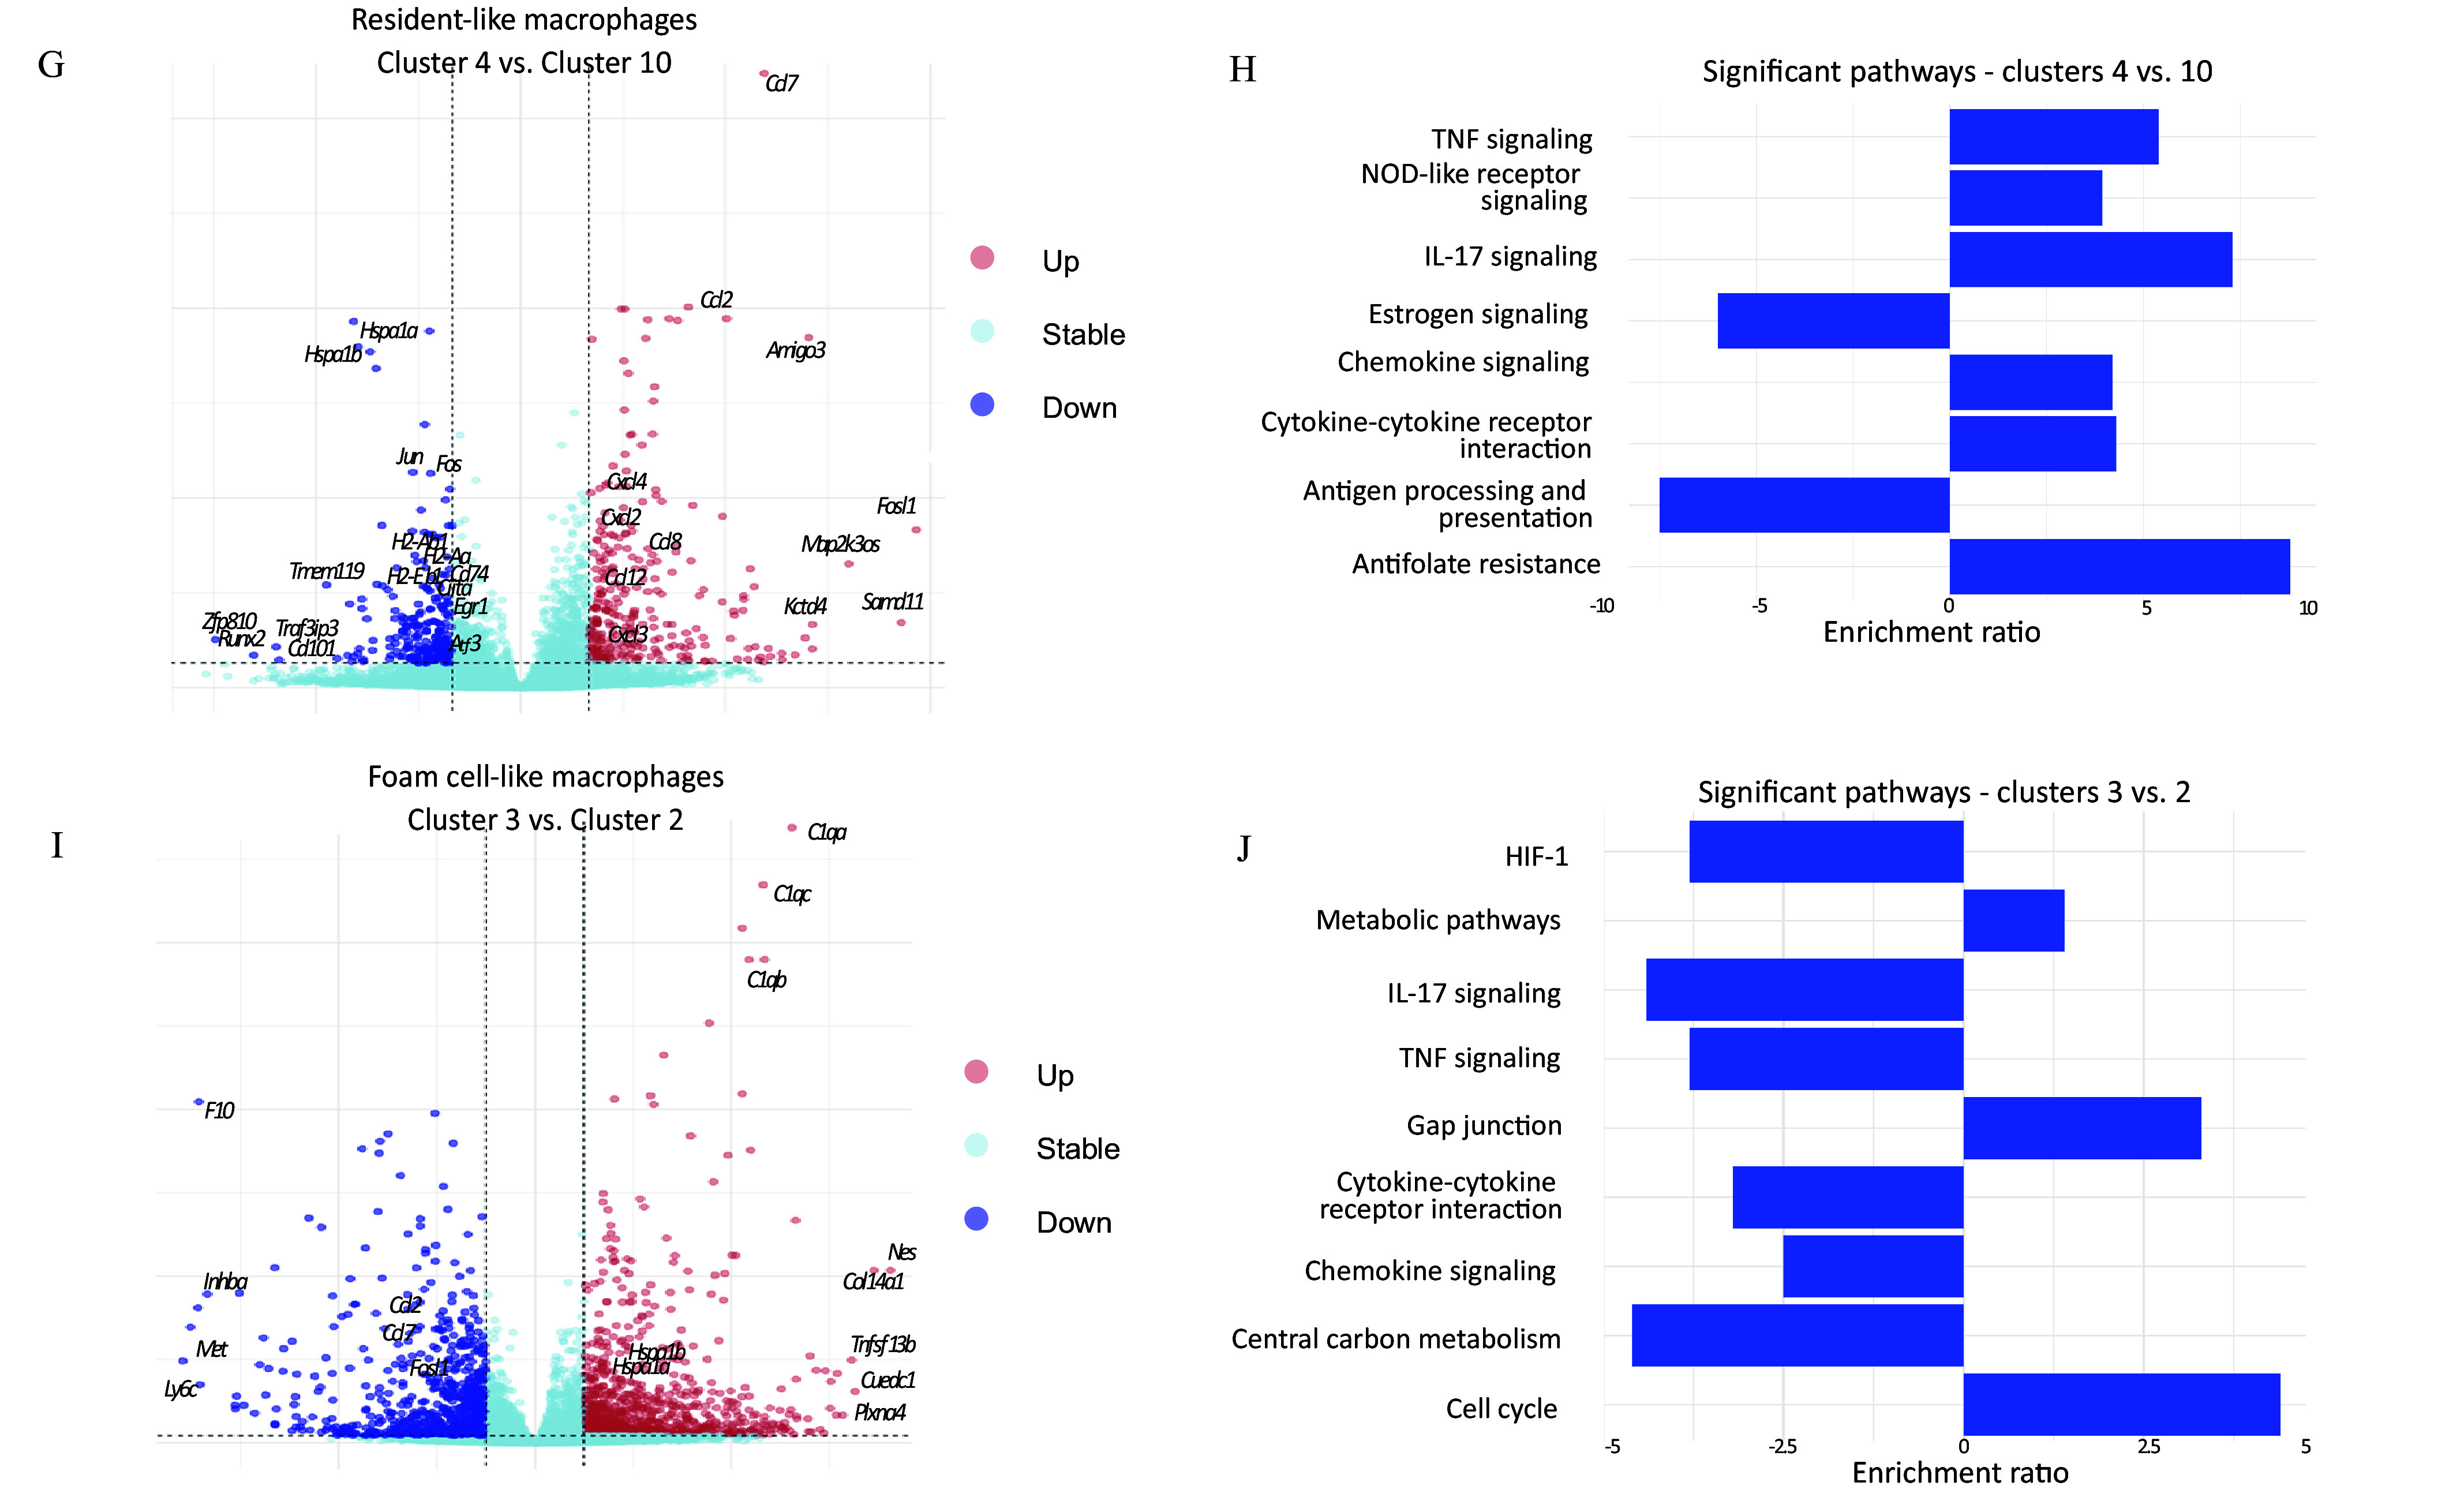
Exploration of diverse macrophage populations. Two dimensional UMAP of the gene expression data in single cells extracted from control (orange) and arsenic-exposed (blue) aorta of apolipoprotein E knockout (ApoE–/–) mice (A). Relative abundance of different immune cell clusters in control (left) versus arsenic-treated (right) presented as pie charts of number of each cell type normalized to the total number of cells supported by Excel Table S1 (B). Relative abundance of different immune cell clusters as a percentage of total cells represented in a bar plot supported by Excel Table S3. The non-normalized data are in Excel Table S1. Statistical significance is indicated by the symbols *, **, ***, and ****, where * denotes , ** denotes , *** denotes , and **** denotes . “ns” means not significant. Hypergeometric test is used to derive the -values (C). RNA velocity plot predicting gene expression changes of the different cell clusters; the length of the arrows represents the gene expression changing rate (velocity) and the directionality is towards the inferred pseudo-time future state (D). Venn diagram of the differentially expressed genes overlapping between resident-like (clusters 4 as compared to cluster 10) and foam cell–like (cluster 3 as compared to cluster 2) macrophages (E). Heatmap showing the global gene expression changes in the resident-like and foam cell–like clusters in the cells obtained from control versus arsenic-exposed atherosclerotic plaques, supported by the scRNA-seq dataset in our study, which is deposited in the GEO database under accession number GSE240753 (F). Volcano plots showing the differentially expressed genes supported by Excel Table S4 (G) and bar plots representing differentially altered pathways supported by Excel Tables S6 and S7 (H) between resident-like clusters 4 and 10 as a result of arsenic exposure; significantly upregulated genes (log2FC ; ) are shown to the right, and significantly downregulated genes (log2FC ; ) are on the left. Volcano plots showing the differentially expressed genes supported by Excel Table S5 (I) and bar plots representing differentially altered pathways supported by Excel Tables S8 and S9 (J) between foam cell–like clusters 3 and 2 as a result of arsenic exposure; significantly upregulated genes (log2FC ; ) are shown to the right, and significantly downregulated genes (log2FC ; ) are shown to the left. Note: DC, dendritic cell; HIF, hypoxia-inducible factor; IL, interleukin; NOD, nucleotide oligomerization domain; scRNA-seq, single-cell RNA sequencing; TNF, tumor necrosis factor; UMAP, uniform manifold approximation and projection.
Trajectory Inference Analysis of Single-Cell Clusters from Plaque-Resident Immune Cells from Control or Arsenic-Exposed apoE–/– Mice Fed a High-Fat Diet
Pseudo-time analyses help determine the fate of cell populations and infer their trajectories of differentiation in single-cell datasets. It utilizes the relative abundance of nascent and mature mRNAs to estimate the rate of splicing in order to predict directionality.40 Therefore, to estimate the gene expression differences in the diverse single-cell clusters identified in our study, we performed RNA velocity analysis, a pseudo-time approach (Figure 2D), and focused on the macrophage clusters. Among resident-like macrophages, CEC 10 likely transitions into AEC 4 upon arsenic exposure (Figure 2D), suggesting that arsenic exposure shifts the resident macrophage population but not toward foam cell–like phenotypes. Among the larger foam cell clusters, CEC 2 maintained gene expression homeostasis, whereas AEC 3 had plausible trajectories toward several other smaller foam cell clusters 5 (CEC), 8 (AEC), 13 (AEC), and 17 (AEC), before terminating into AEC 1 (Figure 2D). While we did not find any inflammatory macrophage clusters in our dataset, clusters 5, 8, 13, and 17 had relatively higher expressions of genes (Ccl2, Ccl3, Ccl4, Cxcl2) reminiscent of these macrophages.23 Moreover, we observed that the Thbs1+ monocytes/macrophage CEC 6 was one of the most dynamic clusters and had probable trajectories terminating in foam cell–like CEC 2 and resident-like AEC 1 (Figure 2D).
Gene Expression Changes in Resident-like and Foam Cell–like Macrophages of Control or Arsenic-Exposed apoE–/– Mice Fed a High-Fat Diet
We next turned our attention to the comparison of arsenic exposure–related gene expression differences within the two dominant macrophage types, the resident-like and foam cell–like clusters. These differences between control and arsenic-exposed mice were greater for foam cell–like macrophages, with 1,808 differentially expressed genes associated with this cell type compared to 657 differentially expressed genes associated with resident-like macrophages (Figure 2E), under the same cutoffs. Importantly, the differential expression of only 36 genes was in the same direction (28 upregulated and 8 downregulated) in both cell types after arsenic exposure (Figure 2E). The expression of the majority of genes was shared between foam cell–like macrophages and resident-like macrophages; however, 126 of 163 () were differentially expressed (between arsenic and control animals) in opposite directions (Figure 2E). This lack of overlap and discrepancy in the direction of the change between resident-like and foam cell–like differential gene expression, as depicted by a selection of such genes in Figure 2F, prompted us to examine each macrophage type individually.
To elucidate the drivers of the observed transitions revealed through RNA velocity analysis, we compared the differentially expressed genes between resident-like CEC 10 and AEC 4. In that, we identified 495 genes, with 283 being upregulated and 212 being downregulated in arsenic vs. control animals (Figure 2G). Pathway analysis identified an upregulation of genes associated with cytokine/chemokine signaling and lower expression of genes associated with antigen presentation in AEC 4 (Figure 2H; Excel Tables S4, S6, and S7). In contrast, when we compared the foam cell–like CEC 2 and AEC 3, 1,646 genes were differentially expressed (994 upregulated and 652 downregulated) (Figure 2I). Pathways for which genes were differentially expressed in arsenic-exposed mice included cell cycle, gap junctions, HIF signaling, and central carbon metabolism (Figure 2J; Excel Tables S5, S8, and S9). Of note, cytokine/chemokine signaling and antigen presentation were also identified as pathways related to genes differentially expressed in arsenic-exposed mice; however, in contrast to resident-like macrophages, genes related to these pathways were decreased in arsenic-exposed foam cell macrophages.
Cell–Cell Interaction Patterns Associated with Macrophages in Control or Arsenic-Exposed apoE–/– Mice Fed a High-Fat Diet
Hypothesizing that unique alterations in distinct macrophage subtypes stem from specific intercellular interactions, we explored dynamic cell–cell communication within the plaque microenvironment as it could potentially influence atherosclerosis progression or regression. Employing CellChat,42 a tool predicting communication likelihood between cells based on ligands, receptors, and co-factors, we assessed interactions across cell clusters. Figure 3A portrays predicted ligand–receptor interactions, where the circle size reflects the abundance of cells in each cluster and edge width indicates communication probability. Figure 3B depicts a heatmap of interaction quantities between communicating clusters, x- and y-axes denoting receivers and senders, respectively. Our single-cell dataset unveiled 3,064 interaction pairs, with clusters 1–6, 10, and 13 being prominent (Figures 3A,B). Specifically, clusters 6 and 4 seemed to receive the majority of signals (290 and 266 pairs separately, top two in all clusters), while clusters 2 and 4 were the prominent signal senders (329 and 301 pairs separately, also top two in all clusters) (Figure 3A,B). Notably, the majority of active cell–cell engagement clusters consisted of monocytes and macrophages (95% of pairs).
Figure 3.

Interactome of immune cells present in an atherosclerotic plaque. Putative cell communication network for the clusters presented in our dataset represented as linkage plot (A) and heatmap (B). In panel A, the size of the circles denotes the relative abundance of the cluster and the thickness of the loop denotes the probability of interaction. In panel B, the heatmap represents the number of interactions between the clusters receiving the signals on x-axis and the clusters sending the signals on y-axis; the length of the bars on the top and right side of the plot denotes the cumulative signals received and sent by the corresponding clusters, respectively. Comparison of chemokine signals and corresponding receptors represented as a dot plot (C), where the x-axis denotes cluster pairs sending and receiving signals, and the y-axis consists of the chemokine–receptor pairs. The color of the circles on the plot, with respect to the “communication probability” key on the right, denotes the probability of communication, and the size of the circles denotes the -value of these predictions. Noteworthy interactions are denoted by random colors assigned to the boxes, with correspondingly colored dots on the x-axis to facilitate interpretation of the interaction pairs. Note: cluster 0, granulocytes; cluster 1, resident-like macrophages; cluster 2, foam cell–like macrophages; cluster 3, foam cell–like macrophages; cluster 4, resident-like macrophages; cluster 5, foam cell–like macrophages; cluster 6, Thbs1+ macrophages; cluster 7, monocyte-derived dendritic cells/classical dendritic cells; cluster 8, foam cell–like macrophages; cluster 9, mixed T cells; cluster 10, resident-like macrophages; cluster 11, CXCR6+ T cells; cluster 12, Foam cell-like macrophages; cluster 13, foam cell–like macrophages; cluster 14, mature dendritic cells; cluster 15, plasmacytoid dendritic cells; cluster 16, B cells; cluster 17, foam cell–like macrophages; cluster 18, T cells.
Resident-like macrophages displayed higher expression of chemokines post arsenic exposure (Figure 2G,H), which was reflected in the CellChat42 interactome with chemokine–receptor pairs (Figure 3C). We studied the differences in ligand–receptor interactions in immune cells from arsenic- vs. control-exposed mice. Arsenic exposure was associated with more interactions in resident-like clusters 4 and 10 and fewer interactions in foam-like clusters 2, 3, and 5 (Figure 3A,B). For example, AEC 4 had more interactions with incoming monocytes/macrophages (cluster 6) and foam cells, reflective of chemokine–receptor upregulation, such as that of Ccl2/Ccl7/Ccl12-Ccr2 and Ccl6-Ccr2, consistent with expression data (Figure 2G and 3C). In contrast, foam-cell cluster 2 and 3 (AEC) had fewer interactions, especially with cluster 6 (Figure 3B), aligning with decreased chemokine expression (Figure 2I,J). Interestingly, AEC 2 and 3 had more interactions with resident-like clusters, suggesting potential foam cell involvement in recruiting and shaping resident-like macrophages (Figure 3B).
Data from cluster 6, composed of both monocytes and macrophages, indicated recruitment and migratory signaling through the Ccl2-Ccr2 and Ccl7-Ccr2 ligand–receptor pairs, reflecting high Ccr2 expression. Additionally, autocrine signaling along the Ccl2-Ccr2 axis was observed in this cluster. In contrast, cluster 4, identified as resident-like AEC, was predicted to facilitate the transition of newly recruited monocytes/macrophages into resident-like phenotypes via chemotactic and migratory signals involving Ccl6/Ccl12-Ccr2.
In our study, the predicted Spp1–Cd44 interaction dominated foam cell-driven cell–cell communication preferentially over integrin receptors (Figure 3C). The Spp1–Cd44 interaction was highest within the CEC 2 cluster as compared to AEC 3. In addition, predicted Mif-Cxcr4/ cytokine interactions were unique to the foam-like CEC 2 and, thus, were absent in the foam cell AEC 3 (Figure 3C). This interaction was primarily with the resident-like clusters, suggesting arsenic-induced differences in the foam cell-resident macrophage crosstalk.
Comparing the Single-Cell Multi-Omics Data (scRNA-Seq for Transcriptome and scATAC-Seq for Chromosome Accessibility) with Single scRNA-Seq Findings
In the preceding sections, we delineated the various cell types identified in our scRNA-seq dataset and scrutinized the arsenic-induced shifts in macrophage subpopulations—specifically, resident-like and foam cell–like macrophages. To further probe the epigenetic factors that may be underlying the transcription differences identified, we conducted single-cell 10× Genomics multiome sequencing (scRNA-seq and scATAC-seq), employing a new set of animals for plaque isolation and performing paired single-cell RNA and ATAC sequencing.
We began by integrating data from both control and arsenic-exposed mice derived from the RNA-seq component of the multiome [denoted henceforth as scRNA-seq (m)] and established cell clusters based on the gene expression patterns discerned earlier. Scanpy-assisted clustering30 yielded 20 unique cell clusters (Figures 4A; Excel Table S10), presented on the UMAP in Figure 4A alongside their corresponding scRNA-seq clusters in parentheses. We then assigned cell type identities to these clusters using CellMarker and the murine gene expression atlas34 (Figure 4B). Consistent with the initial scRNA-seq, the multiome scRNA-seq (m) discerned foam- and resident-like macrophages, granulocytes, B cells, and T cells, and dendritic cells. A notable observation was the identification of an NKT cell cluster, which was absent from our initial scRNA-seq dataset. This finding may be attributed to the larger number of profiled cells in the 10× multiome analysis (a total of 5,284 cells, 2,192 cells from the arsenic library and 3,092 cells from the control library as detailed in Excel Table S10 with 18,050 gene expression patterns) compared to the 2,603 cells analyzed in the scRNA-seq dataset (Excel Table S1). Representative gene signatures of each immune cell subtype, utilized for annotation, are illustrated in Figures 4C and Excel Table S11. Clusters 0–3 were classified as foam-like macrophages, while clusters 5–7, 9, 11, and 16 exhibited gene signatures of resident-like macrophages. Among non-macrophage clusters, clusters 4, 14, and 17 were identified as dendritic cells (DCs)/monocyte-derived dendritic cells (moDCs); clusters 8, 12, 13, 18, and 19 as T cells; cluster 10 as granulocytes; and cluster 15 as a B cell cluster (Figure 4B). To provide a comparative view of the cluster characteristics between scRNA-seq and scRNA-seq (m), we enumerated the cells attributed to the various immune cell types (Figure 4D). Excluding granulocytes, the relative ratios of the annotated immune cells were generally consistent between the two datasets.
Figure 4.
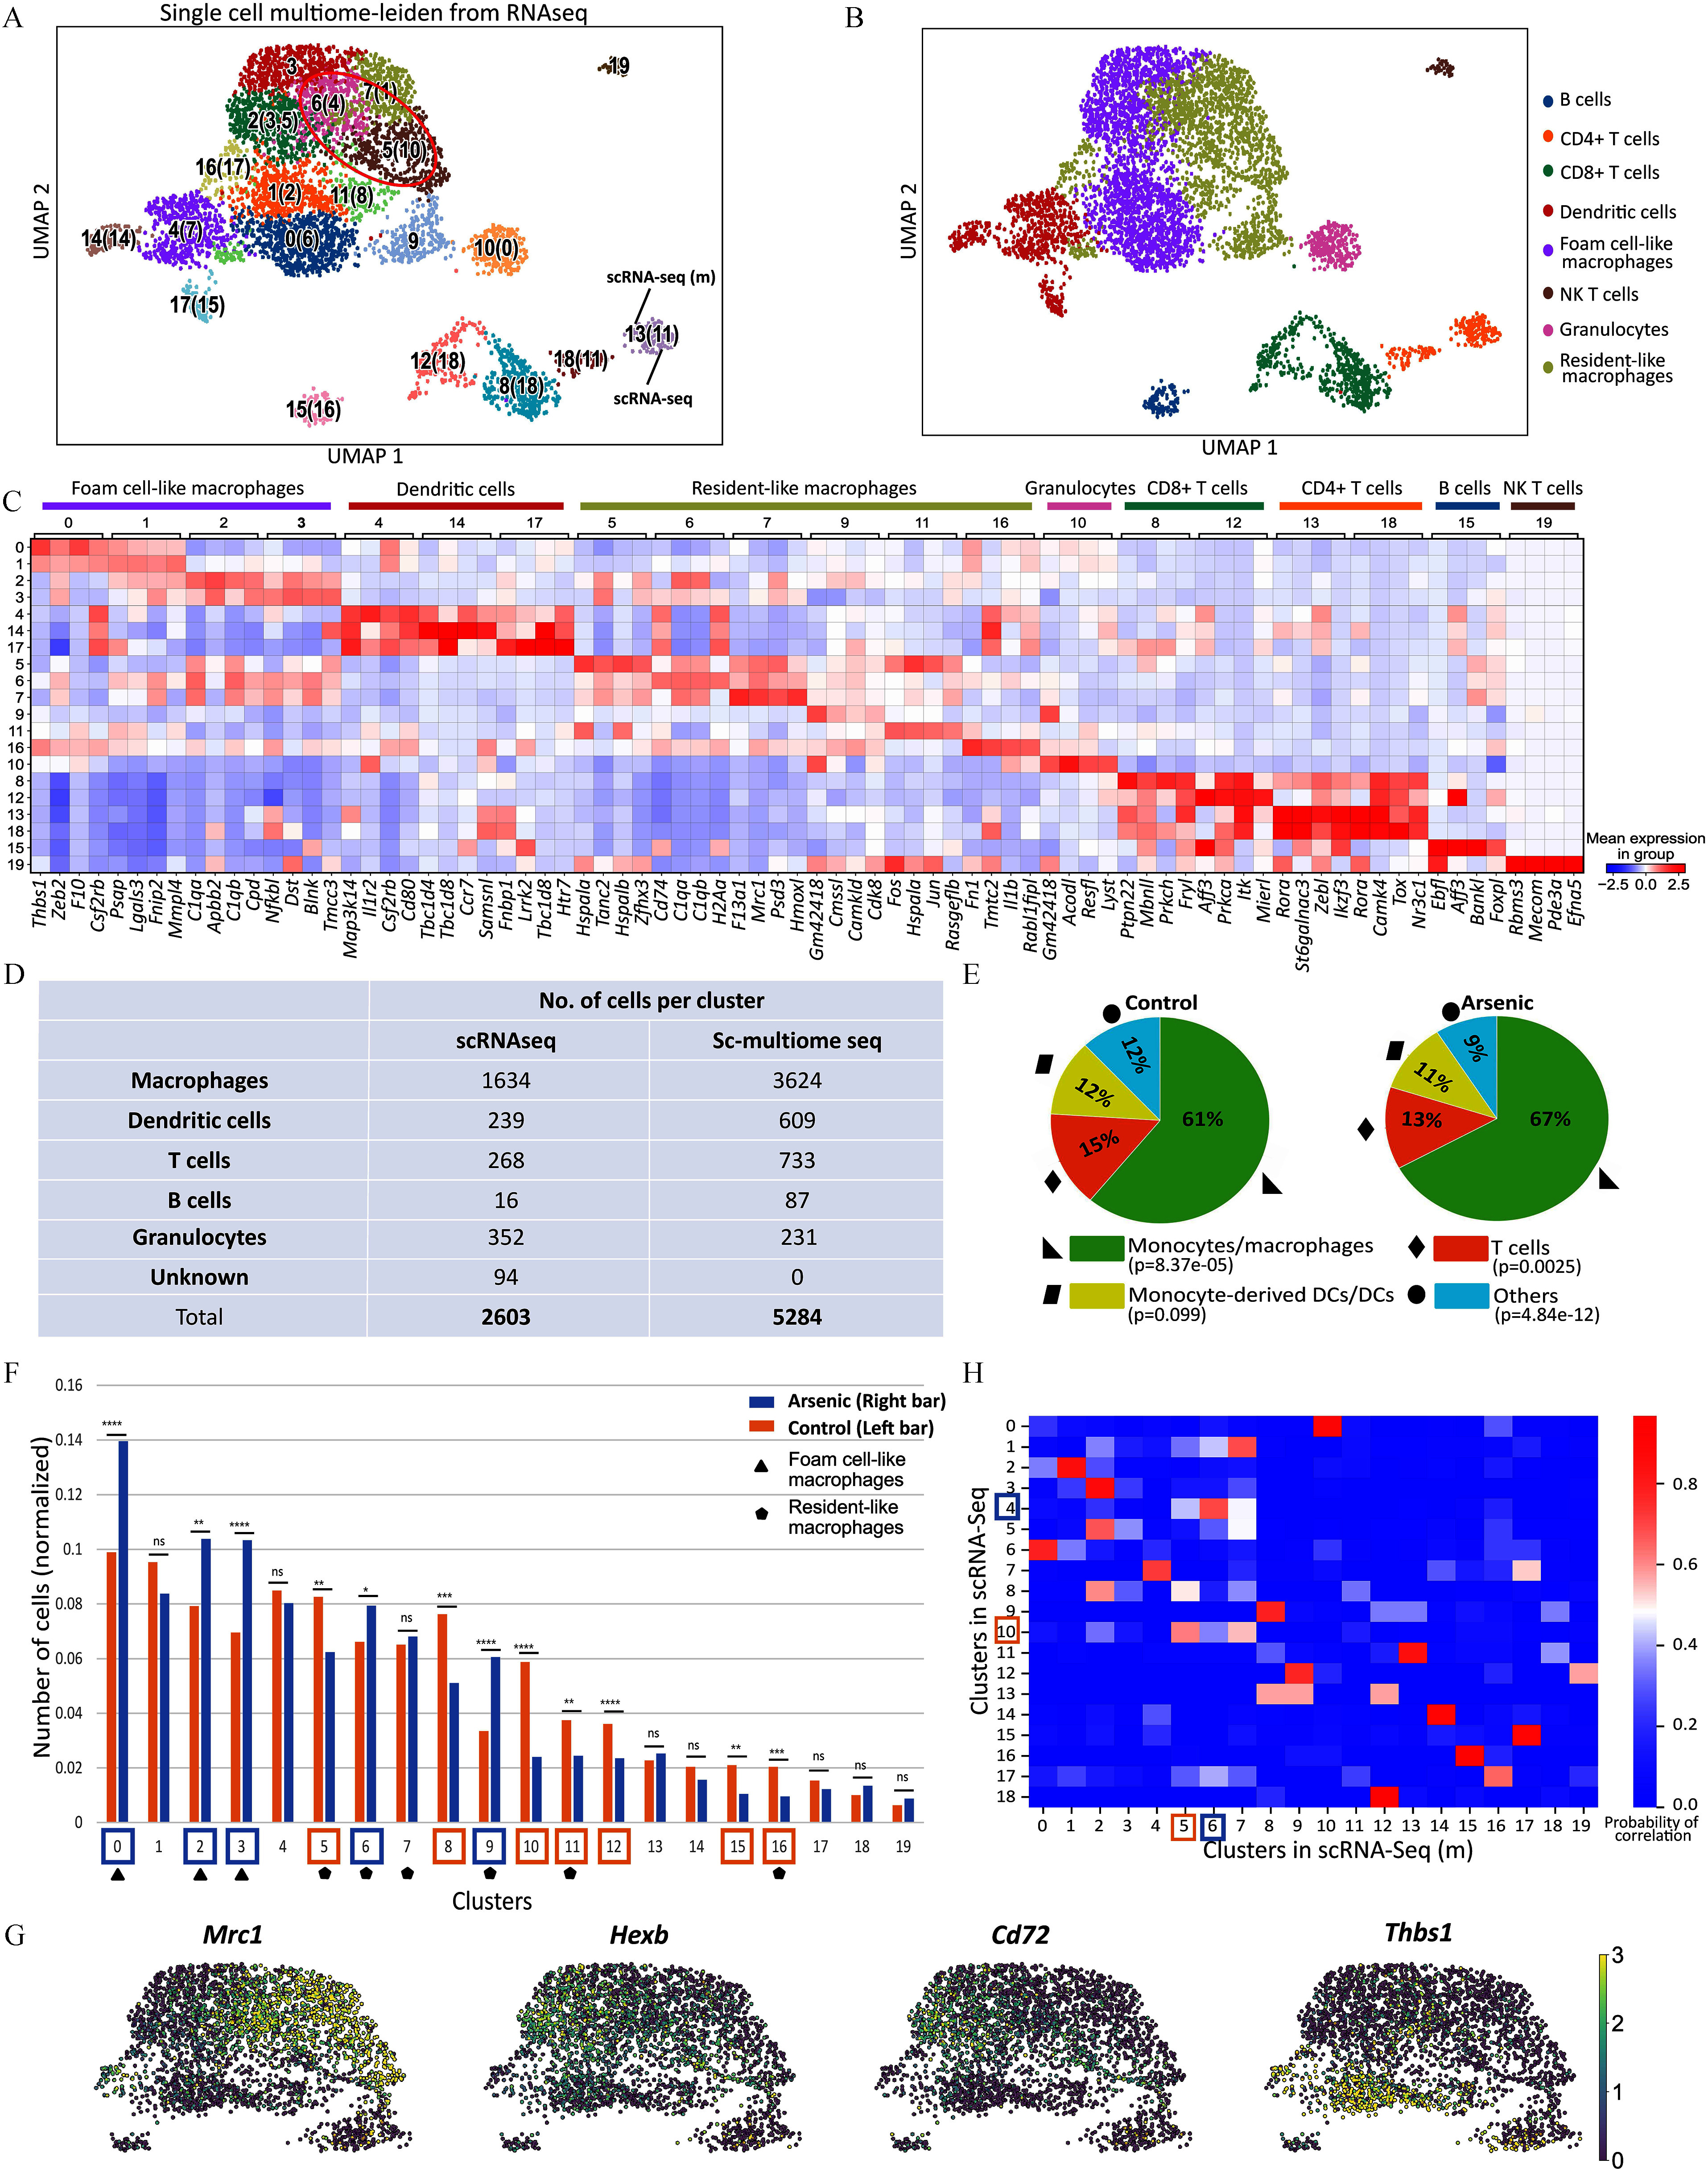
Characterization of the immune cell landscape from scRNA-seq (m) dataset. UMAP of the single-cell gene expression data extracted from scRNA-seq (m) performed on control and arsenic-exposed atherosclerotic plaques of apolipoprotein E knockout (ApoE–/–) mice segregated into clusters using unsupervised clustering, where the numbers in parentheses represent the corresponding clusters in the scRNA-seq dataset (A) and annotated for the immune cell types (B). Heatmap showing the top most upregulated genes in each cluster defined in panel B, compared with other clusters. The shade of the color in the units indicates the normalized and scaled expression of genes in the corresponding cell type cluster. The data was normalized and the left and top legend all indicated the cell type cluster name in panel B, supported by Excel Table S11 (C). Comparison of the number of cells pertaining to each of the immune cell types deduced from scRNA-seq and scRNA-seq (m) (D). Pie charts presenting the relative abundance of different immune cell clusters in control (left) versus arsenic-treated (right) samples as a percentage of total cells supported by Excel Table S10 (E) and as a normalized number of cells supported by Excel Table S12 (F). Macrophage subtypes present in the scRNA-seq (m) dataset as delineated by the gene expression patterns of Mrc1, Hexb, Cd72, and Thbs1 on a UMAP (G). Correlation plot comparing the immune cell clusters in scRNA-seq and that in scRNA-seq (m), supported by the Excel Table S2 and S11 (H). Note: DC, dendritic cell; UMAP, uniform manifold approximation and projection.
Subsequently, we quantified the relative abundance of each immune cell cluster in control and arsenic-treated samples from scRNA-seq (m). In both groups, the majority of cells were monocytes/macrophages, followed by dendritic cells and T cell clusters (Figure 4E). We then examined the arsenic-associated differences in the relative abundance of the identified cell clusters. Clusters 0, 2, 3, 6, and 9 were predominantly enriched in cells from treated animals, whereas clusters 5, 8, 10, 11, 12, 15, and 16 were more prevalent in cells from control animals (Figure 4F; Excel Table S12).
Our focus then turned to macrophage subtypes analogous to those in our scRNA-seq dataset. We annotated macrophage subtypes in the new dataset using canonical markers from the previous dataset (Figure 4G), identifying markers of foam- and resident-like macrophages, as well as Thbs1+ macrophages. We also discovered resident-like clusters 5 and 6 in the scRNA-seq (m) dataset analogous to scRNA-seq CEC 10 and AEC 4, respectively (Figures 4H; Excel Tables S2 and S11). The substantial overlap between the two scRNA-seq data sets confirmed the reproducibility of our sample processing and analyses. However, despite the high-resolution profiling of single-cell transcriptome, deducing regulatory code remained challenging due to gene regulation being orchestrated by a myriad of transcription factors binding to enhancers and promoters. To overcome this limitation, we employed the scATAC-seq data from the multiome sequencing dataset to understand chromatin accessibility profiles linked to the transcriptional changes. The control and arsenic scATAC-seq data were first integrated to cluster single cells based on differential chromatin accessibility using cisTopic.47 cisTopic is an unsupervised Bayesian framework that groups genomic regions into “regulatory topics,” a set of genomic regions that tend to be open (i.e., accessible to the transposase enzyme) together across cells. In the context of scATAC-seq data, a “topic” is essentially a set of genomic regions that tend to be open (i.e., accessible to the transposase enzyme) together across cells, which may suggest coregulation by the same set of transcription factors.47 As a result, the single cells (2,940 from the arsenic library and 4,607 from the control library, represented by 100 topics) were grouped into 19 distinct clusters with signature topics representing each of these clusters (Figures 5A,C). The scRNA-seq (m) data were then used to assign identities to the scATAC-seq clusters (Figure 5B). All scATAC-seq clusters could be assigned an identity with the exception of three clusters labeled “NA” in Figure 5B. Following the preprocessing of our single-cell ATAC-seq data, we observed no substantial batch effects. This outcome was corroborated through the application of batch effect removal methods like Harmony59 and Seurat.60 Notably, uniform manifold approximation and projection (UMAP)31 maintained consistency even after the application of these batch effect removal tools. For a thorough overview of the process, we direct you to Figure S2.
Figure 5.
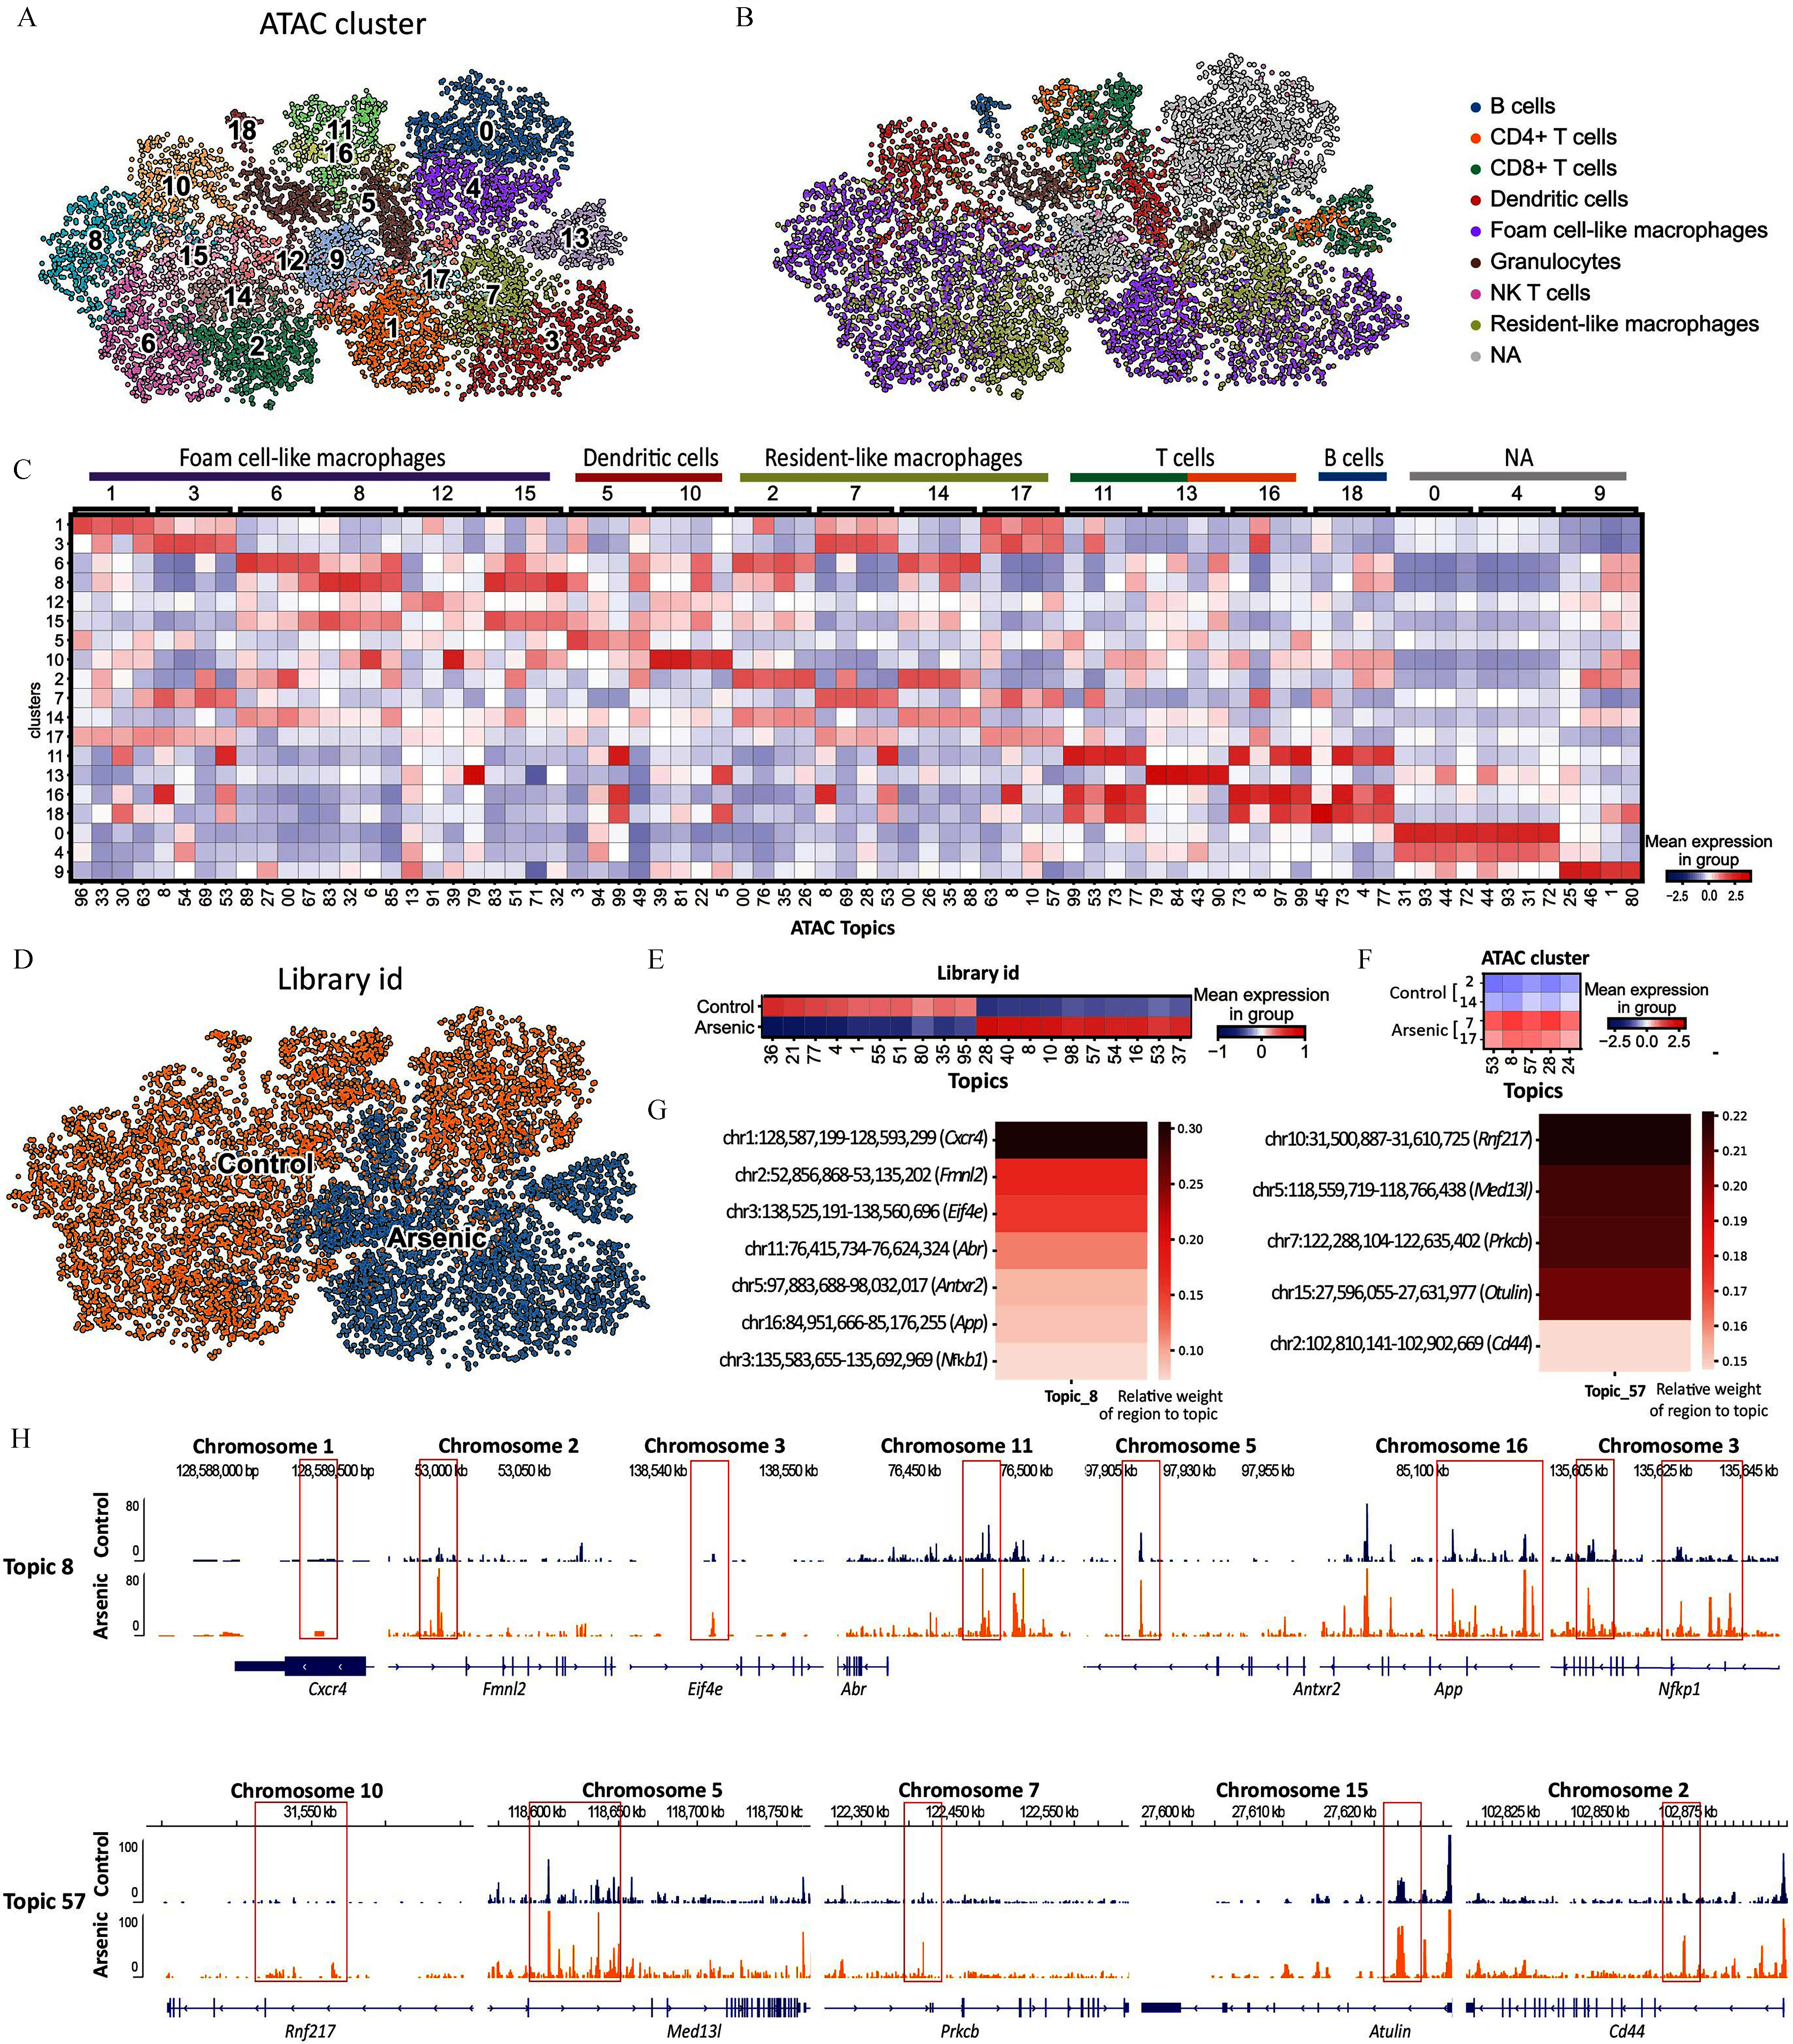
Exploring the scATAC-seq dataset and its overlaps with that from scRNA-seq. UMAP of the single-cell gene expression data extracted from scATAC-seq(m) performed on control and arsenic-exposed atherosclerotic plaques of apolipoprotein E knockout (ApoE–/–) mice segregated into clusters using unsupervised clustering (A) and annotated for the immune cell types (B). Heatmap showing the topmost upregulated genes in each cluster defined in panel B, supported by the scATAC-seq(m) dataset in our study, which is deposited in the GEO database under accession number GSE240753 (C). Two dimensional UMAP of the gene expression data in single cells extracted from control (blue) and arsenic-exposed (orange) aorta of ApoE–/– mice from the scATAC-seq(m) dataset (D). Heatmap showing the topics in control versus arsenic-treated samples, supported by the Excel Table S21 (E). Heatmap showing the topics in control resident-like macrophage clusters 2 and 14 and arsenic-treated resident-like macrophage clusters 7 and 17, supported by the Excel Table S21 (F). Representative genes in topics 8 (left) and 57 (right) with the intensity of “red” showing the relative weight of region to topic, supported by the Excel Table S22 (G). Chromosomal view of the genes in topics 8 (top) and 57 (bottom) in control versus arsenic-treated samples (H). Note: NA, could not be assigned an identity; UMAP, uniform manifold approximation and projection.
To further examine the impact of arsenic on chromatin accessibility, we relabeled the UMAP based on the origin of single cells—plaques from control and arsenic-exposed animals (Figures 5D; Figure S2). Interestingly, cells derived from control and arsenic samples occupied distinct areas on the UMAP based on their chromatin accessibility profiles. We then examined the top differential topics between the control and arsenic-treated samples (Figure 5E; Excel Table S13). Topics 36, 21, and 77 were among the most representative in control samples, while topics 57, 28, and 8 were highly represented in cells derived from arsenic-treated samples.
To correlate the scATAC-seq data with the two scRNA-seq datasets, we examined the four resident-like macrophage clusters, clusters 2, 7, 14, and 17 in the scATAC-seq analogous to clusters 5 and 6 in scRNA-seq (m) and clusters 10 and 4 in the scRNA-seq datasets (Figure 5F; Excel Table S13). Notably, clusters 2 and 14 exhibited topic signatures of control-derived samples, whereas clusters 7 and 17 were characteristic of arsenic-derived samples. We further examined topics 8 and 57 to reveal the encompassed genomic regions (Figure 5G; Excel Table S14) and visually represented the chromatin accessibility of a known arsenic-induced gene, Nfkb161,62 (Figure 5H), which highlights genomic regions whose chromatin accessibility correlated with their transcription.
In Vitro Validation of In Vivo Single-Cell Datasets
Clusters 2, 14, 7, and 17 were comparable to the resident-like macrophage clusters 4 and 10 in scRNA-seq and clusters 5 and 6 in scRNA-seq (m). Therefore, in order to understand the transcriptional differences between arsenic and control mice, we explored the transcription factors differentially indicated in the CECs and AECs in the three single-cell datasets with the scdiff241 method to confirm increased DNA binding by examining the expression of target genes [UMAP Figure 6A–C and transcription factors Figure 6D; Excel Tables S15–S17, scdiff2 results for scRNA-seq and scRNA-seq (m), and Excel Tables S14 and S15 for scATAC (m)]. When compared, the transcription factors Irf1, Stat1, Yy1, Pou2f1, Cbpa, Creb1, Jun, and Stat6 () were differentially altered in arsenic vs. control in all three datasets (Figure 6E; Excel Table S22). In addition to the substantial evidence sourced from scRNA-seq, scRNA-seq (m), and scATAC-seq (m) datasets, our study also incorporated SDREM44 to help bridge the gap between cell–cell interaction predictions (Figure 3C) and differentially expressed genes. Consequently, SDREM revealed key transcription factors as pivotal nodes within the reconstructed signaling network (Figure 6F; detailed links in Table S1) that connected receptors identified in cell–cell interaction with transcription factors and the target genes that were differentially expressed. The SDREM analysis notably also highlighted the significance of transcription factors Irf1 and Pou2f1 in the regulation of distinct resident macrophage subtypes. To amplify the impact of these findings, we showcase the genomic regions regulated by these transcription factors, along with the differential transcriptomic and epigenomic data, to illustrate the effects of arsenic (Figure 6F).
Figure 6.

Comparative transcriptome analysis of mouse in vivo and in vitro datasets. UMAPs of scRNA-seq, scRNA-seq (m), and scATAC-seq(m) datasets with the resident-like macrophage clusters of importance in this study circled in red (A, B and C, respectively). Table showing differential transcription factors between control and arsenic-treated samples in the aforementioned datasets with their -values in the respective datasets, supported by Excel Tables S15–S17 (D). Venn diagram showing transcription factors overlapping in each of the three datasets supported by Excel Tables S14, S15, and S20 (E). Candidate transcription factors from the single-cell datasets and a network of predicted receptors and intermediary proteins from SDREM analysis, supported by Excel Table S23 (F). Schematic for generating macrophages for in vitro validation of the in vivo single-cell studies 20 (G). Venn diagram showing the overlap of the transcription factors common to the single-cell datasets with that in the in vitro-generated Ifn-γ- and Il-4-stimulated macrophages20 supported by Excel Tables S18–S22 (H). Chromosome accessibility and gene expression patterns for the genes under the transcriptional regulation of Pou2f1 (top) and Irf1 (bottom) in the control and arsenic-treated resident-like cells in the single cell multi-omics dataset [scRNA-seq (m) and scATAC-seq (m)] (I). Note: Ifn, interferon; Il, interleukin; scRNA-seq, single-cell RNA sequencing; TF, transcription factor; UMAP, uniform manifold approximation and projection.
To further validate these changes, we opted for in vitro models of macrophages. Atherosclerotic plaques are complex microenvironments and recapitulating them in vitro is challenging. Therefore, we utilized data from our previously published bulk RNA-seq comparison of IFN-γ- or IL-4-activated bone marrow-derived macrophages with or without concomitant arsenic exposure (Figure 6G; Excel Tables S18–S22).20 Based on the expression of target genes, Stat6 is the only transcription factor significantly upregulated in Ifn-γ-polarized macrophages () and the only transcription factor common between the two in vitro-acquired macrophages and the in vivo single-cell sequencing datasets () (Figure 6H; Excel Table S22). Importantly, in Il-4-activated macrophages, the expression of transcription factors Pou2f1, Irf1, Stat1, and Stat6 () was differentially altered, i.e., a 50% overlap with our multi-omics datasets (Figure 6H; Excel Table S22), which suggests that the Il-4-activated macrophages (M2) highly resemble the resident-like macrophages in the single-cell datasets and have the potential to model the arsenic-induced transcriptional and epigenomic changes.
To further explore the effects of arsenic on the four transcription factors commonly seen in our single-cell and in vitro datasets, we investigated the genes under their regulatory control (Figure 6I). We draw attention to the genomic loci regulated by Pou2f1 where arsenic induces changes in chromosome accessibility, which impacts the regions flanking Rasgef1b, Cd69, Itprip, Trip6, Slc12a9, and Cdm1 genes, leading to significant gene expression differences (Figure 6I, top). Similarly, within the Irf1-regulated genomic locus, we observe changes in chromatin accessibility, presumably due to arsenic exposure, which manifests in the genomic regions flanking Kif2a, Ehd1, Trim33, and Aim2, yielding gene expression changes (Figure 6I, bottom). However, data for the LOC102641859/Rsf1 locus is limited, and hence a comprehensive assessment is challenging (Figure 6I, bottom).
Overlap with Human Data
To evaluate the translational relevance of our murine model to humans, we utilized the scRNA-seq dataset from carotid artery plaques of patients undergoing carotid endarterectomy.56 This study identified macrophage clusters/gene signatures associated with patients that presented with stroke or transient ischemic attack (symptomatic plaques) and those associated with no cerebrovascular event (asymptomatic plaques). We compared the macrophage populations, their gene signatures, and their profiles in control vs. exposed/treated subjects in our scRNA-seq dataset to those in this clinical study (Figure 7A–F). We focused on macrophages with gene expression that resemble resident macrophages in our dataset and sought to identify similar patterns in a human dataset. The gene signatures of macrophages in cluster 4, enriched with arsenic, and cluster 10, serving as the control in our study, match those in clusters 7 and 6, respectively, from the human dataset. These clusters are characterized by the prevalence of certain key genes (Figure 7G). Cluster 7 is typically found in symptomatic plaques, whereas cluster 6 is more common in asymptomatic plaques. This finding suggests that arsenic exposure may contribute to the formation of lesions that are more susceptible to severe future cerebrovascular events (Figure 7G).
Figure 7.
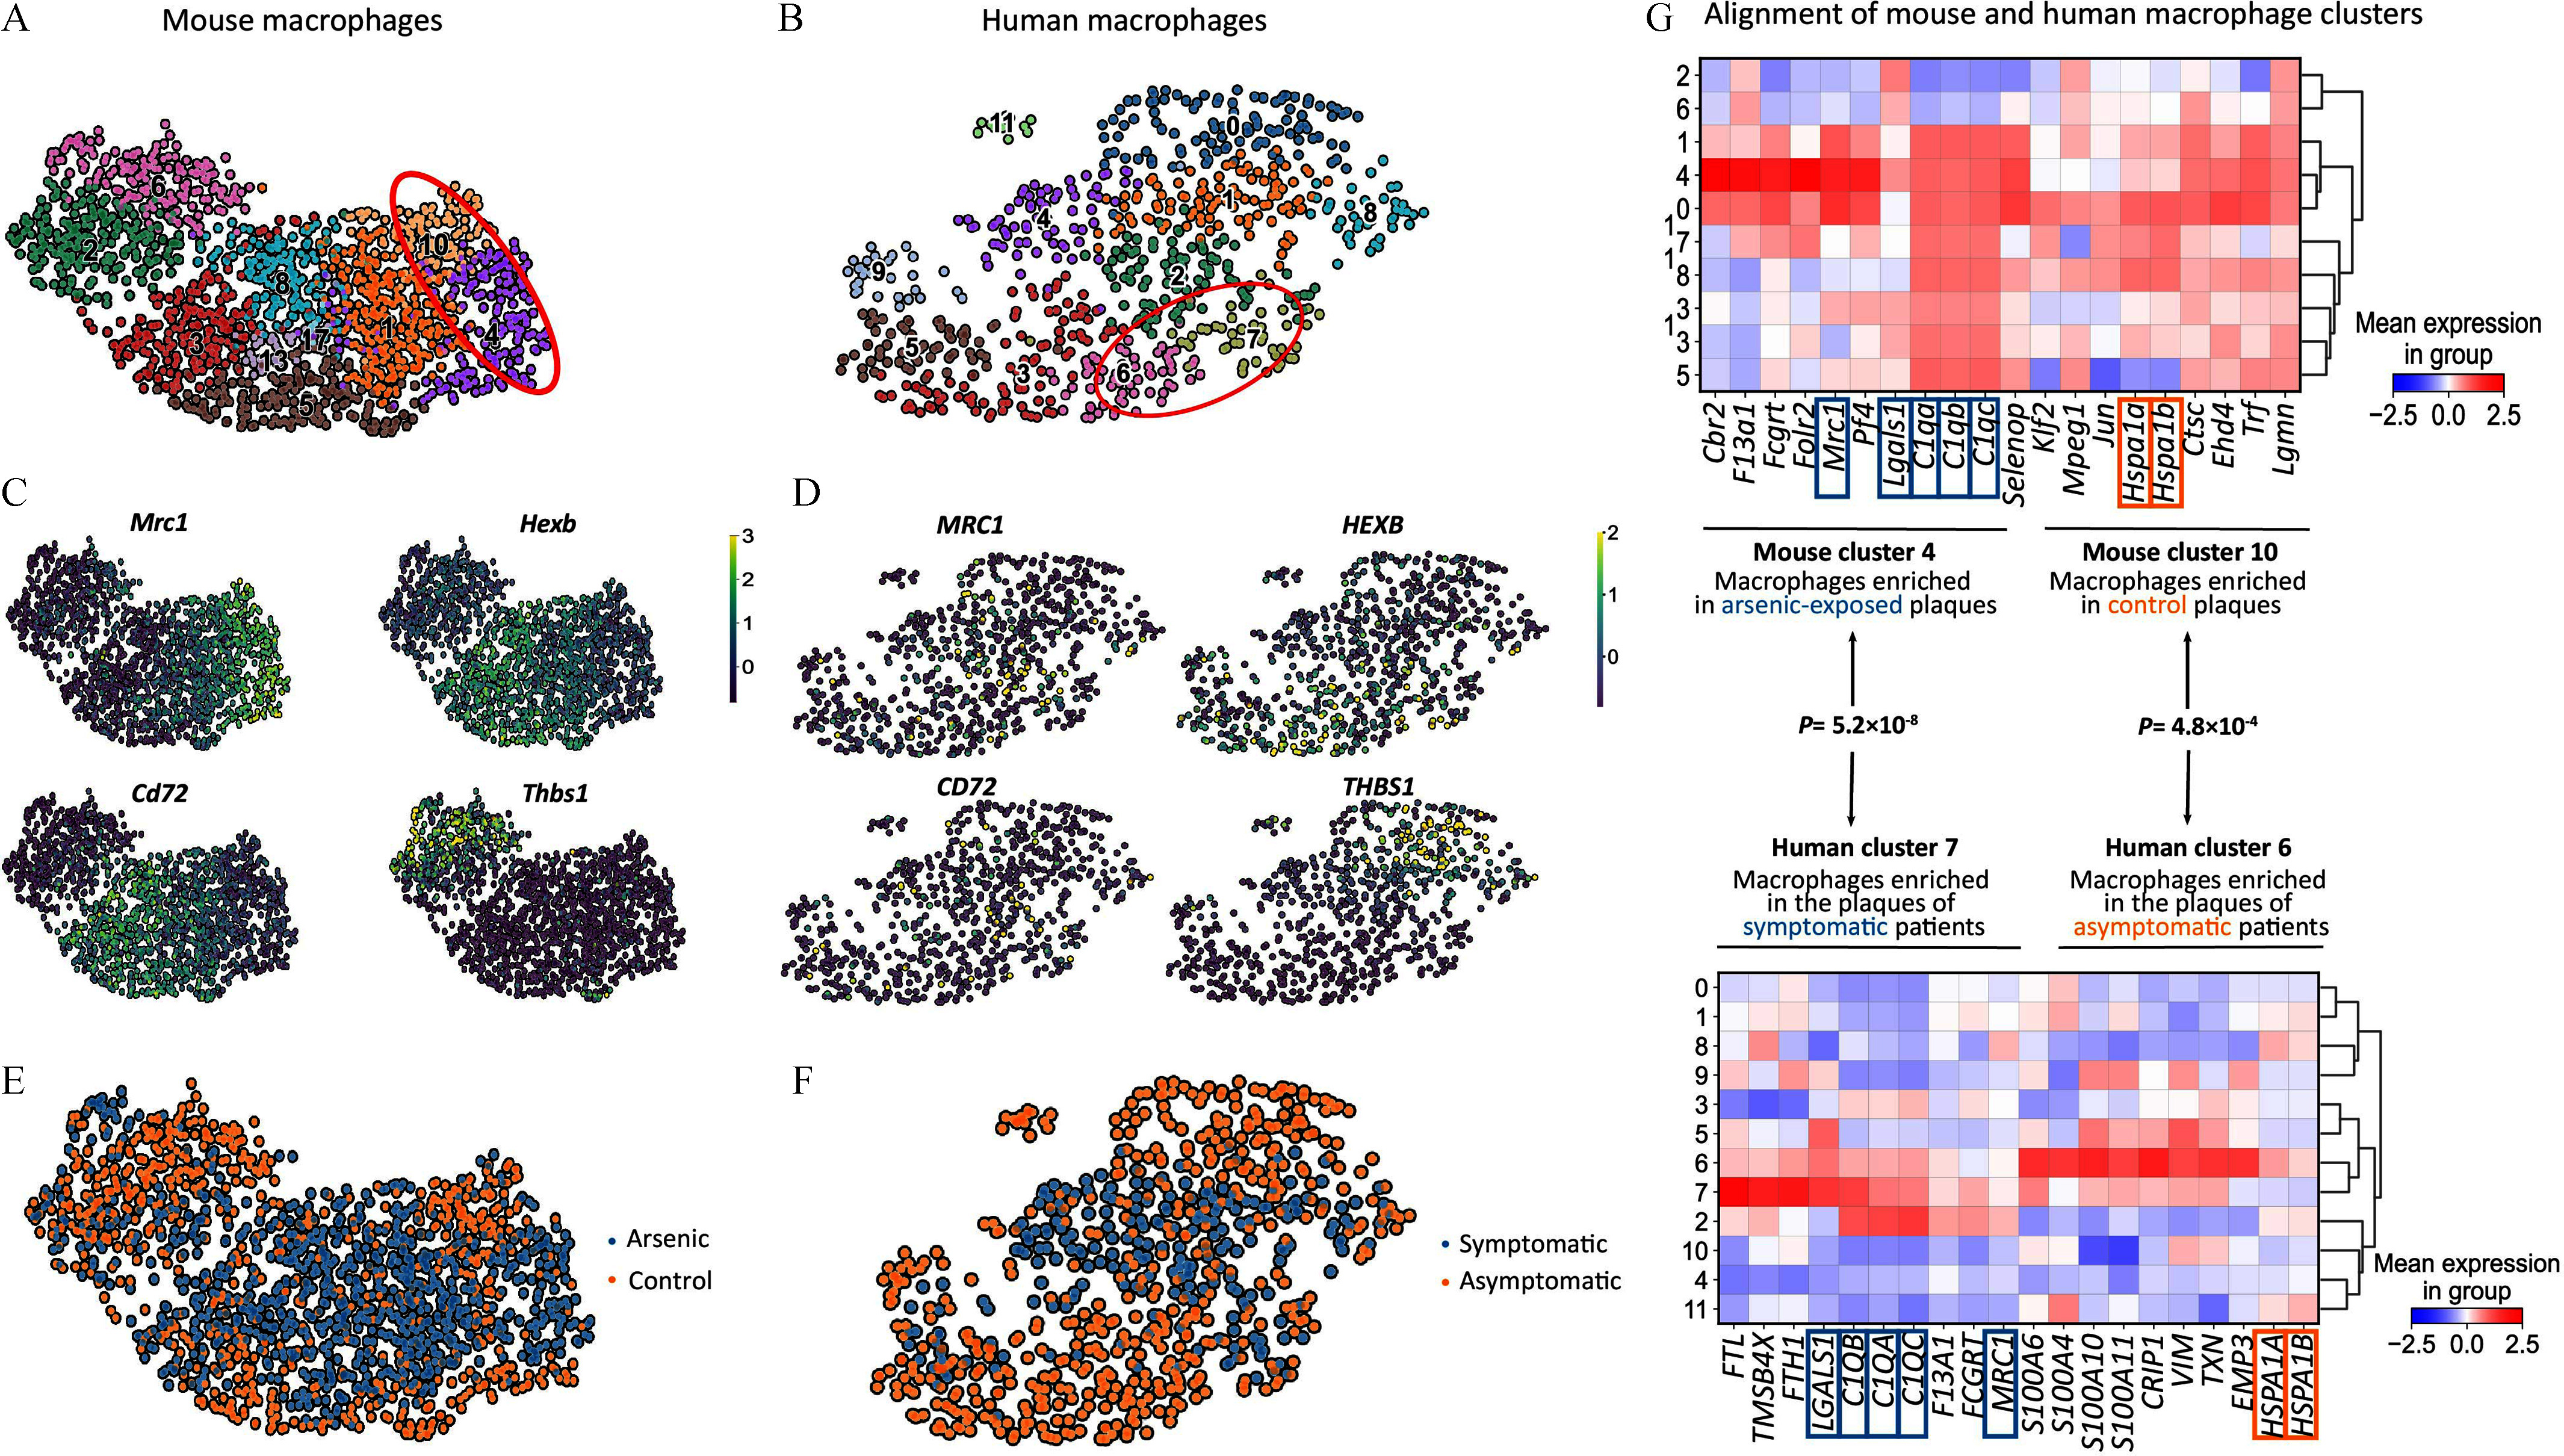
Comparative analysis of murine and human single-cell datasets. UMAPs of all macrophages from the murine scRNA-seq dataset (A) and of the human macrophages obtained from carotid artery plaques of patients undergoing carotid endarterectomy (B). Identification of macrophage subtypes using the previously determined gene signature for mouse (C) and human (D) datasets. UMAP of macrophages from mouse dataset segregated by control (orange) and arsenic-treated (blue) groups (E). UMAP of macrophages from human dataset segregated by their origin—plaques of asymptomatic (orange) and symptomatic (blue) patients (F). Alignment of the mouse resident-like macrophages 4 (arsenic-treated) and 10 (control) with those of human datasets 7 (symptomatic) and 6 (asymptomatic), supported by the scRNA-seq dataset in our study, which is deposited in the GEO database under accession number GSE240753 (G). Note: UMAP, uniform manifold approximation and projection.
Discussion
This study marks the first, to our knowledge, multi-omics analysis to investigate the pro-atherogenic effects of arsenic on atherosclerotic plaques at the single-cell level. Focusing on the diversity of leukocytes within atherosclerotic plaques of male ApoE–/– mice fed a high-fat diet, we utilized scRNA-seq and scATAC-seq to explore how arsenic influences the cellular landscape. Our findings corroborate the cellular heterogeneity reported in previous studies,18,19 validating the reproducibility of our methods across different research settings.
The distinctive contributions of our study in delineating the pro-atherogenic effects of arsenic at a multi-omics, single-cell level are multifaceted and enrich the current understanding of atherosclerosis, as well as how arsenic influences the cellular constituents of the plaque.
Unprecedented Resolution of Cellular Heterogeneity
Our research provides a detailed account of the diversity among leukocytes populating atherosclerotic plaques. By employing scRNA-seq and scATAC-seq, we have highlighted how arsenic influences the cellular environment within plaques. Our findings are consistent with prior studies23,25,28,63 that observed similar cell types, suggesting that our methods effectively captured cellular heterogeneity. Besides, our findings suggest that arsenic had little effect on the percentage of cell types within the plaque, with the exception of resident-like macrophages. However, arsenic significantly altered the composition of macrophage populations.
Arsenic’s Differential Impact on Macrophage Subtypes
We broadly identified resident-like and foam cell–like macrophages, which correspond to the adventitia-resident and lipid-related foamy macrophages as reviewed in Yu et al.64 Cluster 3 in our study showed duality with the macrophage subtype described in the review. However, other subtypes reported in the review were not delineated in our study. The percentage of plaque-resident macrophages remained consistent, but the data suggest that arsenic altered the gene expression profiles of resident- and foam cell–like macrophages, which may influence their cellular trajectories and interactions within the plaque microenvironment. Our data suggest that arsenic treatment increased the heterogeneity of the foam-like cells within the plaque. Interestingly, our data suggest that arsenic affected the resident-like and foam cell–like macrophages in distinct fashions, a finding similar to our work in polarized macrophages exposed in vitro to arsenic.20 This nuanced delineation not only highlights the susceptibility of specific macrophage populations to arsenic but also suggests a dual mode of action whereby arsenic differentially affects these cells. This is further supported by the comparative analysis with human plaque data indicating a link between arsenic-enriched macrophages and symptomatic atherosclerotic conditions. When compared to a scRNA-seq dataset from human plaques, the gene signature of arsenic-enriched resident macrophages in our study corresponded to those of symptomatic rather than asymptomatic patients. While interesting, it is important to note that these findings are correlational and that further studies with larger sample sizes are necessary to confirm this relationship definitively.
Elucidation of Epigenetic Mechanisms
Arsenic significantly altered the chromatin accessibility profile of the atherosclerotic plaques as implicated in our scATAC-seq dataset, suggesting epigenetic change as a potential mechanism of arsenic-mediated adverse atherosclerotic outcomes. Arsenic is a known epigenetic modulator resulting in DNA methylation, histone modifications, and microRNA changes.65 For instance, Domingo-Relloso et al.66 reported a consortium of genomic positions differentially methylated by arsenic exposure in human blood from the Strong Heart Study cohort associated with cardiovascular disease, and a proportion of these genes were also expressed differentially in mouse model of atherosclerosis as a result of arsenic exposure.
Insights into Transcriptional Regulation
Chromatin accessibility is strongly linked to DNA methylation. Increased DNA methylation leads to chromatin compaction and reduced accessibility for transcription factors, hindering their binding and impacting gene regulation.67–69 Consequently, low-methylated regions are typically observed in the promoters and enhancers of active genes, allowing for transcriptional activity. We show such changes in chromosome accessibility in the target genes of transcriptional factors such as IRF1 and POU2F1, which may alter the binding of these transcription factors in resident macrophages. Interferon regulatory factor 1 (IRF1) is an essential component of the interferon signaling cascade and an important modulator of macrophage function.70 While POU2F1 is not directly related to atherosclerosis, there is in vivo evidence of its correlation with myocardial fibrosis, a corollary of atherosclerotic ischemic disease in mouse71,72 studies and with diabetes, a metabolic disease closely associated with atherosclerosis, in human73 dataset. This distinct response to arsenic, coupled with the identification of affected pathways like chemokine signaling, illustrates the complex interplay between arsenic exposure and macrophage functionality, potentially reshaping their role within the plaque microenvironment. In addition, the prediction of important cellular interactions highlights nodes of potential importance (i.e., cytokine signaling and/or the Spp1 preferred usage of Cd44 or integrins receptors based on exposure). While confirmation is needed on the protein level, the hypothesis that these interactions are important mediators of arsenic-induced atherosclerosis can be tested.
Advancement of Multi-Omics Measurements
By leveraging 10× multiome sequencing, our study adds a significant layer of complexity to the understanding of immune cell populations’ responses to arsenic toxicity. This approach, profiling paired single-cell RNA-seq and ATAC-seq data from the same cell, enabled a comprehensive characterization of the transcriptome and epigenome, offering unprecedented insights into the effects of arsenic on various immune cell populations. Together, these contributions underscore the intricacy of arsenic’s impact on atherosclerosis and illuminate potential pathways for therapeutic intervention and public health strategies to mitigate the cardiovascular risks associated with environmental arsenic exposure. The complexity of cellular state changes goes beyond the scope of a single modality, as even cells with similar transcriptomes can have dramatically different epigenomes.
The data herein are hypothesis generating but have certain limitations. To address our primary research objective—investigating the impact of arsenic toxicity on diverse immune cell populations—we strategically relied on the gene expression of classical markers for annotating the cell populations. This approach was favored over multimodal clustering of cells, which relies on learned joint cell embeddings inferred from multimodal data integration methods such as scGlue.29 The latter presents a potential drawback: lack of biological interpretability. In contrast, we prioritized annotating immune cell populations based on well-established biomarkers at the transcriptome level. While this approach enhances interpretability and relevance to previous studies of this kind, it potentially simplifies the complex diversity present within immune cell populations. Therefore, future work could involve a joint analysis using multi-omics integration tools like scGlue29 to further explore the data and present complementary perspectives on cellular dynamics. Furthermore, our analysis focused on the cellular heterogeneity of immune cells in arsenic-exposed ApoE–/– male mice maintained on a high-fat diet. Factors such as sex, diet, duration of exposure, lesion localization, sample handling (e.g., preparation and sorting), and the potential exclusion of sensitive cell types during processing should be meticulously considered in designing future experiments. Notably, our investigation did not resolve specific macrophage populations known to inhabit plaques, such as those exhibiting inflammatory or interferon-inducible characteristics. In addition, there is limited power for those small cell populations, in our case B or T lymphocytes, despite our immune-enrichment protocol. This selective focus enriched for immune cell types at the cost of potentially overlooking other critical cell populations, including endothelial and smooth muscle cells, despite their known interactions with immune cells. Additionally, while single-cell sequencing offers detailed insights into cellular composition, it inherently lacks the capacity to provide spatial context, therefore, limiting the examinations of the cellular interactions between cell populations. Nevertheless, our study lays the groundwork for integrating gene expression data with immunohistochemical studies and asks topological questions.
This study advances our understanding of the complex interplay between environmental arsenic exposure and atherosclerosis, highlighting the role of macrophage populations and the epigenetic shifts induced by arsenic. By employing high-resolution single-cell multi-omics techniques, we have elucidated the differential effects of arsenic on macrophage subtypes, providing computational evidence of specific epigenetic and transcriptional changes that contribute to the pathogenesis of atherosclerosis. Our insights into the modulation of key transcription factors and the identification of critical molecular pathways offer new avenues for targeted therapeutic interventions and enhance the precision of cardiovascular disease models. Moreover, the study underscores the importance of addressing cellular heterogeneity and the limitations of current methodologies in fully capturing the dynamic interactions within atherosclerotic plaques. Future studies should focus on variables that enhance or protect from arsenic-induced atherosclerosis in order to narrow down the specific changes associated with modulation of pathogenesis, thus, highlighting molecular targets for interventional strategies.
Supplementary Material
Acknowledgments
Conceptualization: K.M., S.L., J.D., and K.K.M.; Methodology: X.Y., K.M., N.S., N.G., F.D., T.E., J.D., H.W., and K.K.M.; Investigation: K.M., X.Y., J.D., and K.K.M.; Visualization: X.Y., K.M., J.D., and K.K.M.; Supervision: H.W., S.L., J.D., and K.K.M.; Writing—original draft: K.M., X.Y., J.D., and K.K.M.; Writing—review & editing: K.M., X.Y., S.L., J.D., and K.K.M.
The authors acknowledge Yvhans Chery, Kathy Forner, and Christian Young from the Lady Davis Institute of Medicine Research for their assistance in the initial stages of the experiment: animal handling and sample collection.
Sources of Funding: Fonds de Reserche du Québec - Santé (K.M.); Canadian Institutes of Health Research (CIHR) (PJT-186223 to S.L., PJT-180505 to J.D., and PJT-166142 to K.K.M.); Heart and Stroke Foundation of Canada (G-23-0034943 to K.K.M. and J.D.); Fonds de recherche du Québec - Santé (FRQS) (295298 to J.D. and 295299 to J.D.); Natural Sciences and Engineering Research Council of Canada (NSERC) (RGPIN2022-04399 to J.D.); Meakins-Christie Chair in Respiratory Research (J.D.); National Natural Science Foundation of China (62272278 and 61972322 to H.W.); National Key Research and Development Program (2021YFF0704103 to H.W.); Fundamental Research Funds of Shandong University (H.W.).
All data needed to evaluate the conclusions in the paper are present in the paper and/or the supplementary materials. The raw data from scRNA-seq and multi-omics experiments and the processed data have been uploaded to GEO with the accession number GSE240753. The source code for process and analysis has been deposited in Zenodo at https://doi.org/10.5281/zenodo.8286739 and in GitHub at https://github.com/mcgilldinglab/Arsenic_Toxicity_Single-Cell_Multi-Omics_Profiling. The visualization website results of scdiff2 have been deposited in Zenodo at https://doi.org/10.5281/zenodo.8305486.
Conclusions and opinions are those of the individual authors and do not necessarily reflect the policies or views of EHP Publishing or the National Institute of Environmental Health Sciences.
References
- 1.Chen QY, Costa M. 2021. Arsenic: a global environmental challenge. Annu Rev Pharmacol Toxicol 61:47–63, PMID: 33411580, 10.1146/annurev-pharmtox-030220-013418. [DOI] [PubMed] [Google Scholar]
- 2.IARC Working Group on the Evaluation of Carcinogenic Risks to Humans. 2012. Arsenic, metals, fibres, and dusts. IARC Monogr Eval Carcinog Risks Hum 100(Pt C):11–465. [PMC free article] [PubMed] [Google Scholar]
- 3.Wang C-H, Jeng J-S, Yip P-K, Chen C-L, Hsu L-I, Hsueh Y-M, et al. 2002. Biological gradient between long-term arsenic exposure and carotid atherosclerosis. Circulation 105(15):1804–1809, PMID: 11956123, 10.1161/01.cir.0000015862.64816.b2. [DOI] [PubMed] [Google Scholar]
- 4.Kuo C-C, Moon KA, Wang S-L, Silbergeld E, Navas-Acien A. 2017. The association of arsenic metabolism with cancer, cardiovascular disease, and diabetes: a systematic review of the epidemiological evidence. Environ Health Perspect 125(8):087001, PMID: 28796632, 10.1289/EHP577. [DOI] [PMC free article] [PubMed] [Google Scholar]
- 5.Mateen FJ, Grau-Perez M, Pollak JS, Moon KA, Howard BV, Umans JG, et al. 2017. Chronic arsenic exposure and risk of carotid artery disease: the strong heart study. Environ Res 157:127–134, PMID: 28554006, 10.1016/j.envres.2017.05.020. [DOI] [PMC free article] [PubMed] [Google Scholar]
- 6.Velmurugan G, Swaminathan K, Mohanraj S, Dhivakar M, Veerasekar G, Alexander T, et al. 2020. Association of co-accumulation of arsenic and organophosphate insecticides with diabetes and atherosclerosis in a rural agricultural community: KMCH-NNCD-I study. Acta Diabetol 57(10):1159–1168, PMID: 32314019, 10.1007/s00592-020-01516-6. [DOI] [PubMed] [Google Scholar]
- 7.Lisabeth LD, Ahn HJ, Chen JJ, Sealy-Jefferson S, Burke JF, Meliker JR. 2010. Arsenic in drinking water and stroke hospitalizations in Michigan. Stroke 41(11):2499–2504, PMID: 20947858, 10.1161/STROKEAHA.110.585281. [DOI] [PubMed] [Google Scholar]
- 8.Medrano MAJ, Boix R, Pastor-Barriuso R, Palau M, Damián J, Ramis R, et al. 2010. Arsenic in public water supplies and cardiovascular mortality in Spain. Environ Res 110(5):448–454, PMID: 19880104, 10.1016/j.envres.2009.10.002. [DOI] [PubMed] [Google Scholar]
- 9.Ross R, Glomset J, Harker L. 1977. Response to injury and atherogenesis. Am J Pathol 86(3):675–684, PMID: 842616. [PMC free article] [PubMed] [Google Scholar]
- 10.Hansson GK. 2005. Inflammation, atherosclerosis, and coronary artery disease. N Engl J Med 352(16):1685–1695, PMID: 15843671, 10.1056/NEJMra043430. [DOI] [PubMed] [Google Scholar]
- 11.Hansson GK, Hermansson A. 2011. The immune system in atherosclerosis. Nat Immunol 12(3):204–212, PMID: 21321594, 10.1038/ni.2001. [DOI] [PubMed] [Google Scholar]
- 12.Koltsova EK, Garcia Z, Chodaczek G, Landau M, McArdle S, Scott SR, et al. 2012. Dynamic T cell-APC interactions sustain chronic inflammation in atherosclerosis. J Clin Invest 122(9):3114–3126, PMID: 22886300, 10.1172/JCI61758. [DOI] [PMC free article] [PubMed] [Google Scholar]
- 13.Ammirati E, Moroni F, Magnoni M, Camici PG. 2015. The role of T and B cells in human atherosclerosis and atherothrombosis. Clin Exp Immunol 179(2):173–187, PMID: 25352024, 10.1111/cei.12477. [DOI] [PMC free article] [PubMed] [Google Scholar]
- 14.Nahrendorf M, Swirski FK. 2016. Abandoning M1/M2 for a network model of macrophage function. Circ Res 119(3):414–417, PMID: 27458196, 10.1161/CIRCRESAHA.116.309194. [DOI] [PMC free article] [PubMed] [Google Scholar]
- 15.Dangleben NL, Skibola CF, Smith MT. 2013. Arsenic immunotoxicity: a review. Environ Health 12(1):73, PMID: 24004508, 10.1186/1476-069X-12-73. [DOI] [PMC free article] [PubMed] [Google Scholar]
- 16.Padovani AM, Molina MF, Mann KK. 2010. Inhibition of liver X receptor/retinoid X receptor-mediated transcription contributes to the proatherogenic effects of arsenic in macrophages in vitro. Arterioscler Thromb Vasc Biol 30(6):1228–1236, PMID: 20339114, 10.1161/ATVBAHA.110.205500. [DOI] [PubMed] [Google Scholar]
- 17.Haque R, Chaudhary A, Sadaf N. 2017. Immunomodulatory role of arsenic in regulatory T cells. Endocr Metab Immune Disord Drug Targets 17(3):176–181, PMID: 28820073, 10.2174/1871530317666170818114454. [DOI] [PubMed] [Google Scholar]
- 18.Lemaire M, Lemarié CA, Molina MF, Schiffrin EL, Lehoux S, Mann KK. 2011. Exposure to moderate arsenic concentrations increases atherosclerosis in ApoE–/– mouse model. Toxicol Sci 122(1):211–221, PMID: 21512104, 10.1093/toxsci/kfr097. [DOI] [PMC free article] [PubMed] [Google Scholar]
- 19.Makhani K, Chiavatti C, Plourde D, Negro Silva LF, Lemaire M, Lemarié CA, et al. 2018. Using the apolipoprotein E knock-out mouse model to define atherosclerotic plaque changes induced by low dose arsenic. Toxicol Sci 166(1):213–218, PMID: 30376133, 10.1093/toxsci/kfy201. [DOI] [PubMed] [Google Scholar]
- 20.Makhani K, Chiavatti C, Negro Silva LF, Lemaire M, Bolt AM, De Jay N, et al. 2023. Arsenic causes distinct gene expression changes in macrophages polarized in vitro with either interferon-gamma or interleukin-4. Toxicol Sci 192(1):83–96, PMID: 36617169, 10.1093/toxsci/kfad001. [DOI] [PubMed] [Google Scholar]
- 21.Williams JW, Winkels H, Durant CP, Zaitsev K, Ghosheh Y, Ley K. 2020. Single cell RNA sequencing in atherosclerosis research. Circ Res 126(9):1112–1126, PMID: 32324494, 10.1161/CIRCRESAHA.119.315940. [DOI] [PMC free article] [PubMed] [Google Scholar]
- 22.Zhou W-M, Yan Y-Y, Guo Q-R, Ji H, Wang H, Xu T-T, et al. 2021. Microfluidics applications for high-throughput single cell sequencing. J Nanobiotechnology 19(1):312, PMID: 34635104, 10.1186/s12951-021-01045-6. [DOI] [PMC free article] [PubMed] [Google Scholar]
- 23.Zernecke A, Winkels H, Cochain C, Williams JW, Wolf D, Soehnlein O, et al. 2020. Meta-analysis of leukocyte diversity in atherosclerotic mouse aortas. Circ Res 127(3):402–426, PMID: 32673538, 10.1161/CIRCRESAHA.120.316903. [DOI] [PMC free article] [PubMed] [Google Scholar]
- 24.Jawień J, Nastałek P, Korbut R. 2004. Mouse models of experimental atherosclerosis. J Physiol Pharmacol 55(3):503–517, PMID: 15381823. [PubMed] [Google Scholar]
- 25.Cochain C, Vafadarnejad E, Arampatzi P, Pelisek J, Winkels H, Ley K, et al. 2018. Single-cell RNA-seq reveals the transcriptional landscape and heterogeneity of aortic macrophages in murine atherosclerosis. Circ Res 122(12):1661–1674, PMID: 29545365, 10.1161/CIRCRESAHA.117.312509. [DOI] [PubMed] [Google Scholar]
- 26.Lin J-D, Nishi H, Poles J, Niu X, Mccauley C, Rahman K, et al. 2019. Single-cell analysis of fate-mapped macrophages reveals heterogeneity, including stem-like properties, during atherosclerosis progression and regression. JCI Insight 4(4):e124574, 10.1172/jci.insight.124574. [DOI] [PMC free article] [PubMed] [Google Scholar]
- 27.Sica A, Mantovani A. 2012. Macrophage plasticity and polarization: in vivo veritas. J Clin Invest 122(3):787–795, PMID: 22378047, 10.1172/JCI59643. [DOI] [PMC free article] [PubMed] [Google Scholar]
- 28.Nativio R, Lan Y, Donahue G, Sidoli S, Berson A, Srinivasan AR, et al. 2020. An integrated multi-omics approach identifies epigenetic alterations associated with Alzheimer’s disease. Nat Genet 52(10):1024–1035, PMID: 32989324, 10.1038/s41588-020-0696-0. [DOI] [PMC free article] [PubMed] [Google Scholar]
- 29.Cao ZJ, Gao G. 2022. Multi-omics single-cell data integration and regulatory inference with graph-linked embedding. Nat Biotechnol 40(10):1458–1466, PMID: 35501393, 10.1038/s41587-022-01284-4. [DOI] [PMC free article] [PubMed] [Google Scholar]
- 30.Wolf FA, Angerer P, Theis FJ. 2018. SCANPY: large-scale single-cell gene expression data analysis. Genome Biol 19(1):15, PMID: 29409532, 10.1186/s13059-017-1382-0. [DOI] [PMC free article] [PubMed] [Google Scholar]
- 31.McInnes L, Healy J, Melville J. 2020. UMAP: uniform manifold approximation and projection for dimension reduction. arXiv. Preprint posted online 18 September 2020, 10.48550/arXiv.1802.03426. [DOI] [Google Scholar]
- 32.Traag VA, Waltman L, van Eck NJ. 2019. From Louvain to Leiden: guaranteeing well-connected communities. Sci Rep 9(1):5233, PMID: 30914743, 10.1038/s41598-019-41695-z. [DOI] [PMC free article] [PubMed] [Google Scholar]
- 33.Hasanaj E, Wang J, Sarathi A, Ding J, Bar-Joseph Z. 2022. Interactive single-cell data analysis using cellar. Nat Commun 13(1):1998, PMID: 35422041, 10.1038/s41467-022-29744-0. [DOI] [PMC free article] [PubMed] [Google Scholar]
- 34.Zhang X, Lan Y, Xu J, Quan F, Zhao E, Deng C, et al. 2019. CellMarker: a manually curated resource of cell markers in human and mouse. Nucleic Acids Res 47(D1):D721–D728, PMID: 30289549, 10.1093/nar/gky900. [DOI] [PMC free article] [PubMed] [Google Scholar]
- 35.Subramanian A, Tamayo P, Mootha VK, Mukherjee S, Ebert BL, Gillette MA, et al. 2005. Gene set enrichment analysis: a knowledge-based approach for interpreting genome-wide expression profiles. Proc Natl Acad Sci U S A 102(43):15545–15550, PMID: 16199517, 10.1073/pnas.0506580102. [DOI] [PMC free article] [PubMed] [Google Scholar]
- 36.Plaisier SB, Taschereau R, Wong JA, Graeber TG. 2010. Rank-rank hypergeometric overlap: identification of statistically significant overlap between gene-expression signatures. Nucleic Acids Res 38(17):e169, PMID: 20660011, 10.1093/nar/gkq636. [DOI] [PMC free article] [PubMed] [Google Scholar]
- 37.Kanehisa M, Goto S. 2000. KEGG: Kyoto encyclopedia of genes and genomes. Nucleic Acids Res 28(1):27–30, PMID: 10592173, 10.1093/nar/28.1.27. [DOI] [PMC free article] [PubMed] [Google Scholar]
- 38.Liao Y, Wang J, Jaehnig EJ, Shi Z, Zhang B. 2019. WebGestalt 2019: gene set analysis toolkit with revamped UIs and APIs. Nucleic Acids Res 47(W1):W199–W205, PMID: 31114916, 10.1093/nar/gkz401. [DOI] [PMC free article] [PubMed] [Google Scholar]
- 39.Wang J, Duncan D, Shi Z, Zhang B. 2013. WEB-based GEne SeT AnaLysis Toolkit (WebGestalt): update 2013. Nucleic Acids Res 41(W1):W77–83, PMID: 23703215, 10.1093/nar/gkt439. [DOI] [PMC free article] [PubMed] [Google Scholar]
- 40.La Manno G, Soldatov R, Zeisel A, Braun E, Hochgerner H, Petukhov V, et al. 2018. RNA velocity of single cells. Nature 560(7719):494–498, PMID: 30089906, 10.1038/s41586-018-0414-6. [DOI] [PMC free article] [PubMed] [Google Scholar]
- 41.Ding J, Aronow BJ, Kaminski N, Kitzmiller J, Whitsett JA, Bar-Joseph Z. 2018. Reconstructing differentiation networks and their regulation from time series single-cell expression data. Genome Res 28(3):383–395, PMID: 29317474, 10.1101/gr.225979.117. [DOI] [PMC free article] [PubMed] [Google Scholar]
- 42.Jin S, Guerrero-Juarez CF, Zhang L, Chang I, Ramos R, Kuan C-H, et al. 2021. Inference and analysis of cell-cell communication using CellChat. Nat Commun 12(1):1088, PMID: 33597522, 10.1038/s41467-021-21246-9. [DOI] [PMC free article] [PubMed] [Google Scholar]
- 43.Huppert TJ, Diamond SG, Franceschini MA, Boas DA. 2009. HomER: a review of time-series analysis methods for near-infrared spectroscopy of the brain. Appl Opt 48(10):D280–D298, PMID: 19340120, 10.1364/ao.48.00d280. [DOI] [PMC free article] [PubMed] [Google Scholar]
- 44.Gitter A, Bar-Joseph Z. 2016. The SDREM method for reconstructing signaling and regulatory response networks: applications for studying disease progression. Methods Mol Biol 1303:493–506, PMID: 26235087, 10.1007/978-1-4939-2627-5_30. [DOI] [PubMed] [Google Scholar]
- 45.Shannon P, Markiel A, Ozier O, Baliga NS, Wang JT, Ramage D, et al. 2003. Cytoscape: a software environment for integrated models of biomolecular interaction networks. Genome Res 13(11):2498–2504, PMID: 14597658, 10.1101/gr.1239303. [DOI] [PMC free article] [PubMed] [Google Scholar]
- 46.Wang M, Zhao Y, Zhang B. 2015. Efficient test and visualization of multi-set intersections. Sci Rep 5:16923, PMID: 26603754, 10.1038/srep16923. [DOI] [PMC free article] [PubMed] [Google Scholar]
- 47.Chen S, Yan G, Zhang W, Li J, Jiang R, Lin Z. 2021. RA3 is a reference-guided approach for epigenetic characterization of single cells. Nat Commun 12(1):2177, PMID: 33846355, 10.1038/s41467-021-22495-4. [DOI] [PMC free article] [PubMed] [Google Scholar]
- 48.Sun Z, Tang Y, Zhang Y, Fang Y, Jia J, Zeng W, et al. 2021. Joint single-cell multiomic analysis in Wnt3a induced asymmetric stem cell division. Nat Commun 12(1):5941, PMID: 34642323, 10.1038/s41467-021-26203-0. [DOI] [PMC free article] [PubMed] [Google Scholar]
- 49.Bravo González-Blas C, Minnoye L, Papasokrati D, Aibar S, Hulselmans G, Christiaens V, et al. 2019. cisTopic: cis-regulatory topic modeling on single-cell ATAC-seq data. Nat Methods 16(5):397–400, 10.1038/s41592-019-0367-1. [DOI] [PMC free article] [PubMed] [Google Scholar]
- 50.Hie B, Bryson B, Berger B. 2019. Efficient integration of heterogeneous single-cell transcriptomes using Scanorama. Nat Biotechnol 37(6):685–691, PMID: 31061482, 10.1038/s41587-019-0113-3. [DOI] [PMC free article] [PubMed] [Google Scholar]
- 51.Huang W, Loganantharaj R, Schroeder B, Fargo D, Li L. 2013. Pavis: a tool for peak annotation and visualization. Bioinformatics 29(23):3097–3099, PMID: 24008416, 10.1093/bioinformatics/btt520. [DOI] [PMC free article] [PubMed] [Google Scholar]
- 52.Chen J, Bardes EE, Aronow BJ, Jegga AG. 2009. ToppGene suite for gene list enrichment analysis and candidate gene prioritization. Nucleic Acids Res 37(suppl 2):W305–W311, PMID: 19465376, 10.1093/nar/gkp427. [DOI] [PMC free article] [PubMed] [Google Scholar]
- 53.Barnett DW, Garrison EK, Quinlan AR, Strömberg MP, Marth GT. 2011. BamTools: a C++ API and toolkit for analyzing and managing BAM files. Bioinformatics 27(12):1691–1692, PMID: 21493652, 10.1093/bioinformatics/btr174. [DOI] [PMC free article] [PubMed] [Google Scholar]
- 54.Ramírez F, Dündar F, Diehl S, Grüning BA, Manke T. 2014. deepTools: a flexible platform for exploring deep-sequencing data. Nucleic Acids Res 42(W1):W187–W191, 10.1093/nar/gku365. [DOI] [PMC free article] [PubMed] [Google Scholar]
- 55.Thorvaldsdottir H, Robinson JT, Mesirov JP. 2013. Integrative genomics viewer (IGV): high-performance genomics data visualization and exploration. Brief Bioinform 14(2):178–192, PMID: 22517427, 10.1093/bib/bbs017. [DOI] [PMC free article] [PubMed] [Google Scholar]
- 56.Fernandez DM, Rahman AH, Fernandez NF, Chudnovskiy A, Amir ED, Amadori L, et al. 2019. Single-cell immune landscape of human atherosclerotic plaques. Nat Med 25(10):1576–1588. PMC], PMID: 31591603, 10.1038/s41591-019-0590-4. [DOI] [PMC free article] [PubMed] [Google Scholar]
- 57.Sayers EW, Beck J, Bolton EE, Bourexis D, Brister JR, Canese K, et al. 2021. Database resources of the National Center for Biotechnology Information. Nucleic Acids Res 49(D1):D10–D17, PMID: 33095870, 10.1093/nar/gkaa892. [DOI] [PMC free article] [PubMed] [Google Scholar]
- 58.Willemsen L, de Winther MP. 2020. Macrophage subsets in atherosclerosis as defined by single-cell technologies. J Pathol 250(5):705–714, PMID: 32003464, 10.1002/path.5392. [DOI] [PMC free article] [PubMed] [Google Scholar]
- 59.Uddin MR, Howe G, Zeng X, Xu M. 2022. Harmony: a generic unsupervised approach for disentangling semantic content from parameterized transformations. In: IEEE/CVF Conference on Computer Vision and Pattern Recognition (CVPR), 18–24 June 2022. New Orleans, LA: IEEE, 20646–20655. [DOI] [PMC free article] [PubMed] [Google Scholar]
- 60.Hao Y, Hao S, Andersen-Nissen E, Mauck WM, Zheng S, Butler A, et al. 2021. Integrated analysis of multimodal single-cell data. Cell 184(13):3573–3587, PMID: 34062119, 10.1016/j.cell.2021.04.048. [DOI] [PMC free article] [PubMed] [Google Scholar]
- 61.Yin L, Yu X. 2018. Arsenic-induced apoptosis in the p53-proficient and p53-deficient cells through differential modulation of NFkB pathway. Food Chem Toxicol 118:849–860, PMID: 29944914, 10.1016/j.fct.2018.06.053. [DOI] [PMC free article] [PubMed] [Google Scholar]
- 62.Stepanyan A, Petrackova A, Hakobyan S, Savara J, Davitavyan S, Kriegova E, et al. 2023. Long-term environmental metal exposure is associated with hypomethylation of CpG sites in NFKB1 and other genes related to oncogenesis. Clin Epigenetics 15(1):126, PMID: 37550793, 10.1186/s13148-023-01536-3. [DOI] [PMC free article] [PubMed] [Google Scholar]
- 63.Winkels H, Wolf D. 2021. Heterogeneity of T cells in atherosclerosis defined by single-cell RNA-sequencing and cytometry by time of flight. Arterioscler Thromb Vasc Biol 41(2):549–563, PMID: 33267666, 10.1161/ATVBAHA.120.312137. [DOI] [PMC free article] [PubMed] [Google Scholar]
- 64.Yu L, Zhang Y, Liu C, Wu X, Wang S, Sui W, et al. 2023. Heterogeneity of macrophages in atherosclerosis revealed by single-cell RNA sequencing. FASEB J 37(3):e22810, PMID: 36786718, 10.1096/fj.202201932RR. [DOI] [PubMed] [Google Scholar]
- 65.Chakraborty A, Ghosh S, Biswas B, Pramanik S, Nriagu J, Bhowmick S. 2022. Epigenetic modifications from arsenic exposure: a comprehensive review. Sci Total Environ 810:151218, PMID: 34717984, 10.1016/j.scitotenv.2021.151218. [DOI] [PubMed] [Google Scholar]
- 66.Domingo-Relloso A, Makhani K, Riffo-Campos AL, Tellez-Plaza M, Klein KO, Subedi P, et al. 2022. Arsenic exposure, blood DNA methylation, and cardiovascular disease. Circ Res 131(2):e51–e69, PMID: 35658476, 10.1161/CIRCRESAHA.122.320991. [DOI] [PMC free article] [PubMed] [Google Scholar]
- 67.Yin Y, Morgunova E, Jolma A, Kaasinen E, Sahu B, Khund-Sayeed S, et al. 2017. Impact of cytosine methylation on DNA binding specificities of human transcription factors. Science 356(6337):aaj2239, 10.1126/science.aaj2239. [DOI] [PMC free article] [PubMed] [Google Scholar]
- 68.Kribelbauer JF, Lu X-J, Rohs R, Mann RS, Bussemaker HJ. 2020. Toward a mechanistic understanding of DNA methylation readout by transcription factors. J Mol Biol 432(6):1801–1815, PMID: 31689433, 10.1016/j.jmb.2019.10.021. [DOI] [PMC free article] [PubMed] [Google Scholar]
- 69.Blattler A, Farnham PJ. 2013. Cross-talk between site-specific transcription factors and DNA methylation states. J Biol Chem 288(48):34287–34294, PMID: 24151070, 10.1074/jbc.R113.512517. [DOI] [PMC free article] [PubMed] [Google Scholar]
- 70.Dror N, Alter-Koltunoff M, Azriel A, Amariglio N, Jacob-Hirsch J, Zeligson S, et al. 2007. Identification of IRF-8 and IRF-1 target genes in activated macrophages. Mol Immunol 44(4):338–346, PMID: 16597464, 10.1016/j.molimm.2006.02.026. [DOI] [PubMed] [Google Scholar]
- 71.Feng N, Yu H, Wang Y, Zhang Y, Xiao HAN, Gao WEI. 2023. Exercise training attenuates angiotensin II-induced cardiac fibrosis by reducing POU2F1 expression. J Sport Health Sci 12(4):464–476, PMID: 36374849, 10.1016/j.jshs.2022.10.004. [DOI] [PMC free article] [PubMed] [Google Scholar]
- 72.Orlandi A, Francesconi A, Marcellini M, Ferlosio A, Spagnoli LG. 2004. Role of ageing and coronary atherosclerosis in the development of cardiac fibrosis in the rabbit. Cardiovasc Res 64(3):544–552, PMID: 15537508, 10.1016/j.cardiores.2004.07.024. [DOI] [PubMed] [Google Scholar]
- 73.Batool A, Jahan N, Sun Y, Hanif A, Xue H. 2014. Genetic association of IDE, POU2F1, PON1, IL1alpha and IL1beta with type 2 diabetes in Pakistani population. Mol Biol Rep 41(5):3063–3069, PMID: 24477584, 10.1007/s11033-014-3165-y. [DOI] [PubMed] [Google Scholar]
Associated Data
This section collects any data citations, data availability statements, or supplementary materials included in this article.