

Abstract
Gut microbiota can regulate host brain functions and influence various physiological and pathological processes through the brain-gut axis. To systematically elucidate the intervention of different gut environments on different brain regions, we implemented an integrated approach that combines 11-plex DiLeu isobaric tags with a “BRIDGE” normalization strategy to comparatively analyze the proteome of six brain regions in germ-free (GF)- and conventionally raised (ConvR)-mice. A total of 5,945 proteins were identified and 5,656 were quantifiable, while 1,906 of them were significantly changed between GF- and ConvR-mice. 281 proteins were filtered with FC greater than 1.2 in at least one brain region, of which heatmap analysis showed clear protein profile disparities both between brain regions and gut microbiome conditions. Gut microbiome impact is most overt in the hypothalamus and the least in thalamus region. Collectively, this approach allows an in-depth investigation of the induced protein changes by multiple gut microbiome environments in a brain region- specific manner. This comprehensive proteomics work improves the understanding of brain region protein-association networks impacted by the gut microbiome and highlights the critical roles of brain-gut axis.
Keywords: Gut microbiota, DiLeu isobaric tag, Proteomics, Quantitation, Brain-gut regulation
Graphical Abstract:

INTRODUCTION
The gut microbiota-brain axis is a bidirectional communication system between the gut microbiota and central nervous system (CNS)1–2. Neurotransmitters such as serotonin and acetylcholine produced by the gut microbiota can influence the development of the nervous system through gut microbiota–brain axis, while it can also alter the level of pro- and anti-inflammatory cytokines to regulate host physiology, metabolism, immunity, and even behavior. At the same time, its own compositions can also be altered due to the two-way regulation of gut microbiota-brain axis. Gut microbiota dysbiosis may contribute to many behavioral and neurological disorders such as Alzheimer’s disease3–4, Parkinson’s disease5, depression6–7 and anxiety8–9. Therefore, normal function of the gut microbiota-brain axis is essential to the homeostasis of the nervous system, especially the CNS10.
Currently, the roles of microbiota in anxiety-related behaviors, impaired social cognition and stress responses, etc. have been widely investigated11–14. Studies have shown that a symbiotic gut-brain coregulatory axis can link the gut microbiota to neurogenic control in the hippocampus region14. In another study, several key brain regions, including amygdala, striatum, cerebellum, hippocampus and cortex were dissected and the gene expression were evaluated and compared, demonstrating that the microbiota was necessary for appropriate and dynamic regulation of myelin-related genes with clear implications on cortical myelination at an ultrastructural level15.
Proteomic analysis to study the intervention of gut microbiota on the proteome of different brain regions enables a global and systemic understanding of such regulation by gut microbiota-brain axis. Mass spectrometry (MS)-based approaches are powerful tools to identify thousands of proteins in complex samples and to precisely quantify protein expression between animals with different gut microbiota16. In our previous work, germ-free (GF)-mice were employed to investigate the relative changes in neuropeptides and proteins in the hypothalamus region compared to conventionally raised (ConvR)-mice. As expected, the functions of these altered neuropeptides and the pathways of the proteins involved were related to various essential behaviors, including brain development, memory, and learning17. In this work, N, N-dimethyl leucine (DiLeu) tags for quantitative proteomics analysis were utilized, which featured more compact structures and higher intensity of generated reporter ions compared to commercial tags such as tandem mass tags (TMT) and isobaric tags for relative and absolute quantification (iTRAQ). This novel design contributes to improved confidence in peptide identification and quantification, and the tags are more readily synthesized in-house with higher yields and lower cost18–20. The multiplexed isobaric tags allow multiple samples to be analyzed in a single assay, facilitating high-throughput quantification of thousands of proteins. When the number of samples exceeds the multiplexing capability, “BRIDGE” samples are often beneficial to more reliable quantification between batches. It has been reported that a total of 82 samples were quantitatively analyzed in 11 experiments using 10-plex TMT isobaric tags, of which two tags were used to label “BRIDGE” samples for normalization 21. Likewise, using iTRAQ tags, a “BRIDGE” sample was also introduced for sample analysis at two locations22. Inspired by this concept, we reason that introducing a “BRIDGE” sample as an internal reference could alleviate the variation when quantifying samples from batch to batch using DiLeu tags.
In this work, we developed a method based on 11-plex DiLeu tagging combined with the “BRIDGE” strategy to perform a comprehensively quantitative proteomic analysis of six brain regions in mice with distinct gut microbiota environments. Of these, DiLeu 118c was used to label the “BRIDGE” sample, and the other 10-plex DiLeu tags were used to label 5 GF- and 5 ConvR-mouse samples per brain region. The method developed in this work allows simultaneous profiling of protein changes in GF- and ConvR- mice from both the same and different brain regions. This work describes an effective strategy for high-throughput in-depth proteome profiling of the brain different gut microbiota environments and provides a comprehensive data resource for future neuroscience research.
EXPERIMENTAL SECTION
Chemicals and Reagents
All isotopic reagents used for DiLeu synthesis were purchased from Isotec (Miamisburg, OH, USA). Mass spectrometry-grade trypsin and dithiothreitol (DTT) were obtained from Promega (Madison, WI, USA). Ammonium bicarbonate, urea, dichloromethane (DCM), ACS grade methanol (MeOH), Optima UPLC grade ACN, Optima UPLC grade water and Optima LC/MS grade formic acid (FA) were purchased from Fisher Scientific (Pittsburgh, PA, USA). Sodium cyanoborohydride (NaBH3CN), formaldehyde (CH2O), L-leucine, hydrogen chloride gas (HCl), tris hydrochloride (tris HCl), trifluoroacetic acid (TFA), iodoacetamide (IAA), triethylammonium bicarbonate (TEAB), N, N-dimethylformamide (DMF), 4-(4,6-dimethoxy-1,3,5-triazin-2-yl)-4-methylmorpholinium tetrafluoroborate (DMTMM), N-methylmorpholine (NMM), heptafluorobutyric acid (HFBA), dimethyl sulfoxide (DMSO) and bovine serum albumin (BSA) were bought from Sigma-Aldrich (St. Louis, MO, USA). Hydroxylamine solution was purchased from Alfa Aesar (Ward Hill, MA, USA). DiLeu reagents were synthesized in the laboratory based on our previous work.
Animal Experiment, Tissue Extraction and DiLeu Labeling
Animal care and research protocols were approved by the UW–Madison Animal Care and Use Committee. Mice were housed in groups in temperature-controlled chambers with a 12-hour light: 12-hour dark cycle and received ad-libitum access to water and food. Mice were fed autoclaved LabDiet #5021 (Purina Mills, Inc. Richmond, IN). Twenty-one-week-old male C57BL/6 GF-mice and ConvR-mice (n=5/group) were euthanized by CO2 inhalation and bloodletting after 4-h of fasting. Their brains were dissected and subsequently heated rapidly by Denator™ to reduce postmortem degradation, after which the cortex, hippocampus, hypothalamus, spinal cord, striatum and thalamus regions were isolated, immediately snap frozen in liquid nitrogen, and stored at −80°C until analysis.
Brain tissues were lysed by sonication in the extraction buffer (4% SDS, 100 mM Tris/Base pH 8.0), and protein concentrations were determined by the BCA assay. After adding DTT to 10 mM, each sample containing 200 μg protein was incubated for 0.5 h at room temperature. The samples were then alkylated with 55 mM iodoacetamide (IAA) for 30 min in the dark, and the reaction was quenched by 5 mM DTT. Proteins were precipitated overnight by addition of 5.5 times the volumes of 80% acetone, then rinsed with 80% acetone and dried in air. Dried pellet was resuspended in 8 M urea, 30 mM NaCl, 50 mM Tris (pH = 8), 5 mM CaCl2 and a protease inhibitor cocktail tablet (Roche Diagnostics). The sample was sonicated in an ice-water bath for 20 min, centrifuged at 14,000 × g for 5 min, and the supernatant was collected. Afterwards, the supernatant was diluted with 50 mM Tris solution (pH = 8) to a urea concentration of less than 1 M. The protein was digested with trypsin at a protein/enzyme ratio of 50:1 for 16 h at 37°C. The digestion was quenched by adding 10% trifluoroacetic acid (TFA) to a pH lower than 3, followed by a desalting step using a SepPak C18 solid-phase extraction cartridge (Waters).
A detailed method for the syntheses of 11-Plex DiLeu tags was reported by Frost et al 20. The DiLeu labeling was performed as follows. Tags and peptide digests were added to the labeling solution in a 20:1 ratio by weight and vortexed for 2 h at room temperature. Equivalent amounts of digested peptides from 10 mice were pooled as internal reference. DiLeu reagents (115a, 115b, 116a, 116b, 116c, 117a, 117b, 117c, 118a, 118b, and 118c) were used to randomly label the digests from the different brain regions of GF-mice (labeled with 116a, 116b, 116c, 117a, and 117b) and ConvR-mice (labeled with 115a, 115b, 117c, 118a, and 118b), respectively. The internal reference was labeled with DiLeu reagent 118c, which was reserved for “BRIDGE” samples. Next, hydroxylamine at a concentration of 0.25% was added to quench the labeling reaction, and the peptide mixtures were pooled at the same ratio and dried down. The combined samples were acidified with HFBA to a concentration of 0.5% and washed with SCX SpinTips (Protea Biosciences, Morgantown, WV) to remove unreacted DiLeu reagent and reaction byproducts of the labeled peptides, and then pooled samples were divided into four fractions by high pH fractionation using C18 column (Phenomenex).
LC-MS Analysis
Samples analysis was performed using a Dionex Ultimate 3000 nanoLC system (Thermo Scientific) with a Q Exactive HF hybrid quadrupole-Orbitrap mass spectrometer (QE HF, Thermo Fisher Scientific, San Jose, CA). Labeled tryptic peptides were dried in vacuum and dissolved in water containing 3% ACN and 0.1% FA. Peptides were loaded onto a microcapillary column with an inner diameter of 75 μm made with an integrated emitter tip and packed with 15 cm of Bridged Ethylene Hybrid C18 particles (1.7 μm, 130 Å, Waters). Mobile phase A and B consisted of water containing 0.1% FA and ACN containing 0.1% FA, respectively. Gradient elution separation was performed over 120 min using 3% to 30% mobile phase B at a flow rate of 300 nL/min. A survey scan of peptide precursors from 300 to 1500 m/z was performed at RP 60,000 with an AGC target of 1 × 10⁶ and maximum IT of 100 ms. The top 10 precursors were then selected for HCD MS2 analysis at RP 60,000 with an isolation width of 2.0 Da, an NCE of 30, an AGC target of 1 × 10⁵ and a maximum IT of 100 ms. Precursors were dynamically excluded for 15 s with a tolerance of 10 ppm.
Data Analysis
The qualitative and quantitative analysis of DiLeu-labeled peptides was processed using MaxQuant (1.6.0.1). Raw files were searched in MaxQuant with the UniProt mouse complete database (February, 2023), selecting trypsin as the enzyme and allowing for two missed cleavages. The search was performed with a precursor mass tolerance of 25 ppm and a fragment mass tolerance of 0.03 Da. Static modifications included DiLeu tags on peptide N-termini (+145.12801 Da) and carbamidomethylation of cysteine residues (+57.02146 Da), while dynamic modifications included DiLeu labeling on lysine residues, oxidation of methionine residues (+15.99492 Da), deamidation of asparagine and glutamine residues (+0.98402 Da), and methylation of C termini and aspartic acid, glutamic acid, histidine, lysine, arginine, serine, and threonine residues (+14.01565 Da). Peptide-spectrum matches (PSMs) were validated using percolator against a 1% FDR (false discovery rate) based on q-values.
Peptide quantitation was performed using MaxQuant with a reporter ion integration tolerance of 20 ppm for the most confident centroid. Only PSMs containing all 11 reporter ions were considered and a minimum of one quantified peptide was used to determine the quantitative ratios of the protein. Proteomic reporter ion ratio values were exported to Excel workbook format (Redmond, CA). The UniProt Gene Ontology Annotation database (http://www.ebi.ac.uk/GOA/) was used.
The intensity of proteins in “BRIDGE” samples is specified as 100. In the same brain region, the intensity of proteins is calculated as (IntensitySamples/IntensityBRIDGE) × 100, i.e. the relative intensity of proteins in each sample can be normalized by the intensity of the “BRIDGE” sample labeled with the DiLeu 118c reagent. Thus, the average value of the quantified proteins can be calculated from the normalization of the independent BRIDGE-samples. Quantification of normalized proteins from different samples was analyzed by Excel and SPSS 16.0 software. The student’s t-test (two-tailed) was performed for comparisons between two independent groups of samples. A p-value of < 0.05 was considered statistically significant.
RESULTS AND DISCUSSION
Schematic illustration of BRIDGE-based multiplexed quantification of proteins in six brain regions
Bottom-up proteomics sample preparation was used in the workflow for BRIDGE-based 11-plex quantification of proteins from six brain regions as shown in Figure 1. Proteins were extracted from brain tissues and digested into shorter peptides, which were then labeled with DiLeu isobaric tags. GF-mice were labeled with 5-plex DiLeu tags and all six brain regions of each mouse were labeled with the same DiLeu tag. ConvR-mice were labeled with the other 5-plex DiLeu tags in the same way. Thus, a total of 60 brain samples from 5 GF-mice and 5 ConvR-mice were labeled with 10-plex DiLeu tags. To prepare “BRIDGE” reference sample, 60 trypsin-digested brain samples were first pooled in equal amounts and labeled with the 11th DiLeu tag, and then this pooled sample was equally divided into 6 portions, each of which was added to the samples from each brain region as “BRIDGE”. Afterwards, samples from the same brain region were combined and fractionated for analysis by QE-HF. The abundance of 10-plex tags normalized based on the 11th DiLeu tag (118c, BRIDGE) could be used for protein quantification in different brain regions. Using the proposed scheme, we achieved simultaneous analysis of the proteome of all brain regions in GF- and ConvR-mice, which helps to reveal the proteome changes in different brain regions under different gut microbiota environments. This study further elucidates the effects of gut microbiome changes on the regulation of brain functions, including memory, learning, circadian rhythm, etc.
Figure 1.
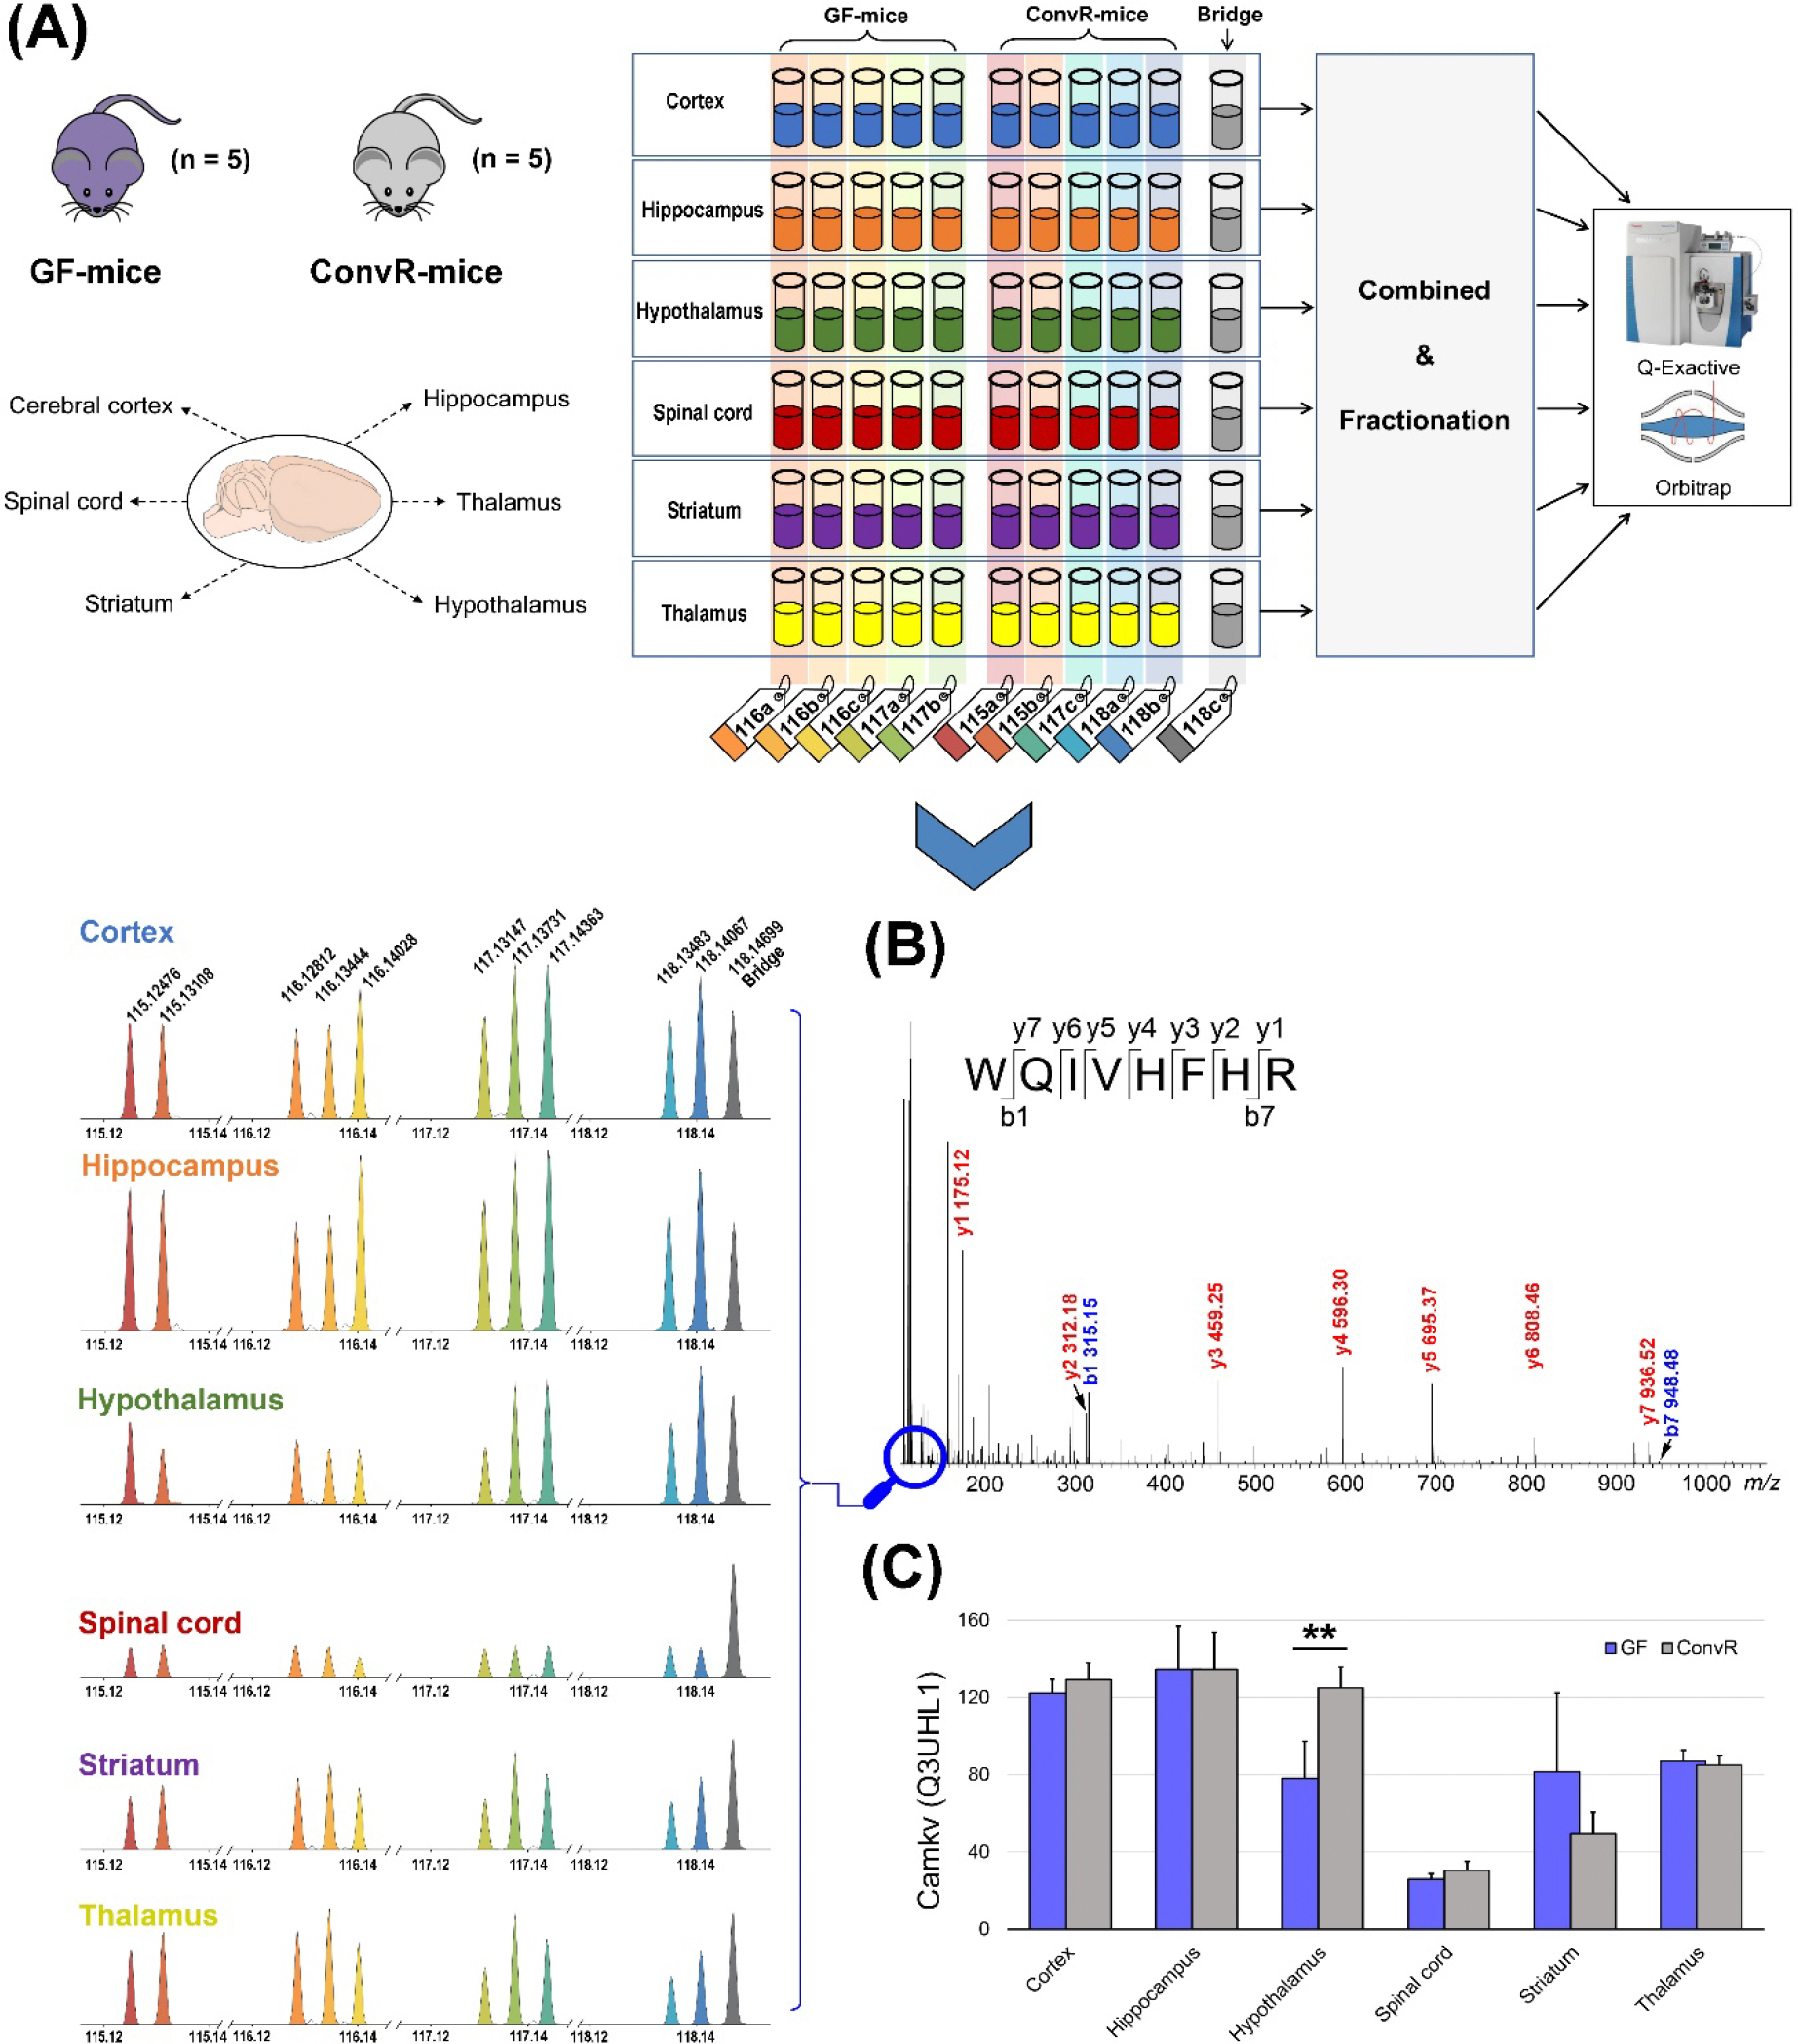
Experimental workflow of quantitative proteomic analysis for proteins from six mouse brain regions under different gut microbiome environments using “BRIDGE” based DiLeu isobaric labeling strategy. (A) Germ-free (GF)-mice and conventionally raised (ConvR)-mice were euthanized, and the Cerebral cortex, Hippocampus, Hypothalamus, Spinal cord, Striatum and Thalamus regions were harvested. Samples were labeled with DiLeu isobaric for quantitative analysis. The “BRIDGE” samples were labeled with DiLeu 118c tag and used as a reference to normalize all proteins from different regions. (B) MS2 spectrum of 11-plex DiLeu-labeled peptide WQIVHFHR acquired from different regions with the reporter ion peaks shown in the left panel. (C) The relative abundance of CaM kinase-like vesicle-associated protein (Camkv, Q3UHL1) in different brain regions from GF- and ConvR-mice.
Quantitative proteomic analysis of six brain regions in GF- and ConvR-mice
We employed a “BRIDGE” based isobaric labeling strategy to quantify and compare proteins from six brain regions simultaneously using 11-plex DiLeu tags. A total of 60 samples from five GF- and five ConvR-mice were analyzed. As shown in Figure 2(A), a total of 5,945 proteins were identified in six brain regions (Supplemental data 1), of which 2,936 were shared by the six brain regions examined. A total of 36,939 peptides were identified in six brain regions (Figure S1), of which 8,162 peptides were shared, and 2,527, 1,208, 1,925, 2,312, 1,024 and 1,198 peptides were detected exclusively in the Cortex, Hippocampus, Hypothalamus, Spinal cord, Striatum and Thalamus, respectively. In addition, 182, 122, 181, 186, 127 and 130 proteins were uniquely detected in the Cortex, Hippocampus, Hypothalamus, Spinal cord, Striatum and Thalamus, respectively, suggesting a region-specific proteome landscape in mouse brain.
Figure 2.

Venn diagrams of proteins identified from different brain regions. (A) Distribution of all 5,945 proteins identified in each brain region; (B) Distribution of the quantified 5,656 proteins in each brain region; (C) Distribution of the significantly changed 1,906 proteins between GF- and ConvR-mice in each brain region.
As shown in Supplemental data 1, a total of 5,656 proteins could be quantified in each brain region. To compare the relative amounts of the same proteins present simultaneously in different brain regions, we used the BRIDGE samples for normalization: by setting the amount of each protein in the BRIDGE samples for each brain region to 100, the amount of the proteins in the GF- and ConvR-groups from each brain region would have a value relative to the BRIDGE sample. This is a normalization process using BRIDGE samples in which the same proteins are present at the same level in different brain regions, ensuring comparable protein levels in different brain regions. Venn diagram shows that 2,725 of these quantifiable 5,656 proteins are shared among different brain regions (Figure 2B). In addition, 162, 124, 168, 167, 140 and 128 proteins were detected exclusively in the Cortex, Hippocampus, Hypothalamus, Spinal cord, Striatum and Thalamus, respectively.
Furthermore, by comparing the results of proteomic experiments in GF- and ConvR-mice in different gut environments, 1,906 proteins were found to be significantly altered (p < 0.05), of which 288, 122, 798, 230, 182 and 286 proteins were detected in the Cortex, Hippocampus, Hypothalamus, Spinal cord, Striatum and Thalamus, respectively. Among them, 176, 60, 612, 140, 110 and 173 proteins were exclusively detected in each of the above brain regions, which sums up to 1,266 proteins accounting for 66.4% of all significantly altered proteins. In addition, only one protein, NAD(P) transhydrogenase (Q61941), was shared by all brain regions (Figure 2C). These results suggest that gut microbiome may affect different brain regions through distinct pathways. Therefore, certain proteins or functions in each brain region might be regulated by different gut environments.
Although some proteins changed significantly in different gut environments of GF- and ConvR- mice, their fold changes were relatively modest. To find the key differentially expressed proteins, we set an average fold change (FC) greater than 1.2 as the threshold according to the literature, and filtered a total of 355 proteins from 1,906 significantly changed proteins, of which 16, 16, 272, 27, 14 and 10 proteins were found in the Cortex, Hippocampus, Hypothalamus, Spinal cord, Striatum and Thalamus, respectively, as shown in Figure 3.
Figure 3.

Volcano plots showing −log10 p-values plotted against log2 ratio (GF-/ConvR-) in different brain regions. The horizontal line represents the t-test threshold of significance assigned (p < 0.05). The vertical lines mark the threshold of 1.2-fold up and down-regulated proteins. Five biological replicates (n = 5) were used.
In addition, threshold of FC > 1.5 and p < 0.05 was set to screen proteins specific to certain brain regions. As shown in Figure S2, 2 proteins in the Cortex, 1 protein in the Hippocampus, 30 proteins in the Hypothalamus, 5 proteins in the Spinal cord were selected, while there was no protein selected in the Striatum and Thalamus.
Comparison of proteomes between six brain regions in GF- or/and ConvR-mice
Of the 2,725 proteins that could be quantified simultaneously in all six brain regions in GF-/ConvR-mice, 281 proteins were filtered for FC values greater than 1.2 in at least one brain region, and significant change (p < 0.05) was not a necessary selection parameter. Heatmap of these 281 proteins shown in Figure 4 and Supplemental data 2 depicts differences in protein profiles between GF- and ConvR-mice, and between different brain regions of the same type of mice. The results show that protein differences between brain regions are greater than that between GF and ConvR mice, which demonstrates again the present strategy is capable of comparatively analyzing protein levels from biological samples with multiple variables. The Cortex and Hippocampus regions showed similar profiles, while the Spinal cord and Striatum regions showed similar profiles. However, the protein profiles of the Hypothalamic differed from all other brain regions, and there were significant differences between the GF- and ConvR- groups within the Hypothalamic region. This suggests that protein abundance and functions in the Hypothalamus are strongly influenced by gut microbiome interventions, but not in other brain regions.
Figure 4.

Heatmap of 281 selected proteins from six brain regions.
Furthermore, we found 23 proteins exhibit significantly (p < 0.05) different expression level between GF- and ConvR-mice in at least one brain region (Supplemental data 3), with FC > 1.2 was not a necessary selection parameter. These proteins were detected in all 60 samples, reflecting differences not only between brain regions of the same type of mice, but also between the same brain regions of GF- and ConvR-groups. Taking Glial fibrillary acidic protein (Gfap, P03995) as an example (Figure 5), in the Hypothalamus Gfap level was significantly higher in GF- than that in ConvR-mice (p < 0.01), while in the Spinal cord and Thalamus it was significantly higher in ConvR- than that in GF-mice (p < 0.05, p < 0.05). In both GF- and ConvR-mice, the Cortex Gfap level was significantly lower than that in the Hypothalamus (p < 0.01), Spinal cord (p < 0.01), Striatum (p < 0.01) and Thalamus (p < 0.01).
Figure 5.

The relative abundance of representative protein Glial fibrillary acidic protein (Gfap, P03995) in different brain regions from GF- and ConvR-mice. The vertical coordinate represents the relative amount of normalized protein, with BRIDGE’s value of 100.
Next, we looked deeper into the protein levels in different groups or regions, as well as the functions of these representative proteins, which were of particular interest in this work. We found that Gfap level was highest in the Spinal cord in both GF- and ConvR-mice. Consistent to our results, Yang et al. also reported previously that as an intermediate filament (IF) III protein, Gfap is uniquely found in astrocytes of the central nervous system and is highly expressed in the brain, especially in the Spinal cord23.
In addition, sodium- and chloride-dependent GABA transporter 3 (GAT3, P31650) showed relatively higher levels in the Hypothalamus, Spinal cord, Striatum and Thalamus than the Cortex and Hippocampus. GAT3 plays an important role in regulating extracellular GABA levels in the brain, and it is preferentially distributed in astrocytes24–25. GABA metabolism is particularly mediated by GAT3 uptake and is utilized to support astrocyte glutamine synthesis 26. At the molecular level, it was found that attenuating astrocyte Ca2+ signaling increased GAT3 functional expression and protein levels 27. Neurogranin (Nrgn, P60761) is a small protein usually expressed in pyramidal cells of the Hippocampus and Cortex, which has been shown to be involved in synaptic plasticity, synaptic regeneration and long-term potentiation mediated by calcium- and calmodulin-signaling pathways28. In this work, Nrgn showed significantly higher level in the Cortex and Hippocampus than the other regions. Synaptotagmin-2 (Syt2, P46097) was identified as the major Ca2+ sensor at GABAergic basket cell (BC) to Purkinje cell (PC) synapses, and selective use of Syt2 as release sensor at BC-PC synapses ensured rapid and efficient feedforward inhibition in cerebellar microcircuits29. In this work, the relative level of Syt2 is higher in the Spinal cord and Striatum than in other brain regions, and the level of Syt2 is higher in the GF-Hypothalamus than in the ConvR-Hypothalamus. We also found in our experiments that a Zn2+ uptake transporter, ZIP12, was identified in all six regions. ZIP12 has been reported to play a critical role in neuronal development and neurulation and is highly expressed in both the human brain and the mouse nervous system 30. Calcium/calmodulin-dependent protein kinase type II (Camk2, P11798) showed significantly higher abundance in the Cortex and Hippocampus, whereas in the Hypothalamus and Striatum, the Camk2a level was much lower. It has been reported that the activity and subcellular localization of Camk2 are critical for synaptic plasticity and learning-memroy31.
KEGG pathway enrichment analysis
To further investigate proteins that were exclusively present in different brain regions, KEGG pathway enrichment analysis was used to unveil pathways or functions they are closely associated with (Supplemental data 4). As shown in Figure 2(A), 182, 122, 181, 186, 127 and 130 proteins were detected exclusively in the Cortex, Hippocampus, Hypothalamus, Spinal cord, Striatum and Thalamus, respectively. KEGG pathway analysis suggests these proteins (182) in the Cortex are involved in glycan degradation, cell cycle, sphingolipid metabolism and adhesion junctions. Proteins (122) exclusively in Hippocampus are involved in pathways including circadian entrainment, glycerophospholipid metabolism, cAMP signaling pathway, cholinergic synapse and calcium signaling pathway. Proteins (181) unique to Hypothalamus are involved in circadian rhythm, thyroid hormone signaling pathway, GnRH secretion, ubiquitin-mediated proteolysis and sphingolipid signaling pathways. Proteins (186) in the Spinal cord region are involved in pathways including peroxisome, vascular smooth muscle contraction, circadian rhythm, tight junction, cholinergic synapse, long-term depression, fatty acid degradation, sphingolipid metabolism, neuroactive ligand-receptor interaction and calcium signaling pathways. Proteins exclusively present in the Striatum (127) and Thalamus (130) are involved in metabolic, GnRH secretion and ribosome, peroxisome pathways, respectively. Collectively, the results revealed that proteins exclusively present in different brain regions are responsible for corresponding different physiological functions. In addition, biological process, cellular component and molecular function enrichment analysis are also shown in Supplemental data 4.
To explore the differences in protein levels of each brain region in different gut microbiome environments and the possible pathways involved, KEGG enrichment analysis was performed for proteins with FC > 1.2 between GF- and ConvR-groups. The results showed that proteins with FC > 1.2 in the Cortex (28) and Spinal cord (50) were not involved in any significantly enriched pathway. Proteins with FC > 1.2 in the Hippocampus (52) were involved in Dopaminergic synapse, cAMP signaling pathway and GABAergic synapse. Proteins (335) in the Hypothalamus were involved in synapse pathways (Glutamatergic, Dopaminergic, Cholinergic and GABAergic synapse), signaling pathways (Calcium, cAMP, cGMP-PKG, GnRH, Wnt, Phospholipase D, etc.) and long-term dementia, circadian rhythm or long-term depression related to memory and learning. Proteins (152) in the Striatum were also involved in related synapse and signaling pathways. In the Thalamus, 37 proteins were involved in neuroactive ligand-receptor interaction pathways.
The KEGG pathway enrichment analysis of 281 proteins in heatmap also suggested that these proteins were involved in synapse pathways such as glutamatergic, dopaminergic, cholinergic, GABAergic and serotonergic synapses, and in signaling pathways including cAMP, oxytocin, cGMP-PKG, Calcium, GnRH, MAPK, Wnt, etc. In addition, long-term depression, long-term potentiation, circadian rhythms and synaptic vesicle cycles, which are closely related to learning, memory, and neurotransmitter release, were also enriched, similar to our previous reports 32–34. Several neuropeptide precursors, such as ProSAAS, secretogranin-1, secretogranin-2, secretogranin-3, neuroendocrine protein 7B2, chromogranin-A and phosphatidylethanolamine-binding protein 1, were detected in each region, but only ProSAAS was significantly altered between GF- and ConvR-mice in the Hypothalamus region (P < 0.01). Neuropeptides from ProSAAS, such as big SAAS, little SAAS, PEN and big LEN have been reported to be associated with food intake and circadian rhythms17, 34.
In summary, we found that the effects on central nervous system due to the gut microbiome environment changes were most obvious in the Hypothalamus and Striatum, followed by the Hippocampus and Thalamus, while the effects on the Cortex and Spinal cord were not significant. The effects on the Hypothalamus and Striatum were mainly related to various signal synapse and transmission, learning and memory, circadian rhythm, etc.
CONCLUSIONS
In this work, a method for comprehensive analysis of proteomes in the six brain regions from mice raised under different gut microbiota environments was developed. 10-plex DiLeu tags were used to label five GF- and five ConvR-mice, and the 11th DiLeu channel was used as the “BRIDGE” sample, which was applied for normalizing samples from different brain regions. With the present strategy, 5,656 proteins were identified from simultaneous quantitative analysis of 60 brain samples in six different regions. This comprehensive proteomics analysis describes the molecular influences on brain tissues under different gut microbiome environments, and therefore can provide new insights into the physiological functions and pathological relevance of the interactions between gut microbiome and central nervous system.
Supplementary Material
Supplemental data 2. Relative abundance of 281 selected proteins from six brain regions.
Supplemental data 3. 23 representative proteins from six brain regions, which exhibit significantly (p < 0.05) different expression level between GF- and ConvR-mice in at least one brain region.
Supplemental data 1. All 5,945 identified proteins in six brain regions.
Supplemental data 4. KEGG, biological process, cellular component and molecular function enrichment analysis.
Acknowledgement
This research was supported in part by the National Institutes of Health (NIH) grants R01DK071801 (LL), R01 AG078794 (LL), R01AG052324 (LL), and P41GM108538 (LL), and DK108259 (FER). RL was supported by the National Natural Science Foundation of China (No. 81973450), Jiangsu Qinglan Project, Jiangsu “333” Project, and Young Researchers Training Project of China Association of Traditional Chinese Medicine (QNRC2-C14). LL acknowledges funding support from the National Science Foundation (CHE-2108223), NIH shared instrument grants (S10OD028473 and S10OD025084 to L.L.), an NIH grant R21AG065728, a Vilas Distinguished Achievement Professorship, and Charles Melbourne Johnson Distinguished Chair Professorship with funding provided by the Wisconsin Alumni Research Foundation and University of Wisconsin–Madison School of Pharmacy. The Orbitrap instruments were purchased through the support of an NIH shared instrument grant (NIH-NCRR S10RR029531) and Office of the Vice Chancellor for Research and Graduate Education at the University of Wisconsin-Madison.
Footnotes
The authors declare no competing financial interest.
Associated contents
Supporting information
The Supporting Information is available free of charge at the ACS Publications website: https://pubs.acs.org
References
- (1).Zhang P; Wu X; Liang S; Shao X; Wang Q; Chen R; Zhu W; Shao C; Jin F; Jia C, A dynamic mouse peptidome landscape reveals probiotic modulation of the gut-brain axis. Sci. Signal. 2020, 13 (642), eabb0443. [DOI] [PubMed] [Google Scholar]
- (2).Foster JA; McVey Neufeld KA, Gut-brain axis: how the microbiome influences anxiety and depression. Trends Neurosci. 2013, 36 (5), 305–312. [DOI] [PubMed] [Google Scholar]
- (3).Liu S; Gao J; Zhu M; Liu K; Zhang HL, Gut microbiota and dysbiosis in Alzheimer’s disease: implications for pathogenesis and treatment. Mol. Neurobiol. 2020, 57 (12), 5026–5043. [DOI] [PMC free article] [PubMed] [Google Scholar]
- (4).Zhang B; Chen T; Cao M; Yuan C; Reiter RJ; Zhao Z; Zhao Y; Chen L; Fan W; Wang X; Zhou X; Li C, Gut microbiota dysbiosis induced by decreasing endogenous melatonin mediates the pathogenesis of Alzheimer’s disease and obesity. Front Immunol. 2022, 13, 900132. [DOI] [PMC free article] [PubMed] [Google Scholar]
- (5).Roe K, An alternative explanation for Alzheimer’s disease and Parkinson’s disease initiation from specific antibiotics, gut microbiota dysbiosis and neurotoxins. Neurochem. Res. 2022, 47 (3), 517–530. [DOI] [PubMed] [Google Scholar]
- (6).Liu Y; Wang H; Gui S; Zeng B; Pu J; Zheng P; Zeng L; Luo Y; Wu Y; Zhou C; Song J; Ji P; Wei H; Xie P, Proteomics analysis of the gut-brain axis in a gut microbiota-dysbiosis model of depression. Transl. Psychiatry 2021, 11 (1), 568. [DOI] [PMC free article] [PubMed] [Google Scholar]
- (7).Yuan X; Chen B; Duan Z; Xia Z; Ding Y; Chen T; Liu H; Wang B; Yang B; Wang X; Liu S; Zhou JY; Liu Y; Wang Q; Shen Z; Xiao J; Shang H; Liu W; Shi G; Zhu L; Chen Y, Depression and anxiety in patients with active ulcerative colitis: crosstalk of gut microbiota, metabolomics and proteomics. Gut Microbes 2021, 13 (1), 1987779. [DOI] [PMC free article] [PubMed] [Google Scholar]
- (8).Rutsch A; Kantsjo JB; Ronchi F, The gut-brain axis: How microbiota and host inflammasome influence brain physiology and pathology. Front Immunol. 2020, 11, 604179. [DOI] [PMC free article] [PubMed] [Google Scholar]
- (9).Frankiensztajn LM; Elliott E; Koren O, The microbiota and the hypothalamus-pituitary-adrenocortical (HPA) axis, implications for anxiety and stress disorders. Curr. Opin. Neurobiol. 2020, 62, 76–82. [DOI] [PubMed] [Google Scholar]
- (10).Pascale A; Marchesi N; Govoni S; Barbieri A, Targeting the microbiota in pharmacology of psychiatric disorders. Pharmacol. Res. 2020, 157, 104856. [DOI] [PubMed] [Google Scholar]
- (11).Huang C; Yang X; Zeng B; Zeng L; Gong X; Zhou C; Xia J; Lian B; Qin Y; Yang L; Liu L; Xie P, Proteomic analysis of olfactory bulb suggests CACNA1E as a promoter of CREB signaling in microbiota-induced depression. J. Proteomics 2019, 194, 132–147. [DOI] [PubMed] [Google Scholar]
- (12).Mayer EA; Tillisch K; Gupta A, Gut/brain axis and the microbiota. J. Clin. Invest. 2015, 125 (3), 926–38. [DOI] [PMC free article] [PubMed] [Google Scholar]
- (13).Cryan JF; Dinan TG, Mind-altering microorganisms: the impact of the gut microbiota on brain and behaviour. Nat. Rev. Neurosci. 2012, 13 (10), 701–12. [DOI] [PubMed] [Google Scholar]
- (14).Wei GZ; Martin KA; Xing PY; Agrawal R; Whiley L; Wood TK; Hejndorf S; Ng YZ; Low JZY; Rossant J; Nechanitzky R; Holmes E; Nicholson JK; Tan EK; Matthews PM; Pettersson S, Tryptophan-metabolizing gut microbes regulate adult neurogenesis via the aryl hydrocarbon receptor. Proc Natl Acad Sci U S A 2021, 118 (27), e2021091118. [DOI] [PMC free article] [PubMed] [Google Scholar]
- (15).Hoban AE; Stilling RM; Ryan FJ; Shanahan F; Dinan TG; Claesson MJ; Clarke G; Cryan JF, Regulation of prefrontal cortex myelination by the microbiota. Transl. Psychiatry 2016, 6, e774. [DOI] [PMC free article] [PubMed] [Google Scholar]
- (16).Aebersold R; Mann M, Mass spectrometry-based proteomics. Nature 2003, 422 (6928), 198–207. [DOI] [PubMed] [Google Scholar]
- (17).Liu R; Wei P; Keller C; Orefice NS; Shi Y; Li Z; Huang J; Cui Y; Frost DC; Han S; Cross TL; Rey FE; Li L, Integrated label-free and 10-plex DiLeu isobaric tag quantitative methods for profiling changes in the mouse hypothalamic neuropeptidome and proteome: assessment of the impact of the gut microbiome. Anal. Chem. 2020, 92 (20), 14021–14030. [DOI] [PMC free article] [PubMed] [Google Scholar]
- (18).Frost DC; Feng Y; Li L, 21-plex DiLeu isobaric tags for high-throughput quantitative proteomics. Anal. Chem. 2020, 92 (12), 8228–8234. [DOI] [PMC free article] [PubMed] [Google Scholar]
- (19).Li Z; Wang B; Yu Q; Shi Y; Li L, 12-plex DiLeu isobaric labeling enabled high-throughput investigation of citrullination alterations in the DNA damage response. Anal. Chem. 2022, 94 (7), 3074–3081. [DOI] [PMC free article] [PubMed] [Google Scholar]
- (20).Frost DC; Greer T; Li L, High-resolution enabled 12-plex DiLeu isobaric tags for quantitative proteomics. Anal. Chem. 2015, 87 (3), 1646–54. [DOI] [PMC free article] [PubMed] [Google Scholar]
- (21).Lapek JD Jr.; Greninger P; Morris R; Amzallag A; Pruteanu-Malinici I; Benes CH; Haas W, Detection of dysregulated protein-association networks by high-throughput proteomics predicts cancer vulnerabilities. Nat. Biotechnol. 2017, 35 (10), 983–989. [DOI] [PMC free article] [PubMed] [Google Scholar]
- (22).Zhang H; Liu T; Zhang Z; Payne SH; Zhang B; McDermott JE; Zhou JY; Petyuk VA; Chen L; Ray D; Sun S; Yang F; Chen L; Wang J; Shah P; Cha SW; Aiyetan P; Woo S; Tian Y; Gritsenko MA; Clauss TR; Choi C; Monroe ME; Thomas S; Nie S; Wu C; Moore RJ; Yu KH; Tabb DL; Fenyo D; Bafna V; Wang Y; Rodriguez H; Boja ES; Hiltke T; Rivers RC; Sokoll L; Zhu H; Shih IM; Cope L; Pandey A; Zhang B; Snyder MP; Levine DA; Smith RD; Chan DW; Rodland KD; Investigators, C., Integrated proteogenomic characterization of human high-grade serous ovarian cancer. Cell 2016, 166 (3), 755–765. [DOI] [PMC free article] [PubMed] [Google Scholar]
- (23).Yang Z; Wang KK, Glial fibrillary acidic protein: from intermediate filament assembly and gliosis to neurobiomarker. Trends Neurosci. 2015, 38 (6), 364–74. [DOI] [PMC free article] [PubMed] [Google Scholar]
- (24).Lyu S; Guo Y; Zhang L; Wang Y; Tang G; Li R; Yang J; Gao S; Ma B; Liu J, Blockade of GABA transporter-1 and GABA transporter-3 in the lateral habenula improves depressive-like behaviors in a rat model of Parkinson’s disease. Neuropharmacology 2020, 181, 108369. [DOI] [PubMed] [Google Scholar]
- (25).Boddum K; Jensen TP; Magloire V; Kristiansen U; Rusakov DA; Pavlov I; Walker MC, Astrocytic GABA transporter activity modulates excitatory neurotransmission. Nat. Commun. 2016, 7, 13572. [DOI] [PMC free article] [PubMed] [Google Scholar]
- (26).Salcedo C; Wagner A; Andersen JV; Vinten KT; Waagepetersen HS; Schousboe A; Freude KK; Aldana BI, Downregulation of GABA transporter 3 (GAT3) is associated with deficient oxidative GABA metabolism in human induced pluripotent stem cell-derived astrocytes in Alzheimer’s disease. Neurochem. Res. 2021, 46 (10), 2676–2686. [DOI] [PubMed] [Google Scholar]
- (27).Yu X; Taylor AMW; Nagai J; Golshani P; Evans CJ; Coppola G; Khakh BS, Reducing Astrocyte calcium signaling in vivo alters striatal microcircuits and causes repetitive behavior. Neuron 2018, 99 (6), 1170–1187 e9. [DOI] [PMC free article] [PubMed] [Google Scholar]
- (28).Xiang Y; Xin J; Le W; Yang Y, Neurogranin: A potential biomarker of neurological and mental diseases. Front Aging Neurosci. 2020, 12, 584743. [DOI] [PMC free article] [PubMed] [Google Scholar]
- (29).Chen C; Arai I; Satterfield R; Young SM Jr.; Jonas P, Synaptotagmin 2 is the fast Ca(2+) sensor at a central inhibitory synapse. Cell Rep. 2017, 18 (3), 723–736. [DOI] [PMC free article] [PubMed] [Google Scholar]
- (30).Chowanadisai W; Graham DM; Keen CL; Rucker RB; Messerli MA, Neurulation and neurite extension require the zinc transporter ZIP12 (slc39a12). Proc Natl Acad Sci U S A 2013, 110 (24), 9903–8. [DOI] [PMC free article] [PubMed] [Google Scholar]
- (31).Colbran RJ, Protein phosphatases and calcium/calmodulin-dependent protein kinase II-dependent synaptic plasticity. J. Neurosci. 2004, 24 (39), 8404–9. [DOI] [PMC free article] [PubMed] [Google Scholar]
- (32).Golombek DA; Rosenstein RE, Physiology of circadian entrainment. Physiol. Rev. 2010, 90 (3), 1063–102. [DOI] [PubMed] [Google Scholar]
- (33).Südhof TC, The synaptic vesicle cycle. Ann. Rev. Neurosci. 2004, 27 (1), 509–547. [DOI] [PubMed] [Google Scholar]
- (34).Southey BR; Lee JE; Zamdborg L; Atkins N Jr.; Mitchell JW; Li M; Gillette MU; Kelleher NL; Sweedler JV, Comparing label-free quantitative peptidomics approaches to characterize diurnal variation of peptides in the rat suprachiasmatic nucleus. Anal. Chem. 2014, 86 (1), 443–452. [DOI] [PMC free article] [PubMed] [Google Scholar]
Associated Data
This section collects any data citations, data availability statements, or supplementary materials included in this article.
Supplementary Materials
Supplemental data 2. Relative abundance of 281 selected proteins from six brain regions.
Supplemental data 3. 23 representative proteins from six brain regions, which exhibit significantly (p < 0.05) different expression level between GF- and ConvR-mice in at least one brain region.
Supplemental data 1. All 5,945 identified proteins in six brain regions.
Supplemental data 4. KEGG, biological process, cellular component and molecular function enrichment analysis.