

Abstract
Rationale for review:
This review aims to summarize the transmission patterns of influenza, its seasonality in different parts of the globe, air travel and cruise ship related influenza infections, and interventions to reduce transmission.
Key findings:
The seasonality of influenza varies globally, with peak periods occurring mainly between October and April in the Northern Hemisphere (NH) and between April and October in the Southern Hemisphere (SH) in temperate climate zones. However, influenza seasonality is significantly more variable in the tropics. Influenza is one of the most common travel-related vaccine-preventable diseases and can be contracted during travel, such as during a cruise or through air travel. Additionally, travelers can come into contact with people from regions with ongoing influenza transmission. Current influenza immunization schedules in the NH and SH leave individuals susceptible during their respective spring and summer months if they travel to the other hemisphere during that time.
Conclusions/recommendations:
The differences in influenza seasonality between hemispheres have substantial implications for the effectiveness of influenza vaccination of travelers. Health care providers should be aware of influenza activity when patients report travel plans, provide alerts, and advise on prevention, diagnostic and treatment options. To mitigate the risk of travel-related influenza, interventions include antivirals for self-treatment (in combination with the use of rapid self-tests), extending the shelf life of influenza vaccines to enable immunization during the summer months for international travelers, and gaining access to the influenza vaccine used in the opposite hemisphere as a travel-related vaccine. With the currently available vaccines, the most important preventive measure remains optimizing the seasonal influenza vaccination. It is also imperative that influenza is recognized as a travel-related illness, both travelers as well as health care professionals
Keywords: respiratory virus, outbreak, transmission, cruise ship, screening, vaccination, antiviral
Introduction
Influenza, a common vaccine-preventable disease among international travelers,1-5 has also caused four pandemics in the past century – including the 1918 influenza A (H1N1) pandemic and the 2009 novel influenza A(H1N1) pandemic. The recent SARS-CoV-2 pandemic has renewed interest in travel-related acute respiratory infection (ARI) risk, including the role of air and cruise ship travel in the spread of seasonal influenza and the utility of screening at international borders. This review provides an overview of travel-associated influenza, by summarizing influenza seasonality in different world regions, recent influenza transmission patterns, cruise ship and air travel related influenza, and findings from border screening for influenza.
Influenza viruses are segmented, negative-strand RNA viruses in the family of Orthomyxoviridae. Of the three strains of the virus that infect humans, influenza A, B, and C, the first 2 are the drivers of human influenza epidemics.6 The majority of seasonal influenza epidemics are caused by influenza A virus, while influenza B more commonly leads to regional outbreaks.7 Influenza viruses are estimated to be associated with over 5 million hospitalizations annually worldwide, accounting for 14.1% of adult hospitalizations for respiratory illnesses.8
Historically, the patterns of seasonal influenza outbreaks have varied around the globe. The World Health Organization (WHO) has delineated geographical regions with similar transmission patterns, termed “influenza transmission zones”.9 In regions with temperate climates, influenza outbreaks generally occur during fall and winter. Since winter occurs in different months in each hemisphere, the influenza seasons differ between the northern hemisphere (NH) and southern hemisphere (SH). In contrast, some areas in tropical climates experience two distinct seasonal influenza peaks or influenza may even circulate year-round.10 In the USA, the influenza season usually starts in October, with activity peaking around January, before decreasing in March.11 In Europe, influenza transmission usually begins in mid to late December and declines towards spring to reach a nadir from May through the summer months.12
Vaccines are effective at preventing influenza. Immunocompetent individuals develop immunity against influenza on average within 14 days after vaccination.13 However, immunity wanes significantly over the 4-6 months after vaccination,14 and the antibody response declines with age in older adults.15 Furthermore, as influenza strains represented in the vaccine are selected months in advance,16,17 sometimes the strains may be mismatched to the circulating viruses, resulting in effectiveness as low as 14%.18,19 For well-matched vaccines, effectiveness in preventing influenza varies between 40-60%. 20
Influenza vaccine distribution begins during late summer or early autumn in each hemisphere, with vaccination usually initiated by the beginning of the season and continuing throughout the fall and winter.21 In Europe, most countries begin vaccinations in early fall;22 in the USA, vaccine distribution usually begins in late August for vaccination to occur by the end of October,11,21 whereas in Australia the distribution begins in April.23 The USA influenza vaccine supplies have a standard annual expiration date of June 30th,24 following which the remaining vaccines are withdrawn from the market, to be replaced by the new seasonal vaccines when available.21 From July 1st until the new vaccine is released, influenza vaccines are unavailable. Therefore, travelers from either hemisphere traveling during their respective summer months to a destination in the other hemisphere or to the tropics may encounter influenza virus months after their last immunization.
Furthermore, the waning immunity from influenza vaccination may result in susceptibility by the time travelers arrive to their destination, even if they had received vaccines well-matched with the strains in circulation.14 A Bayesian model based on a meta-analysis of studies in older adults (≥65 years) found that while vaccination effectively increased the seropositivity from 41-51% pre-vaccination to 75-78% post-vaccination, the antibodies declined from day 21-42 so that seroprotection fell to pre-vaccination level by day 360.25
Here, we review data from key reports about influenza seasonality, present regional patterns of seasonal influenza circulation, and summarize data on travel-related influenza infections. We aim to inform health care professionals on the risk of travel-associated influenza and to review available mitigation strategies.
Methods
Influenza Seasonality
We defined the influenza season as the period of peak transmission for each region, using WHO-published data26,27 and additional relevant investigations.28,29 Based on the WHO-published guidance on recommended vaccination timing and formulation for countries, areas or territories from the tropics and subtropics,26 we tabulated countries as either belonging to the NH or the SH, with respect to influenza vaccination recommendations and strategies. We assigned the remaining countries to either NH or SH based on maps from the WHO’s Global Influenza Programme27 and other references.28,29 Countries identified as having both an NH and SH transmission pattern were classified as having a year-round influenza transmission cycle,26-29 whereas countries for which no information was available were listed as unclassified.
Review of recent transmission data
We summarized data on recent seasonal influenza transmission patterns using FluNet’s Influenza Laboratory Surveillance Information (ILSI).30 FluNet is a web-based tool of the WHO Global Influenza Surveillance and Response System (GISRS),27 which compiles data on influenza detection rates from 143 countries and territories.30 Data were reviewed for a 4-year period prior to the COVID-19 pandemic, between January 1st 2016 and December 31st 2019, and collated across the 6 WHO regions and further subcategorized by hemisphere. Given the significant impact of the COVID-19 pandemic on influenza transmission patterns31, this period was chosen to represent the most recent “steady state” in influenza epidemiology. Countries were assigned to NH or SH according to WHO categorization.26
Through FluNet, data were collected on 10 different regions: NH and SH African region, NH and SH region of the Americas, NH and SH South-East Asian region, NH European region, NH Eastern Mediterranean region, and NH and SH Western Pacific region.
Data on influenza like illness (ILI) visits in the USA were also obtained from the CDC FluView website32.
Travel-related influenza transmission
We conducted literature reviews to summarize the transmission of influenza through air and cruise ship travel, as well as screening strategies at airports and international borders. Using PubMed, we searched for key articles published since 2000 using the terms “influenza”, “cruise ship”, “air-travel”, and “border screening”. We summarized influenza transmission associated with air- and cruise ship-travel as well as studies on border screening for influenza.
Results
Influenza seasonality
Table 1 and Figure 1 illustrate influenza seasonality as designated by WHO and prior relevant sources.26-29
Table 1.
| Time period | Countries and territories with the corresponding influenza season |
|---|---|
| NH seasonality (Oct-Mar) | Afghanistan, Albania, Algeria, American Samoa, Andorra, Armenia, Austria, Azerbaijan, Bahrain, Belarus, Belgium, Bermuda, Bosnia and Herzegovina, Bulgaria, Burkina Faso, Burundi, Canada, Chad, Congo, Croatia, Cyprus, Czech Republic, Democratic Republic of Congo, Denmark, Djibouti, Egypt, Equatorial Guinea, Eritrea, Estonia, Ethiopia, Finland, France, French Polynesia, Gabon, Georgia, Germany, Greece, Guam, Guatemala, Hungary, Iceland, Indonesia, Iran, Iraq, Ireland, Israel, Italy, Jamaica, Jersey, Jordan, Kazakhstan, Kuwait, Kyrgyzstan, Latvia, Lebanon, Libya, Lithuania, Luxembourg, Madagascar, Malawi, Mali, Malta, Marshall Islands, Mauritania, Mauritius, Mexico, Moldova, Monaco, Montenegro, Morocco, Netherlands, New Caledonia, Niger, North Macedonia, Norway, Oman, Pakistan, Palau, Palestinian Territory, Poland, Portugal, Qatar, Romania, Russia, Rwanda, Saint Pierre and Miquelon, San Marino, Sao Tome and Principe, Saudi Arabia, Serbia, Slovakia, Slovenia, Somalia, Spain, Sri Lanka, Sudan, Sweden, Switzerland, Syria, Tajikistan, Tanzania, Tunisia, Turkey, Turkmenistan, UAE, Ukraine, United Kingdom, USA, Uzbekistan, Western Sahara, Yemen |
| SH seasonality (Apr-Sep) | Angola, Anguilla, Antigua and Barbuda, Argentina, Australia, Bahamas, Bangladesh, Barbados, Belize, Benin, Bhutan, Bolivia, Botswana, Brazil, Cambodia, Cameroon, Cape Verde, Cayman Islands, Central African Republic, Chile, China, Colombia, Costa Rica, Cote D’Ivoire, Cuba, Dominica, Dominican Republic, Ecuador, El Salvador, Falkland Islands, French Guiana, Gambia, Ghana, Grenada, Guinea, Guinea-Bissau, Guyana, Haiti, Honduras, India, Japan, Laos, Lesotho, Liberia, Maldives, Marshall Islands, Micronesia, Mongolia, Montserrat, Mozambique, Myanmar, Namibia, Nepal, Netherlands Antilles, New Zealand, Nicaragua, Nigeria, Palau, Panama, Paraguay, Peru, Philippines, Reunion, Saint Kitts and Nevis, Saint Lucia, Saint Vincent and the Grenadines, Senegal, Sierra Leone, South Africa, South Korea, Suriname, Swaziland, Thailand, Timor-Leste, Togo, Trinidad and Tobago, Turks and Caicos Islands, Tuvalu, Uganda, Uruguay, Venezuela, Viet Nam, Zambia, Zimbabwe |
| Jan-May | Aruba, Bonaire, Curaçao, Guadeloupe, Martinique, Saint Barthélemy, Saint Martin (French Part), Sint Maarten (Dutch Part) |
| Nov-Apr | British Virgin Islands, Puerto Rico, Virgin Islands (U.S.) |
| Jul-Nov | Comoros |
| Year-round | Kenya, Malaysia, Brunei Darussalam, Cook Islands, Fiji, Kiribati, Nauru, Niue, Papua New Guinea, Singapore, Samoa, Solomon Islands, Tonga, Vanuatu |
| Unclassified | Antarctica, Ascension Island, British Indian Ocean Territory, Faroe Islands, French Southern Territories, North Korea, Seychelles, South Georgia and South Sandwich Islands, South Sudan, Taiwan, USA Minor Outlying Islands, Vatican, Liechtenstein, Cocos Islands, Christmas Island, Northern Mariana Islands, Hong Kong, Macau, Tokelau, Wallis and Futuna |
Figure 1.
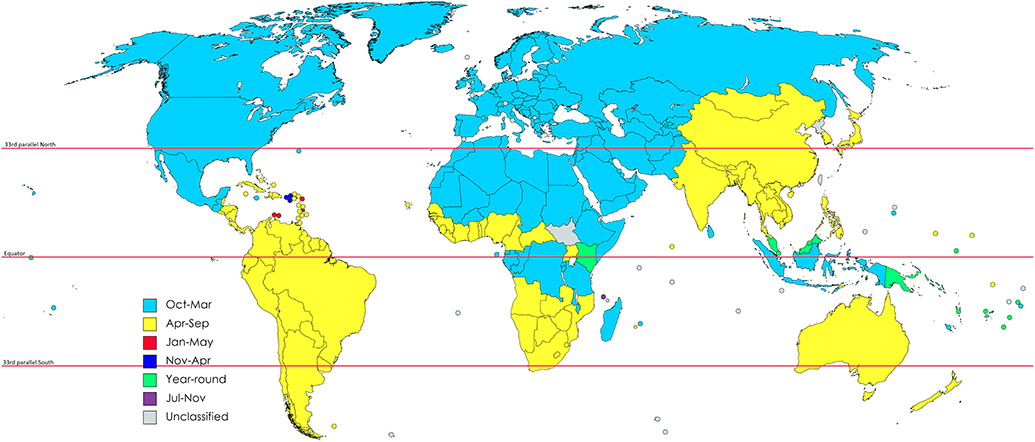
Influenza seasonality around the globe based on data from the WHO26,27 and other references28,29.
There are 2 areas with anomalous distribution of influenza seasonality. The first is located in Africa, where based on the WHO classification, the Western Africa influenza vaccination zone has a SH seasonality, whereas Equatorial Africa influenza vaccination zone has an NH seasonality, despite being located to the south of Western Africa influenza vaccination zone.26 As a result, some countries with a reported NH seasonality are surrounded by countries with SH seasonality. The second is in the Indo-Australian Archipelago, where islands shared between Indonesia and other nations (Papua New Guinea, Malaysia, Brunei, Timor-Leste) appear to have different influenza seasonality from East to West. Unlike the surrounding nations, Indonesia is reported as having a NH seasonality.
Recent transmission data
While influenza seasons differ between regions, NH influenza seasons generally occur between October and April (Table 2). This is encountered in every region (with some variability), with the exception of the NH South-East Asian region, where 2 distinct seasons were noted: from January to April and from June to September.
Table 2:
FluNet data on peak influenza transmission periods for 2016-2019 in the 6 WHO regions, based on whether the country/territory is located in Northern or Southern Hemisphere.a
| WHO region | Northern Hemisphere | Southern Hemisphere |
|---|---|---|
| 1. African Region | September-April | April- September 2018: 2nd season Influenza B July-October |
| 2. Region of the Americas | October-May | March-October |
| 3. South-East Asian Region | January-April, June-September (October in 2018) | January-June 2017: 2nd season September-December |
| 4. European Region | November-May | N/A |
| 5. Eastern Mediterranean Region | September-April | N/A |
| 6. Western Pacific Region | November-April/May 2017: 2nd season June-September |
May-October |
Countries included in each region are listed in Supplementary Table 1
In the SH, influenza seasons generally occur between April and October (also with some variability, Table 2). One exception was the SH South-East Asia region, where the season was between January and June (with an additional epidemic between September and December in 2017).
US CDC data on ILI showed that in the corresponding pre-pandemic period, visits for ILI began to increase in mid-November and decreased to baseline at the beginning of April32.
Air travel related transmission
The relationship between air travel and the spread of influenza is well documented.33 Travel-related influenza virus exposure may occur at the start of the trip, at the airport, or through direct and indirect human-to-human contact.34
Experience from the 2009 H1N1 influenza pandemic showed that serologically-confirmed influenza occurred following flights, and in-flight transmission occurred among passengers sitting up to two rows from an index case, although passengers seated beyond remained at some risk.35-37 However, it remains uncertain whether virus transmission occurred before or after the flight while queuing for check-in, security screening, boarding/disembarking, or immigration, or while being crowded in a bus to or from the aircraft or a combination of these factors.38 While high-efficiency particulate air (HEPA) ventilation systems should be effective in mitigating transmission risks when operated as recommended,39,40 these systems may not be in operation during the boarding and disembarking process.
Cruise ship related transmission
Influenza virus outbreaks on cruise ships are of particular interest, as this mode of travel is chosen by over 20 million passengers annually.41 Past studies have reported influenza to be the second most frequently reported infectious illness on cruise ships, after acute gastroenteritis.42 With modern cruise ships having the capacity of over 6000 passengers and up to 2300 crew members, many factors contribute to virus transmission, including close contact, communal dining areas, and a high ratio of person-to-person contacts.41,43 A systematic review of 41 studies on the transmission of respiratory viruses in transportation hubs and during transportation found that influenza outbreaks on cruise ships affect 2-7% of the passengers on board.44
Passengers and crew members may originate from regions experiencing high influenza circulation,41 and many cruise ship passengers are of advanced age and have comorbidities.45 Crew members are typically at the highest risk of acquiring the infection during an active outbreak on the ship, attributed to their crowded living quarters that facilitate transmission, as well as their prolonged presence on board during the tourist season.42 Additionally, crew members, who are typically younger and more physically fit, may remain asymptomatic and continue to work, serving as reservoirs for influenza viruses between trips due to their periods of employment that lead to interactions with changing groups of passengers.42
Reports of cruise ship outbreaks have found that rates of ARI or ILI influenza-like illness (ILI), vary between 0.2-37.1%.45-52 (Table 3) This variation is partly due to the different study designs, populations and case definitions used in these studies. However, the rates of laboratory confirmed influenza are lower due to limited testing.48,49 When performed, testing has identified influenza A H3N2, H1N1, and influenza B.45,48,50,51 Two studies reported on the use of chemoprophylaxis that appeared to be beneficial in limiting disease spread.52 The index cases have been identified to be a person boarding the cruise at the port of origin as well as passengers boarding the ship from intermediate destinations several weeks after the start of the cruise.49,50,52
Table 3.
Examples of reports of cruise ship related influenza outbreaks.
|
1st Author,
year |
Origin-
destination |
Study
description |
Influenza
strain |
Number of cases (%) | Additional information | Period |
|---|---|---|---|---|---|---|
| Miller, 200048 | New York City-Montreal | Descriptions of outbreaks on 3 consecutive cruises of the same ship | A H3N2 (among those tested) | ILI: Cruise 1: 39/1445 (2.7%) Cruise 2: 19/1448 (1.3%) Cruise 3: 3/1443 (0.2%) |
Few among those symptomatic were tested. An influenza strain not previously identified in North America was isolated. | Aug-Sep 1997 |
| Christensen, 200149 | UK-Russia-Germany | Description of outbreak on 1 ship | Not reported | ARI: 118/1817 (6.5%) ILI: 70/1817 (3.9%) |
Only 2 people were tested, found positive for influenza (strain not reported). | Jun-Jul 2000 |
| Brotherton, 200347 | Sydney-Noumea | Influenza testing and post-cruise survey of 1119 passengers (836 responders) | A and B | 310/836 (37.1%) reported ILI. LCI: Influenza A: 40/1119 (3.6%) Influenza B: 7/1119 (0.6%) |
40 patients required hospitalization. 8 out of 21 tested had LCI. | Sep 2000 |
| Ward, 201050 | Sydney-Pacific islands-Sydney | Descriptions of outbreaks on 2 consecutive cruises of the same ship | A H1N1 and H3N2 | LCI: H1N1: 82/2704 (3%) H3N2: 98/2704 (3.6%) |
Of 734 crew, 15 had ILI and 3 LCI. Remaining 719 received oseltamivir prophylaxis; among these another 5 had ILI and 3 LCI. | May 2009 |
| Fernandes, 201446 | Santos-coast of Brazil- Uruguay-Argentina | Description of outbreak on 1 ship | B | ARI: 104/2458 (4.2%) LCI: 6/2458 (0.2%) |
Among 11 hospitalized ARI cases, influenza B virus was isolated in 6. | Feb 2012 |
| Millman, 201551 | South America -Los Angeles | Description of outbreaks on 2 ships | A H3N2, A H1N1, B | Ship A: ARI: 130/3652 (3.6%) LCI: 35/3652 (0.9%) Ship B: ARI: 241/4144 (5.8%) LCI:11/4144 (0.3%) |
Both ships were destined for Los Angeles, conducting trans-hemispheric journeys. | Mar-Apr 2014 |
| Rogers, 201745 | Alaska | Surveillance of infirmaries of 6 cruise ships | A H1N1, A H3, B | LCI: 292/410 (71.2%) of ARI. Influenza A (H1N1): 30/410 (7.3%) Influenza A H3: 212/410 (51.7%) Influenza B: 56/410 |
Ship infirmaries collected samples of ARI cases. 74/410 (18%) of ARI cases tested positive for another respiratory virus. | May-Sep 2013-2015 |
| Aoki, 202152 | Kobe to Yokohama, Japan (circum-navigation, calling at 23 ports in 20 countries) | Description of outbreak on 1 ship | A | LCI: 34/1275 (2.7%) | Index case from Egypt. No cases among 19 close contacts that accepted chemoprophylaxis, 3 cases among 33 that refused. | 2020 |
Number of cases include both passengers and crew. Abbreviations: ILI, influenza-like illness; LCI, Laboratory confirmed influenza; ARI, acute respiratory illness
Border screening
Twelve published studies have evaluated the use of screening procedures at international airports to evaluate the importation of influenza (Table 4).53-63 These investigations were predominantly carried out during the 2009 influenza A(H1N1) pandemic. Countries in the South-East Asian region in the NH, in particular, were noted to have implemented several measures for outbreak containment.57-63
Table 4.
Summary of published studies that evaluate screening for influenza at airports. All have taken place during active influenza seasons. (See Supplementary Table 2 for detailed descriptions)
|
1st Author,
year |
Time period |
Country
/Region (Airport) |
Study components |
Study
population |
Key findings |
|---|---|---|---|---|---|
| Duncan, 200953 | Jul-Aug 2007 | NZ (Christchurch Int Airport) | Questionnaire + PCR/viral culture of throat swab of all symptomatic and randomly chosen travelers from 5 flights from AU to NZ to study feasibility of screening | 628 | 4% of symptomatic travelers had influenza B (1/26). 0% of asymptomatic travelers were positive (0/31). |
| Kuo, 200958 | Apr 27-Jun 19, 2009 | Taiwan (All airports) | Questionnaire on all international arrivals + infrared thermal scan + on-board quarantine/isolation in hospital + PCR of samples to evaluate screening procedures | 1,732,455 | 12 samples had influenza virus (A(H1N1)pdm09). 2,685 travelers had symptoms, including 1,303 fever cases. |
| Priest, 201164 | Aug 21-Sep 12, 2008 | NZ (Christchurch Int Airport) | Infrared thermal scan + tympanic temperature + PCR of nasal and throat swabs to estimate effectiveness of temperature testing | 8,020 | 30 samples had influenza virus (3 type A; 27 type B). 90% of positive cases were symptomatic (27/30), but 0% had a tympanic temperature of ≥37.8°C (99%CI 0-18%; 0/30). 7% had a tympanic temperature of >37.5°C (99%CI 0.3-31%; 2/30). 15.6% of questionnaire respondents (823/5,274) were symptomatic. Random sampling found influenza prevalence of 1.9% (20/1,057). |
| Nishiura, 201162 | (1) Apr 28-Jun 18, 2009 (2) Sep 1, 2009-Jan 31, 2010 |
Japan (Narita Int Airport) | Questionnaire + infrared thermal scan on all arrivals from (1) Canada, Mexico, or the USA or (2) other countries + rapid antigen testing to suspicious travelers among (1), followed by PCR of nasal swab to assess the feasibility of temperature screening | (1) N=471,733 (2) N=9,140,435 |
18 samples (15 positive for rapid antigen test; 3 negative for rapid antigen test but strongly suspicious) had influenza virus (10 A(H1N1)pdm09; 3 other H1; 4 H3; 1 type B). 22.2% of A(H1N1)pdm09 cases had fever on arrival (2/9; 95%CI 0-55.6). Infrared thermal scans had 50.8-70.4% sensitivity and 63.6-81.7% specificity. |
| Ranjan, 201257 | Apr 25-Dec 4, 2009 | India (Indira Gandhi Int Airport) | Retrospective case review on symptom screening + PCR nasal and oropharyngeal swabs of suspected infected travelers to develop a clinical feature-based scoring system (CFSS) | Not reported | 19.9% of samples had influenza virus (127/638; A(H1N1)pdm09). The most discriminant cut-off value for CFSS was 7 with 86% sensitivity, 88% specificity, 64% positive predictive value, and 96% negative predictive value. |
| Hale, 201259 | Apr 27-Jun 22, 2009 | NZ (Auckland Int Airport) | Questionnaire from all arriving travelers + medical assessment + PCR of nasopharyngeal swab from those who met case definitions to estimate the effectiveness of screening | 456,518 | 4 samples had influenza virus (A(H1N1)pdm09). 0.1% of travelers screened were referred for medical assessment (406/456,518). Estimated sensitivity was 5.8% (95%CI 2.3–14.0%) given the expected 69 infected travelers who would have passed through the screening. |
| Sakaguchi, 201261 | (1) Apr 28-May 21, 2009 (2) May 22-Jun 18, 2009 |
Japan (Narita Int Airport) | Questionnaire + infrared thermal scan on all arriving passengers from Canada, Mexico, or the USA (1) in cabin or (2) at airport + rapid antigen testing to suspicious travelers, followed by PCR of samples to describe screening and characteristics of infected travelers and examine the effectiveness of screening | (1) N=206,037 (2) N=265,696 |
(1) 6 samples had influenza virus (4 A(H1N1)pdm09; 2 other seasonal flu). 561 suspicious travelers took a rapid test. (2) 10 samples had influenza virus (5 A(H1N1)pdm09; 3 H3; 2 other seasonal flu). 244 suspicious travelers took a rapid test. |
| Memish, 201263 | Nov-Dec 2009: (1) The week before Hajj (2) After Hajj |
Saudi Arabia (King Abdul Aziz Int Airport) | Questionnaire + thermal scan to (1) pilgrims arriving before Hajji and (2) groups of pilgrims departing after Hajji + PCR for respiratory viruses of nasopharyngeal and throat swabs to examine the association between Hajji and risk of respiratory infection | (1) N=782 (2) N=2,768 |
(1) 65 samples from arriving pilgrims had respiratory virus (1 A(H1N1)pdm09; 64 others). (2) 400 samples from departing pilgrims had respiratory virus (2 A(H1N1)pdm09; 5 other type A; 2 type B; 391 others). 0.2% of swab samples had influenza A virus (8/3,218), and 0.1% of swab samples had A(H1N1)pdm09 (3/3,218). |
| Gunaratnam, 201460 | Apr 28-Jun 18, 2009 | AU (Sydney Airport) | Questionnaires at airport clinics from all arriving travelers + thermal imaging scan + PCR/virus culture of nose and throat swabs to examine effectiveness of screening | 625,147 | 3 samples positive for influenza virus (A(H1N1)pdm09). The detection rate was 0.05 per 10,000 screened (95%CI 0.02–1.14 per 10,000). 0.9% of estimated arriving travelers were symptomatic or febrile (5,845/625,147). An estimated sensitivity and specificity were 6.7% (95%CI 1.4–18.3%) and 99.1% (95%CI 99.0-100.0%), respectively, given the expected 45 infected travelers who would have passed through the screening. |
| Jennings, 201554 | Jun 23-Sep 12, 2008 | NZ (Christchurch Int Airport) | Questionnaire + PCR of symptomatic travelers for respiratory viruses on nasal and throat swabs | 2,714 | 26% of samples had respiratory virus (342/1,313) in symptomatic travelers. 4% of samples had influenza virus (55: 7 type A; 48 type B) and 22% of samples had other respiratory viruses (287/1,313). |
| Priest, 201556 | Jun 23-Sep 12, 2008 | NZ (Christchurch Int Airport) | Questionnaire + temperature + PCR nasal and throat specimens with 3 airlines to estimate prevalence of seasonal influenza in arrivals | 23,513 | 60 samples were positive for influenza (8 type A; 51 type B; 1 both A and B).4.3% of symptomatic (56/1,317) and 0.2% of asymptomatic (4/2,409) travelers had influenza infection. Random sampling found influenza prevalence of 1.1% (95%CI 0.8-1.5; 35/3,103). The sensitivity of screening was from 3% for temperature >37.8°C to 84% for any symptom. |
| Chen, 201855 | May 2015-May 2016 | China (Xiamen Int Airport) | Infrared thermal scan + symptom screening + rapid antigen testing, followed by virus culture of nasopharyngeal swab from suspicious travelers to describe the influenza infection patterns and assess the effectiveness of rapid antigen testing | 1,540,076 | 176/1,540,076 (0.01%) of arriving travelers had influenza virus: 43 A(H1N1)pdm09; 67 H3N2; 21 other type A; 45 type B). 1,321 travelers had ILI symptoms. |
Abbreviations: NZ, New Zealand; AU, Australia; Int, International.
Prior to 2009, New Zealand had conducted several studies at airports to screen for influenza in the general population, in preparation for possible pandemics,53,54,56,64 mainly using health questionnaires and thermal scanners, and less commonly, rapid antigen tests. These strategies were effective in identifying symptomatic travelers, but less useful in detecting asymptomatic or pre-symptomatic travelers.53,56 To identify such travelers, one study developed a retrospective clinical feature-based scoring system (CFSS) (Table 4).57 Based on estimated numbers of travel-related influenza virus infections at destinations, the sensitivity of border screening was found to be between 5.8-6.7% (Table 4).59,60 Only two studies reported collecting information on influenza vaccination via health questionnaires.53,63 Based on the data from a study of pilgrims to Mecca in Saudi Arabia, vaccine coverage for seasonal influenza and pandemic influenza A(H1N1) was 53% and 30%, respectively.63
Discussion
This data synthesis illustrates the variations of influenza seasonality across world regions and highlights travel-related influenza risk, particularly during cruise ship-travel. Generally, NH influenza seasons occur between October and April, while SH seasons occur between April and October (with some variability); the one exception is the South-East Asia NH subregion, which experiences 2 distinct influenza seasons, one between January-April and one between June-September. Also, the WHO categorization of influenza seasonality26,27 portrays some anomalous designations (Figure 1) in Africa (where some countries with NH seasonality are surrounded by countries with SH seasonality) and in the Indo-Australian Archipelago (where islands shared between Indonesia and other nations appear to have different influenza seasonality from East to West). Using FluNet data instead of WHO transmission zones may help to avoid confusion regarding NH and SH influenza seasonality. FluNet provides data with clear trends in influenza transmission over time, making it a more reliable and easily understandable resource.
A 2019 systematic review on monthly influenza activity showed that influenza outbreaks were seasonal in temperate climates, peaked during winter months, and were shorter than tropical climates (3.8 vs 5.2 months).65 The fluctuation in influenza activities decreases in regions closer to the equator65 so that influenza activity in Malaysia and Singapore is stable throughout the year with no discernable peak.66,67 Countries in northern South-East Asia – Bangladesh, Cambodia, the Lao People’s Democratic Republic, the Philippines, Thailand, and Viet Nam – exhibit peak influenza activity during their summer monsoon season, between July and October.66 Another systematic review demonstrated that influenza seasonality in the tropics is highly variable, with multiple locations showing more than 1 peak.29 Lastly, a systematic review evaluating climate and environment identified that lower temperatures and lower absolute humidity are associated with higher influenza incidence. 68 In the setting of climate change, epidemiological models suggested that warm winters can lead to lower influenza incidence, resulting in an increased proportion of susceptible individuals, and subsequently early and severe epidemics during the subsequent season. 69
The latitudinal association of influenza is important in recognizing a traveler’s risk where 30°N is approximately the limit of the SH seasonality pattern, below which influenza activity peaks during the NH summer months.70,71 Roughly every 33° change in latitude from north to south leads to a delay in the peak of influenza activity by approximately 2.4 months.72 Large countries that span thousands of kilometers such as Brazil, China, and India, show distinct patterns from north to south. For example, influenza activity in India peaks between January-March in the north and between July-September closer to the south.70,71 In China, influenza activity peaks between January and February in the northern, temperate provinces and between April and June in the southern provinces, which harbor a subtropical or tropical climate.72 In Brazil, the influenza season typically starts in the Northeast and spreads southward.73
These geographical differences in influenza seasonality have implications for influenza vaccine production and distribution. Several months before each hemisphere’s influenza season, the WHO advises on the selection of strains to be included in the annual vaccine for each hemisphere.74 The traditional influenza vaccine production through culturing in eggs16,17 allows time for the virus to undergo antigenic drift, leading to decreased effectiveness of the vaccine under development.13,17 Newer vaccine platforms such as mRNA may offer protection against a broader spectrum of viruses75 and with more expeditious production, lead to better-matching of virus strains.76
Studies have recognized travel-related influenza infection to be relatively common (incidence rate of 8.9 infections per 100 person-months and 2.8% seroconversion rate)4,77 and especially cruise ship travel-related influenza outbreaks are particularly well documented.41 Numerous seasonal influenza outbreaks have occurred on cruise ships outside typical influenza seasons,46,49 and the older age and comorbidities of many cruise ship passengers raise concern for their increased risk of severe complications.45 Far less data are available regarding air travel and influenza transmission. The H1N1 pandemic in 2009 provided evidence of potential in-flight transmission of influenza, but it remains uncertain whether transmission occurs before, during, or after the flight.35-38
Our review found that the screening strategies for influenza at international airports have low sensitivity and need improvement .53-63 Health questionnaires and temperature checks have been effective in identifying symptomatic travelers but are limited in detecting asymptomatic and pre-symptomatic cases, who may transmit the virus.53,56 Regardless, travel restrictions have been shown to have limited effectiveness in containing the spread of influenza, as demonstrated during the 2009 H1N1 pandemic; despite several countries imposing travel restrictions to and from Mexico, the disease reached pandemic proportions within two weeks of the initial identified human case.78
Vaccination and antiviral treatment are important considerations to mitigate the international spread of influenza. Based on the recent example of travel-related SARS-CoV-2 dissemination and mitigation strategies developed, health care providers should remind their patients traveling internationally about the possible exposure to influenza abroad and advise them on pharmaceutical preventive measures, including influenza vaccination, in addition to non-pharmaceutical measures. As was extensively practiced during the SARS-CoV-2 pandemic, the latter includes hand hygiene, respiratory etiquette, and masking especially in densely crowded settings.79 In addition to ensuring vaccination against seasonal influenza, resources such as the WHO’s ILSI, can inform on influenza seasonality in over 140 destinations.30 The regularly updated influenza transmission data provide guidance regarding the risk for a traveler’s journey. The recognition of influenza transmission worldwide can help in the evaluation and management of febrile travelers.
Travelers who journey between the NH and SH, especially older adults, represent a unique risk population, as the current immunization schedules create a period of vulnerability during their respective spring and summer months. For example, individuals traveling from the USA or the Netherlands to Argentina in June may acquire influenza, even if they have been immunized for the current season, because their immunity may have waned by the time of travel; also, the vaccine they received may be less well-matched with the circulating virus in the meantime.
To protect travelers planning to visit destinations with high influenza circulation when the influenza vaccine is unavailable, a possible strategy is to extend the vaccine utilization beyond the expiration date, until the new vaccine is released. Considering the waning immunity several months after influenza vaccination, re-vaccinating high-risk travelers may be another strategy, albeit with a vaccine that may not fully match the circulating influenza strains at the other hemisphere. Therefore, another consideration is making influenza vaccines designed for the other hemisphere available, with the intention of using them as travel vaccines. For NH countries, this strategy would consider SH influenza as another travel-related vaccine-preventable illness, although regulatory authorities would need to approve. The interest behind this recommendation is not new; a prior survey of travel medicine practitioners identified substantial interest in having SH vaccine available for their patients (129/157; 82%) . 80
A feasible practice is providing standby influenza antiviral for travelers that have high-risk for developing influenza-related complications. These include patients with history of cardiopulmonary disease, diabetes, immunosuppression, and adults over 65 years of age.81 Prophylaxis may be even more important for travelers that may have suboptimal vaccine response or who cannot be vaccinated but have increased risk for influenza, such as a cruise or a trip to an area with active influenza transmission. 82 Oseltamivir or baloxavir may be prescribed with instructions to take as post-exposure prophylaxis or early self-treatment.34 Both oseltamivir and baloxavir are approved agents for chemoprophylaxis, with emphasis on administration to people at high risk for complications from influenza.83 This approach may also be important for travelers that were vaccinated early in the season and are planning cross-hemisphere travel months later but before the new vaccine is available .
Furthermore, newly approved over-the-counter influenza tests with >99% specificity for diagnosing influenza A and B, can support self-diagnosis,84 allowing the travelers to differentiate influenza from other illnesses and self-treat with the prescribed antivirals. However, they have yet to be commercially available and their uptake from travelers remains to be seen.
This review has several limitations, the most important of which is the utilization of data from the 4 pre-pandemic years. The COVID-19 pandemic has brought about significant changes in influenza transmission and seasonality, so it remains uncertain if the epidemiology patterns of influenza will revert to pre-pandemic norms or if new patterns will emerge. Additionally, the availability of influenza epidemiology data varies across the globe, with a majority of the data originating from affluent countries. Consequently, the patterns presented in this study may not accurately reflect the influenza epidemiology in resource-limited countries. Lastly, due to differences in healthcare systems and regulations worldwide, constraints on the prescription of antivirals may pose challenges in implementing our recommendations.
Conclusion
Influenza seasonality differs around the globe, generally peaking between October and April in the NH, and between April and October in the SH in temperate climate zones, while its seasonality is far more variable in the tropics. Influenza incidence is high among travel-related vaccine-preventable diseases and can occur during the trip as shown by cruise ship outbreaks, transmission via air travel, and through the airport screening processes (despite studies finding little benefit from airport screening). Beyond the ‘on-site epidemiology’, travelers may encounter other individuals originating from regions with ongoing transmission. As vaccines are adapted biannually for NH and SH, respectively, the current immunization schedules create a period of vulnerability during the respective spring and summer months. Healthcare providers should be aware of influenza activity when patients report travel plans, provide alerts accordingly, while advising on prevention, diagnostic and treatment options. Possible interventions in limiting the impact of influenza include using antivirals for self-treatment, preferably in combination with rapid self-tests if available, extending the shelf life of influenza vaccines to allow immunization of international travelers leaving their home countries in the summer months, and gaining access to the influenza vaccine used in the other hemisphere to use as a travel-related vaccine. The most important strategy remains optimizing seasonal influenza vaccination and reminding travelers that influenza can be a travel-related illness.
Supplementary Material
Acknowledgments
Funding: This work was supported in part by Centers for Disease Control and Prevention [U01CK000633; SRR, SK, EPH, ETR, RCL]
Footnotes
Conflict of interest: LK, RS, AO, MG, SRR, SK, EPH, ETR, RCL report no conflict of interest. AO is ad-hoc consultant and invited speaker for pharmaceutical companies, non-related to this work. RCL reports receiving funds for authorship at UpToDate. LHC reports honoraria/advisor fees from Shoreland, Valneva, Sanofi, Merck; none related to this work.
References
- 1.Steffen R. Travel vaccine preventable diseases-updated logarithmic scale with monthly incidence rates. J Travel Med. 2018;25(1). doi: 10.1093/JTM/TAY046 [DOI] [PubMed] [Google Scholar]
- 2.Boggild AK, Castelli F, Gautret P, et al. Vaccine preventable diseases in returned international travelers: results from the GeoSentinel Surveillance Network. Vaccine. 2010;28(46):7389–7395. doi: 10.1016/J.VACCINE.2010.09.009 [DOI] [PubMed] [Google Scholar]
- 3.Chen LH, Han PV., Wilson ME, et al. Self-reported illness among Boston-area international travelers: A prospective study. Travel Med Infect Dis. 2016;14(6):604–613. doi: 10.1016/J.TMAID.2016.09.009 [DOI] [PMC free article] [PubMed] [Google Scholar]
- 4.Belderok SM, Rimmelzwaan GF, van den Hoek A, Sonder GJB. Effect of Travel on Influenza Epidemiology. Emerg Infect Dis. 2013;19(6):925. doi: 10.3201/EID1906.111864 [DOI] [PMC free article] [PubMed] [Google Scholar]
- 5.Ratnam I, Black J, Leder K, et al. Incidence and risk factors for acute respiratory illnesses and influenza virus infections in Australian travellers to Asia. J Clin Virol. 2013;57(1):54–58. doi: 10.1016/J.JCV.2013.01.008 [DOI] [PubMed] [Google Scholar]
- 6.Bouvier NM, Palese P. The biology of influenza viruses. Vaccine. 2008;26 Suppl 4(Suppl 4). doi: 10.1016/J.VACCINE.2008.07.039 [DOI] [PMC free article] [PubMed] [Google Scholar]
- 7.Javanian M, Barary M, Ghebrehewet S, Koppolu V, Vasigala VKR, Ebrahimpour S. A brief review of influenza virus infection. J Med Virol. 2021;93(8):4638–4646. doi: 10.1002/JMV.26990 [DOI] [PubMed] [Google Scholar]
- 8.Lafond KE, Porter RM, Whaley MJ, et al. Global burden of influenza-associated lower respiratory tract infections and hospitalizations among adults: A systematic review and meta-analysis. PLoS Med. 2021;18(3):e1003550. doi: 10.1371/journal.pmed.1003550 [DOI] [PMC free article] [PubMed] [Google Scholar]
- 9.World Health Organization. Influenza Transmission Zones. Published 2011. Accessed October 22, 2022. https://www.who.int/publications/m/item/influenza_transmission_zones
- 10.Tamerius J, Nelson MI, Zhou SZ, Viboud C, Miller MA, Alonso WJ. Global Influenza Seasonality: Reconciling Patterns across Temperate and Tropical Regions. Environ Health Perspect. 2011;119(4):439. doi: 10.1289/EHP.1002383 [DOI] [PMC free article] [PubMed] [Google Scholar]
- 11.Centers for Disease Control and Prevention (CDC). Flu Season ∣ CDC. Published 2021. Accessed August 15, 2022. https://www.cdc.gov/flu/about/season/flu-season.htm
- 12.ECDC. Seasonal Influenza 2019-2020. Annual Epidemiological Report; 2020. Accessed October 25, 2022. www.FlunewsEurope.org
- 13.Nypaver C, Dehlinger C, Carter C. Influenza and Influenza Vaccine: A Review. J Midwifery Womens Health. 2021;66(1):45–53. doi: 10.1111/JMWH.13203 [DOI] [PMC free article] [PubMed] [Google Scholar]
- 14.Young B, Sadarangani S, Jiang L, Wilder-Smith A, Chen MIC. Duration of Influenza Vaccine Effectiveness: A Systematic Review, Meta-analysis, and Meta-regression of Test-Negative Design Case-Control Studies. J Infect Dis. 2018;217(5):731–741. doi: 10.1093/INFDIS/JIX632 [DOI] [PubMed] [Google Scholar]
- 15.Beyer WEP, Palache AM, Boulfich M, Osterhaus ADME. Clinical relevance of increased antibody titres in older adults upon vaccination with squalene-adjuvanted versus non-adjuvanted influenza vaccines. Vaccine. 2022;40(23):3098–3102. doi: 10.1016/J.VACCINE.2022.04.049 [DOI] [PubMed] [Google Scholar]
- 16.World Health Organization. Pandemic Influenza Vaccine Manufacturing Process and Timeline. Global Alert and Response. Published 2009. Accessed August 20, 2022. https://www.who.int/news/item/06-08-2009-pandemic-influenza-vaccine-manufacturing-process-and-timeline [Google Scholar]
- 17.Becker T, Elbahesh H, Reperant LA, Rimmelzwaan GF, Osterhaus ADME. Influenza Vaccines: Successes and Continuing Challenges. J Infect Dis. 2021;224(Supplement_4):S405–S419. doi: 10.1093/INFDIS/JIAB269 [DOI] [PMC free article] [PubMed] [Google Scholar]
- 18.Tricco AC, Chit A, Soobiah C, et al. Comparing influenza vaccine efficacy against mismatched and matched strains: a systematic review and meta-analysis. BMC Med. 2013;11(1):153. doi: 10.1186/1741-7015-11-153 [DOI] [PMC free article] [PubMed] [Google Scholar]
- 19.Rondy M, El Omeiri N, Thompson MG, Levêque A, Moren A, Sullivan SG. Effectiveness of influenza vaccines in preventing severe influenza illness among adults: A systematic review and meta-analysis of test-negative design case-control studies. J Infect. 2017;75(5):381–394. doi: 10.1016/J.JINF.2017.09.010 [DOI] [PMC free article] [PubMed] [Google Scholar]
- 20.Centers for Disease Control and Prevention. Vaccine Effectiveness: How Well Do Flu Vaccines Work? National Center for Immunization and Respiratory Diseases. Published 2021. Accessed November 13, 2022. https://www.cdc.gov/flu/vaccines-work/vaccineeffect.htm
- 21.Centers for Disease Control and Prevention (CDC). Seasonal Influenza Vaccine Supply for the U.S. 2021-2022 Influenza Season ∣ CDC. Accessed August 15, 2022. https://www.cdc.gov/flu/prevent/vaxsupply.htm
- 22.Kassianos G, Blank P, Falup-Pecurariu O, et al. Influenza vaccination: key facts for general practitioners in Europe—a synthesis by European experts based on national guidelines and best practices in the United Kingdom and the Netherlands. Drugs Context. 2016;5. doi: 10.7573/DIC.212293 [DOI] [PMC free article] [PubMed] [Google Scholar]
- 23.Australian Department of Health. Influenza (flu) vaccine. Australian Department of Health Webpage. Published 2022. Accessed August 20, 2022. https://www.health.gov.au/health-topics/immunisation/vaccines/influenza-flu-vaccine#when-to-get-the-influenza-vaccine [Google Scholar]
- 24.Hesse EM, Hibbs BF, Cano MV. Notes from the Field: Administration of Expired Injectable Influenza Vaccines Reported to the Vaccine Adverse Event Reporting System — United States, July 2018–March 2019. MMWR Morb Mortal Wkly Rep. 2019;68(23):529–530. doi: 10.15585/MMWR.MM6823A3 [DOI] [PMC free article] [PubMed] [Google Scholar]
- 25.Young B, Zhao X, Cook AR, Parry CM, Wilder-Smith A, I-Cheng MC. Do antibody responses to the influenza vaccine persist year-round in the elderly? A systematic review and meta-analysis. Vaccine. 2017;35(2):212–221. doi: 10.1016/J.VACCINE.2016.11.013 [DOI] [PubMed] [Google Scholar]
- 26.WHO. When to vaccinate Vaccination zone Countries, areas or territories from tropics and subtropics Vaccination timing. Published 2016. Accessed October 10, 2022. https://cdn.who.int/media/docs/default-source/emergency-preparedness/global-influenza-programme/vaccinetimingv4.pdf?sfvrsn=83ea7d13_6
- 27.WHO. Global Influenza Programme. Published 2017. Accessed August 16, 2022. https://www.who.int/tools/flunet
- 28.Li Y, Reeves RM, Wang X, et al. Global patterns in monthly activity of influenza virus, respiratory syncytial virus, parainfluenza virus, and metapneumovirus: a systematic analysis. Lancet Glob Heal. 2019;7(8):e1031–e1045. doi: 10.1016/S2214-109X(19)30264-5 [DOI] [PubMed] [Google Scholar]
- 29.Hirve S, Newman LP, Paget J, et al. Influenza Seasonality in the Tropics and Subtropics – When to Vaccinate? PLoS One. 2016;11(4):e0153003. doi: 10.1371/JOURNAL.PONE.0153003 [DOI] [PMC free article] [PubMed] [Google Scholar]
- 30.WHO. Influenza Laboratory Surveillance Information. Global Influenza Surveillance and Response System (GISRS). Published 2012. Accessed August 16, 2022. https://app.powerbi.com/view?r=eyJrIjoiZTkyODcyOTEtZjA5YS00ZmI0LWFkZGUtODIxNGI5OTE3YjM0IiwidCI6ImY2MTBjMGI3LWJkMjQtNGIzOS04MTBiLTNkYzI4MGFmYjU5MCIsImMiOjh9 [Google Scholar]
- 31.Rubin R. Influenza’s Unprecedented Low Profile During COVID-19 Pandemic Leaves Experts Wondering What This Flu Season Has in Store. JAMA. 2021;326(10):899–900. doi: 10.1001/JAMA.2021.14131 [DOI] [PubMed] [Google Scholar]
- 32.CDC Fluview. Sentinel Region Data, percentage of visits for influenza-like-illness reported by ILInet. Accessed June 20, 2023. https://www.cdc.gov/flu/weekly/weeklyarchives2018-2019/data/senAllregt39.html
- 33.Moser MR, Bender TR, Margolis HS, Noble GR, Kendal AP, Ritter DG. An outbreak of influenza aboard a commercial airliner. Am J Epidemiol. 1979;110(1):1–6. doi: 10.1093/OXFORDJOURNALS.AJE.A112781 [DOI] [PubMed] [Google Scholar]
- 34.Goeijenbier M, Van Genderen P, Ward BJ, Wilder-Smith A, Steffen R, Osterhaus ADME. Travellers and influenza: risks and prevention. J Travel Med. 2017;24(1). doi: 10.1093/JTM/TAW078 [DOI] [PMC free article] [PubMed] [Google Scholar]
- 35.Baker MG, Thornley CN, Mills C, et al. Transmission of pandemic A/H1N1 2009 influenza on passenger aircraft: retrospective cohort study. BMJ. 2010;340(7759):1293. doi: 10.1136/BMJ.C2424 [DOI] [PMC free article] [PubMed] [Google Scholar]
- 36.Hertzberg VS, Weiss H. On the 2-Row Rule for Infectious Disease Transmission on Aircraft. Ann Glob Heal. 2016;82(5):819–823. doi: 10.1016/J.AOGH.2016.06.003 [DOI] [PMC free article] [PubMed] [Google Scholar]
- 37.Hertzberg VS, Weiss H, Elon L, Si W, Norris SL. Behaviors, movements, and transmission of droplet-mediated respiratory diseases during transcontinental airline flights. Proc Natl Acad Sci U S A. 2018;115(14):3623–3627. doi: 10.1073/PNAS.1711611115 [DOI] [PMC free article] [PubMed] [Google Scholar]
- 38.Young N, Pebody R, Smith G, et al. International flight-related transmission of pandemic influenza A(H1N1)pdm09: an historical cohort study of the first identified cases in the United Kingdom. Influenza Other Respi Viruses. 2014;8(1):66–73. doi: 10.1111/IRV.12181 [DOI] [PMC free article] [PubMed] [Google Scholar]
- 39.ICAO. Aircraft Module - Air System Operations. 2021. Accessed February 22, 2023. https://www.icao.int/covid/cart/Pages/Aircraft-Module---Air-System-Operations.aspx
- 40.Khatib AN, Carvalho AM, Primavesi R, To K, Poirier V. Navigating the risks of flying during COVID-19: a review for safe air travel. J Travel Med. 2020;27(8):1–9. doi: 10.1093/JTM/TAAA212 [DOI] [PMC free article] [PubMed] [Google Scholar]
- 41.Pavli A, Maltezou HC, Papadakis A, et al. Respiratory infections and gastrointestinal illness on a cruise ship: A three-year prospective study. Travel Med Infect Dis. 2016;14(4):389–397. doi: 10.1016/J.TMAID.2016.05.019 [DOI] [PubMed] [Google Scholar]
- 42.Marshall CA, Morris E, Unwin N. An epidemiological study of rates of illness in passengers and crew at a busy Caribbean cruise port. BMC Public Health. 2016;16(1). doi: 10.1186/S12889-016-2991-3 [DOI] [PMC free article] [PubMed] [Google Scholar]
- 43.Rodrigue JP, Notteboom T. The geography of cruises: Itineraries, not destinations. Appl Geogr. 2013;38(1):31–42. doi: 10.1016/J.APGEOG.2012.11.011 [DOI] [Google Scholar]
- 44.Browne A, Ahmad SS t. O, Beck CR, Nguyen-Van-Tam JS. The roles of transportation and transportation hubs in the propagation of influenza and coronaviruses: a systematic review. J Travel Med. 2016;23(1). doi: 10.1093/JTM/TAV002 [DOI] [PMC free article] [PubMed] [Google Scholar]
- 45.Rogers KB, Roohi S, Uyeki TM, et al. Laboratory-based respiratory virus surveillance pilot project on select cruise ships in Alaska, 2013-15. J Travel Med. 2017;24(6). doi: 10.1093/JTM/TAX069 [DOI] [PMC free article] [PubMed] [Google Scholar]
- 46.Fernandes EG, De Souza PB, De Oliveira MEB, et al. Influenza B outbreak on a cruise ship off the São Paulo Coast, Brazil. J Travel Med. 2014;21(5):298–303. doi: 10.1111/JTM.12132 [DOI] [PubMed] [Google Scholar]
- 47.Brotherton JML, Delpech VC, Gilbert GL, et al. A large outbreak of influenza A and B on a cruise ship causing widespread morbidity. Epidemiol Infect. 2003;130(2):263–271. doi: 10.1017/S0950268802008166 [DOI] [PMC free article] [PubMed] [Google Scholar]
- 48.Miller JM, Tam TWS, Maloney S, et al. Cruise ships: high-risk passengers and the global spread of new influenza viruses. Clin Infect Dis. 2000;31(2):433–438. doi: 10.1086/313974 [DOI] [PubMed] [Google Scholar]
- 49.Christensen SE, Wolfmeyer RC, Suver SM, Hill CD. Influenza B virus outbreak on a cruise ship - Northern Europe, 2000. MMRW. 2001;50:1833–1834. doi: 10.1001/jama.285.14.1833 [DOI] [Google Scholar]
- 50.Ward KA, Armstrong P, McAnulty JM, Iwasenko JM, Dwyer DE. Outbreaks of pandemic (H1N1) 2009 and seasonal influenza A (H3N2) on cruise ship. Emerg Infect Dis. 2010;16(11):1731–1737. doi: 10.3201/EID1611.100477 [DOI] [PMC free article] [PubMed] [Google Scholar]
- 51.Millman AJ, Kornylo Duong K, Lafond K, Green NM, Lippold SA, Jhung MA. Influenza Outbreaks Among Passengers and Crew on Two Cruise Ships: A Recent Account of Preparedness and Response to an Ever-Present Challenge. J Travel Med. 2015;22(5):306–311. doi: 10.1111/JTM.12215 [DOI] [PMC free article] [PubMed] [Google Scholar]
- 52.Aoki Y, Amaya Dimas L del C. Influenza epidemic on a world cruise ship: A descriptive study. Travel Med Infect Dis. 2021;44. doi: 10.1016/J.TMAID.2021.102176 [DOI] [PMC free article] [PubMed] [Google Scholar]
- 53.Duncan AR, Priest PC, Jennings LC, Brunton CR, Baker MG. Screening for influenza infection in international airline travelers. Am J Public Health. 2009;99 Suppl 2(Suppl 2). doi: 10.2105/AJPH.2008.158071 [DOI] [PMC free article] [PubMed] [Google Scholar]
- 54.Jennings LC, Priest PC, Psutka RA, et al. Respiratory viruses in airline travellers with influenza symptoms: Results of an airport screening study. J Clin Virol. 2015;67:8–13. doi: 10.1016/J.JCV.2015.03.011 [DOI] [PMC free article] [PubMed] [Google Scholar]
- 55.Chen J, Yang K, Zhang M, et al. Rapid identification of imported influenza viruses at Xiamen International Airport via an active surveillance program. Clin Microbiol Infect. 2018;24(3):289–294. doi: 10.1016/J.CMI.2017.05.027 [DOI] [PMC free article] [PubMed] [Google Scholar]
- 56.Priest PC, Jennings LC, Duncan AR, Brunton CR, Baker MG. Effectiveness of border screening for detecting influenza in arriving airline travelers. Am J Public Health. 2013;103(8):1412–1418. doi: 10.2105/AJPH.2012.300761 [DOI] [PMC free article] [PubMed] [Google Scholar]
- 57.Ranjan P, Kumari A, Das R, Gupta L, Singh S, Yadav M. Evaluation of clinical features scoring system as screening tool for influenza A (H1N1) in epidemic situations. J Postgrad Med. 2012;58(4):265–269. doi: 10.4103/0022-3859.105446 [DOI] [PubMed] [Google Scholar]
- 58.Kuo J, Lee Y, Hsieh J. Initial Evaluation on Screening of Novel Influenza A (H1N1) at International Ports in Taiwan - Taiwan Centers for Disease Control. Published 2009. Accessed January 25, 2023. https://www.cdc.gov.tw/En/EpidemicTheme/Detail/hQ4XhaZAzUmNe2ksY4tjMA?archiveId=VwHsmneROzNn1Q9cHiWK_g [Google Scholar]
- 59.Hale MJ, Hoskins RS, Baker MG. Screening for influenza A(H1N1)pdm09, Auckland International Airport, New Zealand. Emerg Infect Dis. 2012;18(5):866–868. doi: 10.3201/EID1805.111080 [DOI] [PMC free article] [PubMed] [Google Scholar]
- 60.Gunaratnam PJ, Tobin S, Seale H, Marich A, McAnulty J. Airport arrivals screening during pandemic (H1N1) 2009 influenza in New South Wales, Australia. Med J Aust. 2014;200(5):290–292. doi: 10.5694/MJA13.10832 [DOI] [PubMed] [Google Scholar]
- 61.Sakaguchi H, Tsunoda M, Wada K, et al. Assessment of border control measures and community containment measures used in Japan during the early stages of Pandemic (H1N1) 2009. PLoS One. 2012;7(2). doi: 10.1371/JOURNAL.PONE.0031289 [DOI] [PMC free article] [PubMed] [Google Scholar]
- 62.Nishiura H, Kamiya K. Fever screening during the influenza (H1N1-2009) pandemic at Narita International Airport, Japan. BMC Infect Dis. 2011;11. doi: 10.1186/1471-2334-11-111 [DOI] [PMC free article] [PubMed] [Google Scholar]
- 63.Memish ZA, Assiri AM, Hussain R, Alomar I, Stephens G. Detection of respiratory viruses among pilgrims in Saudi Arabia during the time of a declared influenza A(H1N1) pandemic. J Travel Med. 2012;19(1):15–21. doi: 10.1111/J.1708-8305.2011.00575.X [DOI] [PMC free article] [PubMed] [Google Scholar]
- 64.Priest PC, Duncan AR, Jennings LC, Baker MG. Thermal image scanning for influenza border screening: results of an airport screening study. PLoS One. 2011;6(1). doi: 10.1371/JOURNAL.PONE.0014490 [DOI] [PMC free article] [PubMed] [Google Scholar]
- 65.Li Y, Reeves RM, Wang X, et al. Global patterns in monthly activity of influenza virus, respiratory syncytial virus, parainfluenza virus, and metapneumovirus: a systematic analysis. Lancet Glob Heal. 2019;7(8):e1031–e1045. doi: 10.1016/S2214-109X(19)30264-5 [DOI] [PubMed] [Google Scholar]
- 66.Saha S, Chadha M, Al Mamun A, et al. Influenza seasonality and vaccination timing in tropical and subtropical areas of southern and south-eastern Asia. Bull World Health Organ. 2014;92(5):318–330. doi: 10.2471/BLT.13.124412 [DOI] [PMC free article] [PubMed] [Google Scholar]
- 67.El Guerche-Séblain C, Caini S, Paget J, Vanhems P, Schellevis F. Epidemiology and timing of seasonal influenza epidemics in the Asia-Pacific region, 2010-2017: Implications for influenza vaccination programs. BMC Public Health. 2019;19(1):1–10. doi: 10.1186/S12889-019-6647-Y/FIGURES/5 [DOI] [PMC free article] [PubMed] [Google Scholar]
- 68.Lane MA, Walawender M, Carter J, et al. Climate change and influenza: A scoping review. J Clim Chang Heal. 2022;5:100084. doi: 10.1016/J.JOCLIM.2021.100084 [DOI] [Google Scholar]
- 69.Towers S, Chowell G, Hameed R, et al. Climate change and influenza: the likelihood of early and severe influenza seasons following warmer than average winters. PLoS Curr. 2013;5(JAN):1–8. doi: 10.1371/CURRENTS.FLU.3679B56A3A5313DC7C043FB944C6F138 [DOI] [PMC free article] [PubMed] [Google Scholar]
- 70.Koul PA, Broor S, Saha S, et al. Differences in Influenza Seasonality by Latitude, Northern India. Emerg Infect Dis. 2014;20(10):1723. doi: 10.3201/EID2010.140431 [DOI] [PMC free article] [PubMed] [Google Scholar]
- 71.Cox N. Influenza seasonality: timing and formulation of vaccines. Bull World Health Organ. 2014;92(5):311. doi: 10.2471/BLT.14.139428 [DOI] [PMC free article] [PubMed] [Google Scholar]
- 72.Dave K, Lee PC. Global Geographical and Temporal Patterns of Seasonal Influenza and Associated Climatic Factors. Epidemiol Rev. 2019;41(1):51–68. doi: 10.1093/epirev/mxz008 [DOI] [PubMed] [Google Scholar]
- 73.Almeida A, Codeço C, Luz P. Seasonal dynamics of influenza in Brazil: the latitude effect. BMC Infect Dis. 2018;18(1). doi: 10.1186/S12879-018-3484-Z [DOI] [PMC free article] [PubMed] [Google Scholar]
- 74.World Health Organization (WHO). Recommended composition of influenza virus vaccines for use in the 2022-2023 northern hemisphere influenza season. Published 2022. Accessed August 17, 2022. https://www.who.int/publications/m/item/recommended-composition-of-influenza-virus-vaccines-for-use-in-the-2022-2023-northern-hemisphere-influenza-season
- 75.Kelvin AA, Falzarano D. The influenza universe in an mRNA vaccine. Science (80- ). 2022;378(6622):827–829. doi: 10.1126/SCIENCE.ADF0900 [DOI] [PubMed] [Google Scholar]
- 76.Big mRNA players focus on flu vaccines. Nat Biotechnol. 2022;40(12):1706. doi: 10.1038/S41587-022-01620-8 [DOI] [PubMed] [Google Scholar]
- 77.Mutsch M, Tavernini M, Marx A, et al. Influenza virus infection in travelers to tropical and subtropical countries. Clin Infect Dis. 2005;40(9):1282–1287. doi: 10.1086/429243 [DOI] [PubMed] [Google Scholar]
- 78.Bajardi P, Poletto C, Ramasco JJ, Tizzoni M, Colizza V, Vespignani A. Human Mobility Networks, Travel Restrictions, and the Global Spreadof 2009 H1N1 Pandemic. PLoS One. 2011;6(1):16591. doi: 10.1371/JOURNAL.PONE.0016591 [DOI] [PMC free article] [PubMed] [Google Scholar]
- 79.Kim MS, Seong D, Li H, et al. Comparative effectiveness of N95, surgical or medical, and non-medical facemasks in protection against respiratory virus infection: A systematic review and network meta-analysis. Rev Med Virol. 2022;32(5):e2336. doi: 10.1002/RMV.2336 [DOI] [PMC free article] [PubMed] [Google Scholar]
- 80.Strikas RA, Kozarsky PE, Reed C, Kapella BK, Freedman DO. Should Health-Care Providers in the United States Have Access to Influenza Vaccines Formulated for the Southern Hemisphere? J Travel Med. 2008;15(6):442–446. doi: 10.1111/J.1708-8305.2008.00254.X [DOI] [PubMed] [Google Scholar]
- 81.Uyeki TM. High-risk Groups for Influenza Complications. JAMA. 2020;324(22):2334–2334. doi: 10.1001/JAMA.2020.21869 [DOI] [PubMed] [Google Scholar]
- 82.Freedman DO, Leder K. Influenza: Changing approaches to prevention and treatment in travelers. J Travel Med. 2005;12(1):36–44. doi: 10.2310/7060.2005.00007/2/JTM12-0036.PDF.GIF [DOI] [PubMed] [Google Scholar]
- 83.CDC. Influenza Antiviral Medications: Summary for Clinicians. Published 2016. Accessed June 17, 2023. https://www.cdc.gov/flu/professionals/antivirals/summary-clinicians.htm
- 84.FDA. FDA Authorizes First Over-the-Counter At-Home Test to Detect Both Influenza and COVID-19 Viruses. Accessed March 31, 2023. https://www.fda.gov/news-events/press-announcements/fda-authorizes-first-over-counter-home-test-detect-both-influenza-and-covid-19-viruses
Associated Data
This section collects any data citations, data availability statements, or supplementary materials included in this article.