

Summary
Measuring the cytotoxicity of human T cells is a valuable but challenging task. We present a protocol for assessing the ability of polyclonal human T cells to kill target cells upon T cell receptor (TCR) triggering. We describe steps for preparing L and T cells for the assay and incubation of target cells with effector cells. We detail procedures for assessing cell death by flow cytometry. This protocol can be applied to small numbers of effector cells isolated from patient samples.
For complete details on the use and execution of this protocol, please refer to Wang et al.1
Subject areas: Cell culture, Cell-based Assays, Immunology
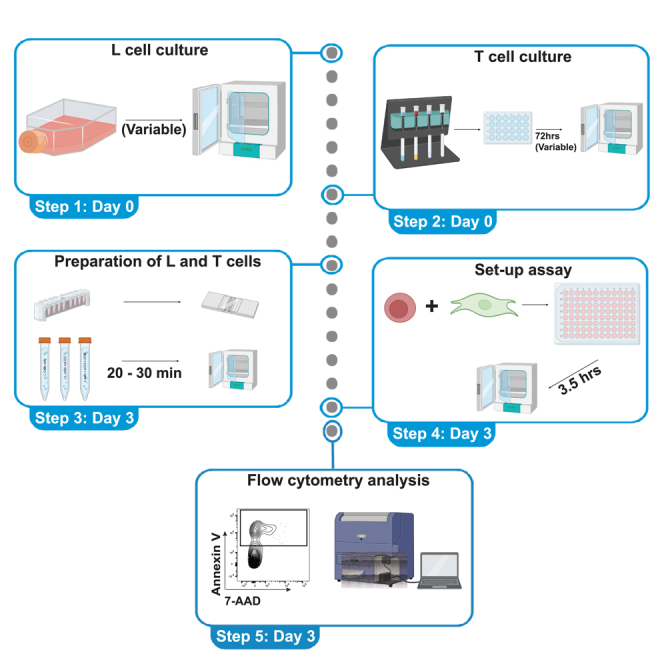
Graphical abstract
Highlights
-
•
Steps to assess human CD8 T cell ability to kill target cells upon TCR activation
-
•
Instructions for performing the cytotoxicity assay utilizing a fibroblast cell line
-
•
Guidance on choice of anti-CD3 clone and cytotoxic T cell stimulation
Publisher’s note: Undertaking any experimental protocol requires adherence to local institutional guidelines for laboratory safety and ethics.
Measuring the cytotoxicity of human T cells is a valuable but challenging task. We present a protocol for assessing the ability of polyclonal human T cells to kill target cells upon T cell receptor (TCR) triggering. We describe steps for preparing L and T cells for the assay and incubation of target cells with effector cells. We detail procedures for assessing cell death by flow cytometry. This protocol can be applied to small numbers of effector cells isolated from patient samples.
Before you begin
Institutional permissions
Human individual research was performed according to the Institutional Review Board at Mass General Brigham and informed consent was obtained from all participants (IRB protocol 2014P002558).
Background
The protocol below describes the steps for performing a cell cytotoxicity assay using L cells that express the Fc receptor - CD32, and the costimulatory receptor - CD80, cocultured with various phenotypes of CD8 T cells as effector cells.2,3,4 Following incubation with anti-CD3 antibodies, the L cells “present” anti-CD3 antibodies to effector CD8 T cells via CD32, allowing for TCR activation and possible subsequent killing of the antigen presenting L cell (Figure 1). In our experience, measurement of cell death by Annexin V staining using flow cytometry works well to assess death of the L cells.
Figure 1.

Depiction of cytotoxic T cells (red) and L cells (green) during the described cytotoxicity assay
The data exemplified in this protocol focus on total or memory CD8 T cells isolated from blood of healthy donors.5 We have additionally employed this assay to measure the cytotoxic capacity of T cells from synovial fluid or blood of patients with rheumatoid arthritis and immune checkpoint inhibitor-associated arthritis to demonstrate superior cytotoxic capacity of specific CD8 T cells subsets.1,6 We recommend using the protocol for sorted cytotoxic T cells of interest isolated from either blood or tissue.
L cell culturing
Timing: variable
-
1.Thaw L cells.
-
a.Wash in warm L cell media.
-
b.Plate ∼1E5 L cells per T75 flask. Adjust the flask size based on the cell number required.
-
c.Culture in 37°C for 1–3 days until ∼80% confluent.
-
a.
-
2.Passaging L cells.
-
a.Remove spent media from culture flasks by aspiration.
-
b.Wash adhered cells with at least 10 mL sterile 1X PBS. Aspirate PBS and discard.
-
c.Add 10 mL warm 1X trypsin-EDTA to adhered cells/flask.
-
d.Place the flask in 37°C incubator for 3–5 min. Following incubation, agitate the cells by gently tapping the side of the flask.
-
e.Confirm under a microscope that cells are completely detached before proceeding.
-
f.Aliquot 10 mL of warm L cell media to a sterile 50 mL conical tube.
-
g.Stop trypsin EDTA process by pipetting detached cells into tube containing fresh L cell media.
-
h.Centrifuge cell suspension at approximately 450 × g for 5 min at 4°C .
-
i.Aspirate supernatant and discard.
-
j.Resuspend centrifuged cells in 1 mL of fresh L cell media.
-
a.
-
3.Determine cell concentration.
-
a.Determine cell count using a hemocytometer.
-
b.Adjust the concentration to 1E5 L cells per mL.
-
c.Add appropriate amount of L cell media to a sterile T75 flask.
-
d.Mix in 1E5 L cells into T75 containing media. 1E5 cells are typically approximately 10% of a confluent flask which is the recommended subcultivation ratio for L cells.
-
e.Incubate at 37°C, in 5%–10% CO2 and 95% relative humidity for 3–5 days.
-
a.
Note: It is important to regularly check on the cells and repeat the above steps as needed to keep the cells from becoming too confluent. We recommend passaging the L cells before or when they become ∼80% confluent.
T cell isolation and culture
-
4.Isolate T cell phenotype of interest according to manufacturer protocol7 or by FACS.
-
a.Follow manufacturer’s protocol for T cell isolation kit or FACS sorting protocol.
-
b.Collect and centrifuge isolated T cells at approximately 450 × g for 5 min at 4°C.
-
c.Resuspend centrifuged cells in 1 mL of T cell media.
-
d.Determine cell count using a hematocytometer.Optional: Plate T cells for stimulation.
-
e.Adjust concentration of cells to 1E6 per 1 mL of media.
-
f.Divide T cells into unstimulated and stimulated conditions.
-
g.Plate isolated and counted T cells into 24-well plate at a concentration of 5E5 per 1 mL per well or in desired concentration in desired plate size.
-
h.Add desired concentration of CD3/CD28 stimulation to cells in stimulated condition. See note regarding concentration. Be sure to plate excess wells of T cells if T cell death following stimulation is expected, see problem 2 below.
-
i.Incubate cells at 37°C 5% CO2 for 72 h.Note: This is a helpful step to boost cytotoxic capacity (Figure 3A); however, if assessing a population of highly activated cytotoxic cells sorted from a patient sample, a short rest of ∼2 h without stimulation can be sufficient.Note: We used Dynabeads (Thermo Fisher Scientific) at a 5:1 (cell to bead) ratio to stimulate T cells. For example, we included 2.5 μL of Dynabeads per 5E5 in 1 mL of media per well. You may include cytokines such as IL-2, IL-7, or IL-15 with or without CD3/CD28 stimulation (Figure 3C) or include whatever additional modification to the T cell culture at this time.
-
a.
Figure 3.

Results of cytotoxicity assays using CD8 T cells following various stimulations
(A) Comparison of cell death of L cells as measured by Annexin V following assay with unstimulated and stimulated CD8 T cells in the presence and absence of anti-CD3-incubated L cells. ○ depicts total CD8 T cells, □ depicts memory CD8 T cells. n = 6 (B) Comparison of cell death of L cells pre-incubated with anti-CD3 OKT3 clone vs. SK7 clone following incubation with CD8 T cells. n = 3 (C) Comparison of cell death by CD8+ T cells unstimulated or stimulated with IL15 or IFNβ in L cells pre-incubated with anti-CD3 OKT3 clone vs. SK7 clone. ∗∗p ≤ 0.01, ∗p ≤ 0.05 by ratio paired T test. n = 3 (D) Annexin V staining in L cells pre-incubated with anti-CD3 after incubation with unstimulated or anti-CD3/anti-CD28 stimulated naive (∗∗p ≤ 0.01), memory (∗∗p ≤ 0.01) or TEMRA CD8+ T cells. n = 4 (E) Annexin V staining of L cells after incubation with unstimulated or IFNβ stimulated naïve, memory, or TEMRA (∗p ≤ 0.05) CD8 T cells. n = 5 (F) Memory CD8+ T cells cultured in complete media for 3 days in the presence and absence of anti-CD3/anti-CD28 were exposed to V-type H + -ATPase inhibitor concanamycin A (CMA) at 10 nM, then incubated with L cells pre-incubated with anti-CD3 antibody. Cytotoxicity of memory CD8+ T cells was inhibited by exposure to concanamycin A. n = 6. ○ depicts usage of SK7, □ depicts usage of OKT3 during assay. Each color represents a different healthy T cell donor.
Key resources table
| REAGENT or RESOURCE | SOURCE | IDENTIFIER |
|---|---|---|
| Antibodies | ||
| Annexin V APC; 1:20 | BioLegend | 640920 |
| 7-AAD; 1:20 | BioLegend | 420404 |
| Annexin V binding buffer | BioLegend | 422201 |
| CD3 monoclonal antibody (clone: SK7); 50 μg/mL | Invitrogen | 16-0036-81 |
| CD3 monoclonal antibody (clone: OKT3); 50 μg/mL | Invitrogen | 16-0037-81 |
| CD32 APC; 1:100 | BioLegend | 303208 |
| Biological samples | ||
| Leukoreduction collars | Crimson Core (BWH) | N/A |
| Chemicals, peptides, and recombinant proteins | ||
| Concanamycin A | R&D Systems | 2656 |
| CellTrace CFSE | Thermo Fisher Scientific | 65-0850-84 |
| Dynabeads human T-activator CD3/CD28 | Thermo Fisher Scientific | 11131D |
| Recombinant human IFNβ | R&D Systems | 8499-IF-010/CF |
| Recombinant human IL-15 | R&D Systems | BT-015 |
| Fetal bovine serum | GeminiBio | 100-106 |
| Gibco Penicillin-Streptomycin (10,000 U/mL) | Thermo Fisher Scientific | 15140122 |
| Gibco Gentamicin reagent solution | Thermo Fisher Scientific | 15710064 |
| Gibco L-glutamine | Thermo Fisher Scientific | 25030081 |
| Gibco Trypsin-EDTA 0.5% (10X) | Thermo Fisher Scientific | 15400054 |
| Gibco DMEM | Thermo Fisher Scientific | 11966025 |
| Gibco RPMI 1640 medium | Thermo Fisher Scientific | 11875093 |
| Gibco PBS (10X), pH 7.4 | Thermo Fisher Scientific | 70011069 |
| Critical commercial assays | ||
| CD8+ Memory T Cell Isolation Kit, human | Miltenyi Biotec | 130-094-412 |
| CD8+ T Cell Isolation Kit, human | Miltenyi Biotec | 130-096-495 |
| Experimental models: Cell lines | ||
| L cells expressing CD32 | Dr. Megan Levings, PhD | De Waal Malefyt et al.,8 Boardman et al.9 |
| Software and algorithms | ||
| FlowJo | BD Biosciences | V10.10.0 |
| Prism | GraphPad | V10.3.1 |
| Other | ||
| BD Canto II | BD Biosciences | N/A |
| BD Fortessa | BD Biosciences | N/A |
| Nalgene Rapid-Flow Sterile single use vacuum filter units | Thermo Fisher Scientific | 566-0020 |
Note: For CD8 T cell isolation, other commercially available isolation kits can be used with no protocol deviation. In addition, FACS can replace the use of an isolation kit. Any available flow cytometer can be used for recording the cell death of the target cells and any FACS analysis or graphing software can be used for analysis.
Materials and equipment
L Cell Media
| Reagent | Amount |
|---|---|
| DMEM | 500 mL |
| Heat inactivated Fetal Bovine Serum | 55 mL |
| Penicillin-Streptomycin | 5.5 mL |
| L-glutamine | 5.5 mL |
| Gentamicin | 550 μL |
T Cell Media
| Reagent | Amount |
|---|---|
| RPMI | 500 mL |
| Heat inactivated Fetal Bovine Serum | 55 mL |
| Penicillin-Streptomycin | 5.5 mL |
| L-glutamine | 5.5 mL |
| Gentamicin | 550 μL |
Note: We recommend sterile filtering the media following addition of all the indicated components. Store at 4°C and keep for approximately a month.
Step-by-step method details
Part 1: Prepare L cells for incubation with T cells
This step allows for the determination of ratio and number of L cells to be plated with effector T cells as well as the maximum number of conditions, including replicates, that can be plated.
-
1.Collect L cells from T75 culture flasks.
-
a.Follow steps detailed in above L cell culturing section 2a-j.
-
b.Determine number of L cells using hemocytometer.
-
a.
-
2.Incubate L cells with anti-CD3 antibody.
-
a.Incubate L cells in CFSE (prepared according to manufacturer’s instructions) and anti-CD3 (50 μg/mL) for 20–30 min at 37°C in PBS (with no serum added) at a concentration of 1E6 cells per mL of PBS. For example, 1E6 L cells should be incubated in 1 mL of PBS and 50 μg of anti-CD3 antibody.
-
a.
Note: This step should be done in 1X PBS or other serum-free media as serum could dim CFSE stain.
Note: The choice of which anti-CD3 clone to choose should not be overlooked. Of the two anti-CD3 clones which we have tested, we suggest that the clone OKT3 should be used to compare CD8 subsets with high cytotoxic potential, while the clone SK7 should be used to compare CD8 subsets with lower expected cytotoxic potential. See Figures 3B and 3C.
-
3.Incubate some L cells in CFSE only to serve as non-stimulating control. Include enough L cells in order to plate the desired number of non-stimulated controls. See step 5 for example calculations.
-
a.Wash with sufficient volume of T cell media.
-
b.Centrifuge at approximately 450 × g for 5 min at 4°C to pellet cells.
-
c.Resuspend cells in 1 mL of fresh T cell media.
-
d.Count cells using hemocytometer.Note: Leave cells on ice during intervals.
-
a.
Part 2: Preparation of T cells for incubation with L cells
This step allows for the determination of ratio and number of T cells to be plated against L cells as well as the maximum number of conditions, including replicates and controls, that can be plated.
-
4.Consolidate T cells of the same condition into a single tube.
-
a.For cells not containing Dynabeads:
-
i.Mix gently using a P-1000 pipette.
-
ii.Transfer cell solution in wells of the same condition into a 15 mL conical tube.Optional: Rinse the wells with 1 mL of fresh complete media to maximize cell count.
-
i.
-
b.For cells containing Dynabeads:
-
i.Mix gently using a pipette.
-
ii.Transfer cell solution into sterile 1.5 mL microcentrifuge tubes and remove Dynabeads using a magnetic separation rack.
-
iii.Gently transfer the cell solution from the microcentrifuge tubes to a 15 mL conical tube.
-
i.
-
c.Centrifuge the T cells at approximately 450 × g for 5 min at 4°C.
-
d.Resuspend in 1 mL of T cell media each.
-
e.Determine number of T cells in each condition using a hemocytometer.Note: Preparation of T cells (Part 2) should be done during L cell preparation (Part 1) to avoid cell death.
-
a.
Part 3: Incubation of target cells with effector cells
This step combines the target and effector cells for cell death analysis.
-
5.Plate the cells.
-
a.Determine number and ratio of target and effector cells to plate, as well as number of experimental conditions, based on the number of T and L cells obtained in Steps 1 and 2.Note: Avoid using less than 5,000 L cells per assay well if possible. A ratio of 10:1 (Effector T cells:Target L cells) is optimal but should be adjusted based on goals and availability. For example, if the lowest count of T cells recovered per condition is 9E4 T cells, then the number of T cells per well should be 4.5E4 T cells each in duplicate (to allow for a technical replicate). The number of L cells for a 10:1 (Effector:Target) ratio would then be 5E3 L cells per well.
-
b.Set up 96-well round bottom plate for cytotoxicity assay by planning locations for conditions and labeling.Note: Using a round bottom well is more efficient than a flat bottom well in order to encourage better T cell-L cell contact.
-
c.Adjust aliquots of T cells to a concentration of 100,000 T cells (or desired number of T cells per assay well) per 150 μL.
-
d.Adjust aliquots of L cells to a concentration of 10,000 L cells (or desired number of L cells per assay well) per 100 μL.
-
e.Transfer 150 μL of T cells in solution to the appropriate wells.
-
f.Transfer 100 μL of L cells in solution to the appropriate wells.Note: Counts should be adjusted based on desired ratio of Effector:Target cells as described above. Volumes can be adjusted according to individual needs and may need to be adjusted if an inhibitory agent or added cytokine is added, but total volume should not exceed 250 μL per well.
-
a.
-
6.
Mix the solution using a multichannel pipette.
-
7.
Incubate for 3 h 30 min at 37°C at 5% CO2 and 95% relative humidity.
Note: Timing of assay can be adjusted if longer time is required to observe cytotoxic cell death. See problem 4 below.
Part 4: Assessment of cell death by flow cytometry
This step involves preparation and guidelines for measurement of cell death for flow cytometry of the cells following incubation.
-
8.Harvest cells.
-
a.Remove the cells from the incubator and centrifuge the plate at approximately 450 × g for 2 min at 4°C.
-
b.Using a multichannel pipette remove ∼220 μL of supernatant without disturbing the cells and store immediately at −80°C for future further analysis.Note: Supernatant may be discarded or saved for use at later time to assess levels of granzyme B, Perforin, IFNγ, LDH etc.
-
c.Using a multichannel pipette, add 100 μL of 1X PBS to wells and mix thoroughly to resuspend non-adherent cells including the T cells.
-
d.Transfer total volume left in wells to a 96 well staining plate or to FACS tubes.
-
e.Add 120 μL of 1X Trypsin-EDTA to wells of culture plate and mix thoroughly.
-
f.Incubate culture plate at 37°C for 5 min.
-
g.Add 50 μL of T cell media to culture plate to stop Trypsin action and mix well with a multichannel pipette.
-
h.Transfer the volume to the staining plate or FACS tubes.Note: If the capacity of the staining plate or FACS tubes is too low, centrifuge the staining plate or FACS tubes and discard the supernatant to collect the remaining cells and washes from the culture plate.
-
i.Collect the remaining cells in the culture plate by adding 100 μL of 1X PBS to each well of the culture plate, mix thoroughly, and transferring to the staining plate or FACS tubes.
-
j.Centrifuge the staining plate or FACS tubes at approximately 450 × g for 2–3 min at 4°C.
-
k.Discard supernatant from staining plate or FACS tubes and begin staining steps.
-
a.
-
9.Stain cells.
-
a.Make a staining master-mix solution of 5 μL Annexin V, 5 μL 7-AAD and 90 μL Annexin V Binding buffer for each well. For example, if 10 wells need to be processed the mix should contain 50 μL Annexin V (10 ∗ 5 μL), 50 μL 7-AAD (10 ∗ 5 μL), and 90 μL (10 ∗ 90 μL) of Annexin V Binding buffer.
-
b.Discard supernatant from staining plate.
-
c.Transfer 100 μL of staining master mix solution from 8a to each well.
-
d.Mix thoroughly and incubate for 15–20 min at room temperature in the dark.
-
e.If using a staining plate, prepare FACS tubes for each well and transfer volume in wells to FACS tubes.
-
f.Add 250 μL of Annexin V binding buffer to each tube after incubation. Record data from samples using a flow cytometer.
-
a.
Note: If running more than 20 conditions, you may need to stain in batches, as it is better to record your samples as soon as possible to avoid accumulating cell death that is not mediated directly by T cell killing.
-
10.Analyze flow cytometry data.
- a.
Figure 2.

Confirmation of CD32 expression and example gating strategy for L cell death measurement
(A) L cells expressing CD32 and control L cells were stained with an anti-CD32 antibody and assessed by flow cytometry.
(B) Gating strategy for Annexin V and 7-AAD in a non-stimulated effector T cells sample.
Expected outcomes
We have developed a simple cell-based assay to determine cytotoxic potential of a polyclonal human T cell population including small, tissue-derived T cell populations.1 The assay utilizes L cells expressing the FC receptor CD32 as the target cell (Figure 2A), followed by staining for Annexin V and 7-AAD for the assessment of death of the target cells (Figure 2B). We have demonstrated the reliance on TCR stimulation for the cytotoxicity potential (Figure 3A). Assays performed without anti-CD3 loading on the L cells resulted in significantly less killing of target L cells, indicating that the cell death is induced by TCR ligation.
Furthermore, the clone of anti-CD3 antibody used to stimulate the T cells during the assay is an important variable that should be considered. L cells that were pre-incubated with the SK7 clone of anti-CD3 were killed at a higher frequency than those pre-incubated with the OKT-3 clone of anti-CD3 (Figure 3B). Measurement of supernatant following the assays indicated that T cells stimulated with SK7-presenting L cells produced higher levels of cytotoxic molecules granzyme B and perforin than those stimulated with OKT-3-presenting L cells. Thus, SK7 might be a better choice of clone if lower levels of cytotoxic death are expected, while OKT-3 might be a better choice of clone when attempting to observe differences between two subsets with high expected cytotoxic potential.
Using this protocol, we demonstrated that stimulation of CD8 T cells before the assay with either IFNβ or IL-15, but especially IL-15, increases the cytotoxic potential of CD8 T cells (Figure 3C). Additionally, analysis of CD8 T cells sorted into subsets based on expression of CCR7 and CD45RA demonstrated that memory (CCR7-CD45RA-) CD8 T cells have greater cytotoxic capacity than TEMRA (CCR7-CD45RA+) CD8 T cells when pre-stimulated with anti-CD3/28 beads (Figure 3D). However, without pre-activation with anti-CD3/28 beads, IFNβ had a greater impact on the cytotoxic capacity of TEMRA CD8 T cells than it did on memory CD8 T cells (Figure 3D). For validation, we employed concanamycin A to block perforin release from CD8 effector cells during the cytotoxicity assay. Addition of concanamycin A reduced the level of L cell death in TCR-stimulated CD8 T cell conditions, but not in unstimulated conditions (Figure 3E).
Limitations
With this assay, we can assess effector induce TCR mediated cell death of target L cells. This protocol provides a valuable alternative method to measurement of cell degranulation, LDH release, and other methods of measurement of cytotoxic death.10,11,12 We cannot fully distinguish distinct methods of T cell-mediated killing, such as killing by granzyme B versus Fas ligand or other molecules.13,14,15 For our purposes, we have validated our results by also measuring granzyme B and perforin production by ELISAs of the assay supernatant and with blockade of perforin release using concanamycin (Figure 3F). This assay is also limited in that specific antigens are not used. By employing anti-CD3 antibodies, we ensure consistent TCR activation of the effector CD8 T cells, and thus the stimulation may be more potent than that seen by a cytotoxic T cell in vivo. However, the assay serves the purpose of testing ex vivo CD8 T cell cytotoxicity of a given subset subset/condition if antigen were to be encountered in vivo.
Troubleshooting
Problem 1
Negative control conditions have high death rate (part 1: prepare L cells for incubation with T cells).
High expression of Annexin V and/or 7-AAD in the negative controls or unstimulated T cell conditions reduces confidence in the results overall and can make it difficult to parse the actual percentage of targeted killing of target cells by effector cells. This is often a result of stress on the target cells (L cells) prior to the cytotoxicity assay.
Potential solution
-
•
L cell culturing: L cells grow robustly but daily observation and timely passaging are essential to maintaining healthy, assay-ready cells. Passaging them every 3–4 days depending on the confluency of cells is ideal and will help prevent background noise in your experiment. L cells should not become more than 80% confluent. CFSE toxicity: CFSE may be toxic to the L cells resulting in dead or dying target cells prior to incubation with effector cells. To minimize this effect, you may reduce the timing of exposure to CFSE, the concentration of CFSE or, if necessary, rely on FSC vs. SSC gating to distinguish target cells from effector cells.
-
•
Time efficiency: It is necessary to record your data as soon as possible. Once samples are stained with Annexin V and 7-AAD, you must work quickly to record the data within an hour of staining. Otherwise, you risk cells dying as they sit and wait to be recorded which makes it more difficult to account for targeted killing by cytotoxic T cells.
Problem 2
Insufficient number of cells to perform experiment (part 1: prepare L cells for incubation with T cells and part 2: preparation of T cells for incubation with L cells).
Low cell yield, particularly of effector cells, minimizes the number of conditions that can be performed at optimal ratios.
Potential solution
-
•
T cell culturing: Err on the side of caution when isolating desired T cell populations ahead of the cytotoxicity assay. During the activation time, it is expected that cells will be lost. Plate additional wells where possible to maximize yield at the time of the assay setup.
-
•
L cell culturing: You are less likely to encounter insufficient number of L cells for the assay as they proliferate robustly when cultured. To address this, be diligent about passaging your cells and pre-incubate an excess with anti-CD3 and CFSE to ensure harvest of sufficient quantity.
-
•
Alterations to ratio: While 10:1 is the optimal ratio; we have successfully performed this assay with 5:1 and 2:1 effector cell: target L cell ratios. You may also reduce the number of T cells and L cells, although we do not advise using less than 5,000 L cells per assay well.
Problem 3
Target cells did not die (T cell isolation and culture).
It is expected that cytotoxic capacity is less robust in not activated or unstimulated T cells so this may be indicative of intrinsic qualities of the effector cells.
Potential solution
-
•
T cell viability: Target cells not dying could be indicative of low T cell viability. To address this, culture T cells with IL-15 or IL-7 during the pre-stimulation step.
-
•
Include a positive control of CD8 T cells with expected cytotoxic function to ensure a successful assay was performed.
-
•
Periodically stain the CD32-expressing L cells for CD32 to ensure expression is not lost.
Problem 4
There is no difference in frequency of Annexin V + L cells between T cell conditions despite expected differences (part 1: prepare L cells for incubation with T cells).
Potential solution
-
•
Consider increasing or decreasing the time of the 3.5 h assay.
-
•
As noted above and in Figures 3B and 3C, choose a clone of anti-CD3 such as OKT3 that results in less granzyme B production by T cells in situations where both conditions have high frequencies of Annexin V or a clone which results in higher production of granzyme B such as SK7 in cases where both conditions have low frequencies of Annexin V+ cells.
Problem 5
Annexin V and 7-AAD fluorescence varies between experiments (part 4: assessment of cell death by flow cytometry).
Potential solution
-
•
Edit the gating strategy for individual experiments instead of using replicated gates.
-
•
Maintain consistency across experiments by including fluorescence minus one (for Annexin V and 7-AAD) and non-stimulated (no anti-CD3 incubation for L cells) controls within each batch. Calculate the frequency of cell death as compared to controls containing no T cells for each individual experiment.
Resource availability
Lead contact
Further information and requests for resources and reagents should be directed to and will be fulfilled by the lead contact, Kathryne E. Marks (kemarks@bwh.harvard.edu).
Technical contact
Technical questions on executing this protocol should be directed to and will be answered by the technical contact, Kathryne E. Marks (kemarks@bwh.harvard.edu).
Materials availability
This study did not generate new unique reagents. All reagents are commercially available or can be provided by technical and/or lead contact.
Data and code availability
This study did not generate unique datasets/code.
Acknowledgments
This work was supported in part by funding from the Rheumatology Research Foundation, Department of Defense DOD SSc SL200016P1, and NIAMS P30 AR070253 to D.A.R. and NIAMS 5T32AR007530-40 to K.E.M. We thank Megan Levings for the gift of CD32-expressing L cells. We thank the Center for Cellular Profiling at BWH and Junning Case for assistance in cell sorting and flow cytometry. The graphical abstract was created in part using Biorender.com.
Author contributions
K.E.M. and I.A. designed the protocol, wrote the initial manuscript, and performed and analyzed experiments. J.S. provided critical ideas and edited the manuscript. D.A.R. conceptualized the protocol, provided the funding, and edited the manuscript.
Declaration of interests
The authors declare no competing interests.
Contributor Information
Kathryne E. Marks, Email: kemarks@bwh.harvard.edu.
Deepak A. Rao, Email: darao@bwh.harvard.edu.
References
- 1.Wang R., Singaraju A., Marks K.E., Shakib L., Dunlap G., Adejoorin I., Greisen S.R., Chen L., Tirpack A.K., Aude C., et al. Clonally expanded CD38hi cytotoxic CD8 T cells define the T cell infiltrate in checkpoint inhibitor–associated arthritis. Science Immunology. 2023;8 doi: 10.1126/sciimmunol.add1591. [DOI] [PMC free article] [PubMed] [Google Scholar]
- 2.Powell M.S., Barton P.A., Emmanouilidis D., Wines B.D., Neumann G.M., Peitersz G.A., Maxwell K.F., Garrett T.P., Hogarth P.M. Biochemical analysis and crystallisation of FcγRIIa, the low affinity receptor for IgG. Immunol. Lett. 1999;68:17–23. doi: 10.1016/S0165-2478(99)00025-5. [DOI] [PubMed] [Google Scholar]
- 3.Qiu W.Q., de Bruin D., Brownstein B.H., Pearse R., Ravetch J.V. Organization of the Human and Mouse Low-affinity FcγR Genes: Duplication and Recombination. Science. 1990;248:732–735. doi: 10.1126/science.2139735. [DOI] [PubMed] [Google Scholar]
- 4.Acuto O., Michel F. CD28-mediated co-stimulation: a quantitative support for TCR signalling. Nat. Rev. Immunol. 2003;3:939–951. doi: 10.1038/nri1248. [DOI] [PubMed] [Google Scholar]
- 5.Austyn J.M., Smith K.G., Morris P.J. T cell activation by anti-CD3 antibodies: function of Fc receptors on B cell blasts, but not resting B cells, and CD18 on the responding T cells. Eur. J. Immunol. 1987;17:1329–1335. doi: 10.1002/eji.1830170917. [DOI] [PubMed] [Google Scholar]
- 6.Zhang F., Jonsson A.H., Nathan A., Millard N., Curtis M., Xiao Q., Gutierrez-Arcelus M., Apruzzese W., Watts G.F.M., Weisenfeld D., et al. Deconstruction of rheumatoid arthritis synovium defines inflammatory subtypes. Nature. 2023;623:616–624. doi: 10.1038/s41586-023-06708-y. [DOI] [PMC free article] [PubMed] [Google Scholar]
- 7.Biotec M. 2020. https://static.miltenyibiotec.com/asset/150655405641/document_8654o6vc795h7a0t71igh5cn62?content-disposition=inline
- 8.De Waal Malefyt R., Verma S., Bejarano M.-T., Ranes-Goldberg M., Hill M., Spits H. CD2/LFA-3 or LFA-l/ICAM-1 but not CD28/B7 interactions can augment cytotoxicity by virus-specific CD8+ cytotoxic T lymphocytes. Eur. J. Immunol. 1993;23:418–424. doi: 10.1002/eji.1830230218. [DOI] [PubMed] [Google Scholar]
- 9.Boardman D.A., Wong M.Q., Rees W.D., Wu D., Himmel M.E., Orban P.C., Vent-Schmidt J., Zachos N.C., Steiner T.S., Levings M.K. Flagellin-specific human CAR Tregs for immune regulation in IBD. J. Autoimmun. 2023;134 doi: 10.1016/j.jaut.2022.102961. [DOI] [PMC free article] [PubMed] [Google Scholar]
- 10.Betts M.R., Koup R.A. Methods in Cell Biology. Academic Press; 2004. Detection of T-Cell Degranulation: CD107a and b; pp. 497–512. [DOI] [PubMed] [Google Scholar]
- 11.Kumar P., Nagarajan A., Uchil P.D. Analysis of Cell Viability by the Lactate Dehydrogenase Assay. Cold Spring Harb. Protoc. 2018;2018 doi: 10.1101/pdb.prot095497. [DOI] [PubMed] [Google Scholar]
- 12.Zaritskaya L., Shurin M.R., Sayers T.J., Malyguine A.M. New flow cytometric assays for monitoring cell-mediated cytotoxicity. Expert Rev. Vaccines. 2010;9:601–616. doi: 10.1586/erv.10.49. [DOI] [PMC free article] [PubMed] [Google Scholar]
- 13.Upadhyay R., Boiarsky J.A., Pantsulaia G., Svensson-Arvelund J., Lin M.J., Wroblewska A., Bhalla S., Scholler N., Bot A., Rossi J.M., et al. A Critical Role for Fas-Mediated Off-Target Tumor Killing in T-cell Immunotherapy. Cancer Discov. 2021;11:599–613. doi: 10.1158/2159-8290.Cd-20-0756. [DOI] [PMC free article] [PubMed] [Google Scholar]
- 14.Russell J.H., Ley T.J. Lymphocyte-Mediated Cytotoxicity. Annu. Rev. Immunol. 2002;20:323–370. doi: 10.1146/annurev.immunol.20.100201.131730. [DOI] [PubMed] [Google Scholar]
- 15.Kägi D., Vignaux F., Ledermann B., Bürki K., Depraetere V., Nagata S., Hengartner H., Golstein P. Fas and Perforin Pathways as Major Mechanisms of T Cell-Mediated Cytotoxicity. Science. 1994;265:528–530. doi: 10.1126/science.7518614. [DOI] [PubMed] [Google Scholar]
Associated Data
This section collects any data citations, data availability statements, or supplementary materials included in this article.
Data Availability Statement
This study did not generate unique datasets/code.