

Abstract
Introduction
Diabetes is associated with a high economic burden in China; therefore, strategies to prevent diabetes, improve glycaemic control, delay disease-related complications and maintain quality of life are essential. This study was conducted to evaluate trends in treatment patterns and glycaemic control in people with type 2 diabetes (T2D) in real-world clinical practice in Tianjin, China.
Methods
This retrospective, cross-sectional, multicentre study analysed data from adults with T2D living in Tianjin, China between 2015 and 2019, based on information obtained from a regional electronic medical record database. Temporal trends in treatment patterns and glycaemic control were assessed using linear regression (continuous variables), and Cochran–Armitage (two categories) or Cochran–Mantel–Haenszel (≥ 3 categories) tests.
Results
Between 2015 and 2019, data from 312,203 individuals treated at 75 hospitals were included. Over this period, there was an upward trend in the prevalence of hypertension, hyperlipidaemia, obesity, cardiovascular disease, stroke and retinopathy each year (all P < 0.001). The use of metformin or dipeptidyl peptidase-4 inhibitors increased, while thiazolidinedione, alpha-glucosidase inhibitor and glinide use decreased; the use of basal insulin (BI), glucagon-like peptide-1 receptor agonists (GLP-1 RAs), GLP-1 RAs + BI, bolus insulin and BI + bolus insulin increased, whereas the use of premixed insulin showed a downward trend (all P < 0.001). From 2015 to 2019, an increased proportion of individuals achieved glycated haemoglobin (HbA1c) < 7% (< 53 mmol/mol; 28.1–33.7%), fasting plasma glucose (FPG) < 7 mmol/l (21.7–26.9%) and postprandial glucose (PPG) < 10 mmol/l (22.0–48.2%; all P < 0.001). There was no change in the proportion of individuals with an FPG ≥ 7 mmol/l and a PPG ≥ 10 mmol/l, while the prevalence of residual hyperglycaemia increased (P < 0.001).
Conclusions
Glycaemic control improved between 2015 and 2019 in people with T2D in Tianjin, China; however, there is an unmet need for more effective glycaemic control.
Supplementary Information
The online version contains supplementary material available at 10.1007/s13300-024-01661-z.
Keywords: China, Glycaemic control, Real-world clinical practice, Temporal trends, Treatment patterns, Type 2 diabetes
Key Summary Points
| Why carry out this study? |
| Information on glycaemic control and treatment patterns among people with type 2 diabetes (T2D) is needed to optimise disease management strategies. |
| However, there are limited data on glycaemic control rates and treatment patterns in China. |
| This cross-sectional study was conducted to better understand treatment patterns and glycaemic control status from 2015 to 2019 among adults with T2D in Tianjin, China. |
| What was learned from the study? |
| This analysis demonstrated some improvements in glycaemic control and treatment patterns over time, with upward trends in the proportion of individuals achieving an HbA1c < 7% (< 53 mmol/mol), while the overall glycaemic control rate remained low, with only one-third of participants achieving HbA1c target. |
| Therefore, simple and effective treatment options are still needed to facilitate higher rates of glycaemic control among people with T2D in China. |
Introduction
The country with the highest number of individuals with diabetes of any country worldwide is China, with 140.9 million adults having diabetes in 2021, and this prevalence is expected to increase to 174.4 million by 2045 [1]. As such, diabetes is associated with a high economic burden in China [2, 3], and strategies to prevent diabetes, improve glycaemic control, delay disease-related complications and maintain quality of life are essential [4, 5].
To optimise management strategies in individuals with diabetes, it is essential to know how many individuals do not achieve their glycated haemoglobin (HbA1c) targets, as well as the types of antidiabetic medication they are receiving. In China, previous surveys demonstrated that a substantial proportion of individuals with type 2 diabetes (T2D) do not achieve adequate glycaemic control, with only 20–50% achieving an HbA1c < 7% (< 53 mmol/mol) [6–9]. A nationwide epidemiological study of individuals with T2D demonstrated an improvement in the proportion who achieved glycaemic control between 2010 (39.7%) [10] and 2013 (49.2%) [11]; however, despite treatment advances, a subsequent analysis found no significant improvement in the rate of achieving glycaemic control between 2013 and 2018 [8]. Further, there is a paucity of data on glycaemic control rates in China from 2018 onwards. Concerning antidiabetic treatment patterns, the epidemiological study indicated that only 26–32% of Chinese individuals were receiving treatment between 2010 and 2018 [8, 10, 11]; however, treatment pattern data in China are also limited.
Therefore, we conducted this cross-sectional study to better understand the current treatment patterns and glycaemic control status between 2015 and 2019 among adults with T2D in Tianjin, China.
Methods
Study Design
This was a retrospective cross-sectional study of individuals with T2D, using information obtained via a regional electronic medical record database from Tianjin, China. Tianjin is a representative of northern metropolis in China with a population of 13.63 million that joined the global Cities Changing Diabetes program in 2014, collaborating with > 40 other cities to address T2D in cities worldwide [12].
Data were collected from adults (≥ 18 years old) with a diagnosis of T2D, based mainly on diagnostic terms for “T2D” in Chinese, supplemented by International Classification of Diseases (ICD)-9 (250.*0, 250.*2) or -10 codes (E11*), as listed in the Supplementary Material Table S1. People with T2D were included if they had at least one clinical visit pertaining to their T2D and at least one prescription for antidiabetic therapy between 1 January 2015 and 31 December 2019. Data were provided by the Tianjin Healthcare and Medical Big Data Platform, which includes electronic medical records and laboratory information systems from 75 hospitals (39 tertiary and 36 secondary hospitals). People with a diagnosis of type 1 diabetes (E10*) or gestational diabetes (O24.410, O24.414, O24.419, O24.420, O24.424, O24.343) or who were prescribed Chinese herbal medicine only were excluded.
The study was conducted in accordance with the ethical principles of the Declaration of Helsinki. The study protocol was approved by the ethics committee of the Chu Hsien-I Memorial Hospital (approval number: ZXYJNYYhMEC2022-1). As this was a retrospective study, informed consent was not required; the waiver of informed consent was approved by both Chu Hsien-I Memorial Hospital and the Human Genetic Resource Administration of China.
Outcomes
Data on demographics (age, sex, hospital type, insurance status, weight, height, body mass index [BMI]), comorbidities and complications (see Supplementary Material Table S1 for ICD-9 and ICD-10 codes), treatment patterns (the proportion of individuals who received each type of oral (dipeptidyl peptidase-4 [DPP-4] inhibitors, metformin, sulphonylureas [SUs], thiazolidinediones [TZDs], alpha-glucosidase inhibitors [AGIs], glinides) and injectable therapy (basal insulin [BI], premixed insulin, bolus insulin, glucagon-like peptide-1 receptor agonists [GLP-1 RAs])) and laboratory tests (HbA1c, fasting plasma glucose [FPG], postprandial glucose [PPG]) were collected and analysed by year in the overall population and in the outpatient and inpatient populations. Further detail on the collection of these data and their quality control are provided in the supplementary methods.
The primary endpoint of this analysis was the proportion of individuals achieving an HbA1c < 7% (< 53 mmol/mol) in each year. Secondary endpoints (assessed in each year) included: the proportion of individuals who achieved an FPG < 7 mmol/l or a PPG < 10 mmol/l; the proportion of individuals with an FPG ≥ 7 mmol/l and a PPG ≥ 10 mmol/l; the proportion of individuals with residual hyperglycaemia (defined as an FPG < 7 mmol/l and HbA1c ≥ 7% [≥ 53 mmol/mol]); and mean HbA1c, FPG and PPG levels.
Statistical Analysis
Descriptive statistics were used to present the data, with continuous variables summarised as means and standard deviations (SD) and categorical variables summarised as numbers and proportions of individuals. Outliers for continuous variables were defined as values outside the ranges of mean ± 5 SD for BMI, 2–18% for HbA1c and 1.1–33.3 mmol/l for FPG or PPG, and were excluded from the analyses. All statistical analyses were based on available data and the proportions were calculated using non-missing values.
Temporal trends from 2015 to 2019 were tested, with linear regression used to calculate P values for trends in continuous variables, and Cochran–Armitage (two categories) or Cochran–Mantel–Haenszel (≥ 3 categories) tests used were used to calculate for P values for trend in categorical variables.
All statistical analyses were undertaken using R software (version 4.2.0, Lucent Technologies, Murray Hill, NJ, USA) and two-sided P values < 0.05 were considered statistically significant.
Results
Demographics
Data from 312,203 people with T2D (251,843 outpatients and 211,835 inpatients) were collected; of these, 151,475 people had both outpatient and inpatient data (Supplementary Fig. S1). In the overall population, 42.6% of individuals were aged ≥ 65 years (mean ± SD age 61.9 ± 12.3 years), 53.9% were male, and 42.9% had a normal BMI according to the classification criteria recommended for Chinese people (BMI 24 to < 28 kg/m2) [13]. The mean ± SD BMI was 26.1 ± 3.5 kg/m2. The majority of individuals (95.7%) had insurance coverage and were enrolled in a tertiary hospital (82.3%).
Between 2015 and 2019, the age of individuals with T2D gradually increased (P < 0.001 for trend; Table 1). Significant differences over the years in sex, weight, height, BMI, BMI category (using Chinese classification criteria [13]), type of medical insurance and type of hospital were also observed (all P < 0.001 for trend; Table 1).
Table 1.
Baseline characteristics and demographics of people with type 2 diabetes in Tianjin, China by year
| Characteristic | 2015 (n = 123,525) |
2016 (n = 147,583) |
2017 (n = 176,551) |
2018 (n = 198,148) |
2019 (n = 213,287) |
P value for trenda |
|---|---|---|---|---|---|---|
| Age, year | 60.5 ± 11.3 | 60.9 ± 11.5 | 61.3 ± 11.5 | 61.4 ± 11.7 | 61.6 ± 11.9 | < 0.001 |
| Age, n (%) | < 0.001 | |||||
| 18–34 years | 2947 (2.4) | 3581 (2.4) | 4053 (2.3) | 4731 (2.4) | 5245 (2.5) | |
| 35–44 years | 6923 (5.6) | 8331 (5.6) | 9944 (5.6) | 11,766 (5.9) | 13,571 (6.4) | |
| 45–54 years | 23,733 (19.2) | 27,303 (18.5) | 30,260 (17.1) | 30,328 (15.3) | 30,363 (14.2) | |
| 55–64 years | 47,189 (38.2) | 54,584 (37.0) | 64,137 (36.3) | 72,103 (36.4) | 74,898 (35.1) | |
| ≥ 65 years | 42,733 (34.6) | 53,784 (36.4) | 68,157 (38.6) | 79,220 (40.0) | 89,210 (41.8) | |
| Male, n (%) | 64,718 (52.4) | 77,995 (52.9) | 93,738 (53.1) | 106,141 (53.6) | 114,456 (53.7) | < 0.001 |
| Biometric parameters | n = 40,475 | n = 55,179 | n = 81,392 | n = 94,597 | n = 100,514 | |
| Body weight, kg | 70.3 ± 11.1 | 70.5 ± 11.2 | 70.8 ± 11.4 | 70.8 ± 11.5 | 70.9 ± 11.5 | |
| Height, cm | 164.6 ± 8.1 | 164.7 ± 8.2 | 165.1 ± 8.2 | 165.0 ± 8.3 | 164.8 ± 8.4 | |
| BMI, kg/m2 | 25.9 ± 3.5 | 26.0 ± 3.5 | 25.9 ± 3.5 | 26.0 ± 3.5 | 26.1 ± 3.5 | |
| BMI, n (%)b | < 0.001 | |||||
| < 24 kg/m2 | 13,062 (32.3) | 17,709 (32.1) | 26,245 (32.3) | 30,110 (31.8) | 31,038 (30.9) | |
| 24 to < 28 kg/m2 | 17,346 (42.9) | 23,732 (43.0) | 34,930 (42.9) | 40,581 (42.9) | 43,111 (42.9) | |
| ≥ 28 kg/m2 | 10,067 (24.9) | 13,738 (24.9) | 20,217 (24.8) | 23,906 (25.3) | 26,365 (26.2) | |
| Missing data, n (%) | 83,050 (67.2) | 92,404 (62.6) | 95,159 (53.9) | 103,551 (52.3) | 112,773 (52.9) | |
| Medical insurance, n (%) | n = 109,951 | n = 129,996 | n = 153,475 | n = 167,841 | n = 175,919 | < 0.001 |
| Yes | 107,699 (98.0) | 127,323 (97.9) | 149,694 (97.5) | 163,166 (97.2) | 170,532 (96.9) | |
| No | 2252 (2.1) | 2673 (2.1) | 3781 (2.5) | 4675 (2.8) | 5387 (3.1) | |
| Missing data | 13,574 (11.0) | 17,587 (11.9) | 23,076 (13.1) | 30,307 (15.3) | 37,368 (17.5) | |
| Hospital type, n (%) | n = 110,171 | n = 130,346 | n = 153,590 | n = 167,909 | n = 175,970 | < 0.001 |
| Tertiary | 91,821 (83.3) | 109,732 (84.2) | 127,117 (82.8) | 137,010 (81.6) | 140,467 (79.8) | |
| Secondary | 18,350 (16.7) | 20,614 (15.8) | 26,473 (17.2) | 30,899 (18.4) | 35,503 (20.2) | |
| Missing data | 13,354 (10.8) | 17,237 (11.7) | 22,961 (13.0) | 30,239 (15.3) | 37,317 (17.5) |
Data are presented as mean ± standard deviation, unless stated otherwise
BMI body mass index
aFor continuous variables, a linear trend test was used to calculate P for trend; for categorical variables, Cochran–Mantel–Haenszel (≥ 3 categories) or Cochran–Armitage trend test (binary) were used to calculate P for trend
bBMI classification criteria recommended for Chinese people [13]
Significant trends between 2015 and 2019 were also observed when the characteristics of individuals with T2D were assessed by outpatient/inpatient status (Supplementary Table S2). There were no apparent differences in characteristics of outpatients and inpatients, with the exception of a numerically higher proportion of inpatients versus outpatients receiving treatment in a tertiary hospital (87.5–90.0% vs 77.8–82.7% of individuals) and lower proportion of inpatients versus outpatients paying for their treatment through medical insurance (93.8–95.4% vs 97.2–99.4% of individuals) rather than out-of-pocket.
Comorbidities and Complications
Between 2015 and 2019, approximately three-quarters of the population (70.1–76.7%) had at least one comorbidity or complication. The most prevalent comorbidities/complications were hypertension, neuropathy, cardiovascular disease and nephropathy (Fig. 1).
Fig. 1.
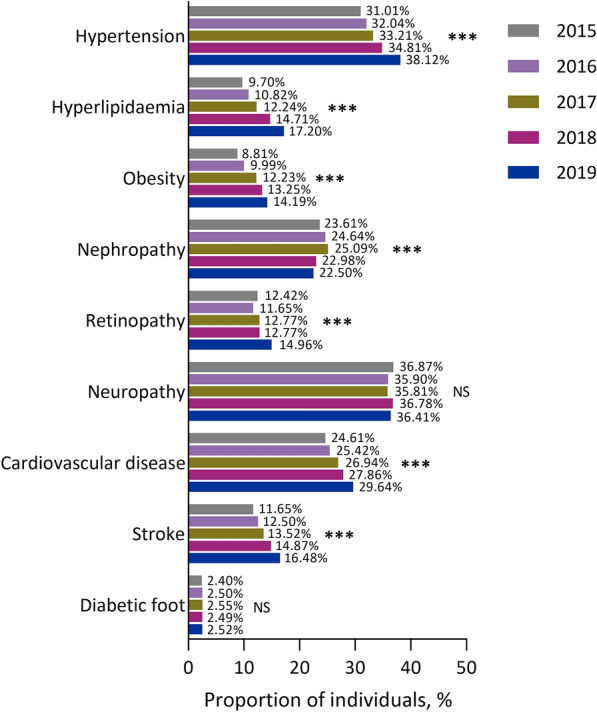
Prevalence of comorbidities and complications between 2015 and 2019 in people with type 2 diabetes in Tianjin, China. ***P < 0.001 for trend. NS not significant
There was an increased trend for the prevalence of most comorbidities/complications over time (all P < 0.001), with the exception of nephropathy (which decreased with a little fluctuation; P < 0.001) and neuropathy and diabetic foot (which showed no change; Fig. 1). Upward trends between 2015 and 2019 were observed for hypertension, hyperlipidaemia, obesity, cardiovascular disease, stroke and retinopathy (all P < 0.001).
The trends in the prevalence of most comorbidities/complications over time in the overall population were also observed in outpatients (Supplementary Fig. S2A) and inpatients (Supplementary Fig. S2B). In general, the prevalence of cardiovascular risk factors (hypertension, hyperlipidaemia, obesity) and macrovascular diseases (cardiovascular disease, stroke) were numerically higher in inpatients than outpatients, while diabetic microvascular complications (nephropathy, neuropathy, diabetic foot) had a generally higher prevalence in outpatients. Furthermore, the prevalence of cardiovascular disease showed reverse trends over time between outpatients and inpatients (i.e. a downward trend in inpatients vs an upward trend in outpatients; all P < 0.001).
Treatment Patterns
Between 2015 and 2019, 41.9–43.8% of individuals with T2D received treatment with OAD(s) only, with 12.2–14.0% receiving ≥ 3 OADs (Supplementary Table S3). Among individuals receiving OADs, the most common were AGIs, metformin, SUs and glinides. From 2015 to 2019, there was an increased trend in the proportion of individuals receiving metformin or DPP-4 inhibitors (both P < 0.001; Fig. 2A). In contrast, a decreased trend in the use of TZDs, AGIs and glinides was observed (all P < 0.001). The proportion of patients treated with SUs remained stable.
Fig. 2.

Use of A oral antidiabetic drugs and B injectable therapies between 2015 and 2019 in people with type 2 diabetes in Tianjin, China. ***P < 0.001 for trend. AGIs alpha-glucosidase inhibitors; BI basal insulin, DDP-4 dipeptidyl peptidase-4, GLP-1 RA glucagon-like peptide-1 receptor agonist, OAD oral antidiabetic drug, NS not significant, SUs sulfonylureas, TZDs thiazolidinediones
Similar trends in the use of OADs over time were also observed in outpatients (Supplementary Fig. S3A), whereas inpatients had a decrease in SU use between 2015 and 2019 (from 17.9% to 16.6%; P < 0.001 for trend; Supplementary Fig. S3B).
Between 2015 and 2019, 55.5–58.1% of individuals received treatment with insulin (with or without an OAD; Supplementary Table S3). Among individuals receiving injectable therapy with or without OADs, the most common were premixed insulin ± OAD, BI ± OAD, bolus insulin ± OAD, and BI + bolus insulin ± OAD (Fig. 2B). Over time, there was an upward trend in the proportion of individuals who received BI ± OAD, GLP-1 RA ± OAD, GLP-1 RA + BI ± OAD, bolus insulin ± OAD and BI + bolus insulin ± OAD, whereas a downward trend was observed in the use of premixed insulin ± OAD (all P < 0.001).
When the use of injectable therapies was assessed in outpatients (Supplementary Fig. S3C) and inpatients (Supplementary Fig. S3D), a numerically higher proportion of outpatients received BI or premixed insulin than bolus insulin or BI + bolus insulin (all with or without OADs), whereas the reverse was observed in inpatients. A trend for increased use of BI ± OADs and decreased premixed insulin ± OAD prescriptions between 2015 and 2019 was observed in both outpatients and inpatients (both P < 0.001). In outpatients, there was a trend for increased use of bolus insulin ± OAD and BI + bolus insulin ± OAD between 2015 and 2019 (both P < 0.001), whereas the use of these treatments in inpatients showed a decreased trend (P < 0.001 and P = 0.001, respectively).
Glycaemic Control
Between 2015 and 2019, the proportion of individuals with an HbA1c < 7% (< 53 mmol/mol) showed an increased trend from 28.1% to 33.7%, respectively (P < 0.001; Fig. 3A). This corresponded to a decreased trend in mean HbA1c levels from 8.2% (66 mmol/mol) in 2015 to 7.9% (63 mmol/mol) in 2019 (P < 0.001; Fig. 3B). Similarly, upward trends from 2015 to 2019 were observed for the proportion of individuals with an FPG < 7 mmol/l and a PPG < 10 mmol/l, with corresponding decreased trends in mean FPG and PPG levels (all P < 0.001; Fig. 3C). There was no change in the proportion of individuals with an FPG ≥ 7 mmol/l and a PPG ≥ 10 mmol/l, while the prevalence of residual hyperglycaemia showed an increased trend between 2015 and 2019 (P < 0.001).
Fig. 3.

Glycaemic control between 2015 and 2019 in people with type 2 diabetes in Tianjin, China, according to A the proportion of individuals achieving glycaemic targets, B mean glycated haemoglobin levels and C mean fasting plasma glucose and postprandial glucose levels. ***P < 0.001 for trend. FPG fasting plasma glucose, HbA1c glycated haemoglobin, NS not significant, PPG postprandial glucose
In both outpatients and inpatients, the proportion of individuals with an HbA1c < 7% (< 53 mmol/mol) and a PPG < 10 mmol/l all showed an increased trend between 2015 and 2019 (all P < 0.001; Supplementary Fig. S4A and S4B). These increases corresponded to decreased trends in mean HbA1c (Supplementary Fig. S4C and S4D) and PPG (Supplementary Fig. S4E and S4F) levels over this period. Furthermore, there was also an increased trend in the proportion of outpatients with an FPG < 7 mmol/l (P < 0.001), an FPG ≥ 7 mmol/l and a PPG ≥ 10 mmol/l (P = 0.007) or residual hyperglycaemia (P < 0.001), whereas there were no changes in the proportion of inpatients with an FPG < 7 mmol/l or with an FPG ≥ 7 mmol/l and a PPG ≥ 10mmol/l. Furthermore, in contrast to the overall population, the proportion of inpatients with residual hyperglycaemia showed a decreased trend over time (P < 0.001).
The proportion of individuals who achieved an HbA1c < 7% (< 53 mmol/mol) was similar in outpatients and inpatients, whereas the proportion of individuals who achieved an FPG < 7 mmol/mol was numerically higher in inpatients than in outpatients and the proportion of individuals who achieved a PPG < 10 mmol/mol was numerically higher in outpatients than in inpatients. Furthermore, the proportion of outpatients who did not achieve FPG or PPG goals (those with both FPG ≥ 7 mmol/l and a PPG ≥ 10 mmol/l) increased over time and by 2019 was numerically higher than the proportion of inpatients who did not achieve these goals. Although the prevalence of residual hyperglycaemia decreased over time among inpatients, it remained numerically higher among inpatients versus outpatients (Supplementary Fig. S4A and S4B).
Glycaemic Control by Treatment Regimen
The increased trends in the proportion of individuals achieving an HbA1c < 7% (< 53 mmol/mol), FPG < 7 mmol/l or PPG < 10 mmol/l observed in the overall population were largely consistent across all treatment regimens (all P < 0.001; Fig. 4), with the exceptions being GLP-1 RA ± OAD or BI + GLP-1 RA ± OAD, potentially due to limited numbers of patients.
Fig. 4.
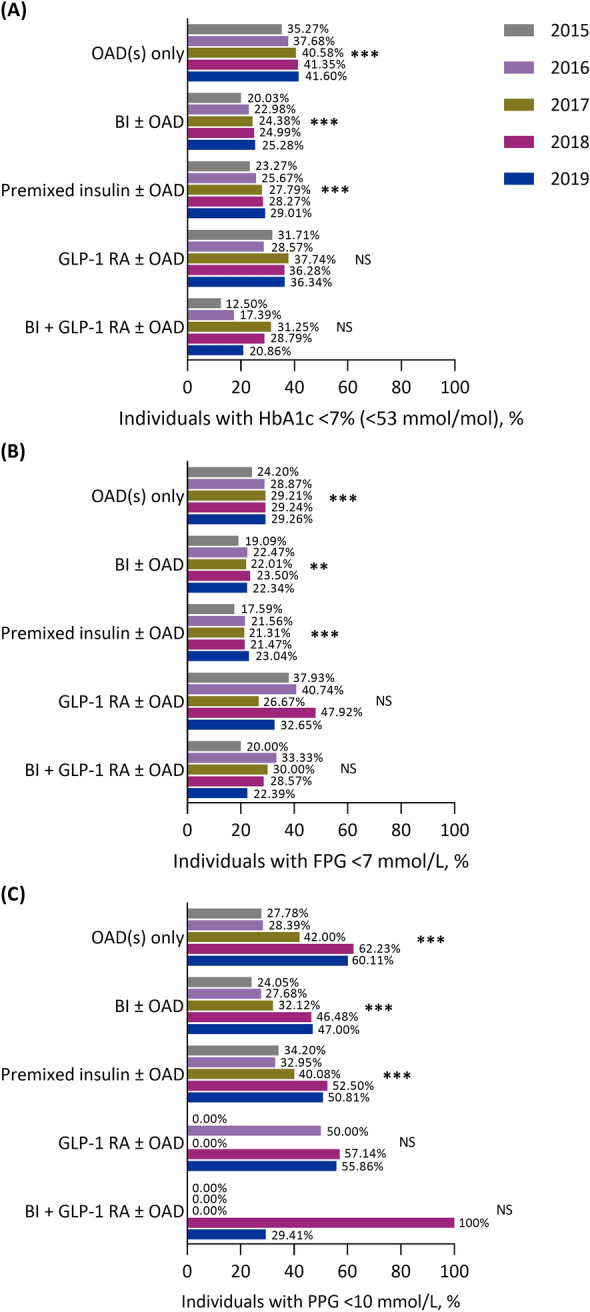
The proportion of individuals with A glycated haemoglobin < 7% (< 53 mmol/mol), B fasting plasma glucose < 7 mmol/l and C postprandial glucose < 10 mmol/l between 2015 and 2019 in people with type 2 diabetes in Tianjin, China, stratified by treatment regimen. **P < 0.01 for trend, ***P < 0.001 for trend. BI basal insulin, FPG fasting plasma glucose, GLP-1 RA glucagon-like peptide-1 receptor agonist, HbA1c glycated haemoglobin, NS not significant, OAD oral antidiabetic drug
An upward trend in the proportion of individuals achieving an HbA1c < 7% (< 53 mmol/mol) was observed in both outpatients and inpatients treated with OAD(s) only (both P < 0.001) or BI ± OAD (P < 0.001 and P < 0.01, respectively), as well as in outpatients who received premixed insulin ± OAD or GLP-1 RA ± OAD (P < 0.001 and P < 0.05, respectively; Supplementary Fig. S5A and S5B). For this outcome, no trend was observed for outpatients treated with BI + GLP-1 RA ± OAD (Supplementary Fig. S5A) or for inpatients treated with premixed insulin ± OAD, GLP-1 RA ± OAD or BI + GLP-1 RA ± OAD (Supplementary Fig. S5B).
An upward trend in the proportion of individuals who achieved an FPG < 7 mmol/l was observed in outpatients receiving OAD(s) only (P < 0.001), BI ± OAD (P < 0.05) and premixed insulin ± OAD (P < 0.05; Supplementary Fig. S5C). This trend was not observed in inpatients (Supplementary Fig. S5D). Furthermore, there were upward trends in the proportion of individuals who achieved a PPG < 10 mmol/l among outpatients receiving OAD(s) only (P < 0.001), BI ± OAD (P < 0.01) and premixed insulin ± OAD (P < 0.001; Supplementary Fig. S5E), but in inpatients, this trend was only observed in those receiving OAD(s) only (P < 0.01; Supplementary Fig. S5F).
Discussion
This real-world, cross-sectional study of individuals with T2D in Tianjin, a metropolis in northern China, examined the epidemiological characteristics, current treatment patterns and glycaemic control status between 2015 and 2019.
This study demonstrated an increasing burden of disease among individuals with T2D, with an upward trend in the prevalence of cardiovascular disease and associated risk factors (hypertension, hyperlipidaemia, obesity) over time, with inpatients having a higher prevalence than outpatients. In contrast, the prevalence of complications (nephropathy, neuropathy, diabetic foot) were generally higher in the outpatients than inpatients, except for diabetic retinopathy. T2D is known to be associated with cardiovascular risk factors, including hypertension, elevated low-density lipoprotein cholesterol levels and obesity, and cardiovascular disease is the most common cause of death among individuals with T2D [14]. A previous retrospective study of people with diabetes in Beijing reported that the most common comorbidities (in ≥ 20% of individuals) were hypertension, coronary heart disease and dyslipidaemia [15]. Similarly, a retrospective study of Japanese people with T2D found that dyslipidaemia, hypertension and cardiovascular disease were among the most common comorbidities/complications [16]. Therefore, comprehensive management is needed in people with T2D to lower blood pressure, lipid levels and body weight through lifestyle modifications and medications in order to reduce the risk of cardiovascular morbidity and mortality [17]. Further, antidiabetic medications that effectively reduce body weight and provide cardiovascular protection (e.g. GLP-1 RAs or sodium-glucose transporter-2 inhibitors) may be beneficial, particularly in individuals with diabetes-related cardiovascular disease [17–19].
With regard to treatment patterns in the current study, the most commonly prescribed OADs and injectable therapies were AGIs and premixed insulin, respectively. Regarding differences between outpatients and inpatients, premixed insulin was still the most commonly prescribed injectable therapy among outpatients, while bolus insulin ± OAD(s) and BI + bolus ± OAD(s) were the most commonly prescribed injectable treatment regimens among inpatients. This indicates that inpatients had more complex treatment scenarios than outpatients, with poorer glycaemic control and requiring treatment intensification with BI + bolus insulin during their admission. The use of bolus insulin ± OAD and BI + bolus insulin ± OAD regimens showed an upward trend over time from 2015 (9.6% and 6.0%, respectively) to 2019 (10.1% and 8.7%, respectively). These observations reflect high degree of attention to PPG and are consistent with high carbohydrate consumption among Chinese people (especially in northern cities like Tianjin) [20], which leads to high PPG levels [21]. Of note, a post hoc analysis of pooled data from randomised controlled phase 3 trials of a BI + bolus insulin combination reported that PPG levels in response to carbohydrate consumption were often higher in individuals with T2D from East Asia (i.e. mainland China, Japan, Korea, Hong Kong and Taiwan), South or South-East Asia (i.e. India, Malaysia and Thailand) or the Middle-East (i.e. Lebanon) versus non-Asian regions, such as Australia, Eastern Europe (i.e. Algeria, Bulgaria, Croatia, Czech Republic, Poland, Romania, Russian Federation, Serbia, Slovakia, Turkey and Ukraine), North America (Mexico and the USA), Scandinavia (Denmark, Finland, Norway and Sweden), South Africa and Western or South-Western Europe (i.e. Austria, France and Spain) [22].
In the current study, there was a decreasing trend in the use of premixed insulin and an upwards trend in the use of BI-based regimens over time. These findings are consistent with those of the retrospective Beijing study, which showed decreased use of premixed insulin between 2016 and 2018 (from 60.5% to 52.0%) and increased use of long-acting BI analogues (from 20.8% to 30.0%) [15]. The reason for the decreased use of premixed insulin over time may be due in part to the higher risk of hypoglycaemia associated with the basal component of premixed insulin (i.e. neutral protamine Hagedorn insulin) versus long-acting BI analogues [23]. In addition to hyperglycaemia, hypoglycaemic events may further increase the risk of macrovascular and microvascular diabetic complications [24], and are associated with decreased treatment satisfaction and poor adherence [25]. Moreover, the premixed insulin regimen is more complex than BI-based regimens, requiring two to three injections per day compared with once-daily BIs, and a premix of two insulin components may not be appropriate for all individuals with T2D. The decreasing trend in SU use among inpatients observed in this study (from 17.9% to 16.6%) may also indicate a growing concern for the risk of hypoglycaemia with these agents [26].
Glycaemic control showed improvement between 2015 and 2019 in the current study, with an upward trend in the proportion of individuals achieving an HbA1c < 7% (< 53 mmol/mol), FPG < 7 mmol/l and PPG < 10 mmol/l. These improvements may be the result of increased use of novel agents, including DPP-4 inhibitors and GLP-1 RAs, updated guidelines or increased adherence to guideline-directed management of T2D in this population [27]. Indeed, this analysis showed consistently increased trends in the use of DPP-4 inhibitors and GLP-1 RAs (± OAD or + BI ± OAD), although the proportion of individuals using GLP-1 RAs remained low (< 1%). Despite these improvements, less than half the population had glycaemic control in 2019, with 33.7% of individuals achieving an HbA1c < 7% (< 53 mmol/mol), 26.9% achieving an FPG < 7 mmol/l and 48.2% achieving a PPG < 10 mmol/l. These findings are consistent with those of a previous cross-sectional study in Chinese adults with T2D, which reported glycaemic control rates of 44.3% for HbA1c < 7% (< 53 mmol/mol), 30.7% for FPG < 7 mmol/l and 23.0% for both HbA1c < 7% (< 53 mmol/mol) and FPG < 7 mmol/l [9]. In the Joint Asia Diabetes Evaluation (JADE) Register, a cross-sectional analysis of people with T2D conducted across 11 countries and regions in East Asia (i.e. mainland China, Hong Kong, Korea and Taiwan), South-East Asia (i.e. Indonesia, Malaysia, Philippines, Singapore, Thailand and Vietnam) and South Asia (i.e. India) between 2007 and 2017, only 16.5% of all individuals achieved an HbA1c < 7% (< 53 mmol/mol) [28].
A similar proportion of outpatients versus inpatients achieved an HbA1c < 7% (< 53 mmol/mol); however, more inpatients versus outpatients achieved an FPG < 7 mmol/l and more outpatients versus inpatients achieved a PPG < 10 mmol/l. Of note, the proportion of outpatients who failed to achieve both FPG and PPG targets or had residual hyperglycaemia showed an increasing trend between 2015 and 2019. Although the proportion of inpatients with residual hyperglycaemia decreased over time, it remained numerically higher than in outpatients.
These observations highlight an unmet need for simple and effective treatments to achieve glycaemic control while minimising the risk of hypoglycaemia. For example, antidiabetic fixed-dose combinations of metformin plus a DPP4 inhibitor, SGLT-2 inhibitor or sulphonylurea provide effective glycaemic control and have been associated with improved patient adherence and decreased treatment costs [29]; therefore, these agents may play an important role in the management of T2D. Of note, the fixed-dose combinations glipizide/metformin, sitagliptin/metformin and dapagliflozin/metformin are currently available in China. In addition, short-acting GLP-1 RAs, such as once-daily lixisenatide and twice-daily exenatide, provide greater slowing of gastric emptying than long-acting GLP-1 RAs, such as once-daily liraglutide and once-weekly exenatide, thereby driving greater reductions in PPG levels [30]. Once-daily lixisenatide has been shown to significantly delay gastric emptying and provide greater reductions in PPG levels compared with once-daily liraglutide when added to optimized BI therapy in German individuals with T2D [31]. Fixed-ratio combinations of a BI with a GLP-1 RA are also associated with improved glycaemic control. For example, insulin glargine/lixisenatide (iGlarLixi) has been shown to improve HbA1c levels in studies of individuals with T2D from East or South-East Asia (i.e. mainland China, Hong Kong, Korea, Malaysia and Taiwan) [32] and of Chinese individuals with T2D who were previously treated with BI [33], with 79.0% and 63.3% achieving an HbA1c < 7% (< 53 mmol/mol) after 24 or 30 weeks of treatment, respectively, and improved 2-h PPG levels compared with insulin glargine or lixisenatide alone. Further, iGlarLixi reduced the incidence of residual hyperglycaemia among Japanese individuals with T2D inadequately controlled on OADs or BI after 26 weeks of treatment [34, 35]. Similarly, insulin degludec/liraglutide (IDegLira) for 26 weeks was associated with achievement of an HbA1c < 7% (< 53 mmol/mol) in 77.0% and 51.0% of Chinese individuals with T2D inadequately controlled OADs or BI, respectively [36, 37], as well as significantly greater reductions in PPG levels after breakfast and lunch compared with insulin degludec alone in those previously treated with OADs [36]. Therefore, metformin-based fixed-dose combinations and BI + GLP-1 RA fixed-ratio combinations represent simple and effective therapeutic strategies in Chinese individuals with T2D that may help address the unmet needs for glycaemic control in this population.
The main strengths of this study were its large sample size, the inclusion of continuous clinical records for the same individuals using a regional electronic medical record database, and our separate analysis of inpatient and outpatient data. The study was limited, however, by selection bias caused by missing data in glycaemic and biometric measurements, which may have influenced the results as analyses were only conducted in those with available laboratory data. In addition, glycaemic control rates may have been underestimated as a result of individuals with poor glycaemic control being admitted to hospital and having more frequent tests. The data collected in this study were limited to individuals living in the Tianjin area between 2015 and 2019, so while the results of this study are likely representative of clinical practice and patient experience in northern China at this time, they may not be generalisable to the broader population of Chinese individuals with T2D. Lastly, there were limited data on GLP-1 RA treatment patterns between 2015 and 2019 because these medications were only reimbursed in China from late 2020 onwards.
In conclusion, this cross-sectional analysis demonstrated improved glycaemic control between 2015 and 2019 among people with T2D in Tianjin, China, reflecting improved treatment patterns over time. Nevertheless, there is still an unmet need for more simple and effective treatments, such as metformin-based fixed-dose combinations and BI + GLP-1 RA fixed-ratio combinations, to facilitate higher rates of glycaemic control among individuals with T2D in China.
Supplementary Information
Below is the link to the electronic supplementary material.
Acknowledgements
The authors would like to thank Liu Yong from Tianjin Healthcare and Medical Big Data Co., Ltd, the data provider, who conducted a feasibility assessment and data consultation, Ranran Wang from Tianjin Healthcare and Medical Big Data Co., Ltd, who performed statistical analysis, Ming Li from Synyi Medical Technology Co., Ltd who reviewed the results, and Qiang Chen from Sanofi and Chen Chen from Synyi Medical Technology Co., Ltd who helped with the study operation and HGRAC application.
Medical Writing, Editorial, and Other Assistance
Simone Tait, CMPP, of inScience Communications, Springer Healthcare, wrote the outline and subsequent drafts of the manuscript, and Sarah Greig, PhD, CMPP, of inScience Communications, Springer Healthcare provided editorial assistance with post-submission revisions. This medical writing assistance was funded by Sanofi China.
Author Contributions
Liming Chen, Qiumei Zhang, Yaqing Fan and Xixi Liu are physicians from Chu Hsien-I Memorial Hospital where most of the individuals in the database used for this study were from, these authors provided opinions on evidence gaps and the design of the study. Minlu Zhang was responsible for the study design and statistical methods. Jiewen Zhang, Qin Du and Lei Kang interpreted clinical significance of the results. All authors contributed to the writing of the report.
Funding
This study and the journal’s Rapid Service Fee were funded by Sanofi China.
Data Availability
Data for this cross-sectional analysis were sourced from the Tianjin Healthcare and Medical Big Data Platform, which is not available online. On-site access is available, upon reasonable request to Tianjin Healthcare and Medical Big Data Co., Ltd.
Declarations
Conflict of Interest
Liming Chen, Qiumei Zhang, Yaqing Fan and Xixi Liu declared no conflict of interest. Minlu Zhang, Jiewen Zhang, Qin Du and Lei Kang are employees of Sanofi China.
Ethical Approval
The study was conducted in accordance with the ethical principles of the Declaration of Helsinki. The study protocol was approved by the ethics committee of the Chu Hsien-I Memorial Hospital (approval number: ZXYJNYYhMEC2022-1). As this was a retrospective study, informed consent was not required; the waiver of informed consent was approved by both Chu Hsien-I Memorial Hospital and the Human Genetic Resource Administration of China.
Footnotes
Prior presentation: This manuscript is based on work that was previously presented by Liming Chen at the American Diabetes Association 83rd Scientific Sessions in San Diego, CA, USA (23–26 June 2023) as a poster titled ‘Treatment pattern and glycemic control of adults with T2DM in Northern China.’
References
- 1.International Diabetes Federation. IDF Diabetes Atlas, 10th edn. 2021. https://diabetesatlas.org/idfawp/resource-files/2021/07/IDF_Atlas_10th_Edition_2021.pdf. Accessed 3 May 2023.
- 2.Liu J, Liu M, Chai Z, et al. Projected rapid growth in diabetes disease burden and economic burden in China: a spatio-temporal study from 2020 to 2030. Lancet Reg Health West Pac. 2023;33: 100700. [DOI] [PMC free article] [PubMed] [Google Scholar]
- 3.Hird TR, Zomer E, Owen A, et al. The impact of diabetes on productivity in China. Diabetologia. 2019;62(7):1195–203. [DOI] [PubMed] [Google Scholar]
- 4.Davies MJ, D’Alessio DA, Fradkin J, et al. Management of hyperglycaemia in type 2 diabetes, 2018. A consensus report by the American Diabetes Association (ADA) and the European Association for the Study of Diabetes (EASD). Diabetologia. 2018;61(12):2461–98. [DOI] [PubMed] [Google Scholar]
- 5.Luo Z, Fabre G, Rodwin VG. Meeting the challenge of diabetes in China. Int J Health Policy Manag. 2020;9(2):47–52. [DOI] [PMC free article] [PubMed] [Google Scholar]
- 6.Ji LN, Lu JM, Guo XH, et al. Glycemic control among patients in China with type 2 diabetes mellitus receiving oral drugs or injectables. BMC Public Health. 2013;13:602. [DOI] [PMC free article] [PubMed] [Google Scholar]
- 7.Dong Q, Huang J, Liu S, et al. A survey on glycemic control rate of type 2 diabetes mellitus with different therapies and patients’ satisfaction in China. Patient Prefer Adherence. 2019;13:1303–10. [DOI] [PMC free article] [PubMed] [Google Scholar]
- 8.Wang L, Peng W, Zhao Z, et al. Prevalence and treatment of diabetes in China, 2013–2018. JAMA. 2021;326(24):2498–506. [DOI] [PMC free article] [PubMed] [Google Scholar]
- 9.Yan L, Liu Y, Li J, Zhou H, Ma H. Glycemic control rate of type 2 diabetes mellitus in Chinese adults: a multi-centered, retrospective, cross-sectional study. Int J Diabetes Dev Countries. 2021;41(2):273–9. [Google Scholar]
- 10.Xu Y, Wang L, He J, et al. Prevalence and control of diabetes in Chinese adults. JAMA. 2013;310(9):948–59. [DOI] [PubMed] [Google Scholar]
- 11.Wang L, Gao P, Zhang M, et al. Prevalence and ethnic pattern of diabetes and prediabetes in China in 2013. JAMA. 2017;317(24):2515–23. [DOI] [PMC free article] [PubMed] [Google Scholar]
- 12.Napier AD, Nolan JJ, Bagger M, Hesseldal L, Volkmann AM. Study protocol for the cities changing diabetes programme: a global mixed-methods approach. BMJ Open. 2017;7(11): e015240. [DOI] [PMC free article] [PubMed] [Google Scholar]
- 13.Zhou BF. Cooperative Meta-Analysis Group of the Working Group on Obesity in China. Predictive values of body mass index and waist circumference for risk factors of certain related diseases in Chinese adults—study on optimal cut-off points of body mass index and waist circumference in Chinese adults. Biomed Environ Sci. 2002;15(1):83–96. [PubMed] [Google Scholar]
- 14.Lorber D. Importance of cardiovascular disease risk management in patients with type 2 diabetes mellitus. Diabetes Metab Syndr Obes. 2014;7:169–83. [DOI] [PMC free article] [PubMed] [Google Scholar]
- 15.Guo L, Zheng J, Pan Q, et al. Changes in direct medical cost and medications for managing diabetes in Beijing, China, 2016 to 2018: electronic insurance data analysis. Ann Fam Med. 2021;19(4):332–41. [DOI] [PMC free article] [PubMed] [Google Scholar]
- 16.Ohsugi M, Eiki JI, Iglay K, Tetsuka J, Tokita S, Ueki K. Comorbidities and complications in Japanese patients with type 2 diabetes mellitus: retrospective analyses of J-DREAMS, an advanced electronic medical records database. Diabetes Res Clin Pract. 2021;178: 108845. [DOI] [PubMed] [Google Scholar]
- 17.Garber AJ, Handelsman Y, Grunberger G, et al. Consensus statement by the American Association of Clinical Endocrinologists and American College of Endocrinology on the comprehensive type 2 diabetes management algorithm—2020 executive summary. Endocr Pract. 2020;26(1):107–39. [DOI] [PubMed] [Google Scholar]
- 18.Pan Q, Yuan M, Guo L. Exposure-response analysis of cardiovascular outcome trials with incretin-based therapies. Front Endocrinol (Lausanne). 2022;13: 893971. [DOI] [PMC free article] [PubMed] [Google Scholar]
- 19.McGuire DK, Shih WJ, Cosentino F, et al. Association of SGLT2 inhibitors with cardiovascular and kidney outcomes in patients with type 2 diabetes: a meta-analysis. JAMA Cardiol. 2021;6(2):148–58. [DOI] [PMC free article] [PubMed] [Google Scholar]
- 20.Song F, Cho MS. Geography of food consumption patterns between South and North China. Foods. 2017;6(5):34. [DOI] [PMC free article] [PubMed] [Google Scholar]
- 21.Kang X, Wang C, Lifang L, et al. Effects of different proportion of carbohydrate in breakfast on postprandial glucose excursion in normal glucose tolerance and impaired glucose regulation subjects. Diabetes Technol Ther. 2013;15(7):569–74. [DOI] [PMC free article] [PubMed] [Google Scholar]
- 22.Yang W, Akhtar S, Franek E, et al. Postprandial glucose excursions in Asian versus non-Asian patients with type 2 diabetes: a post hoc analysis of baseline data from phase 3 randomised controlled trials of IDegAsp. Diabetes Ther. 2022;13(2):311–23. [DOI] [PMC free article] [PubMed] [Google Scholar]
- 23.Monami M, Marchionni N, Mannucci E. Long-acting insulin analogues versus NPH human insulin in type 2 diabetes: a meta-analysis. Diabetes Res Clin Pract. 2008;81(2):184–9. [DOI] [PubMed] [Google Scholar]
- 24.Younk LM, Davis SN. Hypoglycemia and vascular disease. Clin Chem. 2011;57(2):258–60. [DOI] [PMC free article] [PubMed] [Google Scholar]
- 25.Walz L, Pettersson B, Rosenqvist U, Deleskog A, Journath G, Wandell P. Impact of symptomatic hypoglycemia on medication adherence, patient satisfaction with treatment, and glycemic control in patients with type 2 diabetes. Patient Prefer Adher. 2014;8:593–601. [DOI] [PMC free article] [PubMed] [Google Scholar]
- 26.van Dalem J, Brouwers MC, Stehouwer CD, et al. Risk of hypoglycaemia in users of sulphonylureas compared with metformin in relation to renal function and sulphonylurea metabolite group: population-based cohort study. BMJ. 2016;354: i3625. [DOI] [PMC free article] [PubMed] [Google Scholar]
- 27.Weng J, Ji L, Jia W, et al. Standards of care for type 2 diabetes in China. Diabetes Metab Res Rev. 2016;32(5):442–58. [DOI] [PMC free article] [PubMed] [Google Scholar]
- 28.Kong APS, Lew T, Lau ESH, et al. Real-world data reveal unmet clinical needs in insulin treatment in Asian people with type 2 diabetes: the Joint Asia Diabetes Evaluation (JADE) Register. Diabetes Obes Metab. 2020;22(4):669–79. [DOI] [PMC free article] [PubMed] [Google Scholar]
- 29.Li J, Lian H. Recent development of single preparations and fixed-dose combination tablets for the treatment of non-insulin-dependent diabetes mellitus: a comprehensive summary for antidiabetic drugs. Arch Pharm Res. 2016;39(6):731–46. [DOI] [PubMed] [Google Scholar]
- 30.Lu JM. The role of glucagon-like peptide-1 receptor agonists in type 2 diabetes in Asia. Adv Ther. 2019;36(4):798–805. [DOI] [PubMed] [Google Scholar]
- 31.Meier JJ, Rosenstock J, Hincelin-Mery A, et al. Contrasting effects of lixisenatide and liraglutide on postprandial glycemic control, gastric emptying, and safety parameters in patients with type 2 diabetes on optimized insulin glargine with or without metformin: a randomized, open-label trial. Diabetes Care. 2015;38(7):1263–73. [DOI] [PubMed] [Google Scholar]
- 32.Yang W, Dong X, Li Q, et al. Efficacy and safety benefits of iGlarLixi versus insulin glargine 100 U/mL or lixisenatide in Asian Pacific people with suboptimally controlled type 2 diabetes on oral agents: the LixiLan-O-AP randomized controlled trial. Diabetes Obes Metab. 2022;24(8):1522–33. [DOI] [PubMed] [Google Scholar]
- 33.Yuan X, Guo X, Zhang J, et al. Improved glycaemic control and weight benefit with iGlarLixi versus insulin glargine 100 U/mL in Chinese people with type 2 diabetes advancing their therapy from basal insulin plus oral antihyperglycaemic drugs: results from the LixiLan-L-CN randomized controlled trial. Diabetes Obes Metab. 2022;24(11):2182–91. [DOI] [PMC free article] [PubMed] [Google Scholar]
- 34.Yabe D, Iizuka K, Baxter M, Watanabe D, Kaneto H. iGlarLixi reduces residual hyperglycemia in Japanese patients with type 2 diabetes uncontrolled on basal insulin: a post-hoc analysis of the LixiLan JP-L trial. J Diabetes Investig. 2021;12(11):1992–2001. [DOI] [PMC free article] [PubMed] [Google Scholar]
- 35.Iizuka K, Baxter M, Watanabe D, Yabe D. Benefit of insulin glargine/lixisenatide for reducing residual hyperglycaemia in Japan: post hoc analysis of the LixiLan JP-O2 trial. Diabetes Obes Metab. 2021;23(12):2795–803. [DOI] [PMC free article] [PubMed] [Google Scholar]
- 36.Wang W, Agner BFR, Luo B, et al. DUAL I China: improved glycemic control with IDegLira versus its individual components in a randomized trial with Chinese participants with type 2 diabetes uncontrolled on oral antidiabetic drugs. J Diabetes. 2022;14(6):401–13. [DOI] [PMC free article] [PubMed] [Google Scholar]
- 37.Pei Y, Agner BR, Luo B, et al. DUAL II China: superior HbA1c reductions and weight loss with insulin degludec/liraglutide (IDegLira) versus insulin degludec in a randomized trial of Chinese people with type 2 diabetes inadequately controlled on basal insulin. Diabetes Obes Metab. 2021;23(12):2687–96. [DOI] [PMC free article] [PubMed] [Google Scholar]
Associated Data
This section collects any data citations, data availability statements, or supplementary materials included in this article.
Supplementary Materials
Data Availability Statement
Data for this cross-sectional analysis were sourced from the Tianjin Healthcare and Medical Big Data Platform, which is not available online. On-site access is available, upon reasonable request to Tianjin Healthcare and Medical Big Data Co., Ltd.