Abstract
Background
The lymph node ratio (LNR) has been recognized as an emerging prognostic biomarker in various malignant tumors. Our study aimed to investigate the prognostic role of LNR in postoperative patients with lymph node-positive bladder cancer.
Methods
This study comprised a total of 3911 eligible patients diagnosed with lymph node-positive bladder cancer. This included 3767 patients from the Surveillance, Epidemiology, and End Results (SEER) database and 144 patients from two Chinese hospitals forming the external validation cohort. We used X-tile software to identify the optimal cut-off value for LNR. The Kaplan-Meier method and Cox regression model were utilized to evaluate the association between LNR and overall survival (OS) and cancer-specific survival (CSS). Based on the LNR index, two nomograms were constructed to estimate the prognosis of patients with lymph node-positive bladder cancer. The discriminant ability and accuracy of the nomogram were tested using the receiver operating characteristic (ROC) curve, calibration curves and decision curve analysis.
Results
The Kaplan-Meier survival curves, stratified by LNR, demonstrated significant differences in overall and cancer-specific survival rates (P < 0.05). After adjusting for clinical and tumor factors, including AJCC N staging, patients with an LNR greater than 0.3 exhibited significantly worse OS and CSS compared to those with an LNR less than 0.1 in both the SEER and external validation cohorts. Furthermore, the nomogram, which incorporated LNR, showed satisfactory discriminative ability, and the calibration curves confirmed favorable consistency.
Conclusion
LNR proves to be an independent prognostic factor for postoperative patients with lymph node-positive bladder cancer. These findings highlight LNR’s potential as a prognostic indicator, which could be beneficial in patient consultations and guiding treatment decisions.
Supplementary Information
The online version contains supplementary material available at 10.1186/s12885-024-13384-2.
Keywords: Lymph node-positive bladder cancer, Lymph node ratio, Prognosis, Nomogram
Introduction
Bladder cancer (BCa) is one of the most prevalent malignant tumors of the urinary system worldwide, with approximately 610,000 new cases and 220,000 deaths annually [1]. Lymph node metastasis (LNM) in BCa patients is a crucial indicator of tumor invasiveness. Studies have demonstrated that 25-30% of BCa patients undergoing radical cystectomy (RC) and pelvic lymph node dissection (PLND) present with lymph node (LN) metastasis [2]. Furthermore, up to 80% of BCa patients with pathological LN metastasis experience recurrence after RC surgery, in stark contrast to a 30% recurrence rate in LN-negative (pN0) patients [3]. Additionally, the 5-year recurrence-free survival (RFS) and overall survival (OS) rates for LN-positive (pN1-3) patients range from 21 to 42% and 25–38%, respectively, which are markedly lower than the 56–78% and 49–69% observed in LN-negative (pN0) patients [4]. Consequently, an accurate evaluation of lymph node status is essential for prognostic assessment and treatment planning. The eighth edition of the American Joint Committee on Cancer (AJCC) TNM staging system categorizes lymph node-positive patients into N1, N2, and N3 stages, which are widely used for prognosis assessment [5].
However, these staging criteria fail to consider the number or proportion of positive lymph nodes in predicting the prognosis of bladder cancer patients. In contrast to the traditional TNM system, several studies indicate that the number or proportion of positive lymph nodes could serve as a more powerful predictor of outcomes in lymph node-positive BCa patients [6, 7]. In recent years, the lymph node ratio (LNR), defined as the ratio of the number of positive lymph nodes to the total number of lymph nodes examined, has been increasingly recognized as a significant prognostic factor [8–10]. Despite this recognition, the correlation between LNR and the survival rate of lymph node-positive bladder cancer patients after lymph node dissection has not been thoroughly investigated.
This study aims to explore the prognostic significance of the lymph node ratio (LNR) in bladder cancer patients with positive lymph nodes following lymph node dissection, utilizing extensive population data from the Surveillance, Epidemiology, and End Results (SEER) database. Subsequently, we constructed a nomogram based on LNR to predict overall survival and cancer-specific survival, and conducted external validation using data from our center.
Materials and methods
Patients and study design
This study is a retrospective cohort analysis comprising two datasets. The SEER cohort, spanning from 2004 to 2021, were sourced from the Surveillance, Epidemiology, and End Results (SEER) database (http://seer.cancer.gov/seerstat/). The external validation set data were continuously collected from two Chinese hospitals between 2011 and 2021: the First Affiliated Hospital and the Second Affiliated Hospital of Nanchang University. To be included in the study, patients were required to meet the following criteria: (1) Histologically confirmed BCa; (2) Surgical treatments that included radical cystectomy and pelvic lymph node dissection; (3) Pathologically confirmed positive LN. Exclusion criteria included: (1) M1 stage; (2) Absence of follow-up records; (3) Missing information on examined lymph nodes (ELNs) and positive lymph nodes; (4) Incomplete data on tumor grading, TNM staging, LN status, or tumor size. The screening process is depicted in Supplementary Fig. 1. Ultimately, 3911 eligible patients were included in this study.
Patients in the external validation set were recruited based on the same inclusion and exclusion criteria as the SEER cohort. The last follow-up was conducted in December 2023. This study received approval from the institutional review committees of the involved Chinese hospitals.
Variables
The clinical and pathological features collected from medical records included demographic characteristics (age, gender, race, marital status), tumor characteristics (tumor size, grade, histological type, T stage, N stage), treatment information (chemotherapy and radiation status), and the number of examined lymph nodes (ELNs) and positive lymph nodes. The lymph node ratio (LNR) was defined as the ratio of positive lymph nodes to the total number of lymph nodes examined. The primary endpoints of this study were overall survival (OS) and cancer-specific survival (CSS).
Statistical analysis
Continuous variables were represented as mean ± standard deviation (SD) or interquartile range (IQR), while categorical variables were represented as count (percentage). Initially, X-tile software was utilized to determine the optimal cutoff point for LNR. Based on the identified threshold, patients were classified into low-LNR, mid-LNR, and high-LNR groups. Survival curves were generated using the Kaplan-Meier method and compared via the log-rank test. Subsequently, independent prognostic factors were identified through univariate and multivariate Cox regression analyses. Two nomograms were constructed based on LNR. The model’s performance was evaluated using ROC curves and calibration curves, with further validation conducted using internal and external datasets. A two-tailed P-value of less than 0.05 was considered statistically significant. All statistical analyses were performed using R version 3.6.2.
Results
Patient baseline characteristics
Data from 3767 patients diagnosed with lymph node-positive bladder cancer between 2004 and 2021 were extracted from the SEER database. An additional 144 patients were included from the external validation cohort. In the SEER cohort, 857 patients (22.75%) were under 60 years old, 1076 patients (28.56%) were female, 3300 patients (87.6%) were white, and 1882 patients (49.96%) were in stage T3. A total of 1958 patients (51.98%) had tumors larger than 4 cm in diameter. Over half of the patients (n = 2117, 56.2%) received chemotherapy, and 267 cases (7.09%) received radiotherapy. In the external validation cohort, 24 patients (16.67%) were under 60 years, 111 patients (77.08%) were male, and 64 patients (44.44%) were in stage T3. Among these, 52 (36.11%) received adjuvant chemotherapy, and 8 (5.5%) received radiotherapy post-surgery. The baseline characteristics of patients in both cohorts are shown in Table 1.
Table 1.
Baseline characteristics of the patients in the SEER and external validation cohorts
| Variables | SEER cohort | External validation cohort |
|---|---|---|
| N (%) | N (%) | |
| Age (years) | ||
| < 60 | 857 (22.75) | 24 (16.67) |
| 60–80 | 2439 (64.75) | 110 (76.39) |
| > 80 | 471 (12.5) | 10 (6.94) |
| Sex | ||
| Male | 2691 (71.44) | 111 (77.08) |
| Female | 1076 (28.56) | 33 (22.92) |
| Race | ||
| White | 3300 (87.6) | 0 (0) |
| Black | 250 (6.63) | 0 (0) |
| Other | 217 (5.76) | 144 (100) |
| Marital status | ||
| Married | 2333 (61.93) | 98 (68.06) |
| Never married | 509 (13.51) | 15 (10.42) |
| SDW | 925 (24.56) | 31 (21.53) |
| Grade | ||
| Low | 153 (4.06) | 10 (6.94) |
| High | 3614 (95.94) | 134 (93.06) |
| T stage | ||
| T1/Tis/Ta | 78 (2.07) | 14 (9.72) |
| T2 | 710 (18.85) | 22 (15.28) |
| T3 | 1882 (49.96) | 64 (44.44) |
| T4 | 1097 (29.12) | 44 (30.56) |
| N stage | ||
| N1 | 1781 (47.28) | 82 (56.94) |
| N2/3 | 1986 (52.72) | 62 (43.06) |
| Tumor size | ||
| < 2 cm | 341 (9.05) | 10 (6.94) |
| 2–4 cm | 1468 (38.75) | 86 (59.72) |
| > 4 cm | 1958 (51.98) | 48 (33.33) |
| Histology | ||
| Urothelial carcinoma | 3378 (89.67) | 136 (94.44) |
| Non-urothelial carcinoma | 389 (10.33) | 8 (5.56) |
| Chemotherapy | ||
| No | 1650 (43.80) | 92 (63.89) |
| Yes | 2117 (56.20) | 52 (36.11) |
| Radiotherapy | ||
| No | 3500 (92.91) | 136 (94.5) |
| Yes | 267 (7.09) | 8 (5.5) |
| LNR | ||
| < 0.1 | 1158 (30.74) | 64 (44.44) |
| 0.1–0.3 | 1425 (37.83) | 41 (28.47) |
| > 0.3 | 1184 (31.43) | 39 (27.08) |
LNR, the lymph node ratio; SDW, separated, divorced or widowed
Association of lymph node ratio with prognosis
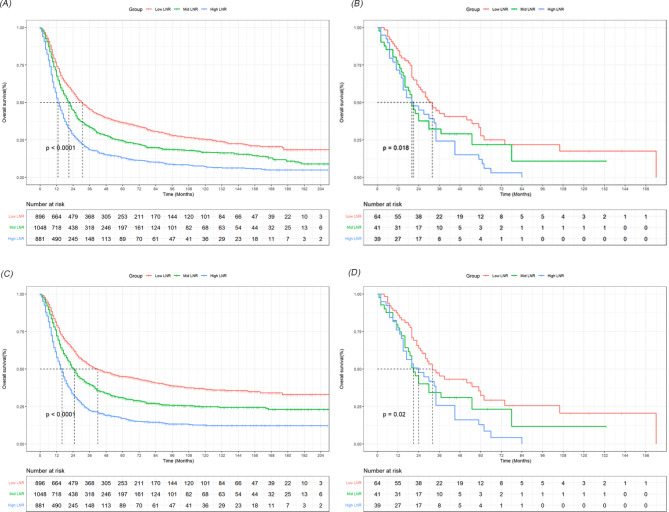
Considering the absence of widely recognized cutoff values for LNR, we used X-tile software to establish the optimal cutoff value. As detailed in Supplementary Fig. 2, we divided LNR into three groups: <0.1, 0.1–0.3, and > 0.3. The Kaplan-Meier survival curves, stratified by LNR, indicated significant differences in OS and CSS (P < 0.05) across both the SEER and external validation cohorts (Fig. 1). Moreover, multivariate analysis, controlling for factors including AJCC pathological stage N, confirmed a significant correlation between LNR and survival outcomes. In the SEER cohort, patients with an LNR between 0.1 and 0.3 (hazard ratio [HR], 1.29; 95% CI, 1.17–1.42) or greater than 0.3 (HR, 1.83; 95% CI, 1.66–2.02) had significantly poorer OS compared to those with an LNR under 0.1. Similarly, the CSS rates for patients with an LNR between 0.1 and 0.3 (HR, 1.38; 95% CI, 1.22–1.56) or greater than 0.3 (HR, 2.08; 95% CI, 1.83–2.36) were markedly lower than for those with an LNR under 0.1. In the external validation cohort, patients with an LNR over 0.3 also exhibited worse prognoses compared to those with an LNR under 0.1 (OS: HR, 1.84; 95% CI, 1.03–3.31; CSS: HR, 1.83; 95% CI, 1.04–3.22) (Tables 2 and 3).
Fig. 1.
The survival curves based on LNR were analyzed in the SEER cohort and the external validation cohort. A-B showed the different effects of three group LNR on the OS rate. C-D showed the different effects of three group LNR on the CSS rate
Table 2.
Association of lymph node ratio with overall survival using univariate and multivariate cox regression analysis
| OS | Univariate analysis | Multivariate analysis a | ||
|---|---|---|---|---|
| HR (95%CI) | P value | HR (95% CI) | P value | |
| LNR (SEER cohort) | ||||
| Low-LNR | Ref | Ref | ||
| Mid-LNR | 1.35 (1.23,1.48) | < 0.001 | 1.29 (1.17,1.42) | < 0.001 |
| High-LNR | 2.00 (1.82,2.19) | < 0.001 | 1.83 (1.66,2.02) | < 0.001 |
| LNR (External validation cohort) | ||||
| Low-LNR | Ref | Ref | ||
| Mid-LNR | 1.55 (0.95,2.51) | 0.079 | 1.50 (0.83,2.70) | 0.174 |
| High-LNR | 1.90 (1.19,3.03) | 0.006 | 1.84 (1.03,3.31) | 0.032 |
LNR, the lymph node ratio; HR, hazard ratio
a The multivariate Cox proportional hazards regression model was adjusted for age, gender, race, marital status, grade, tumor size, T stage, N stage, histology and chemotherapy
Table 3.
Association of lymph node ratio with cancer-specific survival using univariate and multivariate cox regression analysis
| CSS | Univariate analysis | Multivariate analysis a | ||
|---|---|---|---|---|
| HR (95%CI) | P value | HR (95% CI) | P value | |
| LNR (SEER cohort) | ||||
| Low-LNR | Ref | Ref | ||
| Mid-LNR | 1.43 (1.27,1.61) | < 0.001 | 1.38 (1.22,1.56) | < 0.001 |
| High-LNR | 2.24 (1.99,2.52) | < 0.001 | 2.08 (1.83,2.36) | < 0.001 |
| LNR (External validation cohort) | ||||
| Low-LNR | Ref | Ref | ||
| Mid-LNR | 1.50 (0.94,2.39) | 0.089 | 1.43 (0.81,2.51) | 0.213 |
| High-LNR | 1.87 (1.19,2.91) | 0.005 | 1.83 (1.04,3.22) | 0.035 |
LNR, the lymph node ratio; HR, hazard ratio
a The multivariate Cox proportional hazards regression model was adjusted for age, gender, race, marital status, grade, tumor size, T stage, N stage, histology and chemotherapy
Construction and validation of nomograms
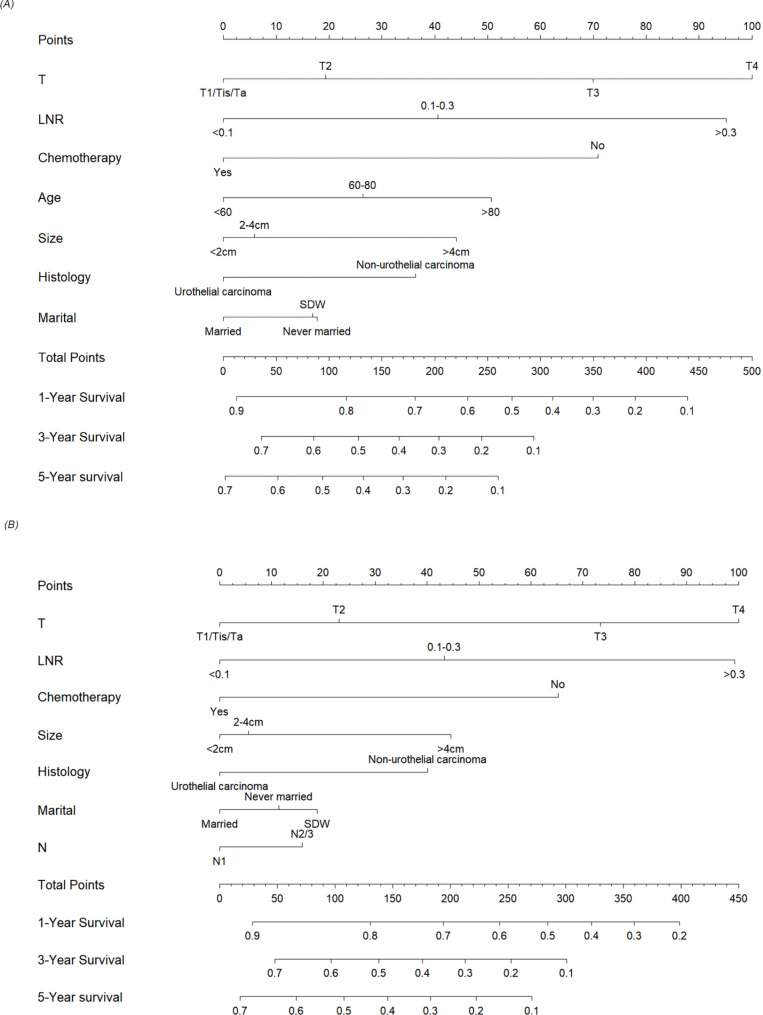
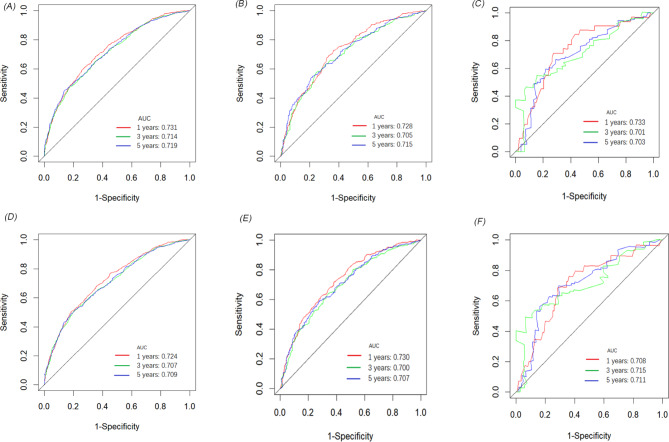
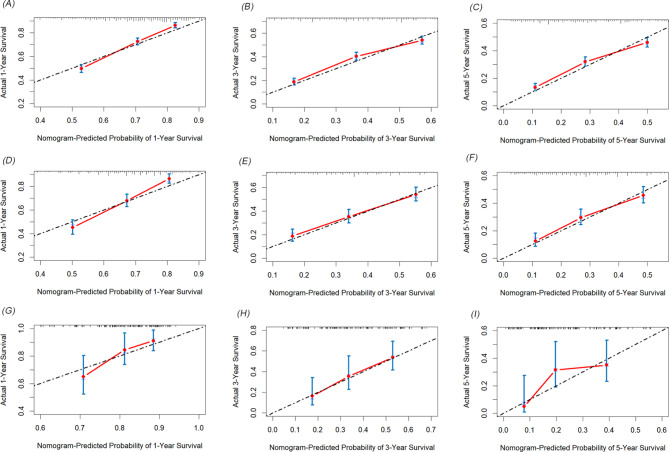
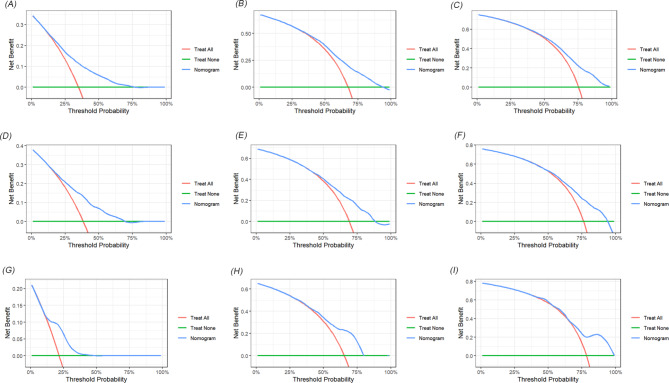
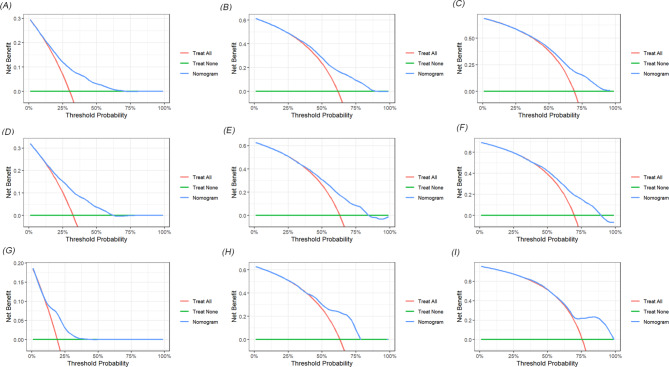
We developed two novel prognostic models for patients with positive lymph nodes in bladder cancer based on LNR. Initially, the patients in the SEER cohort were divided into a training set and an internal validation set in a 7:3 ratio. In the training set, univariate and multivariate Cox regression analyses identified key prognostic factors for constructing the models. As shown in Table 4, factors such as T stage, LNR, chemotherapy, age, tumor size, pathological type, and marital status were determined as independent prognostic factors for OS. Similarly, T stage, LNR, chemotherapy, tumor size, pathological type, N stage and marital status were identified as independent factors for CSS (Table 5). Two nomograms were then constructed based on these significant variables (Fig. 2). The predictive value of LNR for patient prognosis was second only to T stage. The AUC values of the nomogram for 1-year, 3-year, and 5-year OS were 0.731, 0.714, and 0.719 in the training set, 0.728, 0.705, and 0.715 in the internal validation set, and 0.733, 0.701, and 0.703 in the external validation set, respectively, demonstrating acceptable discriminative ability (Fig. 3). The 1-, 3-, and 5-year AUC values for the CSS nomogram were 0.724, 0.707, and 0.709, respectively, in the training set, 0.730, 0.700, and 0.707, respectively, in the internal validation set, and 0.708, 0.715, and 0.711, respectively, in the external validation set. Moreover, calibration curves across the training and validation sets showed good consistency between the predicted and observed OS and CSS probabilities (Figs. 4 and 5). Additionally, across the extensive probability thresholds for 1-year, 3-year, and 5-year CSS and OS prediction curves, a consistent estimation of net clinical benefit was performed for patients using decision curve analysis (DCA) (Figs. 6 and 7). These novel nomograms demonstrate significant clinical efficacy in predicting survival outcomes for patients with positive lymph nodes in bladder cancer.
Table 4.
The results of univariate and multivariate analysis of factors for OS in training cohort
| Variables | Univariate analysis | Multivariate analysis | ||
|---|---|---|---|---|
| HR (95% CI) | P value | HR (95% CI) | P value | |
| Age (years) | ||||
| < 60 | Ref | Ref | ||
| 60–80 | 1.23 (1.11,1.36) | < 0.001 | 1.21 (1.08,1.35) | < 0.001 |
| > 80 | 1.82 (1.58,2.10) | < 0.001 | 1.45 (1.24,1.70) | < 0.001 |
| Sex | ||||
| Female | Ref | |||
| Male | 0.92 (0.84,1.01) | 0.100 | ||
| Race | ||||
| White | Ref | |||
| Black | 1.08 (0.92,1.27) | 0.353 | ||
| Other | 0.84 (0.70,1.01) | 0.070 | ||
| Marital status | ||||
| Married | Ref | Ref | ||
| Never married | 1.15 (1.02,1.31) | 0.028 | 1.14 (1.01,1.30) | 0.040 |
| SDW | 1.22 (1.11,1.35) | < 0.001 | 1.13 (1.03,1.25) | 0.013 |
| Grade | ||||
| Low | Ref | |||
| High | 0.90 (0.73,1.11) | 0.308 | ||
| T stage | ||||
| T1/Tis/Ta | Ref | Ref | ||
| T2 | 1.13 (0.81,1.59) | 0.464 | 1.15 (0.82,1.62) | 0.416 |
| T3 | 1.81 (1.31,2.52) | < 0.001 | 1.65 (1.18,2.29) | 0.003 |
| T4 | 2.44 (1.75,3.49) | < 0.001 | 2.05 (1.46,2.86) | < 0.001 |
| N stage | ||||
| N1 | Ref | Ref | ||
| N2/3 | 1.28 (1.18,1.40) | < 0.001 | 1.09 (0.99,1.19) | 0.063 |
| Tumor size | ||||
| < 2 cm | Ref | Ref | ||
| 2–4 cm | 1.23 (1.05,1.44) | 0.011 | 1.04 (0.89,1.22) | 0.593 |
| > 4 cm | 1.69 (1.45,1.97) | < 0.001 | 1.37 (1.17,1.61) | < 0.001 |
| Histology | ||||
| Urothelial carcinoma | Ref | Ref | ||
| Non-urothelial carcinoma | 1.34 (1.17,1.54) | < 0.001 | 1.30 (1.13,1.49) | < 0.001 |
| Chemotherapy | ||||
| No | Ref | Ref | ||
| Yes | 0.57 (0.52,0.62) | < 0.001 | 0.60 (0.54,0.66) | < 0.001 |
| Radiotherapy | ||||
| No | Ref | |||
| Yes | 1.03 (0.88,1.21) | 0.720 | ||
| LNR | ||||
| < 0.1 | Ref | Ref | ||
| 0.1–0.3 | 1.35 (1.22,1.50) | < 0.001 | 1.31 (1.18,1.46) | < 0.001 |
| > 0.3 | 2.06 (1.85,2.29) | < 0.001 | 1.92 (1.72,2.15) | < 0.001 |
LNR, the lymph node ratio; SDW, separated, divorced or widowed; HR, hazard ratio
Table 5.
The results of univariate and multivariate analysis of factors for CSS in training cohort
| Variables | Univariate analysis | Multivariate analysis | ||
|---|---|---|---|---|
| HR (95% CI) | P value | HR (95% CI) | P value | |
| Age (years) | ||||
| < 60 | Ref | Ref | ||
| 60–80 | 1.12 (1.00,1.25) | 0.051 | 1.11 (0.99,1.25) | 0.070 |
| > 80 | 1.45 (1.23,1.71) | < 0.001 | 1.19 (0.99,1.42) | 0.056 |
| Sex | ||||
| Female | Ref | Ref | ||
| Male | 0.89 (0.80,0.99) | 0.028 | 0.95 (0.86,1.06) | 0.358 |
| Race | ||||
| White | Ref | |||
| Black | 1.08 (0.90,1.29) | 0.429 | ||
| Other | 0.91 (0.74,1.11) | 0.342 | ||
| Marital status | ||||
| Married | Ref | Ref | ||
| Never married | 1.16 (1.01,1.33) | 0.035 | 1.12 (0.97,1.30) | 0.108 |
| SDW | 1.20 (1.08,1.34) | < 0.001 | 1.13 (1.01,1.27) | 0.034 |
| Grade | ||||
| Low | Ref | |||
| High | 0.81 (0.65,1.01) | 0.067 | ||
| T stage | ||||
| T1/Tis/Ta | Ref | Ref | ||
| T2 | 1.14 (0.78,1.68) | 0.486 | 1.18 (0.80,1.73) | 0.395 |
| T3 | 1.84 (1.27,2.66) | < 0.001 | 1.70 (1.17,2.47) | 0.005 |
| T4 | 2.51 (1.73,3.64) | < 0.001 | 2.08 (1.43,3.04) | < 0.001 |
| N stage | ||||
| N1 | Ref | Ref | ||
| N2/3 | 1.37 (1.25,1.50) | < 0.001 | 1.13 (1.02,1.25) | 0.017 |
| Tumor size | ||||
| < 2 cm | Ref | Ref | ||
| 2–4 cm | 1.23 (1.03,1.47) | 0.021 | 1.04 (0.87,1.24) | 0.664 |
| > 4 cm | 1.74 (1.47,2.07) | < 0.001 | 1.39 (1.16,1.66) | < 0.001 |
| Histology | ||||
| Urothelial carcinoma | Ref | Ref | ||
| Non-urothelial carcinoma | 1.44 (1.24,1.66) | < 0.001 | 1.35 (1.17,1.57) | < 0.001 |
| Chemotherapy | ||||
| No | Ref | Ref | ||
| Yes | 0.62 (0.57,0.69) | < 0.001 | 0.63 (0.57,0.70) | < 0.001 |
| Radiotherapy | ||||
| No | Ref | |||
| Yes | 1.09 (0.91,1.30) | 0.336 | ||
| LNR | ||||
| < 0.1 | Ref | Ref | ||
| 0.1–0.3 | 1.43 (1.27,1.61) | < 0.001 | 1.38 (1.22,1.56) | < 0.001 |
| > 0.3 | 2.24 (1.99,2.52) | < 0.001 | 2.07 (1.82,2.15) | < 0.001 |
LNR, the lymph node ratio; SDW, separated, divorced or widowed; HR, hazard ratio
Fig. 2.
Nomograms for predicting the 1-, 3- and 5-year OS (A) and CSS (B) in lymph node-positive bladder cancer patients
Fig. 3.
The prognostic accuracy of the nomogram was evaluated using ROC curves and AUC values for OS and CSS. The AUC at 1-, 3-, and 5-year for OS in the training cohort (A), the internal validation cohort (B), and the external validation cohort (C). The AUC at 1-, 3-, and 5-year for CSS in the training cohort (D), the internal validation cohort (E), and the external validation cohort (F)
Fig. 4.
The calibration curves showed the predicted and observed 1-year, 3-year, and 5-year OS probabilities in the training (A-C), internal validation (D-F), and external validation (G-I) sets
Fig. 5.
The calibration curves showed the predicted and observed 1-year, 3-year, and 5-year CSS probabilities in the training (A-C), internal validation. (D-F), and external validation (G-I) sets
Fig. 6.
Decision curves for predicting 1-year, 3-year, and 5-year OS nomogram in training cohorts (A-C); 1-year, 3-year, and 5-year OS nomogram in internal validation cohorts (D-F) and 1-year, 3-year, and 5-year OS nomogram in external validation cohorts (G-I)
Fig. 7.
Decision curves for predicting 1-year, 3-year, and 5-year CSS nomogram in training cohorts (A-C); 1-year, 3-year, and 5-year CSS nomogram in internal validation cohorts (D-F) and 1-year, 3-year, and 5-year CSS nomogram in external validation cohorts (G-I)
Discussion
Lymph node-positive bladder cancer (BCa) represents a critical stage associated with high recurrence rates and mortality [11, 12]. The current AJCC pathological lymph node staging system classifies patients with positive lymph nodes into N1 (single lymph node metastasis in the true pelvis region), N2 (multiple lymph node metastases within the true pelvis), and N3 (total iliac lymph node metastasis) [5]. Notably, this staging system does not include the total number of positive and examined lymph nodes.
In our study, we identified a significant correlation between the lymph node ratio (LNR) and the survival rates of patients with lymph node-positive BCa. Remarkably, even after adjusting for the AJCC pathological N classification, LNR remained significantly associated with survival outcomes. This finding suggests that LNR could serve as a valuable metric for patient risk stratification, extending beyond the conventional TNM staging parameters. To provide clinicians with more effective prognostic tools, we developed a nomogram based on LNR. This tool has demonstrated high predictive accuracy for 1-year, 3-year, and 5-year survival rates in both the training and validation cohorts. These findings underscore the potential of LNR as a robust prognostic indicator, offering more precise risk assessments and aiding in the formulation of targeted treatment strategies for patients with lymph node-positive BCa.
The number of positive lymph nodes (NPLN) is a critical predictor of outcomes in lymph node-positive (LN+) patients [6]. As an independent and robust prognostic factor, NPLN significantly influences patient survival and disease progression. Research has highlighted substantial variations in the prognosis of LN + patients based on the presence of one or more positive lymph nodes [13–15]. Specifically, those with multiple positive lymph nodes generally face a poorer prognosis, characterized by higher recurrence rates and lower survival rates. Conversely, patients with a single positive lymph node often experience a more favorable prognosis and relatively slower disease progression. Further, a retrospective analysis of 244 LN + patients introduced a three-layer lymph node classification system, based on the number of positive lymph nodes (1, 2 to 5, and > 5), effectively stratifying patients with lymphatic diseases into distinct prognostic groups [16]. The degree of positive lymph node involvement is directly correlated with patient outcomes, underscoring the prognostic significance of lymph node count. Moreover, adequate lymph node dissection is pivotal for accurate classification of pathological lymph nodes and prognosis assessment. For instance, Sodagum et al. demonstrated that extensive lymph node dissection offers significant oncological benefits in contemporary large pTanyNx/0M0 bladder cancer patients across both non-muscle invasive and muscle invasive stages. A higher total number of examined lymph nodes is associated with improved cancer-specific survival [17]. Additionally, a retrospective study involving bladder urothelial cancer patients who underwent radical cystectomy and pelvic lymph node dissection across 12 centers, without neoadjuvant chemotherapy, showed that a higher LN yield was significantly linked to a reduced risk of disease recurrence in multivariable analysis adjusted for standard clinicopathological factors [18]. The lymph node ratio (LNR), which combines the number of positive lymph nodes with the total number examined, provides a more comprehensive prognostic indicator. Our findings suggest that a higher LNR is typically associated with a poorer prognosis, reflecting a greater burden of cancer and potential lymph node insufficiency. This indicator is instrumental in helping clinicians more effectively evaluate patient prognosis and tailor treatment strategies. For example, patients with a high LNR may benefit from more aggressive adjuvant therapies, such as chemotherapy or immunotherapy, to manage disease progression more effectively.
This study is subject to several limitations that warrant consideration. Firstly, due to technical differences among various institutions and surgeons during lymph node dissection, the strict prognostic thresholds for lymph node dissection may not be broadly applicable. This technical inconsistency could lead to significant variations in the evaluation of the lymph node ratio (LNR) across different clinical settings. Thus, although LNR holds potential value as a prognostic indicator, the impact of these technological differences on prognostic assessments must be carefully considered when applying it in diverse medical institutions and among different surgical teams. Secondly, as with any retrospective study, selection bias is inevitable and may impact the generalizability and reliability of the findings. This bias could skew the study outcomes, potentially limiting the applicability of the results across broader patient populations.
Finally, the study lacks comprehensive data on some critical factors, such as specific chemotherapy agents and immunotherapy, which play significant roles in the prognosis of lymph node-positive patients. The effectiveness and utilization of these therapeutic methods can considerably influence patient survival rates and disease progression.
Conclusion
This study demonstrates that the lymph node ratio (LNR) is significantly correlated with the prognosis of patients with lymph node-positive bladder cancer, offering valuable additional insights for predicting patient outcomes. However, to establish the prognostic validity of LNR more definitively, further prospective studies are required.
Electronic supplementary material
Below is the link to the electronic supplementary material.
Author contributions
ZT, CHC and CT wrote the main manuscript text and CXC, LYH, SZ, FB and PLF prepared Figs. 1, 2 and 3. All authors reviewed the manuscript.
Funding
This work was funded by the Jiangxi Provincial academic and technical leaders training program (20225BCJ22009) and Health Commission of Jiangxi Province (2018A382 and SKJP_220212063).
Data availability
The datasets utilized during this study are available from the corresponding author upon reasonable request.
Declarations
Ethics approval and consent to participate
This study was approved by the Ethics Committee of the First and Second Affiliated Hospital of Nanchang University. All methods were carried out in accordance with the Helsinki Declaration and approved guidelines. The Ethics Committee of the First and Second Affiliated Hospital of Nanchang University agreed to exempt patients from signing informed consent forms based on personal identity information not included. The data registered in this study was obtained from the publicly accessible SEER database, therefore there are no local or national ethical issues.
Consent for publication
Not applicable.
Competing interests
The authors declare no competing interests.
Footnotes
Publisher’s note
Springer Nature remains neutral with regard to jurisdictional claims in published maps and institutional affiliations.
Tao Chen, Xinchang Zou and Yihe Li contributed equally to this study.
Contributor Information
Bin Fu, Email: urodoc@ncu.edu.cn.
Tao Zeng, Email: taozeng40709@sina.com.
References
- 1.Bray F, Laversanne M, Sung H, Ferlay J, Siegel RL, Soerjomataram I, Jemal A. Global cancer statistics 2022: GLOBOCAN estimates of incidence and mortality worldwide for 36 cancers in 185 countries. Cancer J Clin. 2024;74(3):229–63. [DOI] [PubMed] [Google Scholar]
- 2.Zehnder P, Studer UE, Skinner EC, Dorin RP, Cai J, Roth B, Miranda G, Birkhäuser F, Stein J, Burkhard FC, et al. Super extended versus extended pelvic lymph node dissection in patients undergoing radical cystectomy for bladder cancer: a comparative study. J Urol. 2011;186(4):1261–8. [DOI] [PubMed] [Google Scholar]
- 3.Stamatakis L, Godoy G, Lerner SP. Innovations in radical cystectomy and pelvic lymph node dissection. Semin Oncol. 2012;39(5):573–82. [DOI] [PubMed] [Google Scholar]
- 4.Yafi FA, Aprikian AG, Chin JL, Fradet Y, Izawa J, Estey E, Fairey A, Rendon R, Cagiannos I, Lacombe L, et al. Contemporary outcomes of 2287 patients with bladder cancer who were treated with radical cystectomy: a Canadian multicentre experience. BJU Int. 2011;108(4):539–45. [DOI] [PubMed] [Google Scholar]
- 5.Cornejo KM, Rice-Stitt T, Wu CL. Updates in staging and reporting of Genitourinary malignancies. Arch Pathol Lab Med. 2020;144(3):305–19. [DOI] [PubMed] [Google Scholar]
- 6.Costello SVANB. Prognosis of node-positive bladder cancer in 2016. Minerva Urologica E Nefrologica = Italian J Urol Nephrol. 2016;68(2):125–37. [PubMed] [Google Scholar]
- 7.Pedrosa JA, Kaimakliotis HZ, Monn MF, Cary KC, Masterson TA, Rice KR, Foster RS, Bihrle R, Koch MO, Cheng L. Critical analysis of the 2010 TNM classification in patients with lymph node-positive bladder cancer: influence of lymph node disease burden. Urol Oncol. 2014;32(7):1003–9. [DOI] [PubMed] [Google Scholar]
- 8.Liang Y, Jian Q, Deng MG, Yi Z, Peng C, Lu C, Yang H, Liu J. Lymph node ratio precisely predicts the benefit of postoperative radiotherapy in esophageal cancer: a retrospective cohort study. Asian J Surg. 2023;46(9):3680–6. [DOI] [PubMed] [Google Scholar]
- 9.Luo D, Ye Z, Zhang R, Li Q, Li X. Use of lymph node ratio to guide clinical decision-making concerning adjuvant radiotherapy in pT1-2N1 rectal cancer. Int J Colorectal Dis. 2023;38(1):115. [DOI] [PubMed] [Google Scholar]
- 10.Ke Y, Zhang Z, Li Y, Qin Y, Yang Q, Zheng C. Prognostic value of lymph node ratio in patients with non-metastatic cervical cancer treated with radical hysterectomy: a population-based study. Eur J Surg Oncology: J Eur Soc Surg Oncol Br Association Surg Oncol. 2024;50(4):108258. [DOI] [PubMed] [Google Scholar]
- 11.Pedrosa JA, Koch MO, Cheng L. Lymph node-positive bladder cancer: surgical, pathologic, molecular and prognostic aspects. Expert Rev Anticancer Ther. 2013;13(11):1281–95. [DOI] [PubMed] [Google Scholar]
- 12.Shariat SF, Chade DC, Karakiewicz PI, Ashfaq R, Isbarn H, Fradet Y, Bastian PJ, Nielsen ME, Capitanio U, Jeldres C, et al. Combination of multiple molecular markers can improve prognostication in patients with locally advanced and lymph node positive bladder cancer. J Urol. 2010;183(1):68–75. [DOI] [PubMed] [Google Scholar]
- 13.Jensen JB, Ulhøi BP, Jensen KM. Evaluation of different lymph node (LN) variables as prognostic markers in patients undergoing radical cystectomy and extended LN dissection to the level of the inferior mesenteric artery. BJU Int. 2012;109(3):388–93. [DOI] [PubMed] [Google Scholar]
- 14.Rink M, Hansen J, Cha EK, Green DA, Babjuk M, Svatek RS, Xylinas E, Tagawa ST, Faison T, Novara G, et al. Outcomes and prognostic factors in patients with a single lymph node metastasis at time of radical cystectomy. BJU Int. 2013;111(1):74–84. [DOI] [PubMed] [Google Scholar]
- 15.Horn T, Schmid SC, Seitz AK, Grab J, Wolf P, Haller B, Retz M, Maurer T, Autenrieth M, Kübler HR, et al. Clinical prognosticators of survival in patients with urothelial carcinoma of the bladder and lymph node metastases after cystectomy with curative intent. World J Urol. 2015;33(6):813–9. [DOI] [PubMed] [Google Scholar]
- 16.Pedrosa JA, Koch MO, Kaimakliotis HZ, Monn MF, Masterson TA, Rice KR, Cary KC, Foster RS, Bihrle R, Cheng L. Three-tiered nodal classification system for bladder cancer: a new proposal. Future Oncol (London England). 2015;11(3):399–408. [DOI] [PubMed] [Google Scholar]
- 17.Sodagum L, Passarelli R, Pfail J, Patel HV, Chua K, Doppalapudi SK, Golombos D, Elsamra SE, Singer EA, Jang TL, et al. Pelvic lymphadenectomy: evaluating nodal stage migration and will rogers effect in bladder cancer. Urol Oncol. 2024;42(1):e2129–2120. [DOI] [PMC free article] [PubMed] [Google Scholar]
- 18.Rink M, Shariat SF, Xylinas E, Fitzgerald JP, Hansen J, Green DA, Kamat AM, Novara G, Daneshmand S, Fradet Y, et al. Does increasing the nodal yield improve outcomes in patients without nodal metastasis at radical cystectomy? World J Urol. 2012;30(6):807–14. [DOI] [PubMed] [Google Scholar]
Associated Data
This section collects any data citations, data availability statements, or supplementary materials included in this article.
Supplementary Materials
Data Availability Statement
The datasets utilized during this study are available from the corresponding author upon reasonable request.


