

Abstract
Mucus plays an integral role for the barrier function of many epithelial tissues. In the human airways, mucus is constantly secreted to capture inhaled microbes and pollutants and cleared away through concerted ciliary motion. Many important respiratory diseases exhibit altered mucus flowability and impaired clearance, contributing to respiratory distress and increased risk of infections. Understanding how mucus rheology changes during disease progression and in response to treatments is thus of great interest for subtyping patients and tailoring treatments, probing disease mechanisms, and tailoring therapies; however, basic research of mucus rheology is greatly hampered by the lack of scalable and user-friendly rheometry assays for the small volumes of mucus typically produced by in vitro respiratory models and in clinical ex vivo settings. To address this challenge, we developed a streamlined, high-throughput protocol leveraging Differential Dynamic Microscopy (DDM) to reliably measure the frequency-dependent microrheology of minuscule (3–10 μL) mucus samples using standard epifluorescence microscopy. Our method does not require time-consuming user-interventions common in particle tracking routines and measures microrheology at the time scale of mucus relaxation (1-20s), hence greatly reducing assay time. We demonstrate the successful application of our method in mucus samples harvested from state-of-the-art air-liquid-interface (ALI) human respiratory cultures to assess mucus rheology in airway disease models and different culture conditions. To show that our approach equally applies to other types and sources of human mucus, we also validated our method with clinical samples of cervical mucus. We envision that our method can be seamlessly adopted by non-expert users, without the need for specialized equipment or extensive training, to study diseases and their treatments in the respiratory, intestinal, reproductive and other mucosal organ systems. This advancement opens up new avenues for large-scale studies, providing new insights into the role of mucus rheology which was previously limited by data accessibility and resource constraints.
1. Need for accessible and scalable mucus rheometry
Healthy human respiratory mucus typically contains up to 5% mucins, 2% lipids, 1% salts, and 0.02% DNA and other molecules, with the remainder being water [1–4]. Despite its high (90-95%) water content, mucus exhibits complex frequency- and scale-dependent viscoelasticity that regulates epithelial barrier functions by controlling the movement and diffusion of particulate matter [3, 5–11]. In the human airway epithelium, a layer of mucus is produced by specialized glands as well as secretory cells interspersing the dense carpet of multi-ciliated cells [12–14]. Effective clearance of trapped pathogens and debris relies on the interplay between ciliary motion and mucus rheology, i.e., how mucus deforms under physical forces [15, 16]. For instance, reduced mucus viscosity disrupts ciliary coordination and impairs globally directed flow [17]. On the other hand, mucus with high viscoelasticity can also hinder ciliary motion, resulting in reduced mucociliary clearance and mucus plugging [18, 19]. Abnormal mucus rheology is strongly associated with chronic airway diseases [16, 20]; however, the underlying mechanisms and physiological implications remain widely unknown. Thus, it is essential to develop tools that can reveal mucus properties and their evolution over the course of disease onset, progression and treatment under physiologically relevant conditions.
Pioneering efforts starting in the late 1960s were able to measure the rheology of microliter sputum and mucus extractions using magnetically actuated microspheres with a radius on the order of 100 μm [5,8,21–24]). While these devices paved the way for detecting changes in mucus or sputum rheology in different diseases and in response to smoke exposure, the precision and frequency range of these tools are limited, and it is not clear how rheological properties measured through active actuation reflect the diffusive dynamics of micrometer to nanometer sized compounds. Therefore, the complex microstructure of mucus and its barrier properties are now typically probed by tracking the thermal motion of embedded particles (typically ~ 1 μ in diameter or smaller) [15,25–28]. Another advantage of studying the thermal motion of tracers is that one can automatically derive a broad-spectrum, frequency-dependent viscoelastic modulus without the need to carefully calibrate and control sensors to operate at multiple frequencies – this is crucial as viscoelastic moduli measured at any single frequency will not capture the complex spatial and temporal interactions that mucus experiences in vivo [3].
Recent advances have enabled the culture of human airway epithelial cells at an air-liquid interface (ALI) for physiologically relevant and patient-specific disease modeling [29–33]. Such models have helped reveal that abnormal numbers and phenotypes of mucus-secreting cells are key indicators of many chronic airway diseases, including asthma, chronic obstructive pulmonary disease (COPD) and bronchiectasis [12, 34]. Further, certain genetic and epigenetic variations, pre-existing conditions and environmental stressors may alter the phenotype or the abundance of mucus-secreting cells and raise the risk for developing chronic lung disease, such as COPD [35–37]. However, beyond correlations, missing thus far is a mechanistic understanding of how altered mucus secretion contributes to disease and whether rheological changes of mucus could provide markers for muco-obstructive disease staging and subtyping. Moreover, many drug treatments need to pass through, or aim to restore, the mucus barrier, requiring assays to characterize the physical properties of mucus including its rheology [38,39]. Similar knowledge gaps hamper our understanding of other mucosal tissues in digestive and reproductive organs, where the mechanical properties of mucus are essential for barrier, clearance, and lubrication functions [40, 41]. In all of these systems, studying the role of mucus in health and disease has been limited by the lack of high-throughput and automatable methods that can analyze large numbers and small volumes of mucus samples provided by ALI cultures, Organ-on-chips systems [42], rodents, and other common experimental models.
Tracking-free Differential Dynamic Microscopy (DDM) for automated analysis.
Multi-Particle Tracking (MPT) microrheology has been proposed for measuring microliter-scale mucus samples [43]; however, multiple manual steps make this technique less suitable for large numbers of samples. Imaging contrast needs to be carefully optimized at every step of acquisition and analysis to reconstruct accurate and precise particle trajectories. Further, depending on the composition of the sample, manual intervention is often needed to filter out spurious trajectories based on intensity, track length, and location. Taken together, the lack of automation in MPT presents significant hurdles for its adoption in large-scale biomedical studies and industrial settings, where frequently hundreds of samples are to be evaluated [44].
Differential Dynamic Microscopy (DDM) [45] offers a promising alternative. Like MPT, DDM can measure viscoelastic moduli across a wide range of frequencies using only a light microscope, a digital camera, and conventional illumination methods. In stark contrast to MPT, however, DDM analysis can be fully automated without any user input, making it far more suitable for high-throughput experiments that demand automation and standardization [44, 46–48]. DDM also offers enhanced statistical precision and allows for the study of particles smaller than the optical resolution limit since it does not rely on tracking specific features across image stacks. Combined with its ability to work with low-signal and optically dense materials [48–52], DDM is particularly suitable for large-scale studies of micro-liter in vitro mucus samples containing variable mucin concentrations and cellular debris.
Overcoming current limitations of DDM for mucus rheology.
Although DDM can theoretically measure the particle diffusion in mucus using only bright-field videos [53], the presence of cell debris and particulate matter with unknown size distributions – such as residuals from cigarette smoke exposure studies – can degrade the quality of the analysis. Without mono-dispersed, labeled tracers of known size, it is difficult to standardize the analysis across different experiments.
However, adding tracers to micro-scale mucus samples is non-trivial, similar to the case of MPT [43]. The most difficult challenge lies in mixing the highly concentrated fluorescent bead solution with the mucus without altering the original viscoelastic characteristics via dilution. Further, since the relaxation time of mucus can be minutes [3], standard practice in DDM implies that video footage over multiple minutes needs to be acquired per regions of interest for unbiased parameter estimation [49, 54, 55] (also see section 2.6). In most microscopy set-ups, these long acquisition windows are susceptible to motion artifacts from sample drift, vibrations, or bleaching of fluorescent labels. Further, long acquisition windows also mean that either multiple gigabytes of imaging data need to be handled per sample, or movies with different frame rates need to be acquired and analyzed separately.
In this study, we overcome these challenges by advancing and integrating state-of-the-art DDM methodologies together with optimized sample collection and preparation steps. In multiple proof-of-concept applications ranging from in vitro respiratory cultures to clinical cervical samples, we demonstrate the power of a protocol that uses fluorescence-based DDM for a high-throughput analysis of small (3–10 μL) mucus volumes. Our method can be employed by non-experts with access to standard epifluorescence microscopy. We highlight practical considerations and specific pain points for deployment and discuss how our method and its derivatives can benefit translational research.
2. Methods: DDM for High-throughput Mucus Microrheology
The general workflow of our protocol is outlined in Fig.1A. Prior to the measurements, two preparation steps are required for setting up the measurement chambers with evenly-distributed, evaporation-dried tracers, and calibrating the hydrodynamic radius of the tracers for mucus measurements. To start the measurement process, one mucus sample is loaded per chamber and gently mixed with the pre-loaded tracers. Then, epifluorescence videos are taken for 3-10 regions of interests (ROIs), depending on the perceived heterogeneity of particle motion in the sample. In most cases, 5 ROIs spanning the entire chamber are sufficient. If multiple distinct phases (e.g., pockets of liquid phases inside a gel) are present, each phase should be processed separately for maximum consistency. Following measurements of all samples, the computational video analysis is conducted in batch mode without human supervision. Not counting the preparation and analysis overhead, the video measurements of each sample take a few minutes to process, including sample loading and acquisition of multiple ROIs. If multiple samples are loaded at once, and we are only interested in measuring the viscoelasticity response of mucus near the ciliary beat frequency (time delay of ~ 0.1 seconds), it is possible to reduce the measurement time to 1 second per ROI, making sample collection and loading the only throughput-limiting step.
Figure 1: High-throughput mucus microrheology workflow.

A. Our streamlined workflow can measure the viscoelastic moduli of each 3-10 μL mucus sample at a total time cost of ca. 30 min, with only a few minutes requiring sustained human attention. In a trial run, 60 samples were prepared in 62 min, and 235 regions of interest were imaged in 123 min. B. Mucus from sterile in vitro culture were extracted from the apical side of transwell cultures and sealed in parafilm wrapped Eppendorf tube for analysis. PDMS spacers with small holes (3 mm or 6 mm diameter) were cut and put on glass slides to form capillary chambers. Dilute fluorescent bead solution was filled to each chamber and let dry in a dark box at room temperature until the liquid had fully evaporated. After verifying bead integrity with a one-time hydrodynamic radius calibration using a pure water sample, the mucus samples were transferred to one chamber each, gently mixed and sealed for epifluorescence microscopy inside a temperature controlled incubator. C. Differential dynamic microscopy (DDM) works by finding the azimuthally-averaged image structure function based on the Fourier transform of video frame differences at different time delay Δt. To increase throughput capacity, we restricted measurement time to <20 s and estimated the scattering amplitude A(q) using periodically shifted images instead of direct observation. Insets visualize particle motion due to diffusion versus such shifts. Bottom panel compares results of this shift-based estimation strategy (blue and black dashed line) with shortened video (light gray dashed line) of tracers in water to values obtained from original long video (dark gray dashed line) taken with 10x (0.3 NA) objectives. Transwell and centrifuge illustration created with BioRender https://BioRender.com/d80d467.
2.1. Mucus collection and transport
Standardizing mucus collection is a crucial step in the process because the viscoelastic properties of mucus are sensitive to dehydration, excessive shear, pH changes, and other perturbations. Moreover, in vitro epithelial surfaces may contain buffer or medium due to culture conditions, wash steps, or barrier dysfunction. Hence, care must be taken to collect intact mucus. In ALI cultures, we collected mucus using pipette tips with large openings (200 μL tips) to minimize shear. To ensure mucus was collected, we verified the existence of an elastic response of the samples during extraction. An elastic response becomes apparent by the stretching of a mucus blob (illustrated in Fig. 1B), which will not happen for a purely viscous liquid, such as saline buffer or culture medium. If other liquid was inevitably collected alongside mucus blobs, or if mucus was stuck to pipette tips, we used mild centrifugation at RCF 400 for 10 minutes to help separate and settle mucus from the supernatant liquid. Another way to facilitate mucus collection is to introduce small amounts ( ≈ 8 μL/cm2) of PBS three minutes before collection to dislodge mucus blobs from the cell surface. We verified that as long as the exposure is performed for all samples of interest equally, such short term contact with PBS does not significantly alter the relative difference in viscoelasticity between samples. To avoid degradation and dehydration, mucus is best stored and transported in appropriately-sized Eppendorf tubes at 4°C and sealed with Parafilm wrap to limit evaporation. We verified that the viscoelastic properties of the mucus samples do not change when kept in airtight storage sealed with Parafilm for 7 days. For detailed discussion of these results see Section 3.
2.2. Chamber preparation
To prevent sample dehydration and facilitate its storage and reuse, we created custom capillary chambers from commercially available sheets of polydimethylsiloxane (PDMS) foil with 0.25 mm nominal thickness (Super clear, MVQ Silicones GmbH). This thickness was chosen to be compatible with the maximum working distance of our microscope objective. Using scissors and biopsy punches or a desktop vinyl cutter (Roland DG), 18×18 mm squares were cut from the silicone foil, with a 3 or 6 mm diameter hole centered in the middle. These geometries yield a final measured holding volume of ca. 3 or 8 μL, respectively. For samples available in larger volume (≥ 30 μL), commercially available GeneFrame 25 μL (Thermo Fisher Scientific, AB0576) were used to mount the sample.
2.3. Tracer preparation and calibration
After mounting the spacer to a standard microscope slide (VWR, 631-1553), we filled the chamber with a dilute solution of fluorescent tracer beads and allowed them to desiccate at room temperature in a light-tight box for 30–45 minutes. We used 500 nm diameter yellow-green carboxylated polystyrene beads (Thermo Fisher Scientific, Fluorosphere F8813) at 1:2000 v/v dilution in Milli-Q water (membraPure water purifier). Once all chambers had dried, one chamber was immediately refilled with Milli-Q water (membraPure water purifier) and sealed with 1.5H glass cover slip for hydrodynamic radius measurement. Specifically, the viscosity of water ηo is measured and compared to known values to compute the hydrodynamic radius r of the desiccated beads based on Stokes-Einstein relation r = kBT/(6πηoD). Here, kB is the Boltzmann’s constant, T the measurement temperature, and D is the diffusion coefficient that is equal to the slope of mean-squared displacement divided by 4; also see (4) and (5). This value was then used in the measurements of the viscoelastic modulus of mucus samples. Our calibration experiments showed that the hydrodynamic radius of the fluorescent tracers before and after desiccation remained around 255–260 μm. Based on the understanding that polystyrene particles with carboxyl surface chemistry and radius larger than 250 nm do not diffuse through mucin networks [15, 25], our microrheology results should be able to faithfully capture the linear viscoelastic property of the mucus sample. If the goal is to study how ultrafine and fine particulate matter diffuse and interact with mucus, fluorescent tracers with smaller diameter can also be integrated into our presented methodology. However, in our experience the hydrodynamic radius might change after desiccation for smaller tracers and needs to be verified according to the calibration experiment mentioned above. We did not use larger tracers to minimize perturbations of the sample by the embedded tracers.
2.4. Sample preparation
The mucus sample was introduced into the chamber lined with dried tracers using a positive displacement pipette (Gilson Microman E); See Fig. 1B. To reduce bubble formation, the mucus was dispensed slowly and the pipette was set to hold 2 μL more than sample volume when filling the chamber, avoiding the introduction of air at the end of loading. If large bubbles did form, it was often possible to pop or remove the bubble by dragging it onto the PDMS spacer or poking it with the corner of a clean glass cover slip.
In order to ensure that a sufficient amount of dried tracer was present in the bulk of the sample, a small metal laboratory spatula was used to gently agitate the sample inside the chamber. In most cases, moving the spatula in both clockwise and counterclockwise directions for 10 to 30 seconds was sufficient to achieve adequate mixing.
Finally, a 1.5H glass cover slip was gently pushed onto the chamber starting from one edge to avoid bubbles and cracking. Once sealed, the prepared slides were stored at 4°C for later experiments, or placed for imaging into the temperature-controlled incubation chamber of the microscope preheated at 37°C. We ensured that the temperature control on the microscope reached equilibrium before imaging, since temperature fluctuations result in changes to Brownian motion and thus erroneous viscosity readout. Therefore, in all experiments, we waited at least 30 minutes after the incubator temperature sensor reported the desired temperature.
2.5. Fluorescence imaging
We recorded all videos using an inverted epifluorescence microscope (ZEISS Axio Observer) equipped with a high-speed camera (Hamamatsu Photonics Orca Flash 4.0) and a 20x objective (0.8 NA, 0.33 μm/px). Since DDM allows working with tracers smaller than the real-space optical resolution of the microscope, a 10x objective (0.3 NA, 0.65 μm/px) was also tested, achieving good results. However, in order to better compare tracking-based analysis with DDM, we opted for the 20x objective with higher resolution, allowing individual tracer to be clearly resolved in space.
We first checked the sample in the bright-field channel to verify that no beating ciliated cells were present, as these can be accidentally removed from the tissue culture together with mucus. We noted down the location of microscopic bubbles and large aggregate/debris to be avoided. We found that for high viscosity mucus samples, minuscule amounts of drift (< 0.1 μm/s) were sometimes present, potentially due to slow relaxation of mucus after slide movement, unevenly placed cover slip, and/or streaming around a distant bubble. While small amounts of unidirectional drift can be corrected during analysis, we re-sealed problematic samples to reduce drift, whenever possible. Finally, to minimize boundary effects, we measured Brownian motion in the central z-plane of the sample. This focal plane was computed by averaging the two most extreme z-values each representing beads located at the floor and ceiling of each chamber, using the maximum field of view available.
For video acquisition of our tracers, we used the FITC/GFP channel and recorded 5 second-long videos at 2 ms exposure time per frame at 100% LED power for low sample viscosity, and 20 second-long videos at 10 ms exposure time per frame at 30% LED power for high sample viscosity. The 20 second video option was used whenever tracers were observed to vibrate back and forth around an equilibrium position in real time. The exposure values were chosen to maximize signal-to-noise ratio and minimize the global decay of fluorescent signals over time. Streaming option was always selected during time series recording, so the final video frame rate was determined directly by the exposure time setting. Depending on the heterogeneity of the sample, we recorded 3 to 10 ROIs, each at 256×256 pixels without binning at 0.33 μm/px, while staying in the same z-plane and avoiding clusters of aggregated tracers. In our experience, a few aggregated beads did not cause significant problems, assuming most of the motion comes from isolated tracers. The nature of DDM analysis also means that insufficient contrast due to static background is not a concern, unlike in MPT.
After imaging, the entire slide was sealed with Parafilm for long-term storage. Our in vitro samples did not require additional antibiotics to prevent contamination, and viscosity values remained stable for one week after storage at 4°C; see Fig. 4.
Figure 4: Rheological stability of sterile in vitro mucus collection.
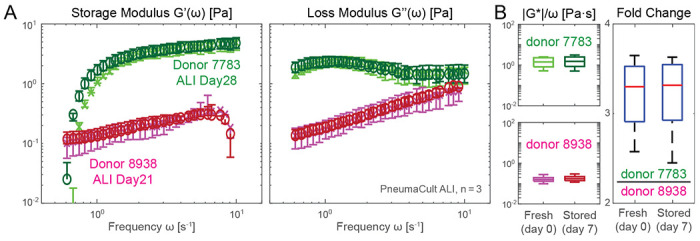
A. Storage and loss moduli of mucus extracted from ALI culture maintained in PneumaCult from two separate donors: donor 7783 (green shaded markers) is of bronchial origin, and donor 8938 (magenta shaded markers) is from a small airway source. B. Left panels show the fresh and stored absolute viscosity (|G*|/ω) before (lighter shade) and after 7 days of storage (darker shade). Right panel shows that fold changes in absolute viscosity between the two donors remain stable after 7 days of storage inside the sealed capillary chambers. Measurements performed on pooled n = 3 12-well plate inserts with specified N = 2 donors using 3 mm capillary chambers.
2.6. High-throughput DDM analysis
Viscoelastic moduli can be calculated automatically without user intervention from the recorded videos. Our analysis was performed in MATLAB on an Intel i9 computer with 128 GB of random access memory. Below we outline the mathematical foundation of this calculation and highlight our custom adaptations from common practice that are necessary for high-throughput applications. For detailed derivations of equations (1) to (5), see references [45, 46, 49, 54, 56].
Image structure function.
The azimuthally averaged image structure function D(q,Δt) is obtained as a function of the azimuthal wave number q and time lag Δt from the video frame sequences via
| (1) |
where I(x, y, t) is the image intensity function over spatial coordinates x, y and time t, FFT the two-dimensional Fast Fourier Transform (FFT) operator that converts real-space coordinates (x, y) into reciprocal-space wave vectors (qx, qy). ⟨·⟩t,q indicates averaging in time and the azimuthal angles of wave vectors. The characteristic results before averaging are shown in the left panels of Fig. 1C. This image structure function corresponds to the theoretically tractable intermediate scattering function of the Brownian particles f(q,Δt) by the relation
| (2) |
where A(q) is the total scattering amplitude depending on the number of particles in view as well as the optical path and associated point spread function, and B(q) a term that captures the effect of imaging noise.
If we take sufficiently long video at high enough speed in ideal conditions, the amplitude A(q) and the noise floor B(q) should be revealed by the plateaus formed by D(q,Δt) near the largest and the smallest and time delays, respectively; see black solid curve in the middle panel of Fig. 1C. Without making any a priori assumption on the form of f(q,Δt), A(q) and B(q) is commonly estimated by fitting these plateaus. For a material with high viscoelastic moduli, it can be prohibitive to wait for tracers to naturally de-correlate and reach the plateau at the largest measured time lag. In addition, slow drifts due to platform instability can also contaminate the shape of the D(q,Δt) curve by introducing premature de-correlation as indicated by the orange highlight of the simulated measurement data (larger error bar). Finally, compared to the time necessary to locate viable region-of-interests (usually up to 10 seconds per field of view), we also want to limit the video length to be of similar orders of magnitude; see blue shaded region in Fig. 1C.
To this end, for fluorescent tracers that do not move out of the frame (no change in tracer density), it is possible to estimate A(q) from B(q) directly via the relation [57]
| (3) |
In fact, [48] recently demonstrated that this estimate can be more reliable than fitting from the plateau, even if the de-correlation plateau is measured.
Similar to this approach, we estimated the sum of A(q) and B(q) directly by formally calculating the image structure function based on the difference of a periodically translated frame with itself. While this requires filtering at a specific azimuthal wave number depending on the direction and amount of the translation, we found that fitting to the lower envelope can recover the same estimate as Eqn. 3 without averaging every frame in time; see comparison between black dashed line and blue dashed line in middle panel of Fig. 1C. This leaves the baseline noise floor B(q) the only free parameter for estimation. We calculate it by fitting the plateau reached at the shortest time delay at the highest wave number q; for a thorough analysis of how different estimates would impact the quality of the result, we refer the interested readers to [48].
Lastly, we can compute the 2D mean squared displacement (MSD) of the tracer particles per wave number q by the relation
| (4) |
In perfect conditions, the resulting MSD should not be a function of q; some algorithms minimize the residual at different q to estimate A(q), B(q) [54]. For robustness, we proceed to calculate viscoelastic moduli based on the median and 10th to 90th quantile of the obtained MSD [48] with respect to q ranging between 4 and 8, where the amplitude function A(q) has the expected increasing form (see shaded area in bottom right corner panel of Fig. 1C) [58].
The elastic storage modulus G′(ω) and viscous loss modulus G″(ω) are related to the MSD by the generalized Stokes-Einstein relation
| (5) |
where ω = 1/Δt is the frequency, kB is the Boltzmann’s constant, T the measurement temperature, r the hydrodynamic radius of the tracers, and Γ[·] the Gamma function. Here α(ω) represents the logarithmic slope of the MSD.
3. Results: Validation and Proof-of-Concept Applications
DDM outperforms MPT in high viscosity samples.
We first measured the rheology of mucus gels reconstituted from lab-purified porcine gastric mucin (MUC5AC) [59, 60] Mucin concentration was varied from 1 to 4% (w/v) at pH 4 to mimic the range of mucus viscoelasticity we expect to collect in airway cell culture models (see section A). These mucin percentages were chosen to mimic the range of mucus we expect to collect in airway cell culture models, and mucin gels reconstituted from lab-purified mucins tend to be better model systems for native mucus than commercial mucin sources [59, 61]. We compare results obtained from conventional macrorheology, MPT, and our DDM method in Fig. 2; see Section F for details of the rheometer and tracking methodology.
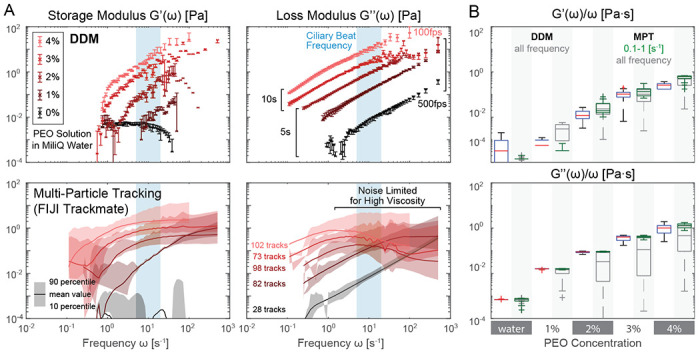
Figure 2: Viscoelastic properties of reconstituted MUC5AC gels.
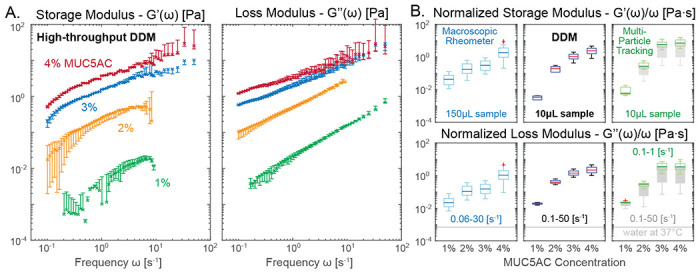
Porcine gastric mucin (MUC5AC) was reconstituted in acidic buffer (pH 4) to simulate mucus gels with physiologically-relevant viscoelastic character. A. Frequency response of the storage and loss moduli of 1 to 4% w/w MUC5AC gel are clearly separable using our high-throughput DDM protocol. Error bar indicates 10 to 90th percentile calculation based on 5, 512×512 px ROIs. B. Microrheology output from DDM (middle panels) and Multi-Particle Tracking (MPT, via FIJI Trackmate, right panels) can deviate from macrorheology (left panels). DDM microrheology at all frequency range (0.1–50 Hz) closely matches MPT results at restricted frequency (0.1–1 Hz, green). MPT results at full frequency ranges (0.1–50 Hz, dark gray) produce significantly higher variance especially for high viscosity samples. Light gray line indicates the dynamic viscosity of pure water at measurement temperature. Measurement performed on n = 2 technical replicates using GeneFrame 25 μL capillary chambers. Slides were placed on a temperature-controlled sample holder for additional thermal stability.
Fig. 2A shows the expected increase of the viscoelastic moduli as a function of mucin concentrations using our high-throughput DDM method, at a range of frequency responses including typical ciliary beat frequencies of human airway epithelia (5–15 Hz). At most frequencies ω, the storage modulus G′(ω) is higher than the loss modulus G″(ω) for the 2–4% mucin samples, confirming that viscoelastic gels are formed in these samples at low pH [62].
To simplify the ranking of the frequency-dependent viscoelasticity of different mucus samples, we discuss normalized moduli, i.e. storage G′(ω) and loss modulus G″(ω) divided by measurement frequency ω each, and their complex magnitude, the absolute viscosity |G* = G′ + iG″|/ω as the primary statistical markers. These quantities represent the elastic and the viscous part of the material response in an approximately frequency-independent fashion; see Fig. 2B. This is possible because the storage modulus G′(ω), for certain viscoelastic substances, follows a power-law relationship ~ ωδ with 0 < δ < 1 (Rouse polymer follows δ = 1/2), while their loss modulus increases linearly with frequency, i.e., G″(ω) ≈ ηω, when far away from phase transitions. Here, η is the dynamic viscosity.
When comparing the values obtained from macroscopic shear rheology (Fig. 2B, left panels) to those from our DDM microrheology (middle panels), the normalized moduli show a similar trend — increasing with mucin concentration — though the numerical values do not match exactly. This discrepancy is primarily due to a difference in measurement scale: a complex, heterogeneous biological material such as a mucin gel (or native mucus) could exhibit a fundamentally different mechanical response when probed in bulk (macrorheometer) or studied locally (microrheology) [3, 16, 62–66]. Therefore, for further validation of DDM, we also performed MPT, another microrheological assay on the same samples. Since we took care to select tracer size and surface chemistry such that we minimize unwanted interactions, we were able to conduct this MPT analysis on the same microscopy videos used for DDM analysis. In the absence of experimental noise, the DDM and MPT results should match exactly. Indeed, the MPT results (Fig. 2B, right panels), especially when the data analysis is restricted to lower frequency (0.1–1 Hz, green box plots), closely match our DDM values (middle panels). However, if data from the full frequency spectrum is used (0.1–50 Hz), MPT generates much larger variances (gray box plots behind green box plots). This discrepancy is due to a reduced signal-to-noise ratio at high mucin concentration where the gel becomes increasingly opaque and the thermally driven tracer vibrations blend into the high-frequency, static imaging noise. Nevertheless, this comparison does not indicate a failure of particle tracking techniques in general — it merely demonstrates that in a high-throughput workflow with minimal user intervention, DDM can recover better statistics even in suboptimal contrast and signal conditions.
High-throughput workflow enables longitudinal studies of mucus rheology.
We and others have shown that secretory cell type abundance and composition of in vitro ALI human airway epithelial cultures strongly depend on culture medium and differentiation time point [14,31,67], suggesting that mucus properties are also affected. Here, we use this phenomenon to illustrate the potential of our protocol to monitor longitudinal changes in mucus rheology in different in vitro conditions; for the detailed cell culture methods and materials see Section B.
Specifically, we compared the viscoelastic properties of mucus generated by human primary airway epithelial cells cultured at ALI in either PneumaCult (PC) or bronchial epithelial growth medium (BEGM). Fig. 3A shows the storage and loss moduli of mucus extracted at multiple time points of differentiation. Our results match the previously reported ranges for mucus extracted from PC cultures measured by optical tweezer techniques [68] (Fig. 3A, pink bars). Consistent with this study, we also see a similar drop in the storage and loss moduli for samples collected from BEGM-based inserts. Importantly, the high-throughput nature of our method enables us to easily monitor rheology changes over time. Mucus viscoelasticity in PC cultures increased from day 20 to day 46 at ALI, and then stabilized until day 70 at ALI; see Fig. 3A blue markers and panel B. In contrast, the viscoelasticity of mucus in BEGM-based cultures did not show significant increase over time (Fig. 3A, gray markers). Indeed, the measured viscosity is close to that of water at 37°C, suggesting that only tiny amounts of mucus were produced that are difficult to be collected and/or measured. These results are consistent with our study showing that PC-based cultures contain a higher proportion of mucus-producing cells than BEGM-based cultures [14].
Figure 3: Impact of differentiation medium and culture age.
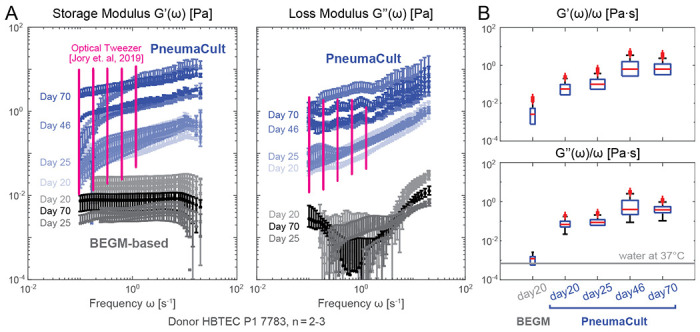
A. Storage and loss moduli derived from mucus extracted from in vitro primary airway epithelial Air-Liquid-Interface (ALI) cultures in PneumaCult (PC, blue markers) versus BEGM-based medium (grayscale markers) at different time points (days numbered after air lift at day 0). Pink markers are reproduced optical tweezer measurement of mucus extracted from PC ALI culture [68]. B. Frequency-normalized frequency normalized viscoelastic moduli shows that viscoelasticity of PC culture mucus saturates over time. In contrast, BEGM-based mucus consistently showed a low viscosity near that of the water / culture medium. Measurements performed from samples of n = 2 to 3 ALI insert cultures per condition from N=1 donor using 6 mm capillary chambers. Slides were placed on a temperature-controlled sample holder for additional thermal stability.
Stability of stored mucus samples facilitates batch processing.
In order to share samples between laboratories and streamline batch analysis, it would be beneficial to be able to store mucus samples for extended periods of time without altering their mechanical properties. Based on recommendations from literature [69], we stored mounted mucus samples in Parafilm wrapped slides at 4°C. We confirmed that under these conditions, the viscoelastic moduli of extracted in vitro mucus remained stable for at least one week, i.e., significantly longer than the typically assumed working time without cryogenic storage for sputum analysis, where contamination is difficult to avoid [70]; see overlapped markers in Fig. 4A. Interestingly, mucus from our bronchial airway donor 7783 shows a higher storage modulus than the loss modulus near the typical ciliary beat frequency of about 10 Hz, while the opposite is true for the small airway donor 8938. This indicates that cilia from the bronchial donor are beating against a viscoelastic gel instead of a viscoelastic fluid. As a further proof-of-concept, we show that the fold-change of absolute viscosity for the two donors remained stable between the collection day (Fig. 4B, left box plot) and 7 days after storage (Fig. 4B, right box plot). This indicates that our measurement and storage protocol can be used to robustly analyze previously stored samples, facilitating batch processing of samples collected at different time points.
Reduction in viscoelastic moduli of airway mucus in response to cigarette smoke exposure.
To show how our workflow can benefit translational research, in Fig. 5 we compared mucus extracted from ALI cultures exposed to cigarette smoke extracts against those extracted from the untreated cultures; see section B and section C for cell culture, treatment, and collection details. In Fig. 5B, we observed an approximately one-fold decrease in the normalized viscoelastic modulus in response to cigarette smoke. Our finding is consistent with studies showing that human sputum in light smokers exhibits reduced viscosity [16, 24].
Figure 5: Rheological changes of in vitro airway mucus in response to cigarette smoke exposure.
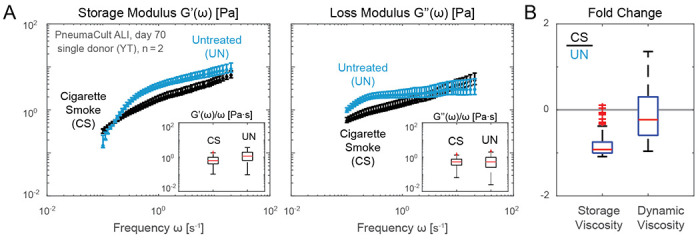
A. Storage and loss moduli of mucus extracted from ALI cultures maintained in PneumaCult and exposed to cigarette smoke extract twice a week over 8 weeks resembling a subchronic condition (blue, CS) and untreated conditions (black, UN). A reduction in viscoelastic moduli induced by cigarette smoke is observed for a single proof-of-concept donor and time point (day 70 after air lift), hinting a potential compensation due to irritation. B. Fold change of the storage (left) and dynamic (right) viscosity from CS treated sample and untreated one. Measurements performed on n = 2 technical replicates from N = 1 donor samples per condition using 6 mm capillary chambers at approximately 1:4 v/v dilution in PBS. Slides were placed on a temperature-controlled sample holder for additional thermal stability.
Robust detection of viscoelastic differences in clinical mucus samples.
While our method was optimized for the small mucus volumes usually obtained from in vitro cell culture samples, it can be equally applied to samples collected in animal models or the clinic. Since such samples may be collected or processed in buffer solution, we aimed to understand whether short-term submersion in buffer without aggressive mixing or homogenization would alter the viscoelastic properties of the mucus and mask differences between samples. We used clinically-extracted cervical mucus from different time points of the menstrual cycle (Section D), when mucus is known to drastically differ in viscoelasticity [22, 23], and tested whether short-term storage in buffer would distort these differences. In Fig. 6A, freshly collected luteal phase mucus (dark blue) shows a much higher storage modulus in most measured frequency ranges and a higher loss modulus at low frequencies when compared to that of the ovulatory phase mucus (dark red), as is commonly known [22, 23]. Note that based on the strong oscillatory behavior marked in the figure, we believe the actual viscoelastic moduli of luteal phase mucus is outside the sensitivity limit of our current optical setup above 1 Hz. After measuring the freshly collected samples, a technical replicate was submerged into phosphate-buffered saline (PBS, pH 7, calcium-free) with a normal pipette in ca. 1:100 v/v ratio. The PBS-exposed sample was then incubated at 4°C for 5 minutes and gently centrifuged at 400 RCF for 10 minutes. This process did not result in the homogenization of mucus and PBS, but rather caused the original mucus blob to swell [71–73]. The resulting gel was extracted and measured by applying our protocol, and a similar ratio of luteal and ovulatory mucus viscoelasticity can be seen compared to the pre-exposure conditions (Fig. 6A, lightly shaded markers), despite an overall decrease in absolute moduli compared to the fresh samples. Note that loss modulus of the swollen sample (lightly shaded markers) no longer exhibits unphysical oscillations at high frequency ranges when compared to the results based on fresh samples. Indeed, in Fig. 6B, we see that frequency normalized viscoelastic moduli of ovulatory mucus were approximately two-fold smaller than that of the luteal phase mucus for both the fresh and PBS-exposed samples (right panels), despite a nearly 100-fold drop in absolute units (left panels). Here, data inside the sensitivity limited zone and frequencies ted by sample drift are used for the fold change comparison. The remaining difference between the two conditions could be simply due to heterogeneity of the harvested mucus; PBS-exposed sample was taken from the original collection separately from the fresh sample; see Section D for details. In conclusion, our method robustly detects viscoelastic differences in clinical mucus samples and helps reveal how storing and processing protocols impact viscoelastic responses. Importantly, allowing mucus samples to gently swell in buffer allows for the reduction of viscoelasticity in order to meet the sensitivity limits of DDM while preserving fold-change differences between samples.
Figure 6: Rheological stability of mucus after osmotic swelling.
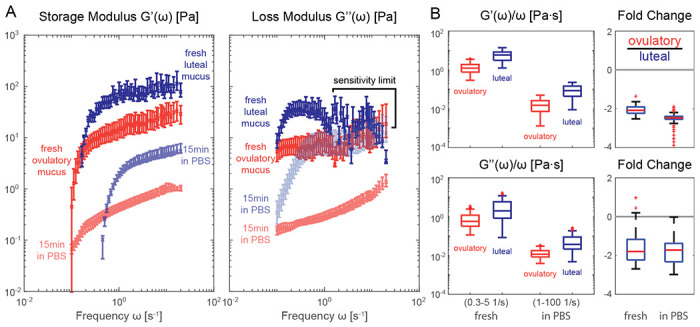
A. Storage and loss moduli derived from clinically extracted cervical mucus at luteal (blue shaded markers) and ovulatory phase (red shaded markers), both from fresh collection (darker shade) and after exposure to PBS without homogenization (lighter shade). The luteal phase viscosity at higher frequencies are most likely outside the sensitivity limit of our methodology and thus discarded in later statistical analyses. B. frequency normalized viscoelastic moduli (left panels) and fold change in absolute viscosity (right panels) of the luteal and ovulatory mucus before and after exposure to PBS solution. Different frequency range (axis label) are used for normalized moduli to avoid sensitivity limited zone (0.3-5 Hz before swelling) and minimize effects of sample drift (1-100 Hz after swelling). Measurements performed on sample per condition from N = 1 donor with 6 mm capillary chambers. Slides were placed on a temperature-controlled sample holder for additional thermal stability.
4. Discussion: Implications for translational research
Our proof-of-concept studies demonstrate that our optimized DDM microrheology technique allows the robust quantification of elasticity and viscosity changes in as little as 3 μL of mucus. Our workflow requires only a few minutes of sustained human attention for loading and recording of each sample. This drastic reduction of time commitment compared to state-of-the-art approaches enables the measurement of tens to hundreds of samples at a time, assuming that the pre- and post- processing overhead including chamber preparation and automated analysis are done in batch separately. Taken together, our methodology provides a powerful tool for monitoring mucus viscoelasticity in high-throughput in vitro experiments.
As our method does not require any specialized training or equipment beyond standard epifluorescence microscopy, it is poised to be readily adapted in both basic and translational research for monitoring longitudinal and donor-specific variations of mucus microrheology with much higher temporal resolution than what is currently performed. Compared to other methods, our approach is uniquely positioned in terms of accessibility and capability to understand mucus rheology at physiologically interesting time scales, e.g., around the ciliary beat frequency; see Fig. 7.
Figure 7: DDM is uniquely suitable for user-friendly, high-throughput assessment of low volume mucus samples.
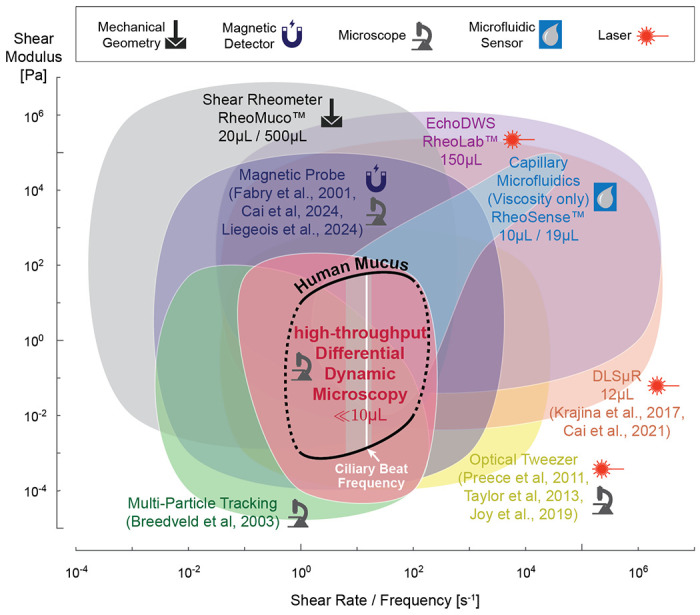
Accessible shear modulus and shear rate / frequency range of common rheology methods compared to human mucus modulus at frequencies relevant for biomedical research (black line) [15,16]. Ciliary beat frequency range based on our in vitro ALI culture measurements, with white line indicating median [14]. Symbols indicate type of equipment required, and where applicable, we also indicate the required minimum sample volume for each method. Multi-Particle Tracking (light green) and Differential Dynamic Microscopy (pink) ranges are based on [43] and our reported setup. Dynamic Light Scattering (orange), Magnetic Probe (dark purple), and Optical Tweezer (yellow) ranges are based on numbers reported in [68, 75–78, 81, 82, 86]. Mechanical shear rheometer (gray) values are based on our experience with Aanton Paar devices. Sample volume for RheoMuco device are minimum ALI mucus volume reported in online FAQ and recommended sputum volume in [70]. Capillary microfluidic viscometer (light blue) and Diffusing Wave Spectroscopy (light purple) ranges are based on values reported by RheoSense m-VROC II and VROC Initium 1+ and LS Instruments RheoLab devices [74], respectively.
While laser scattering based techniques, such as Diffusing Wave Spectroscopy (DWS) [74] and Dynamic Light Scattering (DLS) [75, 76] can probe material response at much higher frequencies, these frequency ranges are usually not of strong interest for physiological and pathological studies. These methods also tend to operate with higher sample volumes without intuitive access to the spatial heterogeneity information. Optical tweezers [68, 77, 78] and methods using micro- or nano- magnetic probes [79–82] are able to probe non-linear material responses in addition to Hooke’ian mechanics, and they can be used in-situ to measure viscoelasticity as a function of the mucus layer depth. However, these approaches usually only measure rheology at a single local point inside the sample at a time. This limitation, along with the operational complexity of manually inserting one or few physical probe into the sample and/or lengthy laser training, significantly limits the accessibility and practicality of those methods. High-throughput microfluidic viscometry [83], in turn, is easy to use but generally unsuitable for materials with a predominantly elastic mechanical response due to pumping limitations; nevertheless, commercialized solutions such as Rheosense devices can perform viscosity-only measurement at a sample volume of 10 μL OR a maximum throughput of ca. 15 minutes per 19 μL samples (automatic analysis of 96 well plates in 24 hours) [84]. Lastly, compared to mechanical shear rheometers specialized for sputum analysis such as Rheomuco, our approach lowers the sample volume requirement further from 20 μL of ALI mucus or 500 μL of sputum [70, 85] to 3–10 μL per test.
Our proof-of-concept results demonstrate the capability of DDM microrheology to serve as a rapid screening tool to identify mucus samples with interesting viscoelastic features. It is not necessarily meant to replace other more involved techniques discussed above; rather, these methods and their strengths can be used in a complementary fashion by reusing the recorded videos or acquiring more information from the mounted samples.
Our high-throughput technique can help generate robust data from large-scale studies to uncover factors driving changes in the biophysical properties of mucus. For example, it is well documented that heavy smoking (10-50 pack-year) and (chronic) bronchitis lead to the secretion of highly viscous mucus, while light smoke exposure (1-3 pack-year) can counterintuitively reduce mucus viscosity [24]. This suggests that there exists a non-trivial, non-monotonic transition in the human airway response to irritants. Therefore, it is of great importance to assess if a given in vitro model system is capable of reproducing this process, and which other, potentially donor-dependent factors play a role. Such a model system would then also allow to test the impact of drug treatments intended to pass or restore the mucus barrier. However, such functional, comparative assays will only be possible if researchers have the tools to perform high-throughput measurements at least daily. Furthermore, it remains unclear which environmental, genetic or epigenetic factors cause some people to develop airway disease in response to pollution, whereas others remain healthy [87–90]. One possibility is that alteration of mucus rheology is responsible, given its major role in airway defense. Thus, given a large and diverse cohorts of cell donors whose health records are followed over time, it would be possible to probe whether mucus rheology changes in response to pollution may be correlated with the development of disease later in life.
Despite the accessibility provided by DDM, mucus extraction and storage itself still need to be standardized during in vitro cell culture maintenance. For our differentiation media tests (Fig. 3), we followed the general guideline based on [91] to humidify our cultures every 48 hours and perform apical wash two days before collection to ensure we measure only freshly secreted mucus. We chose to humidify our culture with 50 μL/cm2 of insert area because at lower values, we frequently observed that the apical surface dried out, especially for PneumaCult cultures; this value is, however, not universal. In a previous study [17], only 3 μL of medium was enough to humidify the cultures. In [68], it was not specified if a humidifying liquid was used at all, and the mucus was collected only after being loosened 24 hours before collection. These different protocols could be due to either the specific incubator environment or cell donors. To further complicate the matter, in long term exposure studies, the accumulated mucus could be of inherent interest, e.g., the results in Fig. 5 comes from cultures whose apical surface were never aspirated nor humidified and collected after only three minutes of PBS loosening; see section C. Importantly, however, while the collection method will impact the viscoelastic properties of mucus, our results show that relative differences between samples are conserved, as long as the method is not destructive and is standardized within a given experiment.
Some final words on possible advancement of our workflow without impacting its user-friendly nature and high-throughput capacity. Since DDM is a technique that combines real-space information with reciprocal space analysis, one can compute spatial heterogeneity as a function of length scales by comparing results from a cascade of different window sizes [92]. This might produce important scale-dependent insights, especially if mucus rheology is measured in situ simultaneously with cilia-driven flow. Such non-invasive in-situ measurements could be realized with tracers mixed in during humidification, along with compounds that arrest ciliary motion temporarily [81, 93]. However, it remains to be verified that such manipulation does not incur long-term damage to the culture, as that would limit the ability to perform longitudinal studies.
Further directions to improve the outreach of our method is to utilize true low-cost imaging platforms to perform DDM analysis. To this end, recent work by [94, 95] shows that a webcam based image capture device could be used with frame dropping compensated explicitly or through deep-learning based video frame interpolations. [48] also showcased mathematically sound ways to further reduce the necessary amount of image frames needed for analyses, which can further speed up the automation of post-processing steps. It is conceivable that hardware technology could one day allow real-time processing of DDM analysis. Taken together, our systematic and automatable approach for high-throughput mucus rheology holds great potential for the future of disease subtyping, disease risk prediction, drug delivery and treatment testing in the respiratory system and other mucosal tissues and organs.
Additional Methods
A. Reconstituted MUC5AC gels
Mucin (MUC5AC) was purified from porcine stomachs as described previously [59]. The purified mucin was dissolved in de-ionized water at 4.4% w/v and kept overnight in a cold room to facilitate proper mucin solubilization. One hour before the shear rheometer measurements, 100 mM acetate buffer (pH 4) was added to suitable solutions of this mucin stock to obtain ca. 300 μL of 1,2,3, and 4% w/v mucin gels. 150 μL samples of those gels were used for shear rheometry; the remaining samples were stored at 4°C until loaded for DDM measurements into sealed GeneFrame 25 μL chambers within 24 hours.
B. ALI culture
Medium and donor comparison
Human primary bronchial/tracheal cells (hBTECs, catalog number FC-0035, donor 7783) and human primary small airway epithelial cells (hSAECs, catalog number FC-0016, donor 8938) were obtained from Lifeline Cell Technologies (USA). The first passage cells were expanded in collagen I coated 75 cm2 tissue culture flasks in bronchial epithelial cell medium (BEpiCM) (ScienCell (Sanbio), SCC3211-b) until ~90% confluency. Expanded cells were seeded on collagen IV (300 μg/mL) coated 6-well 0.4 pore diameter PET Transwell membranes (Corning, 3450) at a density of 500K cells per insert (~135K cells/cm2). The cells were cultured in BEpiCM containing 1 nM EC23 (Tocris) until fully confluent. Once the tissues were confluent, differentiation was induced by introducing air liquid interface (ALI) via removal of the apical medium (day 0 of ALI culture) and the use of PneumaCult ALI (STEMCELL Technologies) or BEpiCM:DMEM 50:50 + 1nM Ec23 medium supplied through basal chamber.
Cigarette smoke exposure
Human primary bronchial epithelial cells (hBECs) were acquired from cancer-free smokers at the University of New Mexico through diagnostic bronchoscopy and were stored in a de-identified manner (ATCC, CRL-11555). Donor culture plates were coated with lab made 804G medium using RPMI (Gibco, 11875119) + 10% FBS (Gibco, A5256801), and SABM with SAGM bullet kits (Lonza, CC-3118). At 80% confluency, cells were seeded onto 804G media-coated 12-well Transwell inserts and cultured in PneumaCult ALI (STEMCELL Technologies) until confluent. Once the tissues reached 100% confluency, differentiation was induced by removing the apical medium to establish an air liquid interface (ALI) setting (day 0 of ALI culture) and the use of PneumaCult medium supplied through basal chamber.
Cigarette Smoke Extract (CSE) solutions were prepared from research cigarettes (3R4F, Center for Tobacco Reference Products, Kentucky Tobacco Research & Development Center, Lexington, KY) as previously reported in [96] and in more detail in [97]. CSE treatment was performed by exposing cells for 1 h twice per week for 8 weeks either with vehicle (culture medium; UN condition) or medium containing 40 μg/mL CSE (CS condition) from the basal side.
C. In vitro mucus collection
Medium and donor comparison
48 hours before collection, the apical side of Transwells was incubated with 500 μL of Ca2+ infused PBS for 10 minutes (inside 37°C incubator). Afterwards, the PBS was removed and 50 μL/cm2 of medium was added (e.g., 233.5 μL per insert for 6-well plates, Corning 3450) to humidify the culture [91]. Mucus was collected and stored at +4°C in Eppendorf tubes sealed with Parafilm until measurement. Mucus was collected on days 20, 25, 27 (week 4), 46 (week 6), and 70 (week 10) of ALI culture.
Cigarette smoke exposure
Cultures were not humidified nor washed on the apical side for the entire ALI culture duration (70 days, both CS and UN). On collection day, 30 μL of PBS (Calcium-free) was added to the apical side for 3 minutes, and mucus was harvested using a positive displacement pipette (Gilson Microman E). Mucus samples were sent by overnight mail and kept at 4°C until the measurement day in the same week.
For measurement, a sample volume of 8 μL was first loaded in a 6 mm capillary chamber for imaging, then the same loaded sample was diluted (mixed until homogenization) with 10 μL of Milli-Q water twice to enhance the measurable difference between CS and UN samples. This gives a final equivalent dilution ratio of 16/81≈1:4 v/v (results shown in Fig. 5). Dilution was conducted to enhance the difference between measured viscoelastic moduli between CS and UN samples; prior to dilution the results were outside the sensitivity zone of our method and yielded virtually indistinguishable results.
D. Cervical mucus collection and swelling
Cervical mucus samples were collected at the Department of Gynecology from Klinikum Rechts der Isar (MRI) using cytobrush swabs (brush biopsy). All participants or their legal representatives provided informed consent. Samples were kept on the brush and stored in Falcon tubes at 4°C (on ice during transport) and 10 μL-sized blobs were transferred with positive displacement pipette to be measured on the same day.
For mucus swelling test, another approximately 11 μL mucus sample was taken from nearby positions on the brush and lightly mixed with 830 μL of PBS (aliquot refrigerated with collected mucus) solution by pipette (1 mL) inside an Eppendorf tube. Care was taken such that the mucus blob remained integral during the mixing process. Afterwards, 276 μL of PBS was added again and the Eppendorf tube was incubated for 5 minutes at 4°C. Next, the Eppendorf tube was centrifuged at 400 RCF for 10 minutes at 4°C. The mucus blob was extracted from the supernatant fluid and placed into the capillary chamber for viscoelasticity measurements. We did not use the same sample for the swelling test to avoid pipetting and transfer loss.
E. Validation with synthetic viscoelastic fluid
Numerous prior studies (e.g., [55]) have demonstrated that DDM microrheology can reproduce correct microrheology results for homogenous standard fluids such as glycerol water mixture and polymer solutions, such as Poly(ethylene oxide) (PEO). To confirm that our high-throughput pipeline is performing on par with expectation, we compared DDM and MPT measurement of 0 to 4% (w/w) PEO solution in Milli-Q water.
51.4 mg of dry PEO powder (900 kDa; Sigma-Aldrich, 189456) were used to make 4% w/w stock solution at room temperature. A total of 1.284 mL of Milli-Q water was gradually added to the powder and mixed until no visible bubbles and chunks were present. The final weight was verified with a digital scale to take account of evaporation during mixing. Dilution series and the stock solution were then stored overnight at 4°C to allow material settling. Before loading 10 μL samples into capillary chambers, solution in Eppendorf tube was vortexed for homogenization.
Fig. 8 compares the storage and loss moduli of the PEO solution based on our DDM versus MPT measurements. We found an excellent match between the two, especially for normalized loss modulus viscosity, if we restrict the frequency range to 0.1–1 Hz (bottom right panel, green box plots). In Fig. 8A, we observe a lower sensitivity bound for storage modulus via DDM below 0.01 Pa. This degradation in performance could be due to edge effects caused by particles moving in and out of view (256×256 px or 166.4×166.4 μm ROI chosen for analysis throughput) for fluids of low elastic response [98]. For similar reasons, only 28 high quality tracks that spanned the full length of the video were found to be analyzed via MPT. Moreover, background artifacts from retarded particle motion near chamber boundaries far away from the focal plane could still contribute some motion for transparent solutions.
Figure 8: High-throughput DDM validation with PEO solutions.
A. storage and loss moduli from DDM and particle tracking microrheology. DDM results show a small variance (error bar 10-90 percentile from 5 ROI average) that easily distinguishes PEO solution at different concentrations by weight, especially near typical ciliary beat frequency ranges (light blue). B. Comparison of frequency normalized viscoelastic moduli derived from DDM and particle tracking. Particle tracking results closely match that of DDM but only if the noisy frequency range is ignored. DDM box plots are based on all measured frequencies, green MPT box plots are restricted to data measured between 0.1 to 1 Hz, and dark gray for all measured MPT frequencies.
F. Shear rheometry and particle tracking analysis
Small amplitude oscillatory shear measurements were performed using a commercial shear rheometer (MCR 302, Anton Paar, Graz, Austria) with a plate/plate geometry (bottom plate: P-PTD 200/AIR, Anton Paar; 25 mm steel measuring head: PP25, 79044, Anton Paar) and a plate separation of 300 μm [59,99]. Pre-measurements were conducted in a stress-controlled manner at a torque of 0.5 μNm to ensure the characterization of linear viscoelastic responses. Then, frequency-dependent measurements were conducted in strain-controlled mode using the 1.5-fold value of the strain determined in the pre-measurements. Each 150 μL sample was measured 3 times over a frequency range of 0.01 to 10 Hz, with the frequency sweep going from maximum to minimum, vice versa and back again. Special care was taken so that the sample completely filled the gap between the two opposing plates. The instrument was outfitted with a humidity trap to minimize evaporation during testing. All measurements performed at 37°C.
Multi-particle tracking is performed using FIJI Trackmate [100] with Differences of Gaussian (DoG) algorithm and simple Linear Assignment Problem (LAP) tracker. Manual thresholds were used to filter out tracks with low tracking quality, abnormally high mean intensity, short track lengths, and out of distribution mean track speed manually based on visual inspection. Before initiating Trackmate, video contrast is adjusted to contain 0.01% saturated pixels based on full stack histogram.
Acknowledgements:
We sincerely thank Prof. Eva Kanso for initial discussions on utilizing DDM for mucus rheology measurements, and Dr. Wilhelm Bertrams and Prof. Mareike Lehmann for their valuable advice on standardizing mucus collection and transportation. Special thanks to Benedetta Zampa for her help in cell culture maintenance.
Funding:
This work was funded by (1) the National Institute of Health (NIH: R01HL152633, J.N.; RO1HL068111, R01HL140839 and R01HL140839, Y.T.) and (2) the European Research Council (ERC: ERC-STG 950219, J.N.)
Footnotes
Competing interests: The authors declare that they have no competing interests.
Data and materials availability:
MATLAB code of the analysis pipeline will be released under open source licenses. Digital video data used in this study are available by request.
References
- [1].Thornton DJ, Sheehan JK. From mucins to mucus: toward a more coherent understanding of this essential barrier. Proceedings of the American Thoracic Society. 2004;1(1):54–61. [DOI] [PubMed] [Google Scholar]
- [2].Thornton DJ, Rousseau K, McGuckin MA. Structure and function of the polymeric mucins in airways mucus. Annu Rev Physiol. 2008;70(1):459–86. [DOI] [PubMed] [Google Scholar]
- [3].Vasquez PA, Forest MG. Complex fluids and soft structures in the human body. In: Complex fluids in biological systems: Experiment, theory, and computation. Springer; 2014. p. 53–110. [Google Scholar]
- [4].Ma J, Rubin BK, Voynow JA. Mucins, mucus, and goblet cells. Chest. 2018;154(1):169–76. [DOI] [PubMed] [Google Scholar]
- [5].Denton R, Forsman W, Hwang S, Litt M, Miller C. Viscoelasticity of mucus: Its role in ciliary transport of pulmonary secretions. American Review of Respiratory Disease. 1968;98(3):380–91. [DOI] [PubMed] [Google Scholar]
- [6].Hwang S, Litt M, Forsman W. Rheological properties of mucus. Rheologica Acta. 1969;8(4):438–48. [Google Scholar]
- [7].Puchelle E, Girard F, Zahm J. Rheology of bronchial secretions and mucociliary transport (author’s transl). Bulletin Européen de Physiopathologie Respiratoire. 1976;12(6):771–9. [PubMed] [Google Scholar]
- [8].King M, Macklem PT. Rheological properties of microliter quantities of normal mucus. Journal of Applied Physiology. 1977;42(6):797–802. [DOI] [PubMed] [Google Scholar]
- [9].Dulfano M, Adler K. Physical properties of sputum: VII. Rheologic properties and mucociliary transport. American Review of Respiratory Disease. 1975;112(3):341–7. [DOI] [PubMed] [Google Scholar]
- [10].Bansil R, Stanley E, LaMont JT. Mucin biophysics. Annual review of physiology. 1995;57(1):635–57. [DOI] [PubMed] [Google Scholar]
- [11].McShane A, Bath J, Jaramillo AM, Ridley C, Walsh AA, Evans CM, et al. Mucus. Current Biology. 2021;31(15):R938–45. [DOI] [PMC free article] [PubMed] [Google Scholar]
- [12].Fahy JV, Dickey BF. Airway mucus function and dysfunction. New England journal of medicine. 2010;363(23):2233–47. [DOI] [PMC free article] [PubMed] [Google Scholar]
- [13].Rose MC, Voynow JA. Respiratory tract mucin genes and mucin glycoproteins in health and disease. Physiological reviews. 2006;86(1):245–78. [DOI] [PubMed] [Google Scholar]
- [14].Roth D, Şahin AT, Ling F, Senger CN, Quiroz EJ, Calvert BA, et al. Structure-function relationships of mucociliary clearance in human airways. Research square. 2023. [DOI] [PubMed] [Google Scholar]
- [15].Hill DB, Vasquez PA, Mellnik J, McKinley SA, Vose A, Mu F, et al. A biophysical basis for mucus solids concentration as a candidate biomarker for airways disease. PloS one. 2014;9(2):e87681. [DOI] [PMC free article] [PubMed] [Google Scholar]
- [16].Lai SK, Wang YY, Wirtz D, Hanes J. Micro-and macrorheology of mucus. Advanced drug delivery reviews. 2009;61(2):86–100. [DOI] [PMC free article] [PubMed] [Google Scholar]
- [17].Loiseau E, Gsell S, Nommick A, Jomard C, Gras D, Chanez P, et al. Active mucus-cilia hydrodynamic coupling drives self-organization of human bronchial epithelium. Nature Physics. 2020;16(11):1158–64. [Google Scholar]
- [18].Morgan LE, Jaramillo AM, Shenoy SK, Raclawska D, Emezienna NA, Richardson VL, et al. Disulfide disruption reverses mucus dysfunction in allergic airway disease. Nature communications. 2021;12(1):249. [DOI] [PMC free article] [PubMed] [Google Scholar]
- [19].Linssen RS, Chai G, Ma J, Kummarapurugu AB, van Woensel JB, Bem RA, et al. Neutrophil extracellular traps increase airway mucus viscoelasticity and slow mucus particle transit. American journal of respiratory cell and molecular biology. 2021;64(1):69–78. [DOI] [PMC free article] [PubMed] [Google Scholar]
- [20].Hill DB, Button B, Rubinstein M, Boucher RC. Physiology and pathophysiology of human airway mucus. Physiological Reviews. 2022;102(4):1757–836. [DOI] [PMC free article] [PubMed] [Google Scholar]
- [21].Litt M, Wolf D, Khan M. Functional aspects of mucus rheology. Mucus in Health and Disease. 1977:191–201. [DOI] [PubMed] [Google Scholar]
- [22].Wolf DP, Blasco L, Khan MA, Litt M. Human cervical mucus. I. Rheologic characteristics. Fertility and Sterility. 1977;28(1):41–6. [PubMed] [Google Scholar]
- [23].Wolf DP, Blasco L, Khan MA, Litt M. Human cervical mucus. II. Changes in viscoelasticity during the ovulatory menstrual cycle. Fertility and sterility. 1977;28(1):47–52. [DOI] [PubMed] [Google Scholar]
- [24].Zayas JG, Man G, King M. Tracheal mucus rheology in patients undergoing diagnostic bronchoscopy. Am Rev Respir Dis. 1990;141:1107–13. [DOI] [PubMed] [Google Scholar]
- [25].Schuster BS, Suk JS, Woodworth GF, Hanes J. Nanoparticle diffusion in respiratory mucus from humans without lung disease. Biomaterials. 2013;34(13):3439–46. [DOI] [PMC free article] [PubMed] [Google Scholar]
- [26].Crater JS, Carrier RL. Barrier properties of gastrointestinal mucus to nanoparticle transport. Macromolecular bioscience. 2010;10(12):1473–83. [DOI] [PubMed] [Google Scholar]
- [27].Lock JY, Carlson TL, Carrier RL. Mucus models to evaluate the diffusion of drugs and particles. Advanced drug delivery reviews. 2018;124:34–49. [DOI] [PMC free article] [PubMed] [Google Scholar]
- [28].Kumar P, Tamayo J, Shiu RF, Chin WC, Gopinath A. Size-Dependent Diffusion and Dispersion of Particles in Mucin. Polymers. 2023;15(15):3241. [DOI] [PMC free article] [PubMed] [Google Scholar]
- [29].Sears PR, Yin WN, Ostrowski LE. Continuous mucociliary transport by primary human airway epithelial cells in vitro. American Journal of Physiology-Lung Cellular and Molecular Physiology. 2015;309(2):L99–L108. [DOI] [PMC free article] [PubMed] [Google Scholar]
- [30].Silva S, Bicker J, Falcão A, Fortuna A. Air-liquid interface (ALI) impact on different respiratory cell cultures. European Journal of Pharmaceutics and Biopharmaceutics. 2023;184:62–82. [DOI] [PubMed] [Google Scholar]
- [31].Bukowy-Bieryłło Z, Daca-Roszak P, Jurczak J, Przystałowska-Macioła H, Jaksik R, Witt M, et al. In vitro differentiation of ciliated cells in ALI-cultured human airway epithelium–the framework for functional studies on airway differentiation in ciliopathies. European Journal of Cell Biology. 2022;101(1):151189. [DOI] [PubMed] [Google Scholar]
- [32].Lee RE, Reidel B, Nelson MR, Macdonald JK, Kesimer M, Randell SH. Air-Liquid interface cultures to model drug delivery through the mucociliary epithelial barrier. Advanced Drug Delivery Reviews. 2023;198:114866. [DOI] [PMC free article] [PubMed] [Google Scholar]
- [33].Nawroth JC, Lucchesi C, Cheng D, Shukla A, Ngyuen J, Shroff T, et al. A microengineered airway lung chip models key features of viral-induced exacerbation of asthma. American journal of respiratory cell and molecular biology. 2020;63(5):591–600. [DOI] [PubMed] [Google Scholar]
- [34].Shen Y, Huang S, Kang J, Lin J, Lai K, Sun Y, et al. Management of airway mucus hypersecretion in chronic airway inflammatory disease: Chinese expert consensus (English edition). International journal of chronic obstructive pulmonary disease. 2018:399–407. [DOI] [PMC free article] [PubMed] [Google Scholar]
- [35].Van Buren E, Radicioni G, Lester S, O’Neal WK, Dang H, Kasela S, et al. Genetic regulators of sputum mucin concentration and their associations with COPD phenotypes. PLoS genetics. 2023;19(6):e1010445. [DOI] [PMC free article] [PubMed] [Google Scholar]
- [36].Saetta M, Turato G, Baraldo S, ZANIN A, BRACCIONI F, MAPP CE, et al. Goblet cell hyperplasia and epithelial inflammation in peripheral airways of smokers with both symptoms of chronic bronchitis and chronic airflow limitation. American journal of respiratory and critical care medicine. 2000;161(3):1016–21. [DOI] [PubMed] [Google Scholar]
- [37].Shaykhiev R. Emerging biology of persistent mucous cell hyperplasia in COPD. Thorax. 2019;74(1):4–6. Available from: https://thorax.bmj.com/content/74/1/4. [DOI] [PMC free article] [PubMed] [Google Scholar]
- [38].Boegh M, Nielsen HM. Mucus as a barrier to drug delivery-understanding and mimicking the barrier properties. Basic & clinical pharmacology & toxicology. 2015;116(3):179–86. [DOI] [PubMed] [Google Scholar]
- [39].Balsamo R, Lanata L, Egan C. Mucoactive drugs. European Respiratory Review. 2010;19(116):127–33. [DOI] [PMC free article] [PubMed] [Google Scholar]
- [40].Paone P, Cani PD. Mucus barrier, mucins and gut microbiota: the expected slimy partners? Gut. 2020;69(12):2232–43. [DOI] [PMC free article] [PubMed] [Google Scholar]
- [41].Lacroix G, Gouyer V, Gottrand F, Desseyn JL. The cervicovaginal mucus barrier. International Journal of Molecular Sciences. 2020;21(21):8266. [DOI] [PMC free article] [PubMed] [Google Scholar]
- [42].Izadifar Z, Sontheimer-Phelps A, Lubamba BA, Bai H, Fadel C, Stejskalova A, et al. Modeling mucus physiology and pathophysiology in human organs-on-chips. Advanced Drug Delivery Reviews. 2022;191:114542. [DOI] [PubMed] [Google Scholar]
- [43].Breedveld V, Pine D. Microrheology as a tool for high-throughput screening. Journal of materials science. 2003;38:4461–70. [Google Scholar]
- [44].Cerbino R, Cicuta P. Perspective: Differential dynamic microscopy extracts multi-scale activity in complex fluids and biological systems. The Journal of chemical physics. 2017;147(11). [DOI] [PubMed] [Google Scholar]
- [45].Cerbino R, Trappe V. Differential dynamic microscopy: probing wave vector dependent dynamics with a microscope. Physical review letters. 2008;100(18):188102. [DOI] [PubMed] [Google Scholar]
- [46].Cerbino R, Giavazzi F, Helgeson ME. Differential dynamic microscopy for the characterization of polymer systems. Journal of Polymer Science. 2022;60(7):1079–89. [Google Scholar]
- [47].Zhang X, Fu J, Zhang Z, Jangda M, Rosu C, Parkinson GD, et al. Differential Dynamic Microscopy: Diffusion Measurements Where You Want Them. Macromolecules. 2023;57(1):3–20. [Google Scholar]
- [48].Gu M, Luo Y, He Y, Helgeson ME, Valentine MT. Uncertainty quantification and estimation in differential dynamic microscopy. Physical Review E. 2021;104(3):034610. [DOI] [PubMed] [Google Scholar]
- [49].Bayles AV, Squires TM, Helgeson ME. Probe microrheology without particle tracking by differential dynamic microscopy. Rheologica Acta. 2017;56:863–9. [Google Scholar]
- [50].Safari MS, Vorontsova MA, Poling-Skutvik R, Vekilov PG, Conrad JC. Differential dynamic microscopy of weakly scattering and polydisperse protein-rich clusters. Physical Review E. 2015;92(4):042712. [DOI] [PubMed] [Google Scholar]
- [51].Cerbino R, Piotti D, Buscaglia M, Giavazzi F. Dark field differential dynamic microscopy enables accurate characterization of the roto-translational dynamics of bacteria and colloidal clusters. Journal of Physics: Condensed Matter. 2017;30(2):025901. [DOI] [PubMed] [Google Scholar]
- [52].Sentjabrskaja T, Zaccarelli E, De Michele C, Sciortino F, Tartaglia P, Voigtmann T, et al. Anomalous dynamics of intruders in a crowded environment of mobile obstacles. Nature communications. 2016;7(1):11133. [DOI] [PMC free article] [PubMed] [Google Scholar]
- [53].Hanio S, Möllmert S, Möckel C, Choudhury S, Höpfel AI, Zorn T, et al. Bile Is a Selective Elevator for Mucosal Mechanics and Transport. Molecular Pharmaceutics. 2023;20(12):6151–61. [DOI] [PubMed] [Google Scholar]
- [54].Edera P, Bergamini D, Trappe V, Giavazzi F, Cerbino R. Differential dynamic microscopy microrheology of soft materials: A tracking-free determination of the frequency-dependent loss and storage moduli. Physical Review Materials. 2017;1(7):073804. [Google Scholar]
- [55].Escobedo-Sánchez M, Segovia-Gutiérrez J, Zuccolotto-Bernez A, Hansen J, Marciniak C, Sachowsky K, et al. Microliter viscometry using a bright-field microscope: η-DDM. Soft Matter. 2018;14(34):7016–25. [DOI] [PubMed] [Google Scholar]
- [56].Zhao Y. Run-and-tumble motion and differential dynamic microscopy. HKU Theses Online (HKUTO). 2016. [Google Scholar]
- [57].Giavazzi F, Malinverno C, Scita G, Cerbino R. Tracking-free determination of single-cell displacements and division rates in confluent monolayers. Frontiers in Physics. 2018;6:120. [Google Scholar]
- [58].Crocker JC, Hoffman BD. Multiple-particle tracking and two-point microrheology in cells. Methods in cell biology. 2007;83:141–78. [DOI] [PubMed] [Google Scholar]
- [59].Marczynski M, Jiang K, Blakeley M, Srivastava V, Vilaplana F, Crouzier T, et al. Structural alterations of mucins are associated with losses in functionality. Biomacromolecules. 2021;22(4):1600–13. [DOI] [PubMed] [Google Scholar]
- [60].Marczynski M, Rickert CA, Fuhrmann T, Lieleg O. An improved, filtration-based process to purify functional mucins from mucosal tissues with high yields. Separation and Purification Technology. 2022;294:121209. [Google Scholar]
- [61].Marczynski M, Kimna C, Lieleg O. Purified mucins in drug delivery research. Advanced Drug Delivery Reviews. 2021;178:113845. [DOI] [PubMed] [Google Scholar]
- [62].Wagner CE, Turner BS, Rubinstein M, McKinley GH, Ribbeck K. A rheological study of the association and dynamics of MUC5AC gels. Biomacromolecules. 2017;18(11):3654–64. [DOI] [PMC free article] [PubMed] [Google Scholar]
- [63].MacKintosh F, Schmidt C. Microrheology. Current opinion in colloid & interface science. 1999;4(4):300–7. [Google Scholar]
- [64].Luan Y, Lieleg O, Wagner B, Bausch AR. Micro-and macrorheological properties of isotropically cross-linked actin networks. Biophysical journal. 2008;94(2):688–93. [DOI] [PMC free article] [PubMed] [Google Scholar]
- [65].Schmidt RF, Kiefer H, Dalgliesh R, Gradzielski M, Netz RR. Nanoscopic Interfacial Hydrogel Viscoelasticity Revealed from Comparison of Macroscopic and Microscopic Rheology. Nano Letters. 2024;24(16):4758–65. [DOI] [PMC free article] [PubMed] [Google Scholar]
- [66].Philippe AM, Cipelletti L, Larobina D. Mucus as an Arrested Phase Separation Gel. Macromolecules. 2017;50(20):8221–30. Available from: 10.1021/acs.macromol.7b00842. [DOI] [Google Scholar]
- [67].Redman E, Fierville M, Cavard A, Plaisant M, Arguel MJ, Ruiz Garcia S, et al. Cell culture differentiation and proliferation conditions influence the in vitro regeneration of the human airway epithelium. American Journal of Respiratory Cell and Molecular Biology. 2024;71(3):267–81. [DOI] [PMC free article] [PubMed] [Google Scholar]
- [68].Jory M, Bellouma K, Blanc C, Casanellas L, Petit A, Reynaud P, et al. Mucus microrheology measured on human bronchial epithelium culture. Frontiers in Physics. 2019;7:19. [Google Scholar]
- [69].Kramer C, Rulff H, Ziegler JF, Mönch PW, Alzain N, Addante A, et al. Ileal mucus viscoelastic properties differ in Crohn’s disease. Mucosal Immunology. 2024. [DOI] [PubMed] [Google Scholar]
- [70].Wykoff JA, Shaffer KM, Araba KC, Markovetz MR, Patarin J, de Saint Vincent MR, et al. Rapid viscoelastic characterization of airway mucus using a benchtop rheometer. JoVE (Journal of Visualized Experiments). 2022;(182):e63876. [DOI] [PMC free article] [PubMed] [Google Scholar]
- [71].Tanaka T, Fillmore DJ. Kinetics of swelling of gels. The Journal of Chemical Physics. 1979;70(3):1214–8. [Google Scholar]
- [72].Li Y, Tanaka T. Kinetics of swelling and shrinking of gels. The Journal of chemical physics. 1990;92(2):1365–71. [Google Scholar]
- [73].Wang C, Li Y, Hu Z. Swelling kinetics of polymer gels. Macromolecules. 1997;30(16):4727–32. [Google Scholar]
- [74].Zakharov P, Cardinaux F, Scheffold F. Multispeckle diffusing-wave spectroscopy with a single-mode detection scheme. Physical Review E—Statistical, Nonlinear, and Soft Matter Physics. 2006;73(1):011413. [DOI] [PubMed] [Google Scholar]
- [75].Krajina BA, Tropini C, Zhu A, DiGiacomo P, Sonnenburg JL, Heilshorn SC, et al. Dynamic light scattering microrheology reveals multiscale viscoelasticity of polymer gels and precious biological materials. ACS central science. 2017;3(12):1294–303. [DOI] [PMC free article] [PubMed] [Google Scholar]
- [76].Cai PC, Krajina BA, Kratochvil MJ, Zou L, Zhu A, Burgener EB, et al. Dynamic light scattering microrheology for soft and living materials. Soft Matter. 2021;17(7):1929–39. [DOI] [PMC free article] [PubMed] [Google Scholar]
- [77].Preece D, Warren R, Evans R, Gibson GM, Padgett MJ, Cooper JM, et al. Optical tweezers: wideband microrheology. Journal of optics. 2011;13(4):044022. [Google Scholar]
- [78].Taylor MA, Knittel J, Bowen WP. Fundamental constraints on particle tracking with optical tweezers. New Journal of Physics. 2013;15(2):023018. [Google Scholar]
- [79].Radiom M, Hénault R, Mani S, Iankovski AG, Norel X, Berret JF. Magnetic wire active microrheology of human respiratory mucus. Soft Matter. 2021;17(32):7585–95. [DOI] [PubMed] [Google Scholar]
- [80].Braunreuther M, Liegeois M, Fahy JV, Fuller GG. Nondestructive rheological measurements of biomaterials with a magnetic microwire rheometer. Journal of Rheology. 2023;67(2):579–88. [Google Scholar]
- [81].Liegeois MA, Braunreuther M, Charbit AR, Raymond WW, Tang M, Woodruff PG, et al. Peroxidase-mediated mucin cross-linking drives pathologic mucus gel formation in IL-13-stimulated airway epithelial cells. JCI insight. 2024. [DOI] [PMC free article] [PubMed] [Google Scholar]
- [82].Cai PC, Braunreuther M, Shih A, Spakowitz AJ, Fuller GG, Heilshorn SC. Air–liquid intestinal cell culture allows in situ rheological characterization of intestinal mucus. APL bioengineering. 2024;8(2). [DOI] [PMC free article] [PubMed] [Google Scholar]
- [83].Schultz KM, Bayles AV, Baldwin AD, Kiick KL, Furst EM. Rapid, high resolution screening of biomaterial hydrogelators by μ2rheology. Biomacromolecules. 2011;12(12):4178–82. [DOI] [PMC free article] [PubMed] [Google Scholar]
- [84].Cakmak O, Elbuken C, Ermek E, Mostafazadeh A, Baris I, Alaca BE, et al. Microcantilever based disposable viscosity sensor for serum and blood plasma measurements. Methods. 2013;63(3):225–32. [DOI] [PubMed] [Google Scholar]
- [85].Patarin J, Ghiringhelli É, Darsy G, Obamba M, Bochu P, Camara B, et al. Rheological analysis of sputum from patients with chronic bronchial diseases. Scientific reports. 2020;10(1):15685. [DOI] [PMC free article] [PubMed] [Google Scholar]
- [86].Fabry B, Maksym GN, Butler JP, Glogauer M, Navajas D, Fredberg JJ. Scaling the microrheology of living cells. Physical review letters. 2001;87(14):148102. [DOI] [PubMed] [Google Scholar]
- [87].Yang I, Fong K, Zimmerman P, Holgate S, Holloway J. Genetic susceptibility to the respiratory effects of air pollution. Postgraduate medical journal. 2009;85(1006):428–36. [DOI] [PubMed] [Google Scholar]
- [88].Ji H, Hershey GKK. Genetic and epigenetic influence on the response to environmental particulate matter. Journal of Allergy and Clinical Immunology. 2012;129(1):33–41. [DOI] [PMC free article] [PubMed] [Google Scholar]
- [89].Castaldi PJ, Benet M, Petersen H, Rafaels N, Finigan J, Paoletti M, et al. Do COPD subtypes really exist? COPD heterogeneity and clustering in 10 independent cohorts. Thorax. 2017;72(11):998–1006. [DOI] [PMC free article] [PubMed] [Google Scholar]
- [90].Rider CF, Carlsten C. Air pollution and DNA methylation: effects of exposure in humans. Clinical epigenetics. 2019;11(1):131. [DOI] [PMC free article] [PubMed] [Google Scholar]
- [91].Gerovac BJ, Valencia M, Baumlin N, Salathe M, Conner GE, Fregien NL. Submersion and hypoxia inhibit ciliated cell differentiation in a notch-dependent manner. American journal of respiratory cell and molecular biology. 2014;51(4):516–25. [DOI] [PMC free article] [PubMed] [Google Scholar]
- [92].Chioccioli M, Feriani L, Kotar J, Bratcher P, Cicuta P. Phenotyping ciliary dynamics and coordination in response to CFTR-modulators in Cystic Fibrosis respiratory epithelial cells. Nature communications. 2019;10(1):1763. [DOI] [PMC free article] [PubMed] [Google Scholar]
- [93].Clapp PW, Lavrich KS, van Heusden CA, Lazarowski ER, Carson JL, Jaspers I. Cinnamaldehyde in flavored e-cigarette liquids temporarily suppresses bronchial epithelial cell ciliary motility by dysregulation of mitochondrial function. American Journal of Physiology-Lung Cellular and Molecular Physiology237. 2019;316(3):L470–86. [DOI] [PMC free article] [PubMed] [Google Scholar]
- [94].Jarujareet U. Rheological measurement of biological fluids by a portable differential dynamic microscopy-based device [PhD thesis]. University of Glasgow; 2021. [Google Scholar]
- [95].Jarujareet U, Wiratchawa K, Panpisut P, Intharah T. DeepDDM: A compact deep-learning assisted platform for micro-rheological assessment of micro-volume fluids. IEEE Access. 2023;11:66467–77. [Google Scholar]
- [96].Tassew D, Fort S, Mebratu Y, McDonald J, Chu HW, Petersen H, et al. Effects of wood smoke constituents on mucin gene expression in mice and human airway epithelial cells and on nasal epithelia of subjects with a susceptibility gene variant in Tp53. Environmental Health Perspectives. 2022;130(1):017010. [DOI] [PMC free article] [PubMed] [Google Scholar]
- [97].Tessema M, Tassew DD, Yingling CM, Do K, Picchi MA, Wu G, et al. Identification of novel epigenetic abnormalities as sputum biomarkers for lung cancer risk among smokers and COPD patients. Lung Cancer. 2020;146:189–96. [DOI] [PMC free article] [PubMed] [Google Scholar]
- [98].Giavazzi F, Edera P, Lu PJ, Cerbino R. Image windowing mitigates edge effects in Differential Dynamic Microscopy. The European Physical Journal E. 2017;40:1–9. [DOI] [PubMed] [Google Scholar]
- [99].Kretschmer M, Ceña-Diez R, Butnarasu C, Silveira V, Dobryden I, Visentin S, et al. Synthetic Mucin Gels with Self-Healing Properties Augment Lubricity and Inhibit HIV-1 and HSV-2 Transmission. Advanced Science. 2022;9(32):2203898. [DOI] [PMC free article] [PubMed] [Google Scholar]
- [100].Ershov D, Phan MS, Pylvänäinen JW, Rigaud SU, Le Blanc L, Charles-Orszag A, et al. Track-Mate 7: integrating state-of-the-art segmentation algorithms into tracking pipelines. Nature methods. 2022;19(7):829–32. [DOI] [PubMed] [Google Scholar]
Associated Data
This section collects any data citations, data availability statements, or supplementary materials included in this article.
Data Availability Statement
MATLAB code of the analysis pipeline will be released under open source licenses. Digital video data used in this study are available by request.