Abstract
The aryl hydrocarbon receptor (AhR or dioxin receptor) is a ligand-activated transcription factor that heterodimerizes with the AhR nuclear translocator (ARNT/HIF-1β) to form an AhR/ARNT transcription factor complex. This complex binds to specific DNA sites in the regulatory domains of numerous target genes and mediates the biological effects of exogenous ligands. Herein, we have investigated the subcellular distribution of the AhR/ARNT complex in response to ligand stimulation, by using live-cell confocal and high-resolution deconvolution microscopy. We found that unliganded AhR shows a predominantly cytoplasmic diffuse distribution in mouse hepatoma cells. On addition of ligand, AhR rapidly translocates to the nucleus and accumulates in multiple bright foci. Inhibition of transcription prevented the formation of AhR foci. Dual- and triple-immunolabeling experiments, combined with labeling of nascent RNA, showed that the foci are transcription sites, indicating that upon ligand stimulation, AhR is recruited to active transcription sites. The interaction of AhR with ARNT was both necessary and sufficient for the recruitment of AhR to transcription sites. These results indicate that AhR/ARNT complexes are recruited to specific subnuclear compartments in a ligand-dependent manner and that these foci represent the sites of AhR target genes.
INTRODUCTION
Aryl hydrocarbon receptor (AhR or dioxin receptor) is a member of basic helix-loop-helix (bHLH)/PAS (Period [Per]-aryl hydrocarbon receptor nuclear translocator [ARNT]-single minded [Sim]) family of transcriptional regulators (Burbach et al., 1992; Ema et al., 1992). Members of this family include aryl hydrocarbon receptor nuclear translocator/hypoxia-inducible factor 1β (ARNT/HIF-1β) (Hoffman et al., 1991), hypoxia-inducible factor 1α (HIF-1α) (Wang et al., 1995), Drosophila developmental factors such as Trachealess (Isaac and Andrew, 1996; Wilk et al., 1996) and Sim (Nambu et al., 1991), mammalian circadian rhythm regulators such as Clock (King et al., 1997) and Per (Sun et al., 1997; Tei et al., 1997), and nuclear receptor coactivators such as SRC-1 (Kamei et al., 1996) and TIF-2 (Voegel et al., 1996). Although these regulatory proteins form heterodimers and to a lesser degree homodimers with other family members, ARNT is the only known heterodimerization partner of AhR. The bHLH/PAS proteins play roles in neurogenesis, myogenesis, circadian rhythm regulation, homeostatic response to hypoxia, toxin metabolism, and nuclear hormone receptor function (Crews, 1998; Gu et al., 2000).
AhR is a ligand-activated transcription factor. Endogenous ligand(s) of AhR is unknown. Both genetic and biochemical studies indicate that AhR plays a role in embryonic development, liver and immune system functioning, and cell growth and differentiation (Fernandez-Salguero et al., 1995; Ma and Whitlock, 1996; Schmidt et al., 1996; Kolluri et al., 1999). Exogenous ligands of AhR include a variety of halogenated and polycyclic aromatic hydrocarbons that are found in environmental pollutants, chemical carcinogens, and tobacco smoke, and AhR has been directly linked to carcinogenesis by these compounds (Hankinson, 1995; Rowlands and Gustafsson, 1997; Shimizu et al., 2000).
ARNT/HIF-1β is a bHLH/PAS transcription factor, and it is not believed to bind to any ligand (Hoffman et al., 1991). Genetic and biochemical studies show that ARNT is crucial in embryonic development and angiogenesis and in response to hypoxia and hypoglycemia (Maltepe et al., 1997).
The unliganded form of AhR exists in a complex with heat-shock protein 90 (hsp90) and an immunophilin-type chaperon and is diffusely distributed in the cytoplasm (Pollenz et al., 1994; Carver and Bradfield, 1997; Meyer et al., 1998). After ligand binding, activated AhR translocates to the nucleus. In contrast to AhR, ARNT localizes in the nucleus both in the presence and absence of ligand (Hord and Perdew, 1994; Pollenz et al., 1994). AhR dissociates from the hsp90 and heterodimerizes with ARNT, and the AhR/ARNT complex activates the transcription of target genes by binding to specific xenobiotic response elements (XREs) or dioxin response elements. Both AhR and ARNT function at the endpoints of a variety of signal transduction pathways, thereby regulating the expression of specific genes involved in cell growth, differentiation, metabolism of drugs, and environmental carcinogens. Examples of AhR/ARNT target genes, identified to date include cytochromes P450 1A1, 1A2, 1B1, glutathione S-transferase, and NADPH/quinone oxidoreductase (Rowlands and Gustafsson, 1997; Whitlock, 1999).
The spatial distribution of transcription factors with respect to active transcription sites has been studied for a small number of transcription factors (van Steensel et al., 1995; Grande et al., 1997; Zeng et al., 1998; Rubbi and Milner, 2000). However, the dynamic recruitment of a specific transcription factor and its heterodimerization partner to active transcription sites in a ligand-dependent manner has never been demonstrated in living cells. Herein, we have used high-resolution confocal and deconvolution microscopy to study the intracellular and intranuclear distribution of the AhR/ARNT transcription factor complex in vivo. We show that AhR is recruited to transcription sites from the nuclear receptor complexes and that heterodimerization partner ARNT is both necessary and sufficient for the recruitment. These results indicate that AhR/ARNT complexes are recruited to specific subnuclear compartments (foci) in a ligand-dependent manner and that these foci represent the sites of AhR target genes.
MATERIALS AND METHODS
Expression Vectors
The mouse ARNT expression vector pcDNAI/Neo/mARNT has been described previously (Reisz-Porszasz et al., 1994; kindly provided by Dr. O. Hankinson, University of California, Los Angeles, CA). P1A1–4X1-LUC contains four copies of XRE1 immediately upstream of the P450 1A1 gene promoter and a luciferase reporter gene. XRE1 is a natural high-affinity binding site for the ligand-activated AhR/ARNT complex. P1A1-LUC is similar to P1A1–4X1-LUC except it lacks the four copies of XRE1. Both expression vectors have been described previously (Xu et al., 1998; a gift from Dr. D. Pasco, University of Mississippi, Oxford, MS). PCMVβgal was purchased from Pharmacia Biotech (Piscataway, NJ). Green fluorescent protein (GFP)-AhR was generated by amplifying the AhR insert from pCI/AhR (a generous gift from Dr. F.J. Gonzalez, National Cancer Institute, Bethesda, MD) by using primers 5′-GCGCAAGCTTCAAGCAGCGGCGCCAACATC-3′ and 5′-AAGGCCGCGGCTCCTCAACTCTGCACCTT-GC-3′. The final polymerase chain reaction product was cloned into pEGFP-C1 vector (CLONTECH, Palo Alto, CA). The resulting GFP-AhR vector was confirmed by sequencing and restriction analysis.
Cell Culture
The wild-type mouse hepatoma cell line (Hepa-1) and its variants, group B (AhR-deficient) and group C (ARNT mutant), have been described previously (Hankinson, 1995). Cells were grown in α-minimum essential medium (Invitrogen, Carlsbad, CA) supplemented with 7% fetal bovine serum (Hyclone Laboratories, Logan, UT). Cells were routinely maintained in a 37°C incubator with 5% CO2. Cells were treated with control vehicle, dimethyl sulfoxide (DMSO), or with a ligand, 2,3,7,8-tetrachlorodibenzo-p-dioxin (TCDD), at 10 nM for 1 h in all experiments. Inhibition of RNA polymerase II was achieved by treatment with α-amanitin (Sigma-Aldrich, St. Louis, MO) at 30 μg/ml for 3–4 h.
Transfections and Immunoblot Analysis
Expression constructs were transiently transfected into AhR-deficient and ARNT mutant cells by electroporation with a Electro Square Porator (BTX, San Diego, CA) at 160 V for 70 ms. The amount of transfected vectors was 5 μg of each GFP-AhR, AhR, GFP empty vector, P1A1–4X1-LUC, P1A1-LUC, and pcDNAI/Neo/mARNT and 1 μg of PCMVβgal (as an internal control). After 14 h, cells were treated either with control vehicle or TCDD at 10 nM for 1 h. The cells were harvested, and luciferase and β-galactosidase assays were done by using the Dual Reporter Assay according to the manufacturer's instructions (Tropix, Bedford, MA). All transfections were done in triplicates and all experiments were repeated at least four times. For Western blot, AhR-deficient cells were transfected with GFP-AhR and pCMV-IL2 as described above. The following day, the transfected population of cells was isolated by sorting using anti-IL2–coated magnetic beads, and whole cell extracts were prepared as described previously (Lim et al., 1999). Whole cell extracts were also prepared from wild-type Hepa-1 cells. Equal amounts of total cell extracts were fractioned on a 7.5% SDS-PAGE gels, electrotransferred to Immobilon-P (Millipore, Bedford, MA). GFP-AhR and endogenous AhR were detected using polyclonal anti-AhR (BIOMOL Research Laboratories, Plymouth Meeting, PA) and a horseradish peroxidase-conjugated goat anti-rabbit (Pierce Chemicals, Rockford, IL) antibody. Immunoblots were stripped and reprobed with monoclonal anti-tubulin as a loading control (Sigma-Aldrich). Expression of fusion protein was also confirmed by two other antibodies: monoclonal anti-GFP (Berkeley Antibody Company, Berkeley, CA) and polyclonal anti-AhR (Santa Cruz Biotechnology, Santa Cruz, CA).
Live-Cell Microscopy
AhR-deficient cells were grown and observed in LabTek II chambers (Nalge Nunc International, Naperville, IL). Subconfluent cells were transfected with GFP-AhR by electroporation as described above or by GenePorter Transfection Reagent (Gene Therapy Systems, San Diego, CA) according to manufacturer's instructions. After 14 h, the midplane single optical section of a cell was imaged before and 15, 30, and 60 min after the addition of 10 nM TCDD on a TCS NT laser scanning confocal microscope equipped with a 100× 1.4 numerical aperture (NA), oil immersion lens (Leica Microsystems, Deerfield, IL). GFP was excited with the 488-nm line from an argon laser (20-mW nominal output, detection 505–575 nm by using a photon multiplier tube with the confocal pinhole setting at 1.0 Airy disk unit). Data were collected with fourfold averaging at a resolution of 1024 × 1024 pixels by using optical slices of ∼0.4 μm. All experiments were done at 37°C.
In Situ Labeling of Transcription Sites
Nascent RNA was labeled based on procedures described previously (Jackson et al., 1993; Wansink et al., 1993; Huang et al., 1998; Wei et al., 1999). Briefly, cells were grown on 22-mm square glass coverslips in a six-well plate and transfected with GFP-AhR and treated with TCDD as described above. The cells were permeabilized in Tris-glycerol buffer (20 mM Tris-HCl, pH 7.4, 5 mM MgCl2, 0.5 mM EGTA, 25% glycerol, 5 μg/ml digitonin, 0.5 mM phenylmethylsulfonyl fluoride, and recombinant RNasin at 20 U/ml) for 3 min at room temperature. The cells were then incubated for 5 min at 35°C in transcription buffer (100 mM KCl, 50 mM Tris-HCl, pH 7.4, 5 mM MgCl2, 0.5 mM EGTA, 25% glycerol, 2 mM ATP, 0.5 mM CTP, 0.5 mM GTP, 0.5 mM 5-bromouridine 5′-triphosphate [BrUTP] [Sigma-Aldrich]), 1 mM phenylmethylsulfonyl fluoride, and recombinant RNasin at 20 U/ml. The cells were fixed and processed for indirect immunofluorescence microscopy as described below. Similar results were obtained by incubation in the transcription buffer for 30 min at room temperature and by using a protocol that labels the nascent RNA by microinjection of BrUTP (Wansink et al., 1994). Detection of transcription sites was confirmed by the absence of nascent RNA labeling after treatment with actinomycin D. Labeling of nuclear, but not nucleolar nascent RNA was sensitive to α-amanitin (2 μg/ml) when included in the transcription buffer. No nascent RNA signal was detected when cells were treated with RNase A before fixation.
Deconvolution Microscopy
AhR-deficient cells were grown on 22-mm square glass coverslips in a six-well plate, transfected with GFP-AhR, and treated with TCDD as described above. The cells were fixed and processed for indirect immunofluorescence microscopy as described below. Three-dimensional image stacks of cells were collected on an IE80 inverted microscope equipped with a 100× 1.35 NA, oil immersion objective (both from Olympus, Tokyo, Japan), and a charge-coupled device camera (Photometrics, Tucson, AZ) configured at 0.070-μm pixels. These three-dimensional image stacks were composed of 128 focal planes (in the Z-plane) with a spacing of 0.07 μm and were deconvolved by a constrained iterative deconvolution algorithm by using Deltavision image acquisition and analysis software (Applied Precision, Issaquah, WA). The midplane single optical sections of representative cells are shown in the figures.
Immunofluorescence Microscopy
AhR-deficient, ARNT mutant, and wild-type Hepa-1 cells were grown on 22-mm square glass coverslips in a six-well plate, transfected with GFP-AhR, and treated with TCDD as described above. The cells were fixed in 2% paraformaldehyde and processed for indirect immunofluorescence microscopy as described previously (Misteli and Spector, 1996). The primary antibodies used in this study included polyclonal anti-AhR at 1:1000 (BIOMOL Research Laboratories), polyclonal anti-AhR and anti-ARNT at 1:500 (Santa Cruz Biotechnology), monoclonal anti-ARNT at 1:250 (Affinity Bioreagents, Golden, CO), monoclonal anti-NuMa at 1:200 (Transduction Laboratories, Lexington, KY), and monoclonal anti-BrU at 1:250 (Caltag Laboratories, Burlingame, CA, or Roche Applied Science, Indianapolis, IN). The primary antibodies used for double and triple labelings were from different species including mouse, rabbit, and goat. We used species-specific secondary antibodies designed for simultaneous multiple labeling (Jackson Immunoresearch Laboratories, West Grove, PA). Secondary antibodies were conjugated to fluorescein isothiocyanate, Texas Red, and Cy-5. Images were acquired with narrow-band-pass emission filters (Chroma Technology, Brattleboro, VT) to prevent bleed-through between the channels. We obtained similar results by using rhodamine Red-X–conjugated secondary antibodies (Jackson Immunoresearch Laboratories) in place of those conjugated with Texas Red. DNA was stained with diamidino-phenylindole, dihydrochloride (Molecular Probes, Eugene, OR). Cells were mounted using Vectashield (Vector Laboratories, Burlingame, CA). The cells were observed on a deconvolution microscope as described above or on an E800 microscope (Nikon, Tokyo, Japan) by using 100× 1.35 NA, oil immersion Plano Nikon objective and a MicroMax cooled charge-coupled device camera (Photometrics). Images were collected and analyzed by using MetaMorph software (Universal Imaging, Downingtown, PA).
Cross-Correlation Analysis
Dual- and triple-immunolabeled images were collected on a deconvolution microscope as described above and cross-correlation function (CCF) analyses were carried out as described previously (van Steensel et al., 1996; Grande et al., 1997) by using MetaMorph software. Briefly, CCF of red signals (e.g., transcription sites) and green signals (e.g., GFP-AhR sites) was calculated by shifting the midplane single optical section of green image with respect to the midplane single optical section of red image over a distance of ΔX (in pixels) along the x-axis. The ΔX shift varied between −30 to +30 pixels. Negative ΔX values indicate the position of the green image to the left of the red image and positive ΔX values indicate the position of the green image to the right of the red image. After each ΔX shift, Pearson's correlation coefficient (Rp) representing the overlap between the images was calculated (Gonzalez and Wintz, 1987), and the Rp values were plotted against the ΔX values to generate the CCF graph. The value of Rp ranges between −1 and +1. A maximum Rp value and a peak around ΔX = 0 indicate a positive correlation between the distributions of red and green signals resulting from a high degree of nonrandom colocalization between two distributions. A minimum Rp value with an inverse peak around ΔX = 0 indicates no correlation between the distributions of red and green signals resulting from mutually excluded distributions. Even Rp values throughout the CCF graph with neither a positive nor an inverse peak around ΔX = 0 indicate colocalization of red and green signals resulting from a random overlap.
Quantitation of Colocalizations
Colocalization percentages in Table 1 were generated using 100 randomly selected cells from five independent experiments. The cells were dual- or triple-immunolabeled and imaged on a deconvolution microscope as described above. Single optical sections from the middle of cells were used for quantitations. The red and the green fluorescent signals with the fluorescent intensity values ranging only within the top 40% for that fluorescent channel were identified by thresholding with MetaMorph software. The percentage of pixels having the same positions in both thresholded images was calculated and included in Table 1. Colocalizations of the signals were confirmed by examining the consecutive optical sections above and below the midplane optical sections covering the entire depth of the cell nuclei. The colocalization image in Figure 6E was generated by thresholding the images with AhR, BrUTP, and ARNT signals from a representative cell as described above. The images were then converted to grayscale binary image, and the pixels containing the three signals simultaneously were output as a separate image.
Table 1.
Summary of colocalizations in the nuclei of AhR-deficient and ARNT mutant cells
| Colocalization percentage | |
|---|---|
| AhR/BrUTP | 35 ± 2.0 |
| BrUTP/AhR | 23 ± 3.0 |
| AhR/ARNT | 38 ± 2.2 |
| ARNT/AhR | 30 ± 4.0 |
| ARNT/BrUTP | 33 ± 1.5 |
| BrUTP/ARNT | 25 ± 1.6 |
| AhR/BrUTP (ARNT-negative cells) | 10 ± 1.0a |
| BrUTP/AhR (ARNT-negative cells) | 8 ± 1.0a |
| AhR/BrUTP (ARNT-positive cells) | 36 ± 3.0b |
| BrUTP/AhR (ARNT-positive cells) | 21 ± 2.0b |
| AhR/NuMa | 8 ± 1.0 |
| NuMa/AhR | 7 ± 1.0 |
| AhR (Cy-5)/AhR (Texas Red) | 99 ± 1.0 |
| AhR (Texas Red)/AhR (Cy-5) | 99 ± 1.0 |
Data were generated using 100 randomly selected cells. The cells were treated with TCDD, fixed, and processed for indirect immunofluorescence combined with deconvolution microscopy. Single optical sections from the middle of cells were collected and used for quantitative analysis as described in MATERIALS AND METHODS. Results represent means of five experiments ± SD.
Data from ARNT mutant cells.
Data from ARNT mutant cells transiently expressing ARNT.
Figure 6.
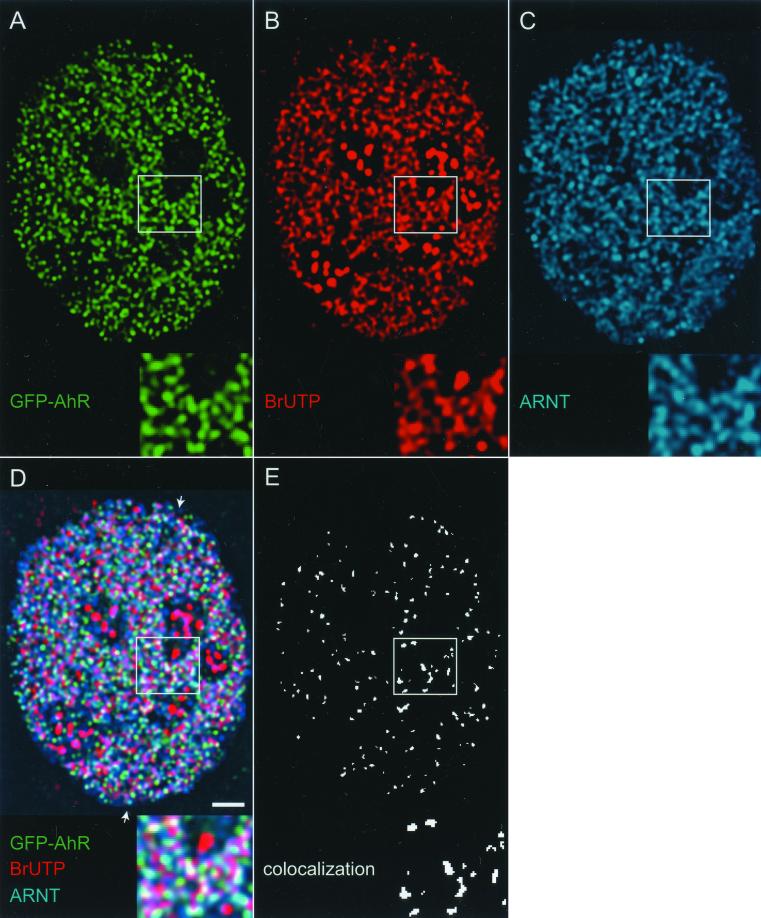
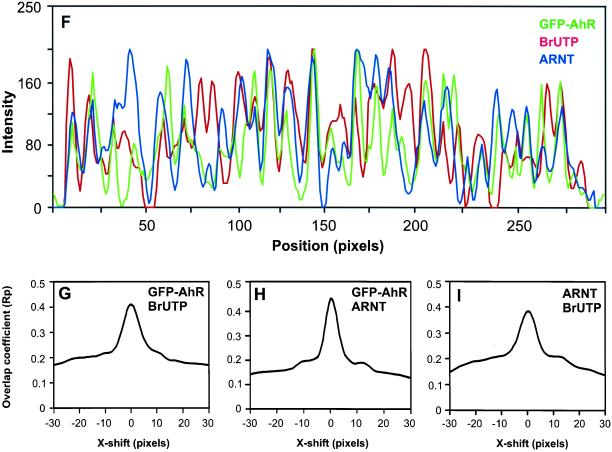
Sites of active transcription contain both AhR and ARNT. AhR-deficient cells expressing GFP-AhR were treated for 1 h with 10 nM TCDD, and nascent RNA was labeled in situ by BrUTP incorporation. Cells were fixed and nascent RNA and endogenous ARNT were detected using anti-BrU and anti-ARNT antibodies. The distribution of GFP-AhR, ARNT and active transcription sites was visualized by deconvolution microscopy as described in MATERIALS AND METHODS (A–C). Single optical section from the middle of cell is shown. In the triple overlay (D), beige-yellow indicates colocalizations. (E) All the pixels in image (D) that contain the three signals simultaneously. Areas marked by a rectangle are enlarged and shown as insets. The arrows point to the position of the linescan (F). In the linescan, the fluorescence intensity peaks for GFP-AhR, endogenous ARNT, and nascent RNA frequently coincided, indicating the presence of AhR and ARNT at the same transcription sites. CCF analyses of all three distributions demonstrated positive correlation peaks around ΔX = 0, indicating nonrandom colocalizations (G–I). Bar, 2 μm.
Online Supplemental Material
Cross-Correlation Analyses of Randomly and Positively Associated Distributions.
As negative and positive controls of cross-correlation analyses, AhR-deficient cells transiently expressing GFP-AhR were treated for 1 h with 10 nM TCDD. Cells were fixed and nuclear mitotic apparatus protein (NuMa) was detected using a specific antibody (B). GFP-AhR was detected using an anti-AhR antibody and either a Cy-5- (D) or a Texas Red-conjugated (E) secondary antibody. GFP-AhR and NuMa distributions were visualized by deconvolution microscopy as described in MATERIALS AND METHODS. Single optical sections from the middle of cells are shown. In the overlays, yellow-orange indicates colocalizations (C and F). The arrows point to the positions of linescans. Areas marked by a rectangle are enlarged and shown as insets. Linescan and CCF analyses of GFP-AhR and NuMa distributions (G and I) or AhR (green, Cy-5–conjugated secondary antibody) and AhR (red, Texas Red-conjugated secondary antibody) distributions (H and J) are shown. NuMa did not colocalize with GFP-AhR, and the nuclear distributions of GFP-AhR and NuMa were associated randomly. In contrast, complete colocalization was observed between the two AhR distributions and two distributions were highly positively correlated (bars, 2 μm). These results demonstrated that transcription-unrelated nuclear protein, NuMa associate with AhR randomly, suggesting that the observed association of AhR with active transcription sites is not fortuitous.
RESULTS
Intracellular Localization of Endogenous AhR and ARNT
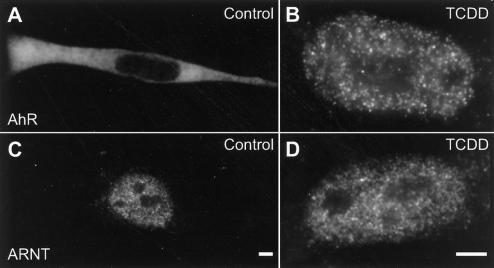
We examined the intracellular localization of endogenous AhR and endogenous ARNT in wild-type Hepa-1 cells by indirect immunofluorescence microscopy with anti-AhR and anti-ARNT antibodies. In wild-type Hepa-1 cells, endogenous AhR is diffusely distributed in the cytoplasm in the absence of TCDD (Figure 1A). After TCDD treatment, endogenous AhR translocated almost completely to the nucleus and distributed in multiple bright foci in addition to a diffuse nucleoplasmic background (Figure 1B). In contrast, endogenous ARNT localized to the nucleus in numerous small foci both in the absence and in the presence of ligand (Figure 1, C and D).
Figure 1.
Intracellular distribution of endogenous AhR and endogenous ARNT. Wild-type Hepa-1 cells were treated for 1 h with either DMSO as a control (A and C) or 10 nM TCDD (B and D). Cells were fixed and endogenous AhR and endogenous ARNT were detected by indirect immunofluorescence microscopy by using anti-AhR (A and B) or anti-ARNT (C and D) antibodies. After TCDD treatment, endogenous AhR translocated to the nucleus and localized in multiple bright foci. Endogenous ARNT was distributed in multiple intranuclear bright foci independent of TCDD treatment. Bars, 2 μm.
Characterization and Intracellular Localization of GFP-AhR
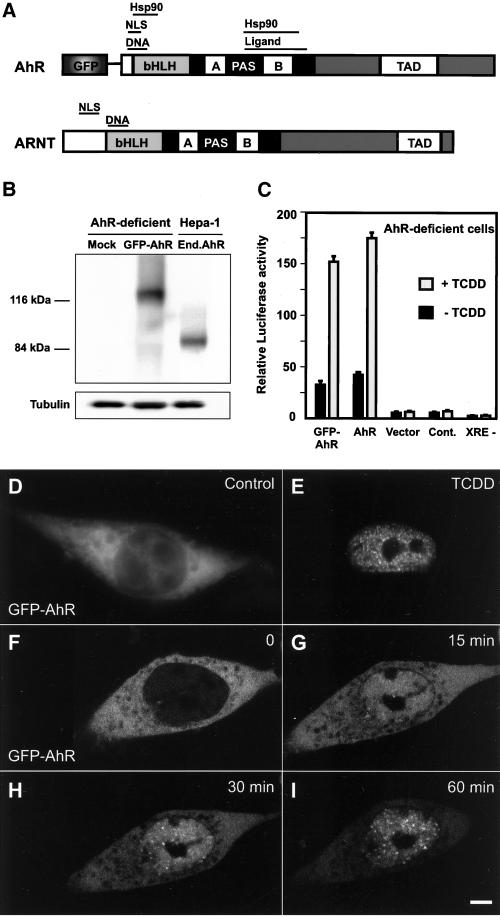
To probe the behavior of AhR/ARNT complex in living cells, the GFP was fused in-frame to the amino terminus of AhR (Figure 2A). We first checked the expression of the GFP-AhR fusion and compared it with the expression of endogenous AhR. AhR-deficient cells were transiently transfected with GFP-AhR and pCMV-IL2. The transfected cell population was isolated by sorting with anti-IL2–coated magnetic beads, and whole cell extracts from AhR-deficient and wild type Hepa-1 cells were analyzed by Western blotting with anti-AhR antibody. AhR-deficient cells are derived from wild-type Hepa-1 cells and have <10% of wild-type AhR levels (Figure 2B; Legraverend et al., 1982). GFP-AhR was expressed as a 117-kDa protein (Figure 2B; 90 kDa for mouse AhR and 27 kDa for GFP). The expression level of GFP-AhR in AhR-deficient cells was similar to the expression level of endogenous AhR in wild-type Hepa-1 cells (Figure 2B). Expression of GFP-AhR fusion was also confirmed by a monoclonal anti-GFP antibody (our unpublished data). We tested the functional activity of GFP-AhR in vivo by cotransfection into the AhR-deficient cells with a reporter gene containing the P450 1A1 promoter and upstream regulatory sequences. P450 1A1 is the most thoroughly studied target gene of the AhR/ARNT transcription factor complex (Whitlock, 1999). GFP-AhR activated the reporter gene transcription approximately fivefold in a TCDD-dependent manner. This activation was similar to that observed with untagged AhR (Figure 2C). In contrast, expression of GFP alone did not activate transcription.
Figure 2.
Characterization and intracellular distribution of the GFP-AhR fusion protein. (A) Schematic representation of AhR and ARNT. TAD, transactivation domain; NLS, nuclear localization signal; DNA, XRE binding domain; Hsp90, hsp90 interaction domain; Ligand, ligand interaction domain. (B) Immunoblot analysis of GFP-AhR. AhR-deficient cells were mock transfected or transfected with GFP-AhR and pCMV-IL2. Transfected population of cells was isolated by sorting with anti-IL2–coated magnetic beads. Expression of GFP-AhR, endogenous AhR, and endogenous tubulin (loading control) was detected using anti-AhR and anti-tubulin antibodies. GFP-AhR was expressed as a 117-kDa protein and the expression level of GFP-AhR in AhR-deficient cells was similar to the expression level of endogenous AhR in wild-type Hepa-1 cells. (C) Functional activity of GFP-AhR. P1A1–4X1-LUC reporter, and PCMVβgal (internal control) was cotransfected with either GFP-AhR or untagged AhR or empty GFP expression vectors into AhR-deficient cells. As a control, only the reporter gene and PCMVβgal were transfected. Mutated form of the reporter gene (XRE-) was cotransfected with GFP-AhR and PCMVβgal. The cells were treated for 1 h with DMSO as a control (−TCDD) or with 10 nM TCDD and reporter gene activity was assayed and normalized to β-galactosidase activity. The graph shows a representative of four independent experiments. (D and E) AhR-deficient cells were transfected with GFP-AhR, treated for 1 h with either DMSO as a control (D) or 10 nM TCDD (E), fixed and GFP-AhR fluorescence was observed by epifluorescence microscopy. (F–I) Time-lapse confocal microscopy of transiently expressed GFP-AhR in living AhR-deficient cells. Images were collected before (F), 15 min (G), 30 min (H), and 60 min (I) after addition of TCDD. GFP-AhR rapidly translocated to the nucleus and localized in multiple foci after TCDD treatment. Bars, 2 μm.
To visualize the intracellular distribution of GFP-AhR, AhR-deficient cells were transfected and treated with either DMSO as a control or TCDD. The cells were fixed and GFP-AhR fluorescence was detected by epifluorescence microscopy. Transiently expressed GFP-AhR behaved identically to endogenous AhR both in the absence or presence of TCDD (compare Figure 2, D and E, with 1, A and B). Identical results were observed using HeLa cells or using different cell fixation methods (our unpublished data). In AhR-deficient cells, endogenous AhR was undetectable by indirect immunofluorescence with or without TCDD treatment (our unpublished data). To determine the kinetics of translocation of GFP-AhR in living cells, we carried out time-lapse confocal microscopy on AhR-deficient cells transiently expressing GFP-AhR. TCDD-dependent rapid nuclear translocation and the formation of AhR foci were observed as early as 15 min after the treatment with TCDD (Figure 2G). After 60 min of TCDD treatment, GFP-AhR predominantly localized to the nucleus and accumulated in distinct foci (Figure 2I). No nuclear translocation of GFP-AhR or endogenous AhR occurred at 4°C, consistent with the thesis that the ligand-dependent activation and the nuclear translocation of AhR are temperature-dependent processes (our unpublished data; Pollenz et al., 1994; Hankinson, 1995).
Inhibition of Transcription Prevents Formation of GFP-AhR Foci
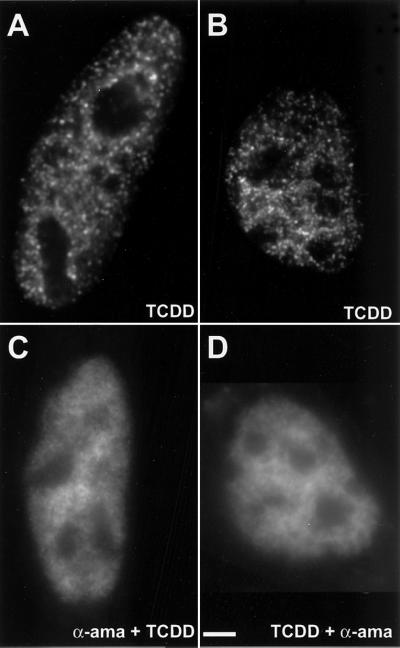
Because both the AhR and the ARNT localized in intranuclear foci reminiscent of transcription sites, we next determined whether the intranuclear foci were sites of transcription. AhR-deficient cells transiently expressing GFP-AhR were first treated with the specific inhibitor of RNA polymerase II, α-amanitin at 30 μg/ml, and then with TCDD (Figure 3C) or were first treated with TCDD and then with α-amanitin at 30 μg/ml (Figure 3D). In cells imaged after α-amanitin treatment, no intranuclear foci were observed, although the intranuclear diffuse distribution could still be observed (Figure 3, C and D). This result suggests that AhR foci are linked to RNA polymerase II transcription and the foci might correspond to the sites of transcription. Identical results were obtained using actinomycin D at 5 μg/ml for 1 h (our unpublished data).
Figure 3.
Inhibition of transcription by α-amanitin prevents the formation of AhR foci. AhR-deficient cells expressing GFP-AhR were treated for 1 h with 10 nM TCDD (A and B) or treated for 3 h first with α-amanitin at 30 μg/ml and then for an additional 1 h with 10 nM TCDD (C) or treated for 1 h first with 10 nM TCDD and then for an additional 3 h with α-amanitin at 30 μg/ml (D). The cells were fixed, and GFP-AhR fluorescence was observed by epifluorescence microscopy. Bar, 2 μm.
Recruitment of AhR to Active Transcription Sites
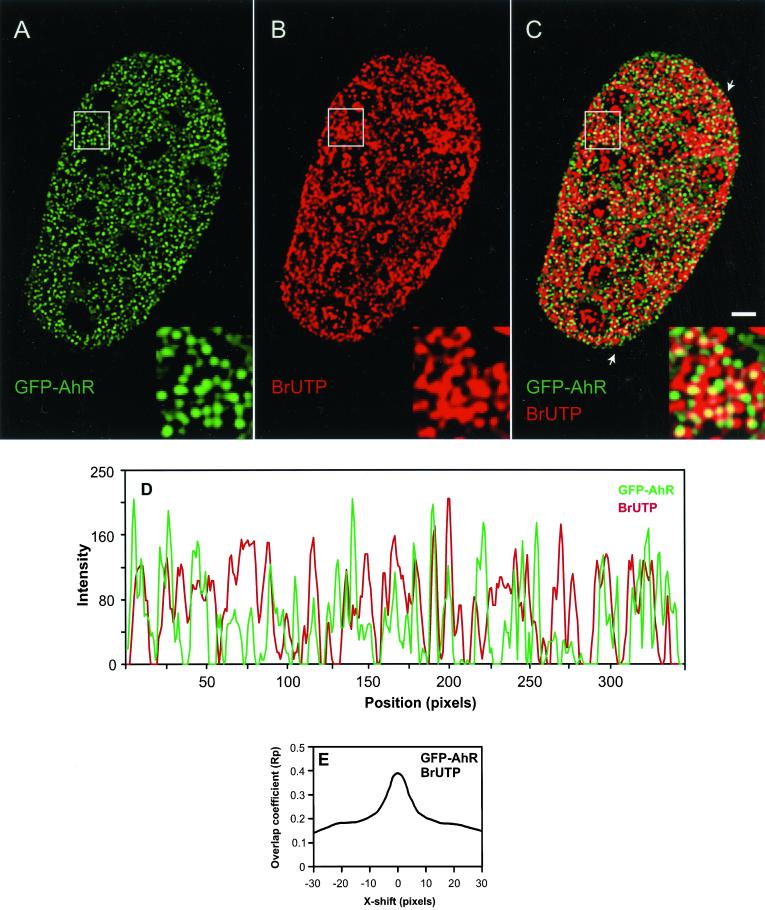
To test more directly whether the spatial distribution of AhR in the nucleus is related to the spatial distribution of the nascent RNA, we labeled the nascent RNA in situ by using BrUTP incorporation. Incorporation of BrUTP into newly transcribed RNA permits the detection of transcription initiation sites, i.e., RNA bound to RNA polymerase engaged in transcription (Jackson et al., 1993; Wansink et al., 1993). AhR-deficient cells transiently expressing GFP-AhR were treated with TCDD, fixed, and nascent transcripts were detected using anti-BrU antibody. The distribution of GFP-AhR and active transcription sites was visualized by deconvolution microscopy (Figure 4, A and B). Considerable colocalization was detected between GFP-AhR and active transcription sites (Figure 4C). The presence or absence of AhR at the active transcription sites was verified by linescan analyses. A representative linescan in Figure 4D demonstrates that some but not all fluorescence intensity peaks from both signals coincided. We used CCF analysis to test whether the spatial distributions of GFP-AhR and the active transcription sites are correlated. CCF is a method to determine whether the spatial distributions of two signals are correlated in random or nonrandom manner (van Steensel et al., 1996; Grande et al., 1997). CCF analysis showed a peak and a maximum Rp value around ΔX = 0, indicating that observed colocalizations between GFP-AhR and the active transcription sites were positively correlated and nonrandom (Figure 4E, see “Online Supplemental Material”). Quantitation of the colocalization percentages as described in MATERIALS AND METHODS showed that 35% of AhR foci colocalized with the sites of active transcription, suggesting that only a subpopulation of AhR foci represent active transcription sites (Table 1).
Figure 4.
AhR is recruited to the sites of active transcription. AhR-deficient cells were transfected with GFP-AhR and treated for 1 h with 10 nM TCDD. Nascent RNA was labeled in situ by BrUTP incorporation. The cells were fixed, and nascent RNA was detected using anti-BrU antibody. GFP-AhR distribution and active transcription sites were visualized by deconvolution microscopy as described in MATERIALS AND METHODS (A–C). Single optical section from the middle of cell is shown. In the overlay (C), yellow indicates colocalizations. Areas marked by a rectangle are enlarged and shown as insets. The arrows point to the position of the linescan (D). In the linescan, the fluorescence intensity peaks for GFP-AhR and nascent RNA frequently coincided, indicating the recruitment of AhR to active transcription sites. In CCF analysis (E), a maximum Rp value and a peak around ΔX = 0 indicated a positively correlated, nonrandom colocalization between the distributions of GFP-AhR and active transcription sites. Bar, 2 μm.
AhR Associates with ARNT/HIF-1β at Transcription Sites
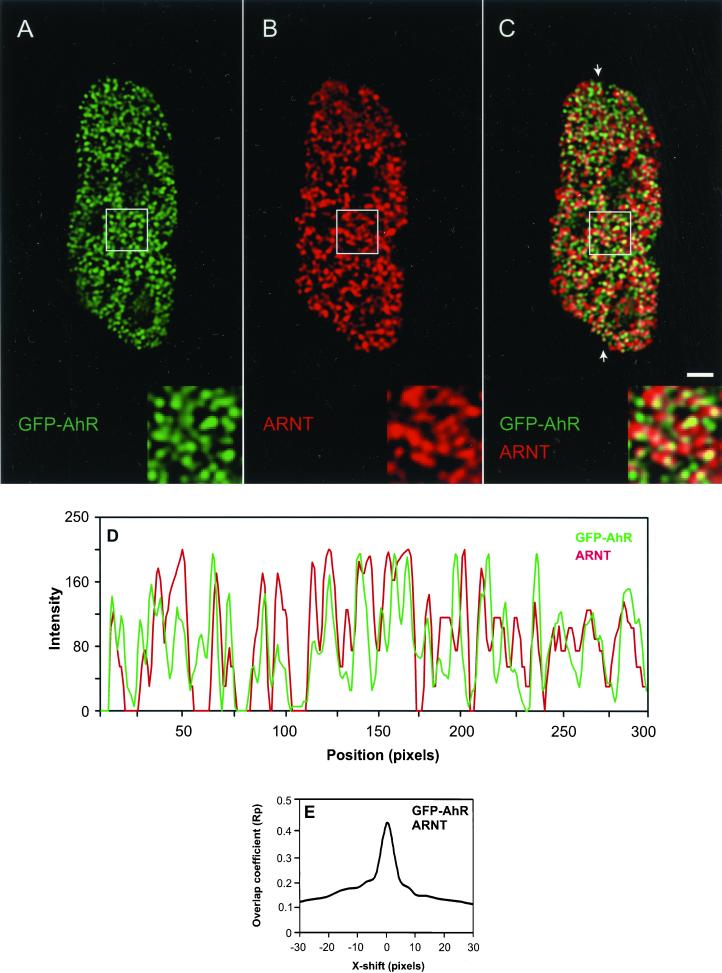
Although coimmunoprecipitation and footprinting assays have indicated that AhR forms a complex with ARNT and that AhR/ARNT heterodimeric complex binds to DNA, no in vivo evidence for their simultaneous presence at transcription sites has been provided (Probst et al., 1993; Ko et al., 1996). To probe the association of AhR with ARNT at transcription sites in vivo, we examined the intranuclear distributions of both proteins by using indirect immunofluorescence combined with deconvolution microscopy. AhR-deficient cells transiently expressing GFP-AhR were treated with TCDD, fixed, and endogenous ARNT was detected using anti-ARNT antibody (Figure 5, A and B). The overlay image shows that AhR significantly colocalized with ARNT (Figure 5C). This result was supported by linescans and CCF analyses. A representative linescan indicates the overlap of some but not all fluorescence intensity peaks from both signals (Figure 5D). The CCF graph shows a maximum Rp value and a peak around ΔX = 0, indicating a positively correlated, nonrandom colocalization between two distributions (Figure 5E). Quantitation of the colocalization percentages as described in MATERIALS AND METHODS showed that 38% of AhR distribution colocalized with ARNT distribution (Table 1). This observation suggests that a subpopulation of AhR associates with ARNT.
Figure 5.
AhR associates with ARNT/HIF-1β. GFP-AhR–expressing AhR-deficient cells were treated for 1 h with 10 nM TCDD. Cells were fixed and endogenous ARNT was detected using anti-ARNT antibody. GFP-AhR and ARNT distributions were visualized by deconvolution microscopy (A–C). Single optical section from the middle of cell is shown. In the overlay (C), yellow indicates colocalizations. Areas marked by a rectangle are enlarged and shown as insets. The arrows point to the position of the linescan (D). The fluorescence intensity peaks for GFP-AhR and endogenous ARNT frequently coincided in the linescan, indicating the association of AhR with ARNT. CCF analysis of GFP-AhR and ARNT distributions showed a maximum Rp value and a peak around ΔX = 0, indicating a positively correlated, nonrandom colocalization (E). Bar, 2 μm.
The pairwise partial colocalization of AhR with transcription sites and AhR with ARNT suggested the possibility that AhR and ARNT colocalize at transcription sites. To test this, we analyzed the intranuclear distributions of AhR, ARNT, and transcription sites simultaneously. AhR-deficient cells transiently expressing GFP-AhR were treated with TCDD, and nascent RNA was labeled by BrUTP incorporation. The cells were processed for indirect immunofluorescence combined with deconvolution microscopy by using anti-BrU and anti-ARNT antibodies (Figure 6, A–C). The overlay and colocalization images show that transcription sites colocalized with GFP-AhR and ARNT (Figure 6D, beige-yellow regions and E). The presence of GFP-AhR and ARNT at the same transcription site was confirmed by linescans. A representative linescan shows that fluorescent intensity peaks from the three signals frequently coincided (Figure 6F). CCF analyses of all three distributions with each other indicated positive correlation peaks around ΔX = 0 (Figure 6, G–I). Quantitative analysis of 45 randomly selected nuclei by randomly generated linescans showed that when AhR is recruited to transcription sites, ARNT is present at the same transcription site 86.5% of the time (SD = 3.5, SEM = 0.73; data derived from four independent experiments). These results indicate that AhR associates with ARNT at active transcription sites. Quantitation of the colocalization percentages in images such as Figure 6E as described in MATERIALS AND METHODS showed that 31 ± 4% (mean ± SD) of AhR is at active transcription sites with ARNT.
ARNT Is Necessary and Sufficient for Recruitment of Endogenous AhR to Active Transcription Sites
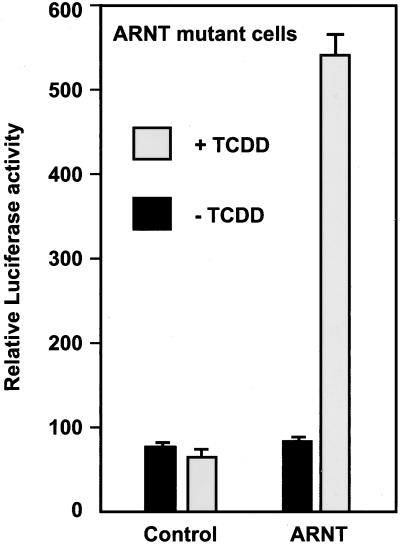
The presence of ARNT with AhR at transcription sites prompted us to further analyze the in vivo role of ARNT in recruiting AhR to transcription sites. To this end, we used a mutant cell line that lacks ARNT/HIF-1β protein (Legraverend et al., 1982). These cells do not support transcription of AhR target genes (Ko et al., 1996). A P450 1A1-luciferase reporter was cotransfected with either an empty or an ARNT expression vector into the ARNT mutant cells. The cells were treated with either DMSO as a control or TCDD, and the reporter gene activity was assayed. Exogenous ARNT expression resulted in sevenfold transactivation from the reporter gene consistent with the idea that AhR-dependent transcription of a target gene can be rescued by the overexpression of ARNT in these cells (Figure 7, ARNT; Li et al., 1994). In contrast, the empty expression vector had no effect (Figure 7, control).
Figure 7.
Expression of ARNT is necessary for AhR-dependent transcriptional activation. P1A1–4X1-LUC reporter and PCMVβgal (internal control) were cotransfected into ARNT mutant cells either with an empty vector (control) or an ARNT expression vector (ARNT). The cells were treated for 1 h with DMSO as a control (−TCDD) or with 10 nM TCDD, and the reporter gene activity was assayed and normalized to β-galactosidase activity. The graph shows a representative of four independent experiments.
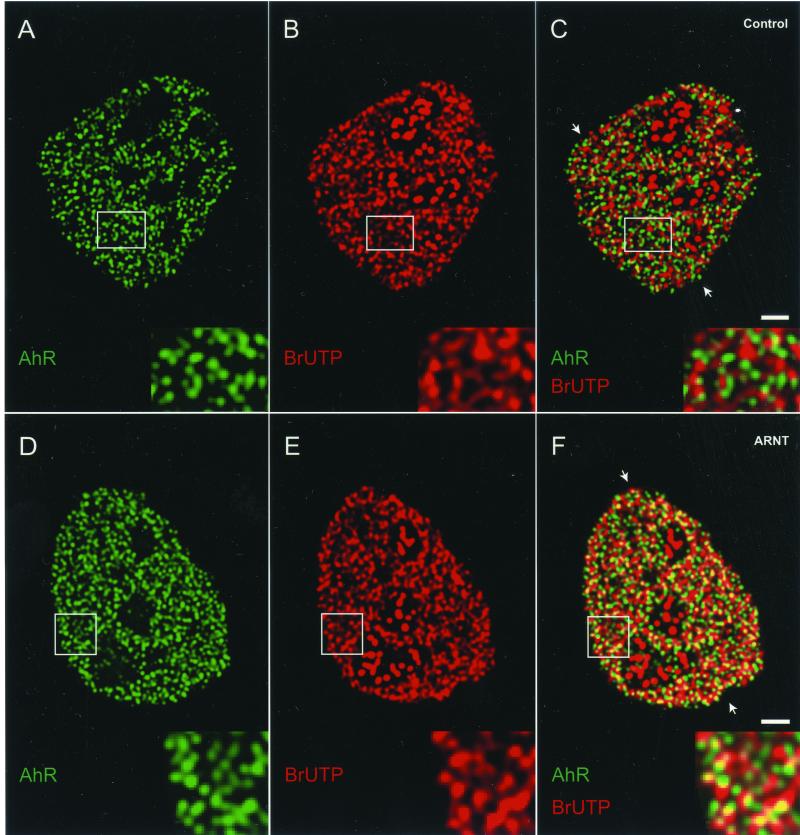
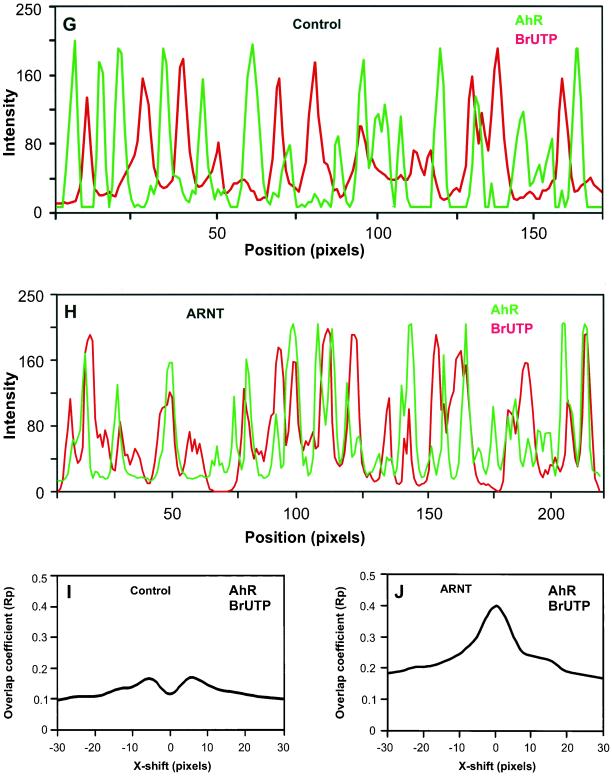
In cells lacking ARNT, dual-immunolabeling revealed that endogenous AhR was absent from transcription sites (Figure 8C). The fluorescence intensity peaks from both signals were clearly separated in a representative linescan, suggesting that AhR is not recruited to the active transcription sites (Figure 8G). Furthermore, the CCF analysis showed a strong decrease around ΔX = 0, indicating that the majority of endogenous AhR and nascent RNA distributions are mutually exclusive (Figure 8I). These results demonstrate that ARNT is necessary for the recruitment of AhR to transcription sites.
Figure 8.
ARNT is necessary and sufficient for the recruitment of AhR to active transcription sites. ARNT mutant cells were either not transfected (A–C) or transfected with ARNT expression vector (D–F). Cells were treated for 1 h with 10 nM TCDD, and nascent RNA was labeled by BrUTP incorporation. Cells were fixed and endogenous AhR (A and D) and nascent RNA transcripts (B and E) were detected by indirect immunofluorescence combined with deconvolution microscopy by using anti-AhR and anti-BrU antibodies. Single optical sections from the middle of cells are shown. In the overlays (C and F), yellow indicates colocalizations. Areas marked by a rectangle are enlarged and shown as insets. The arrows point to the positions of the linescans. In contrast to the linescan in G, the linescan in H showed frequent overlaps between the fluorescence intensity peaks for endogenous AhR and nascent RNA, indicating that ARNT recruits AhR to active transcription sites. CCF analyses of endogenous AhR and nascent RNA distributions showed a strong drop around ΔX = 0, indicating a mutual exclusion between two distributions (I). A maximum Rp value and a peak around ΔX = 0 indicated a positively correlated, nonrandom colocalization between two distributions (J). Bars, 2 μm.
In cells with transiently expressed ARNT (determined by the visualization of ARNT by using anti-ARNT antibody; our unpublished data), triple immunolabeling revealed a significant overlap between endogenous AhR and active transcription sites (Figure 8F). This conclusion was verified by linescans, demonstrating that some, but not all fluorescence intensity peaks from both signals frequently coincided, and by CCF analyses showing a positive correlation peak around ΔX = 0 resulting from a nonrandom colocalization between two distributions (Figure 8, H and J). These results show that reintroduction of ARNT into ARNT mutant cells restores the recruitment of endogenous AhR to transcription sites. Quantitation of the colocalization percentages as described in MATERIALS AND METHODS showed that in ARNT expressing cells, 36% of endogenous AhR distribution colocalized with active transcription sites (Table 1). This is similar to the percentage of GFP-AhR colocalization with active transcription sites in AhR-deficient, ARNT positive cells (Figure 4 and Table 1). In cells lacking ARNT, the percentage of colocalization between endogenous AhR and transcription sites was 10%, which is similar to the random colocalization of GFP-AhR with NuMa (online supplemental material and Table 1). From these results we conclude that ARNT/HIF-1β is necessary and sufficient for the recruitment of endogenous AhR to the sites of active transcription.
DISCUSSION
Using quantitative imaging methodology, we have found a strong spatial and functional relationship between the distribution of AhR/ARNT transcription factor complexes and active transcription sites. After ligand treatment, both the GFP-AhR and the endogenous AhR rapidly translocate to the nucleus and distribute in multiple bright foci (Figures 1 and 2). Furthermore, endogenous ARNT localizes to the nucleus in numerous small foci both in the absence and presence of a ligand (Figure 1).
Several lines of evidence suggest that the GFP-AhR fusion protein behaves identically to endogenous AhR. The level of GFP-AhR expression was very similar to the level of endogenous AhR expression (Figure 2B). Ligand- and GFP-AhR–dependent transactivation from the reporter gene in AhR-deficient cells (Figure 2C) was comparable with the ligand- and endogenous AhR-dependent transactivation in wild-type Hepa-1 cells (Li et al., 1994). Intracellular distribution characteristics of GFP-AhR followed the temporal and spatial distribution characteristics of endogenous AhR (Figures 1 and 2). Subpopulations of both GFP-AhR and endogenous AhR were recruited to the active transcription sites (Figures 4 and 8 and Table 1). Finally, in wild-type Hepa-1 cells transiently expressing GFP-AhR, GFP-AhR, and endogenous AhR distributions were colocalized (our unpublished observations), indicating that the localization of the GFP-labeled receptor correctly reflects the distribution of the endogenous protein.
The formation of intranuclear foci after ligand treatment is not unique to AhR. In the presence of a ligand, steroid hormone receptors such as estrogen, progesterone, and mineralocorticoid and glucocorticoid hormone receptors form nuclear foci (van Steensel et al., 1995; Fejes-Toth et al., 1998; Lim et al., 1999; Hager et al., 2000). Furthermore, BRG1, TFIIH, and p53 transcription factors and CBP/p300 coactivator have been shown to distribute in multiple foci throughout the nucleoplasm (Grande et al., 1997; Rubbi and Milner, 2000; von Mikecz et al., 2000). However, the relationship of these intranuclear foci to nuclear function, particularly transcription, has been elusive.
By immunofluorescence labeling and confocal microscopy, van Steensel et al. (1995) reported that hormone-activated glucocorticoid receptor is concentrated in a large number of clusters in the nucleoplasm, but found that these clusters did not significantly colocalize with RNA polymerase II clusters, or with domains containing the splicing factor SC-35. They concluded that most of the glucocorticoid receptor clusters are not directly involved in activation of transcription. In a more recent study (Grande et al., 1997) the spatial relationship between newly synthesized RNA and domains containing several proteins involved in transcription was examined. A high degree of colocalization between the RNA polymerase II and active transcription sites was observed, but no relationship was found between the distribution of the glucocorticoid receptor, Oct1 or E2F-1 and transcription sites.
In contrast to these reports, we find a strong correlation between the intranuclear AhR distribution and sites of active transcription, indicating that a significant fraction of AhR is involved in activation of transcription. The disparity between our findings with AhR and the previous glucocorticoid receptor results (van Steensel et al., 1995) could have several explanations. These are distinct transcription factors, and they may actually be organized in a different way in the nucleus. Alternatively, active glucocorticoid receptor sites of transcription may be too small to visualize by fluorescent microscopy, or the percentage of GR sites associated with active centers of transcription may be small.
Intranuclear GFP-AhR foci were sensitive to inhibition of transcription by α-amanitin (Figure 3) and actinomycin D (our unpublished observations). Based upon the nuclear distribution characteristics of AhR after ligand treatment (Figures 1 and 2) and during inhibition of transcription (Figure 3), we concluded that there are at least two populations of AhR proteins in the nucleus. One population is diffusely distributed throughout the nucleoplasm and the second population is distributed in multiple foci.
We also demonstrate that AhR is recruited to the sites of active transcription by using a transcription assay that labels the nascent RNA in situ with BrUTP incorporation (Jackson et al., 1993; Wansink et al., 1993). This assay has been used in many studies to visualize the transcription pattern in the nucleus (Hozak et al., 1994; Aoki et al., 1997; Fay et al., 1997; Huang et al., 1998). Short BrUTP incorporation periods, such as the 5-min incorporation period used in our study, permit the detection of transcription initiation sites. During a short incorporation period, the labeled nascent RNAs are not transported and not subject to RNA processing (Jackson et al., 1993; Wansink et al., 1993). In our labeling conditions, ∼1900 transcription sites per Hepa-1 cell nucleus were detected. This is in close agreement with previous reports (Iborra et al., 1996; Pombo and Cook, 1996). Labeling of transcription sites was sensitive to α-amanitin, suggesting that AhR is recruited most likely to the sites of transcription by RNA polymerase II.
To analyze quantitatively the intranuclear distributions of AhR, ARNT proteins, and transcription sites, we used linescans and CCF analyses (van Steensel et al., 1996; Grande et al., 1997). We find that subpopulations of AhR (35%) and ARNT (33%) are both targeted to the sites of active transcription (Figure 4 and Table 1). A fraction of AhR population (38%) also associates with ARNT (Figure 5 and Table 1), consistent with reports that AhR coimmunoprecipitates with ARNT (Probst et al., 1993). The in vivo association of AhR with ARNT at transcription sites (Figure 6) is consistent with the biochemical data suggesting that AhR heterodimerizes with ARNT, and AhR/ARNT heterodimeric complex binds to the regulatory regions of target genes and activates the transcription (Hankinson, 1995; Whitlock, 1999). Presently, we cannot assign a functional role to those AhR and ARNT sites that are not associated with active transcription sites in the nucleus. These sites may represent supply or storage sites from which AhR and ARNT can be recruited when necessary, or alternatively, may be involved in other transcription-related cellular processes.
In cells lacking ARNT expression, ligand- and AhR-dependent transcriptional activation from the P450 1A1 reporter gene required exogenous expression of ARNT protein (Figure 7). In the same cells, endogenous AhR was absent from active transcription sites (Figure 8). However, exogenous ARNT expression restored the recruitment of endogenous AhR to the active transcription sites (Figure 8). These results imply that ARNT is both necessary and sufficient for the recruitment of AhR to the active transcription sites. Taken together, our data support a model that after the addition of a ligand, AhR rapidly translocates to the nucleus and localizes in multiple foci with diffuse distribution. In the nucleoplasm, a subpopulation of AhR proteins is dynamically recruited by ARNT, possibly from a diffuse nuclear pool of AhR to specific nuclear domains with transcriptional activity.
Supplementary Material
ACKNOWLEDGMENTS
We thank Dr. O. Hankinson for providing pcDNAI/Neo/mARNT; Dr. D. Pasco for providing P1A1–4X1-LUC and P1A1-LUC; and Dr. F.J. Gonzalez for providing pCI/AhR expression vectors. We thank Dr. T. Karpova for suggestions on imaging. Imaging was carried out in the Fluorescence Imaging Facility, Laboratory of Receptor Biology and Gene Expression, National Cancer Institute.
Abbreviations used:
- AhR
aryl hydrocarbon (dioxin) receptor
- ARNT/HIF-1β
aryl hydrocarbon receptor nuclear translocator/hypoxia-inducible factor 1β
- bHLH/PAS
basic helix-loop-helix/Period-ARNT-Sim
- BrUTP
5-bromouridine 5′-triphosphate
- CCF
cross-correlation function
- DAPI
diamidino-phenylindole, dihydrochloride
- GFP
green fluorescence protein
- Rp
Pearson's correlation coefficient
- TCDD
2,3,7,8-tetrachlorodibenzo-p-dioxin
- XREs
xenobiotic response elements
Footnotes
DOI: 10.1091/mbc.02–01–0009.
REFERENCES
- Aoki F, Worrad DM, Schultz RM. Regulation of transcriptional activity during the first and second cell cycles in the preimplantation mouse embryo. Dev Biol. 1997;181:296–307. doi: 10.1006/dbio.1996.8466. [DOI] [PubMed] [Google Scholar]
- Burbach KM, Poland A, Bradfield CA. Cloning of the Ah-receptor cDNA reveals a distinctive ligand-activated transcription factor. Proc Natl Acad Sci USA. 1992;89:8185–8189. doi: 10.1073/pnas.89.17.8185. [DOI] [PMC free article] [PubMed] [Google Scholar]
- Carver LA, Bradfield CA. Ligand-dependent interaction of the aryl hydrocarbon receptor with a novel immunophilin homolog in vivo. J Biol Chem. 1997;272:11452–11456. doi: 10.1074/jbc.272.17.11452. [DOI] [PubMed] [Google Scholar]
- Crews ST. Control of cell lineage-specific development and transcription by bHLH-PAS proteins. Genes Dev. 1998;12:607–620. doi: 10.1101/gad.12.5.607. [DOI] [PubMed] [Google Scholar]
- Ema M, Sogawa K, Watanabe N, Chujoh Y, Matsushita N, Gotoh O, Funae Y, Fujii-Kuriyama Y. cDNA cloning and structure of mouse putative Ah receptor. Biochem Biophys Res Commun. 1992;184:246–253. doi: 10.1016/0006-291x(92)91185-s. [DOI] [PubMed] [Google Scholar]
- Fay FS, Taneja KL, Shenoy S, Lifshitz L, Singer RH. Quantitative digital analysis of diffuse and concentrated nuclear distributions of nascent transcripts, SC35 and poly(A) Exp Cell Res. 1997;231:27–37. doi: 10.1006/excr.1996.3460. [DOI] [PubMed] [Google Scholar]
- Fejes-Toth G, Pearce D, Naray FT. Subcellular localization of mineralocorticoid receptors in living cells: effects of receptor agonists and antagonists. Proc Natl Acad Sci USA. 1998;95:2973–2978. doi: 10.1073/pnas.95.6.2973. [DOI] [PMC free article] [PubMed] [Google Scholar]
- Fernandez-Salguero P, Pineau T, Hilbert DM, McPhail T, Lee SS, Kimura S, Nebert DW, Rudikoff S, Ward JM, Gonzalez FJ. Immune system impairment and hepatic fibrosis in mice lacking the dioxin-binding Ah receptor. Science. 1995;268:722–726. doi: 10.1126/science.7732381. [DOI] [PubMed] [Google Scholar]
- Gonzalez RC, Wintz P. Digital Image Processing. Cambridge, MA: Addison-Wesley Publication Company; 1987. [Google Scholar]
- Grande MA, van der Kraan I, de Jong L, van Driel R. Nuclear distribution of transcription factors in relation to sites of transcription and RNA polymerase II. J Cell Sci. 1997;110:1781–1791. doi: 10.1242/jcs.110.15.1781. [DOI] [PubMed] [Google Scholar]
- Gu YZ, Hogenesch JB, Bradfield CA. The PAS superfamily: sensors of environmental and developmental signals. Annu Rev Pharmacol Toxicol. 2000;40:519–561. doi: 10.1146/annurev.pharmtox.40.1.519. [DOI] [PubMed] [Google Scholar]
- Hager GL, Lim CS, Elbi C, Baumann CT. Trafficking of nuclear receptors in living cells. J Steroid Biochem Mol Biol. 2000;74:249–254. doi: 10.1016/s0960-0760(00)00100-x. [DOI] [PubMed] [Google Scholar]
- Hankinson O. The aryl hydrocarbon receptor complex. Annu Rev Pharmacol Toxicol. 1995;35:307–340. doi: 10.1146/annurev.pa.35.040195.001515. [DOI] [PubMed] [Google Scholar]
- Hoffman EC, Reyes H, Chu FF, Sander F, Conley LH, Brooks BA, Hankinson O. Cloning of a factor required for activity of the Ah (dioxin) receptor. Science. 1991;252:954–958. doi: 10.1126/science.1852076. [DOI] [PubMed] [Google Scholar]
- Hord NG, Perdew GH. Physicochemical and immunocytochemical analysis of the aryl hydrocarbon receptor nuclear translocator: characterization of two monoclonal antibodies to the aryl hydrocarbon receptor nuclear translocator. Mol Pharmacol. 1994;46:618–626. [PubMed] [Google Scholar]
- Hozak P, Cook PR, Schofer C, Mosgoller W, Wachtler F. Site of transcription of ribosomal RNA and intranucleolar structure in HeLa cells. J Cell Sci. 1994;107:639–648. doi: 10.1242/jcs.107.2.639. [DOI] [PubMed] [Google Scholar]
- Huang S, Deerinck TJ, Ellisman MH, Spector DL. The perinucleolar compartment and transcription. J Cell Biol. 1998;143:35–47. doi: 10.1083/jcb.143.1.35. [DOI] [PMC free article] [PubMed] [Google Scholar]
- Iborra FJ, Pombo A, Jackson DA, Cook PR. Active RNA polymerases are localized within discrete transcription “factories” in human nuclei. J Cell Sci. 1996;109:1427–1436. doi: 10.1242/jcs.109.6.1427. [DOI] [PubMed] [Google Scholar]
- Isaac DD, Andrew DJ. Tubulogenesis in Drosophila: a requirement for the trachealess gene product. Genes Dev. 1996;10:103–117. doi: 10.1101/gad.10.1.103. [DOI] [PubMed] [Google Scholar]
- Jackson DA, Hassan AB, Errington RJ, Cook PR. Visualization of focal sites of transcription within human nuclei. EMBO J. 1993;12:1059–1065. doi: 10.1002/j.1460-2075.1993.tb05747.x. [DOI] [PMC free article] [PubMed] [Google Scholar]
- Kamei Y, et al. A CBP integrator complex mediates transcriptional activation and AP-1 inhibition by nuclear receptors. Cell. 1996;85:403–414. doi: 10.1016/s0092-8674(00)81118-6. [DOI] [PubMed] [Google Scholar]
- King DP, et al. Positional cloning of the mouse circadian clock gene. Cell. 1997;89:641–653. doi: 10.1016/s0092-8674(00)80245-7. [DOI] [PMC free article] [PubMed] [Google Scholar]
- Ko HP, Okino ST, Ma Q, Whitlock JPJ. Dioxin-induced CYP1A1 transcription in vivo: the aromatic hydrocarbon receptor mediates transactivation, enhancer-promoter communication, and changes in chromatin structure. Mol Cell Biol. 1996;16:430–436. doi: 10.1128/mcb.16.1.430. [DOI] [PMC free article] [PubMed] [Google Scholar]
- Kolluri SK, Weiss C, Koff A, Gottlicher M. p27(Kip1) induction and inhibition of proliferation by the intracellular Ah receptor in developing thymus and hepatoma cells. Genes Dev. 1999;13:1742–1753. doi: 10.1101/gad.13.13.1742. [DOI] [PMC free article] [PubMed] [Google Scholar]
- Legraverend C, Hannah RR, Eisen HJ, Owens IS, Nebert DW, Hankinson O. Regulatory gene product of the Ah locus. Characterization of receptor mutants among mouse hepatoma clones. J Biol Chem. 1982;257:6402–6407. [PubMed] [Google Scholar]
- Li H, Dong L, Whitlock JPJ. Transcriptional activation function of the mouse Ah receptor nuclear translocator. J Biol Chem. 1994;269:28098–28105. [PubMed] [Google Scholar]
- Lim CS, Baumann CT, Htun H, Xian W, Irie M, Smith CL, Hager GL. Differential localization and activity of the A- and B-forms of the human progesterone receptor using green fluorescent protein chimeras. Mol Endocrinol. 1999;13:366–375. doi: 10.1210/mend.13.3.0247. [DOI] [PubMed] [Google Scholar]
- Ma Q, Whitlock JPJ. The aromatic hydrocarbon receptor modulates the Hepa 1c1c7 cell cycle and differentiated state independently of dioxin. Mol Cell Biol. 1996;16:2144–2150. doi: 10.1128/mcb.16.5.2144. [DOI] [PMC free article] [PubMed] [Google Scholar]
- Maltepe E, Schmidt JV, Baunoch D, Bradfield CA, Simon MC. Abnormal angiogenesis and responses to glucose and oxygen deprivation in mice lacking the protein ARNT. Nature. 1997;386:403–407. doi: 10.1038/386403a0. [DOI] [PubMed] [Google Scholar]
- Meyer BK, Pray-Grant MG, Vanden Heuvel JP, Perdew GH. Hepatitis B virus X-associated protein 2 is a subunit of the unliganded aryl hydrocarbon receptor core complex and exhibits transcriptional enhancer activity. Mol Cell Biol. 1998;18:978–988. doi: 10.1128/mcb.18.2.978. [DOI] [PMC free article] [PubMed] [Google Scholar]
- Misteli T, Spector DL. Serine/threonine phosphatase 1 modulates the subnuclear distribution of pre-mRNA splicing factors. Mol Biol Cell. 1996;7:1559–1572. doi: 10.1091/mbc.7.10.1559. [DOI] [PMC free article] [PubMed] [Google Scholar]
- Nambu JR, Lewis JO, Wharton KAJ, Crews ST. The Drosophila single-minded gene encodes a helix-loop-helix protein that acts as a master regulator of CNS midline development. Cell. 1991;67:1157–1167. doi: 10.1016/0092-8674(91)90292-7. [DOI] [PubMed] [Google Scholar]
- Pollenz RS, Sattler CA, Poland A. The aryl hydrocarbon receptor and aryl hydrocarbon receptor nuclear translocator protein show distinct subcellular localizations in Hepa 1c1c7 cells by immunofluorescence microscopy. Mol Pharmacol. 1994;45:428–438. [PubMed] [Google Scholar]
- Pombo A, Cook PR. The localization of sites containing nascent RNA and splicing factors. Exp Cell Res. 1996;229:201–203. doi: 10.1006/excr.1996.0360. [DOI] [PubMed] [Google Scholar]
- Probst MR, Reisz-Porszasz S, Agbunag RV, Ong MS, Hankinson O. Role of the aryl hydrocarbon receptor nuclear translocator protein in aryl hydrocarbon (dioxin) receptor action. Mol Pharmacol. 1993;44:511–518. [PubMed] [Google Scholar]
- Reisz-Porszasz S, Probst MR, Fukunaga BN, Hankinson O. Identification of functional domains of the aryl hydrocarbon receptor nuclear translocator protein (ARNT) Mol Cell Biol. 1994;14:6075–6086. doi: 10.1128/mcb.14.9.6075. [DOI] [PMC free article] [PubMed] [Google Scholar]
- Rowlands JC, Gustafsson JA. Aryl hydrocarbon receptor-mediated signal transduction. Crit Rev Toxicol. 1997;27:109–134. doi: 10.3109/10408449709021615. [DOI] [PubMed] [Google Scholar]
- Rubbi CP, Milner J. Non-activated p53 co-localizes with sites of transcription within both the nucleoplasm and the nucleolus. Oncogene. 2000;19:85–96. doi: 10.1038/sj.onc.1203378. [DOI] [PubMed] [Google Scholar]
- Schmidt JV, Su GH, Reddy JK, Simon MC, Bradfield CA. Characterization of a murine Ahr null allele: involvement of the Ah receptor in hepatic growth and development. Proc Natl Acad Sci USA. 1996;93:6731–6736. doi: 10.1073/pnas.93.13.6731. [DOI] [PMC free article] [PubMed] [Google Scholar]
- Shimizu Y, Nakatsuru Y, Ichinose M, Takahashi Y, Kume H, Mimura J, Fujii-Kuriyama Y, Ishikawa T. Benzo[a]pyrene carcinogenicity is lost in mice lacking the aryl hydrocarbon receptor. Proc Natl Acad Sci USA. 2000;97:779–782. doi: 10.1073/pnas.97.2.779. [DOI] [PMC free article] [PubMed] [Google Scholar]
- Sun ZS, Albrecht U, Zhuchenko O, Bailey J, Eichele G, Lee CC. RIGUI, a putative mammalian ortholog of the Drosophila period gene. Cell. 1997;90:1003–1011. doi: 10.1016/s0092-8674(00)80366-9. [DOI] [PubMed] [Google Scholar]
- Tei H, Okamura H, Shigeyoshi Y, Fukuhara C, Ozawa R, Hirose M, Sakaki Y. Circadian oscillation of a mammalian homologue of the Drosophila period gene. Nature. 1997;389:512–516. doi: 10.1038/39086. [DOI] [PubMed] [Google Scholar]
- van Steensel B, Brink M, van der Meulen K, van Binnendijk EP, Wansink DG, de Jong L, de Kloet ER, van Driel R. Localization of the glucocorticoid receptor in discrete clusters in the cell nucleus. J Cell Sci. 1995;108:3003–3011. doi: 10.1242/jcs.108.9.3003. [DOI] [PubMed] [Google Scholar]
- van Steensel B, van Binnendijk EP, Hornsby CD, van der Voort HT, Krozowski ZS, de Kloet ER, van Driel R. Partial colocalization of glucocorticoid and mineralocorticoid receptors in discrete compartments in nuclei of rat hippocampus neurons. J Cell Sci. 1996;109:787–792. doi: 10.1242/jcs.109.4.787. [DOI] [PubMed] [Google Scholar]
- Voegel JJ, Heine MJ, Zechel C, Chambon P, Gronemeyer H. TIF2, a 160 kDa transcriptional mediator for the ligand-dependent activation function AF-2 of nuclear receptors. EMBO J. 1996;15:3667–3675. [PMC free article] [PubMed] [Google Scholar]
- von Mikecz A, Zhang S, Montminy M, Tan EM, Hemmerich P. CREB-binding protein (CBP)/p300 and RNA polymerase II colocalize in transcriptionally active domains in the nucleus. J Cell Biol. 2000;150:265–273. doi: 10.1083/jcb.150.1.265. [DOI] [PMC free article] [PubMed] [Google Scholar]
- Wang GL, Jiang BH, Rue EA, Semenza GL. Hypoxia-inducible factor 1 is a basic-helix-loop-helix-PAS heterodimer regulated by cellular O2 tension. Proc Natl Acad Sci USA. 1995;92:5510–5514. doi: 10.1073/pnas.92.12.5510. [DOI] [PMC free article] [PubMed] [Google Scholar]
- Wansink DG, Motley AM, van Driel R, de Jong L. Cell Biology: A Laboratory Handbook. San Diego, CA: Academic Press; 1994. Fluorescent labeling of nascent RNA in the cell nucleus using 5-bromouridine 5′-triphosphate; pp. 368–374. [Google Scholar]
- Wansink DG, Schul W, van, d.K. I, van Steensel B, van Driel R, de Jong L. Fluorescent labeling of nascent RNA reveals transcription by RNA polymerase II in domains scattered throughout the nucleus. J Cell Biol. 1993;122:283–293. doi: 10.1083/jcb.122.2.283. [DOI] [PMC free article] [PubMed] [Google Scholar]
- Wei X, Somanathan S, Samarabandu J, Berezney R. Three-dimensional visualization of transcription sites and their association with splicing factor-rich nuclear speckles. J Cell Biol. 1999;146:543–558. doi: 10.1083/jcb.146.3.543. [DOI] [PMC free article] [PubMed] [Google Scholar]
- Whitlock JPJ. Induction of cytochrome P4501A1. Annu Rev Pharmacol Toxicol. 1999;39:103–25. doi: 10.1146/annurev.pharmtox.39.1.103. , 103–125. [DOI] [PubMed] [Google Scholar]
- Wilk R, Weizman I, Shilo BZ. trachealess encodes a bHLH-PAS protein that is an inducer of tracheal cell fates in Drosophila. Genes Dev. 1996;10:93–102. doi: 10.1101/gad.10.1.93. [DOI] [PubMed] [Google Scholar]
- Xu C, Siu CS, Pasco DS. DNA binding activity of the aryl hydrocarbon receptor is sensitive to redox changes in intact cells. Arch Biochem Biophys. 1998;358:149–156. doi: 10.1006/abbi.1998.0851. [DOI] [PubMed] [Google Scholar]
- Zeng C, et al. Intranuclear targeting of AML/CBFalpha regulatory factors to nuclear matrix-associated transcriptional domains. Proc Natl Acad Sci USA. 1998;95:1585–1589. doi: 10.1073/pnas.95.4.1585. [DOI] [PMC free article] [PubMed] [Google Scholar]
Associated Data
This section collects any data citations, data availability statements, or supplementary materials included in this article.


