

Abstract
The finding that exchange of tubulin subunits between tubulin dimers (α-β + α′β′ ↔ α′β + αβ′) does not occur in the absence of protein cofactors and GTP hydrolysis conflicts with the assumption that pure tubulin dimer and monomer are in rapid equilibrium. This assumption underlies the many physical chemical measurements of the Kd for dimer dissociation. To resolve this discrepancy we used surface plasmon resonance to determine the rate constant for dimer dissociation. The half-time for dissociation was ∼9.6 h with tubulin-GTP, 2.4 h with tubulin-GDP, and 1.3 h in the absence of nucleotide. A Kd equal to 10−11 M was calculated from the measured rate for dissociation and an estimated rate for association. Dimer dissociation was found to be reversible, and dimer formation does not require GTP hydrolysis or folding information from protein cofactors, because 0.2 μM tubulin-GDP incubated for 20 h was eluted as dimer when analyzed by size exclusion chromatography. Because 20 h corresponds to eight half-times for dissociation, only monomer would be present if dissociation were an irreversible reaction and if dimer formation required GTP or protein cofactors. Additional evidence for a 10−11 M Kd was obtained from gel exclusion chromatography studies of 0.02–2 nM tubulin-GDP. The slow dissociation of the tubulin dimer suggests that protein tubulin cofactors function to catalyze dimer dissociation, rather than dimer assembly. Assuming N-site-GTP dissociation is from monomer, our results agree with the 16-h half-time for N-site GTP in vitro and 33 h half-life for tubulin N-site-GTP in CHO cells.
INTRODUCTION
The discovery that correct folding of the tubulin dimer appears to require five protein cofactors as well as energy from GTP hydrolysis (Gao et al., 1993; Melki et al., 1996; Tian et al., 1997; Bhamidipati, et al., 2000; Hirata, et al., 1998; Martin, et al., 2000; Radcliffe et al., 2000) raises several important issues. Although the cofactors are present in both yeast and higher cells, Saccharomyces cervisiae are viable after four of the protein cofactors have been deleted (Hoyt et al., 1990, 1997; Stearns et al., 1990; Archer et al., 1998; Fleming et al., 2000). This suggests that a path exists for tubulin folding in cells that is uncatalyzed, beyond the traditional folding chaperonins. In another important finding Tian et al. (1999) reported no exchange of subunits between dimers (α-β + α′β′ ↔ α′β + αβ′) without protein cofactors C, D, and E, and GTP hydrolysis. This result suggests that the dissociation of the tubulin dimer is extremely slow and/or irreversible. If the former is true, the cofactors are catalysts for dimer dissociation/association; if dissociation is irreversible, presumably because the α- and β-monomers undergo rapid irreversible change in conformation, the factors serve to refold the protein. In either case, the requirement for protein cofactors for reversible dimer dissociation is important because physical chemical studies to measure the equilibrium constant for this reaction were done in the absence of cofactors. Therefore, if dimer dissociation is very slow and/or if dissociation is irreversible in the absence of protein cofactors, the physical chemical studies cannot have provided an accurate measurement of the stability of the tubulin dimer. We postulated that information about the role of the tubulin cofactors might be obtained from analysis of the equilibrium and rate for dimer dissociation.
We report here plasmon resonance studies that show that the rate of dissociation of the tubulin dimer is extremely slow, confirming the requirement for catalysis for dimer exchange (Tian et al., 1999). Also, gel filtration analysis revealed that tubulin-GDP remained dimeric in the absence of GTP for a time that greatly exceeded that required for dimer dissociation. This proved that dimer dissociation is reversible and that dimer synthesis does not require GTP hydrolysis or folding information provided by cofactors. Finally, the Kd for the dimer dissociation was found to be ∼10−11 M. This value is appreciably smaller than reported from several physical chemical studies, and it is suggested that the slowness of dimer dissociation may have influenced earlier measurements of the equilibrium.
MATERIALS AND METHODS
Beef brain tubulin was prepared as previously described (Zeeberg et al., 1980) or was purchased from Cytoskeleton Inc. (Denver, CO); the latter was provided at 10 mg/ml in buffer without glycerol (Catalogue No. T238). Identical results were obtained with protein obtained from the two sources as well as with tubulin provided by Andy Hunter (University of Washington). Biotin-tubulin was synthesized by a published procedure (Hyman et al., 1991), using a biotinylating agent with an extralong side arm (EZ-link sulfo-NHS-LC-LC-biotin, Cat No. 21338; Molecular Probes, Eugene, OR). The tubulin concentration during biotinylation was 45 μM, and the concentration of biotinylation agent was 2 mM for forming biotin-tubulin with 1–2 biotin/tubulin dimer (Hyman et al., 1991) and 28 μM for forming biotin-tubulin with a biotin stoichiometry equal to or <1/tubulin dimer. For reactions in which 0.06–2 μM tubulin was analyzed by gel exclusion chromatography the protein was freed of excess nucleotide, and GDP was introduced into the E-site by incubating 10 μM tubulin at 4°C for 10 min with 2 mM GDP. The so-formed tubulin-GDP was isolated by chromatography on a 0.5 × 5-cm Sephadex G-25 column; a control experiment with [α-32P]GTP added to the tubulin showed this quantitatively displaces GTP from the E-site. In reactions with nanomolar concentrations of tubulin the G-25 step was omitted, and the small amount of GTP that remained in the highly diluted protein was displaced from the E-site with 5 μM GDP. All reactions were at 25°C in either BRB buffer (80 mM Pipes, 1 mM EGTA, 1 mM MgCl2, pH 6.80), ,or in 10 mM sodium phosphate, 0.1 mM EGTA, 1 mM Mg (except where noted), pH 6.95.
Plasmon resonance sensor chips coated with strepavidin were purchased from Biacore Corp. (Piscataway, NJ) and were used with a Biacore Model 2000 plasmon resonance instrument. Chips were pretreated three times with NaOH/NaCl, as recommended by the manufacturer and were discarded after one or two rate measurement in each of the four flow cells. The flow rate was 2 μl/min, and the temperature was maintained at 25°C. Biotin-tubulin synthesized to contain a substoichiometric amount of biotin was bound to the chip surface by a flow of ∼0.07 μM biotin-tubulin at 2 μl/min for 10–20 min. This exposure of the strepavidin surface to biotin-tubulin gave a 1000 resonance unit (RU) signal, corresponding to binding of ∼1 ng of tubulin on the 1-mm2 surface of the flow cell (Canziani et al., 1999). The rate of binding to the surface was proportional to the biotin-tubulin concentration. Therefore, our finding that sequential flow through 2–4 flow cells resulted in a similar signal in each cell means only a very small fraction of the protein that passed through the flow cells was bound to the surface. A control experiment revealed that tubulin without biotin did not bind to the chip surface.
The slow rate of dissociation of the tubulin dimer resulted in several problems in data collection. During very slow reactions it was not uncommon to observe a signal increase that apparently resulted from binding of impurities in the buffer to the strepavidin surface. This was a nonspecific reaction because a similar signal change was observed with a surface that had not been treated with biotin-tubulin. In cases where there was evidence for nonspecific binding the signal from the control flow cell was subtracted from that from the tubulin-treated surface. Alternatively, the kinetics were analyzed from a Guggenheim plot (Guggenheim, 1926), which does not require an infinite-time value for determining the rate constant and, therefore, avoids nonspecific binding during very long buffer flow. A more serious problem in studies of very slow reactions was irreversible loss of the signal when bubbles became trapped in the flow cell. Although we were sometimes lucky so that data could be collected for many hours, two approaches were used to study very slow reactions. First, when bubble formation terminated the data collection, results were analyzed using the Guggenheim method. More frequently, it was anticipated that the reaction would be too slow to be followed to completion, and the initial rate (i.e., the rate for loss of the first 5–10% of the signal from the biotin-tubulin) was measured. This rate was compared with the faster initial rate after the washing fluid was changed to nucleotide-free buffer. The rate constant for the slower reaction was determined from the ratio of the initial rates before and after the buffer change. For example, in a study of tubulin-GTP the slope during the first 4000 s when GTP was present was 0.01536 (±0.00044) RU (i.e., resonance units)/s; the subsequent initial rate in the absence of nucleotide was 0.1023 (±0.004)/s. Because the rate constant for the latter reaction was of 15.6 × 10⁻⁵ s−1 (see below), the rate constant for dissociation of tubulin-GTP was (0.01536/0.1023) × 15.6 × 10−5 s−1 = 2.34 × 10⁻⁵ s−1. This constant agreed with that obtained in a reaction in which bubble formation did not prevent recording the rate during the entire reaction (see below).
Gel exclusion chromatography was performed with a Pharmacia Akta chromatography system, using an Amersham-Pharmacia Superdex HR 10/30 column (Piscataway, NJ), with a 200-μl injection loop, working at 5°C. The column flow rate was 0.45 ml/min, and the tubulin dimer eluted in ∼30 min. Fractions, 100 μl, were collected in glass tubes, and these were analyzed immediately after completing the chromatogram. In reactions with tubulin concentrations ≤2 nM the reaction mixture and the column buffer contained BSA at 10 mg/l to prevent nonspecific binding of tubulin to test tubes and to the column matrix. All reaction mixtures and the column buffer contained 5–20 μM GDP to saturate the tubulin-E-site. Reactions were incubated at 25°C and filtered through a 0.2-μm membrane immediately before chromatography. The yield of protein from the column was between 35 and 100% with 0.2 μM tubulin, which was the lowest concentration at which the column was monitored spectrophotometrically. The large range resulted from uncertainty in correcting for an upward drift in the baseline, especially in the region where the protein eluted; the 100% yield was calculated without a baseline correction. With a blotting assay (see below) the protein yield was between 100 and 200% with 0.04 nM tubulin. The large range apparently resulted from the cumulative error in estimating the baseline in the large number of fractions analyzed. Although signals were corrected for a “regional average” background, the signal was greater than zero for samples that were remote from the peaks; this is believed to account for the yield exceeding 100%.
Low concentrations of tubulin in column fractions were detected by a Western-blot-like assay. Column fractions were filtered through an Immobilon-P filter membrane ( Cat. No. IPVH00010; Millipore, Bedford, MA) with a dot blot apparatus. When the tubulin applied to the column was <2 nM an 80-μl aliquot was applied to each spot, corresponding to as little as 5 pg of tubulin in peak fractions; smaller samples were applied to the membrane when the tubulin applied to the column was more concentrated. The blotting membrane was next blocked by 1–18 h incubation in 5% bovine serum albumin (Cat. No. A-7906; Sigma, St. Louis, MO) in PBS. After three 10-minute washes in PBS, the membrane was incubated for 0.5–16 h with alkaline phosphatase–conjugated streptavidin (Cat no. 21324; Pierce Chemical, Rockford, IL) diluted 46,000-fold in PBS. After two 10-min washes with PBS and one with Tris-buffered saline the membrane was reacted with Amersham Pharmacia ECF reagent (Cat No. PRN5785), following the manufacturer's instructions. The resulting signal was detected and quantitated with a Phosphorimager, and peaks in the chromatogram were fit to a Gaussian curve with the IGOR Pro program (WaveMetrics Inc., Lake Oswego, OR). The blotting assay was linear with concentration; in two determinations the signal fit the equation: signal (×10−7) = 4.0 (± 0.3) (pmole tubulin spotted) − 0.1 (± 0.05); and 2.9 (±0.3) (pmole tubulin spotted) − 0.5 (±0.19). The signal from the immunoassay cannot be used for comparison of different experiments because this depended on the size of the sample blotted, the time the membrane was incubated with strepavidin-alkaline phosphatase, and the voltage setting for the Phosphorimager scan. Also, the signal continued to increase during the time between exposure of the membrane to the ECF reagent and when it was scanned.
RESULTS
Surface Plasmon Resonance
Surface plasmon resonance (SPR) is an optical phenomenon that measures changes in the solution concentration of molecules at a surface. This signal originates under conditions of total internal reflection and depends on the refractive index of solutions in contact with the surface. Because binding of proteins and ligands change the refractive index at the surface, the rate and equilibrium for binding of these to macromolecules previously bound to the surface can be measured.
The rate of dissociation of the tubulin dimer was determined with tubulin containing ∼1 biotin/tubulin dimer, bound to a strepavidin-coated gold surface. Although the biotinylated α- or β-subunit in the tubulin dimer is irreversibly bound, the other subunit without biotin is lost from the strepavidin surface when the intradimer bond breaks. Moreover, because the two tubulin subunits have identical mass, the change in refractive index that resulted from binding of the biotin-tubulin to the surface is expected to be halved when the dimer dissociates. Dissociation of the tubulin dimer was induced by flowing tubulin-free buffer at 2 μl/min through the 7-nl chamber containing the strepavidin surface.
Plasmon Resonance Studies of Tubulin Dissociation
Binding of biotin-tubulin to the strepavidin surface was linear with time and resulted in a signal increase of ∼1000 RU during a 4-min exposure to 0.1 μM biotin-tubulin at 2 μl/min (Figure 1A). The 1000 RU signal corresponds to binding of ∼1 ng of protein/mm2 surface. Dissociation of nonbiotinylated tubulin subunit during a subsequent flow of tubulin-free buffer was irreversible because the very small amount of tubulin monomer formed by dissociation was rapidly removed from the 70-nl reaction chamber by the 2000-nl buffer flow/min. Because the monomer concentration remained very low during the dissociation (ca. 0.5 ng dissociated over several hours), it was not rebound to the surface and the kinetics for dimer dissociation corresponded to an irreversible first-order process.
Figure 1.

Surface plasmon resonance analysis of biotin-tubulin binding to strepavidin and subsequent dimer dissociation as a result of dilution. (A) The plasmon resonance signal was increased by 954 RU during a 10-min flow of biotin-tubulin in Pi buffer with 12 mM Mg. The almost instantaneous 3000 RU signal change at the start and finish of the flow of the tubulin resulted from a difference in refractive index of the tubulin solution and the buffer. (B) Flow of tubulin- and nucleotide-free buffer resulted in a 445 RU signal decrease; the curve corresponds to a rate constant 14.72 × 10⁻⁵ s−1. A rate constant equal to 12.35 × 10⁻⁵ s−1 was determined from a Guggenheim plot of the data.
In a control experiment ∼50% of the signal that had been produced by biotin-tubulin was lost after a 1-min exposure to 50 mM NaOH in 1 M NaCl. The kinetics for the signal decrease could not be measured because this was obscured by the enormous signal increase that resulted from the large difference in the refractive index of the NaOH-NaCl compared with the reaction buffer. Although the first treatment with NaOH resulted in a 50% loss of the signal (typically 250-1000 RU), subsequent treatment resulted in a much smaller decrease of ∼50–75 RU; a similar decrease was observed with a surface that had not been exposed to biotin-tubulin. The 50% signal decrease produced by the initial wash with NaOH is believed to result primarily from loss of the tubulin monomer that did not contain biotin and was, therefore, bound to the strepavidin by its association with a biotinylated monomer. The smaller change produced by repeated injections of NaOH may have resulted from loss of strepavidin from the chip.
The plasmon resonance signal from bound biotin-tubulin was lost more slowly in buffer and ∼40% of the signal was lost in a first-order reaction when the strepavidin surface was treated with tubulin-free buffer (Figure 1B). The fact that the entire signal change can be fit to a single exponential indicates that dissociation occurs from a homogeneous species. More complicated kinetics are likely if the immobilized dimer had formed aggregates; here the kinetics for dissociation would include contributions from dimeric tubulin and from the various tubulin aggregates. Although the 1000 RU signal from tubulin binding corresponds to a relatively high concentration of immobilized tubulin (∼10 mg/ml), interaction between subunits would be sterically hindered by their attachment to strepavidin and to the dextran chain. With regard to the 40% decrease in signal, the smaller signal decrease with buffer compared with NaOH is believed to result because buffer does not remove strepavidin from the gold surface. Also, there are several reasons for observing a <50% decrease in signal when the tubulin dimer dissociates. First, a small fraction of the dimer dissociation occurs during the binding reaction. For example, for the reaction shown in Figure 1B in which the half-time for dimer dissociation was 60 min, ∼6% of the dimer dissociated during a 10-min flow of biotin-tubulin over the strepavidin surface. As a result, an only 47% signal decrease is expected for full dissociation (6% of the tubulin that contributes to the signal after 10 min of binding cannot contribute to a subsequent signal change as a result of dimer dissociation). Also, if the tubulin derivitization with a stoichiometric equivalence of biotinylating agent resulted in uptake of 1 biotin/dimer and this is randomly distributed, it is expected that 36.8% of dimers have no biotinylated subunit and 36.8% have one biotin. The remaining dimers have two (18.4%), three (6.32%), or four (1.53%) biotins. Assuming that only monomers contained in dimers with biotin in one of the two subunits can dissociate from the chip, the signal is expected to decrease by 29% when biotin-free monomer dissociates from dimer containing one biotin and by an additional 7.3% when biotin-free subunits dissociate from dimers with two biotins/dimer (with both biotins in the same monomer). The observed change in signal that results from exhaustive washing with buffer is in general agreement with this analysis.
The rate of dissociation of the tubulin dimer depended on the nucleotide in the E-site and was slowest when the site was saturated with GTP (Figure 2A). The intradimer bond is extremely stable with a half-time for dissociation of ∼10 h. The half-time decreased to ∼3 h with GDP in the E-site (Table 1) and 1.4 h when the E-site was free of nucleotide (Figure 2B). The intradimer bond in tubulin-GDP is stabilized by Mg because chelation with EDTA increased the dissociation rate (Table 1); note that the E-site contained GDP under these conditions because Mg is not required for GDP binding (Correia et al., 1987). The threefold greater dissociation rate with EDTA agrees with an earlier result showing that Mg chelation decreases dimer stability (Menendez et al.1998).
Figure 2.

Rate of dissociation of tubulin-GTP (A) and of tubulin without E-site nucleotide (B). (A) After biotin-tubulin-GTP in BRB buffer with 10 μM GTP was bound to produce a 2027 RU signal, the chip was washed with protein-free BRB buffer with 20 μM GTP. (A) The rate constant was 1.94 × 10⁻⁵ s−1 and the signal decrease was 1081 RU. (B) The initial binding of tubulin in BRB without nucleotide gave a signal increase of 1720 RU, and the change during flow of tubulin-free BRB buffer without nucleotide was 523 RU. It is expected that because of dimer dissociation 6% of the signal was lost during the binding (calculated by assuming that binding and dissociation are consecutive first-order processes).
Table 1.
Rate of tubulin dimer dissociation
| Nucleotidea | Buffer | Rate × 105 s−1 (n)b |
|---|---|---|
| — | BRB | 15.6 (2) |
| — | Pi | 14.9 (6) |
| — | Pi (12 mM Mg) | 13.2 (3) |
| GDP | BRB | 7.8 (2) |
| GDP | Pi | 2.6 (1) |
| GDP | Pi (0.1 mM colchicine) | 3.9 (1) |
| GDP | BRB, 10 mM EDTA | 14.2 (1) |
| GDP | Pi, 0.1 mM EDTA | 42.7 (2) |
| GTP | BRB | 1.9 (2) |
| GTP | Pi | 1.9 (2) |
| GTP | Pi (12 mM Mg) | 3.2; 50 μM GTP (1) |
| 4.8; 1mM GTP (1) | ||
| GTP | BRB, 15 μM EDTA | 13.6 (2) |
The nucleotide concentration was 5–20 μM, which is sufficient to saturate the E-site (Zeeberg and Caplow, 1979).
Number of determinations.
To determine whether dissociation of the tubulin-GDP dimer proceeds via a nucleotide-free intermediate (Eq. 1):
 |
1 |
the rate was measured with both 50 μM and 1 mM GTP. The mechanism in Eq. 1 predicts that a high GTP concentration will decrease the equilibrium concentration of nucleotide-free dimer and thereby reduce the rate. However, the similar rate at the two nucleotide concentrations (Table 1) indicates that dissociation does not proceed via a nucleotide-free intermediate. Rates were measured with Pipes buffer, because this has been used in many studies of tubulin, and with Pi, because this is generally used in ultracentrifuge studies because of its low UV absorbance. There was no significant difference in the dissociation rate in the two buffers, except with tubulin-GDP, where the rate was slower with Pi (Table 1). Because the rate in Pi buffer was about equal to that for dissociation of tubulin-GTP in Pipes and in Pi, it appears that tubulin-GDP-Pi, rather than with tubulin-GDP is the reactive species in Pi buffer.
Gel Filtration Studies of Dimer Dissociation
Calibration of a Superdex HR 10/30 column with globular proteins (Figure 3) gave the relationship:
 |
2 |
The void volume was 8.0 ml, and Eq. 2 predicts elution of the tubulin dimer and monomer at 13.74 ml and 15.20 ml, respectively. However, a somewhat less than 1.46-ml difference might result if the two species have different shapes and/or if the monomer is retarded by the weak ion exchange properties of the Superdex HR column, as found previously (Vassilev et al., 1995). Although the Superdex matrix is presumably uncharged, its weak ion exchange properties can be important with the exceptionally low concentrations of protein used here. In any case, by collecting small (0.1 ml) column fractions, the tubulin and monomer should be clearly resolved on the Superdex column.
Figure 3.

Molecular-weight dependence of protein elution from a Superdex 200 column in BRB buffer. Calibration was with thyroglobulin, apoferritin, amylase, bovine serum albumin, egg albumin, and carbonic anhydrase, left to right, respectively.
Dissociation of Micromolar Concentrations of Tubulin
Tubulin-GDP (MW 100.1 kDa) that had been diluted to 0.2 μM immediately before chromatography eluted in a single peak at 13.73 ml (100.3 kDa; Figure 4). The same result was obtained with 0.062 and with 4.3 μM tubulin; these eluted in a peak with an apparent molecular weights of 100.3 and 107.7 kDa, respectively. Gel exclusion chromatography of tubulin will yield separate dimer and monomer peaks if the equilibrium between these species is slow, relative to the rate at which they are separated by chromatography. On the other hand, tubulin will elute in a single peak if the dimer/monomer equilibrium is rapid. Our finding that tubulin elutes as a single peak with an apparent molecular weight of ∼100 kDa is consistent with it existing primarily as a dimer at the concentrations studied. That only dimer is present in 0.2 μM tubulin-GDP is not in accord with the ∼0.5 μM Kd previously reported (Detrich and Williams, 1978; Mejillano and Himes, 1989; Panda et al. 1992; Sarkar et al., 1995), which predicts 75% dimer dissociation with 0.2 μM tubulin. Tubulin at 0.062 μM is expected to be 90% dissociated if Kd is 0.5 μM but this was not seen.
Figure 4.

Stability of tubulin-GDP. Tubulin-GDP in BRB buffer, 0.2 μM, was chromatographed on Superdex immediately after dilution (▵) and after incubation for 10 (●) and for 22 h (+). The peaks were at 13.73, 13.69, and 13.73 ml, respectively, in these reactions. Virtually identical results were obtained in three experiments.
To determine whether failure to observe the tubulin monomer with 0.2 μM tubulin-GDP resulted because chromatography was done before the slow dissociation of dimer (Figure 1) allowed attainment of equilibrium, samples were analyzed after varying periods of incubation. After 10 and 22 h 0.2 μM tubulin-GDP in 80 mM Pipes (as well as in 10 mM Pi; unpublished results) eluted with an apparent molecular weight of 100.8–102.7 kDa (Figure 4). The area of the dimer peak was virtually unchanged in 10 h but decreased 35% at 22 h. Tubulin aggregates that eluted between the void volume and the dimer peak were present at 10 and 22 h. At 22 h the main peak had a significant trailing edge; however, there was no evidence of a distinct tubulin monomer peak at or near 15.19 ml. It is suggested that the trailing edge contained denatured monomers with varying conformations that produce a broad peak. The observation that 0.2 μM tubulin-GDP elutes with an apparent molecular weight equal to that of dimeric tubulin indicates that the protein is not appreciably dissociated at this concentration. The constancy of the apparent molecular weight for a time period equal to eight half-lives for dissociation of tubulin-GDP dissociation (see plasmon resonance results in Table 1) indicates that the dimer/monomer reaction had attained equilibrium. Identical results were obtained when 0.2 μM tubulin-GDP was incubated for 12 h in Pi buffer; a Pi buffer had been used for several ultracentrifuge studies of tubulin. The stability of tubulin reported here agrees with the 42–50 h half-life for loss of assembly with taxol and for the loss of fluorescence in a tubulin-dye complex (Menendez et al., 1998).
Because plasmon resonance indicated EDTA increased the tubulin-GDP dimer dissociation rate (Table 1), it was expected that incubation with EDTA would produce sufficient monomer to be detected by UV absorbance. In accord with this there was a major trailing edge to the dimer peak at 13.70 ml (102 kDa) after a 90-min incubation with 10 mM EDTA (Figure 5). The dimer peak also had a major leading edge, corresponding to tubulin aggregates. After 5 h about half of the protein eluted in the void volume peak (8 ml); at 12 h almost all the protein was aggregated. The presence of about half of the tubulin as dimer at 90 min (Figure 5) agrees with the plasmon resonance results (Table 1), which predict 37% of the dimer will be intact at 90 min under these conditions. Also, the finding that both dissociation and aggregation of tubulin-GDP is slow in the presence of Mg (Table 1 and Figure 4) and that both dissociation and aggregation is relatively rapid with EDTA (Table 1) provides evidence that the monomer is an intermediate in forming tubulin aggregates. As described below, formation of nonnative monomers may lead to overestimates of the tendency for tubulin dimer dissociation.
Figure 5.

Role of Mg in stabilizing tubulin-GDP. Tubulin-GDP, 0.2 μM, was incubated in BRB containing 10 mM EDTA for 1.5 (A), 5 (B), and 12 h (C) before chromatography. At 1.5 h the main peak was at 13.69 ml (103 kDa).
Dissociation of Nanomolar Concentrations of Tubulin
Failure to detect dimer dissociation in the UV absorbance profile from chromatography of 4.3–0.062 μM tubulin (Figure 4) indicated a requirement for an assay for tubulin at the very low concentrations where dissociation is favored. We developed an immunoassay method to detect tubulin in column fractions when subnanomolar concentrations of tubulin were chromatographed. The assay was first used to corroborate results obtained when the UV absorbance was recorded. Tubulin at 0.2 μM eluted with an apparent molecular weight of 101–110 kDa in samples analyzed after incubation for 2 and for 11.5 h (Figure 6), in agreement with results using UV absorbance to monitor protein elution (Figure 4).
Figure 6.

Stability of 0.2 μM tubulin-GDP analyzed with an immunochemical assay. Samples were chromatographed after 2 (A) and after 11.5 (B) h. The signal strength varied because of assay conditions.
Tubulin dimer also predominated when the concentration was 2 nM. Tubulin-GDP chromatographed immediately after dilution eluted in a peak at 13.48 ml, corresponding to an apparent molecular weight of 113 kDa (Figure 7A); there was also evidence of a small peak from tubulin monomer at ∼14.5 ml (70 kDa). An almost identical elution profile was seen with samples analyzed after 3, 5, and 19 h (Figure 7, B–D). The size of the peak at ∼14.5 ml did not increase with time, suggesting that monomer found immediately after dilution may be derived from denatured dimer. Evidence supporting this was the concentration of monomer did not change when the protein was diluted 10-fold (Figure 8A). If the low concentration of monomer with 2.0 nM protein was at equilibrium with native dimer its concentration would increase 3.16-fold (100.5) by a 10-fold dilution. Significant dimer dissociation was observed with tubulin at 0.04 and at 0.02 nM (Figure 8, B and C; Table 2), consistent with these concentrations being at or near the Kd for dissociation. It is suggested that the elution profiles deviated from the 100- and 50-kDa values for the tubulin dimer and monomer because of experimental error and because the monomer and dimer were not fully resolved, especially with samples at very low concentrations where the peaks were of nearly equal size.
Figure 7.

Chromatography of 2 nM tubulin-GDP as a function of time. Samples were chromatographed immediately after dilution (A; apparent MW 113 kDa), after 3 h (B, apparent MW 105 kDa), after 5 h (C, apparent MW 119 kDa), and after 19 h (D, apparent MW 107 kDa). The signal strength varied because of assay conditions.
Figure 8.

Tubulin dissociation at low concentrations. Tubulin-GDP at 0.2 (A), 0.04 (B), and 0.02 nM (C) was chromatographed after incubation for 3–4 h. A major signal was at ∼13.56 ml (109 kDa) in A; at ∼13.56 ml (109 kDa) and 15.16 ml (51 kDa) in B; and at ∼13.74 ml (100 kDa) and 14.54 ml (69 kDa) in C.
Table 2.
Gel exclusion chromatography of tubulin
| Tubulin conc. (nM), incubation (h) | Apparent MW dimer peak (kDa) | Apparent MW monomer peak (kDa) | % Monomer observed | % Monomer calculated for Kd 1 × 10⁻¹¹ M |
|---|---|---|---|---|
| 2.0 (ASAP) | 110–116 | 0 | 3.4a | |
| 2.0 (5) | 104–118 | 69–72 | 7–10 | 6.8 |
| 0.2 (ASAP) | 103 | 61 | 7 | 3.7a |
| 0.2 (1.5, 3, 6) | 109 | 70 | 13 | 20 |
| 0.2 (3) | 109 | 69 | 5 | 20 |
| 0.2 (3) | 108 | 71 | 10 | 20 |
| 0.04 (3) | 109 | 73 | 32 | 39 |
| 0.04 (3) | 105 | 47 | ca, 60 | 39 |
| 0.04 (2) | 109 | 51 | ca, 40 | 39 |
| 0.02 (3) | 125 | 82 | 54 | 50 |
| 0.02 (3) | 120 | 79 | ca, 40 | 50 |
| 0.02 (3) | 100 | 69 | ca, 50 | 50 |
It was assumed that 10 min elapsed between the time when the tubulin was diluted and when chromatographic separation of the monomer and dimer started; it required about 5 min to filter the protein and start the chromatography. The monomer concentration at 10 min was calculated from Eq. 3, assuming dissociation and association rate constants equal to 6.3 × 10⁻⁵ s−1 and 6.3 × 10⁶ M−1 s−1, respectively.
It was important to determine whether the relatively small amount of dimer dissociation with very low tubulin concentrations resulted because the reaction had not attained equilibrium when the measurements were made. This was a concern because the plasmon resonance results indicated 9- and a 3-h half-times for dissociation of tubulin-GTP and tubulin-GDP, respectively (Table 1). As described next, under conditions where the equilibrium for dimer dissociation is unfavorable, equilibrium is attained rather rapidly.
For the reaction:
 |
the time course for change in the dimer concentration is described by Eq. 3:
 |
3 |
 |
 |
 |
where b = −k1 (α-β)total, c = −k1, q = −k−12 − 4 k1 k−1 (α-β)total, x0 = the dimer concentration immediately after dilution (assumed to be equal to [α-β]total before dilution/[dilution factor]); Δt is the time that has elapsed in the relaxation to the new equilibrium position. The complexity of Eq. 3 results because dissociation is a first-order and association is a second-order reaction. We have used Eq. 3 to calculate the time course for the relaxation to equilibrium when a concentrated solution of tubulin-GDP is extensively diluted to induce dissociation. A k−1 equal to 7.8 × 10⁻⁵ s−1 was used for this calculation (Table 1) and k1 was assumed to be equal to the rate of reaction of tubulin-GTP with microtubule ends (8.9 × 10⁶ M−1 s−1; Walker et al., 1988). These rate constants appear reasonable because the k−1/k1 ratio corresponds to a Kd equal to 0.88 × 10⁻¹¹ M, which agrees with the value determined from column chromatography experiments (see below). Equation 3 predicts a half-time of ∼425 s for the relaxation to equilibrium after dilution of concentrated tubulin-GDP to 2 nM; the time is short because only 6.4% of the dimer must dissociate for attaining equilibrium (Figure 9). After dilution to 0.2 nM the half-time is increased to about 1300 s because 18.86% of the dimer must dissociates to generate the equilibrium mixture.
Figure 9.

Kinetics for dissociation of tubulin-GDP after dilution to 2 nM. The rate was calculated from Eq. 3.
DISCUSSION
Dissociation of the Tubulin Dimer Is Extremely Slow
The rate of dissociation of the tubulin dimer was not previously measured, but assuming that the α-subunit's N-site GTP becomes dissociable in the monomer, the observed ∼16-h half-time for N-site GTP dissociation (Zeeberg and Caplow, 1978) suggested that dimer dissociation would be very slow. Dimer dissociation was found to have a half-time that ranged from 2 to10 h, with the kinetic stability of the intradimer bond reduced ∼3-fold when E-site GTP was replaced by GDP, and ∼8-fold when the E-site was empty (Table 1). GTP had previously been found to increase the thermodynamic stability of the interdimer bond in microtubules by a factor of 775, compared with GDP (Caplow et al., 1994). The greater effect of E-site GTP on the interdimer bond may result because E-site nucleotide in microtubules contributes directly to this bond (Nogales et al., 1999). Also, E-site nucleotide can stabilize both longitudinal and lateral interactions in microtubules, whereas only the former is possible in the dimer. Our observation of an effect of E-site nucleotide on dimer stability along with the fact that the E-site is remote from the subunit intradimer bond (Nogales et al. 1998) provides evidence that nucleotide bound at the E-site has a global effect on the protein's conformation.
Dissociation of the tubulin dimer was previously found at pH 8.5 but not at lower pHs (Giraudel et al. 1998). Our plasmon resonance studies agreed with the reported pH effect: the dissociation rate was proportional to the hydroxide concentration from pH 6.8 to 9.0. This pH dependence would result if the dimer is stabilized by salt bridges containing basic side chains with pKs greater than 9. The hydroxide-dependence of the rate accounts for the very rapid 50% signal decrease when chips with bound tubulin were treated with 50 mM NaOH (see above).
Reversibility of Dimer Dissociation and Role of Protein Cofactors and GTP Hydrolysis in Dimer Formation and Dissociation
Evidence that tubulin dimer dissociation is reversible in the absence of GTP hydrolysis was the persistence of a dimeric structure in tubulin-GDP for 22 h (Figure 4) despite the 3-h half-time for tubulin-GDP dissociation (Figure 1). If dissociation were not reversible all of the protein would have been converted to monomer.
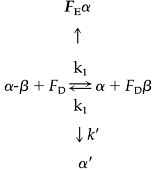
There appears to be a discrepancy between our finding that dissociation of the tubulin dimer is reversible, whereas Tian et al. (1997) found that when dimers are pulled apart by high concentrations of Factor D, the reaction is irreversible unless Cofactor E, an α-binding protein, is present. The following model (Eq. 4) can accommodate these disparate results:
 |
4 |
(1) Cofactor D catalyzes dimer dissociation (and association) and binds the liberated β-subunit; (2) Binding of Factor D to the β-subunit has a mass action effect that induces quantitative dissociation of the dimer; (3) The free α-subunit is relatively unstable and slowly forms a species (α′) that cannot form dimer. The k′ path is suggested by the observation that no radioactive band entered a native-gel when [alpha-35S]-labeled dimer was treated with Factor D (Tian et al., 1997). Because the k′ reaction is irreversible, Eq. 4 predicts that dimer dissociation is ultimately irreversible in the presence and in the absence of cofactors. However, as described next, dimer dissociation is reversible in the absence of Factors D and E, because denaturation is slow.
In the absence of cofactors, the rate of irreversible dimer dissociation via Eq. 4 is
 |
5 |
Equation 5 predicts the rate of formation of denatured α-subunits (α′) is equal to that for dimer dissociation (i.e., in Eq. 5 all terms other than k1 cancel), if the rate for reforming the dimer (k−1β) is less than that for denaturation (k′). This possibility is ruled out because the dimer lifetime exceeds the k1 measured with plasmon resonance (cf. Figures 1 and 4); therefore, k−1β > k′. Accordingly, the rate for forming α′ is equal to [k1 (αβ)/(k−1β)] k′. The rate of denaturation is slow because k1 (αβ)/(k−1β) < 1; this assignment is required because at equilibrium k1 (αβ) = (k−1β)(α), and k1(αβ)/(k−1β) > k1(αβ)/(k−1β)(α). In summary, the tubulin dimer is stable in the absence of Cofactor D because only a trace amount of α-monomer is present and because this reverts to dimer more quickly than it denatures. The dimer is much less stable in the presence of excess FD because dimer dissociation is made rapid. Also, dissociation is made to appear irreversible because excess FD pulls dissociation to completion so that all of the α-subunits are available for denaturation via the k′ reaction. On the other hand, denaturation of α-subunits is slow when both FD and FE are present because the formation of FE-α protects the α-subunit from the k′ reaction.
Our evidence that the second-order reaction in which α- and β-subunits form dimer occurs at a diffusion-limited rate indicates that protein cofactors cannot enhance the rate; i.e., there is no need for a “dimer-forming machine.” However, tubulin cofactors may play a role in dimer formation by folding newly synthesized monomers to a native conformation. Also, Cofactor D catalysis for dimer dissociation (Tian et al. 1999) suggests that this activity may be important in allowing newly synthesized tubulin monomers to replace subunits in existing dimers. Tubulin is specifically sorted during dimerization (Hoyle et al., 2001), and this may involve cofactors catalyzing the otherwise slow dissociation so that dimers with unique properties are formed in the back reaction. Catalysis for dimer dissociation may also be important in limiting the lifetime of tubulin dimers in cells.
The Kd for Dissociation of Tubulin-GDP Is ∼10−11 M
The Kd for dimer dissociation was calculated from the ratio of the rate constants for the dissociation and association reaction:
 |
6 |
k− is equal to 7.8 × 10⁻⁵ s−1 with tubulin-GDP (Table 1) and k+, the rate constant for making the interdimer bond, was assumed to be equal to that for forming the intradimer bond in microtubules by addition of tubulin-GTP to ends. Forming the interdimer and intradimer bonds involves a reaction of two specific proteins, so a diffusion-limited rate equal to 1–100 × 106 M−1 s−1 (Northrup and Erickson, 1992) is expected. Based on the 8.9 × 10⁶ M−1 s−1 rate constant for tubulin-GTP addition to microtubules (Walker et al., 1988), a Kd equal to 1.0 × 10⁻¹¹ M was calculated for the intradimer bond.
Size exclusion chromatography studies with 0.02–2 nM tubulin are consistent with a Kd equal to 10−11 M (Figure 8, Table 2). Results with 0.04 and .02 nM tubulin are especially important because sufficient dimer was dissociated to allow unambiguous identification and measurement of the lower molecular weight peak.
The very low Kd for the tubulin dimer may be important in minimizing the toxicity of free β-subunits (Burke et al., 1989; Weinstein and Solomon, 1990). It has been estimated that 5–40% of the total tubulin in cells is not in polymer (Minotti et al.,1991; Zhai and Borisy, 1994) so with total cell tubulin estimated at 20 μM, the dimer concentration would be in the 1–8 μM range. Despite this high subunit concentration, the 10−11 M Kd reduces the α- and β-monomer concentration to only 3.1–8.9 nM.
Earlier Studies of the Dissociation of the Tubulin Dimer
Most reported values for the tubulin dimer dissociation constant suggest that the interaction of α- and β-subunits is relatively weak. Kd was 0.7–0.8 μM from equilibrium centrifugation (Detrich and Williams, 1978; Detrich et al., 1982), gel exclusion chromatography (Mejilliano and Himes, 1989), and from studies of the dilution-induced changes in the fluorescence of a dye-tubulin conjugate (Mejillano and Himes, 1989; Panda et al. 1992; Sarkar et al., 1995). A smaller Kd equal to 0.17 μM was estimated from the dependence of proteolytic digestibility on the tubulin concentration (Sackett et al., 1989). Although this Kd was confirmed by equilibrium ultracentrifugation (Sackett and Lippoldt, 1991), a redetermination by another laboratory (Shearwin et al., 1994) gave Kd equal to 0.0033 μM under identical conditions. Kds equal to 0.032 μM (Menendez et al., 1998) and 0.014 μM (Shearwin et al., 1994) were derived from ultracentrifuge studies.
Evidence that the true Kd for dimer dissociation may be smaller than any of the reported values is antibodies directed at only one of the two tubulin subunits are able to immunoprecipitate both subunits, even after exhaustive washing with buffer (Giraudel et al., 1998; Vega et al., 1998). Thus, the rate of dissociation of the tubulin dimer is slower than the rate of dissociation of the dimer from the antibody; this slow rate is consistent with a very small Kd. Additional evidence that tubulin dimer dissociation is very slow is the biphasic kinetics for digestion of tubulin subunits with subtilisin (Sackett et al., 1989). A portion of the protein, presumably tubulin monomer, is digested immediately and another fraction only very slowly; the dimer dissociation constant was determined from the effect of dilution on the fraction of protein that was rapidly digested. This analysis is predicated on an assumption that the time for equilibration between monomer and dimer is very slow. It is surprising that this method gave the same Kd as determined using ultracentrifugation (Sackett and Lippoldt, 1991), in a study in which it was presumably demonstrated that the equilibrium between dimer and monomer is rapid. Additional evidence against the reported high Kd values is failure to observe nucleotide exchange at the N site in a 2-h incubation (Shearwin et al., 1994) with tubulin that was diluted to 0.67 μM, a concentration at which ultracentrifuge results presumably showed that α-β dimer dissociation occurs. It was concluded that N-site GTP is bound 106 –107 fold tighter than at the E-site; based on the E-site Kd (Zeeberg and Caplow, 1979) this corresponds to a Kd equal to 2 × 10⁻¹⁵–2 × 10⁻¹⁶ for nucleotide dissociation from the α-subunit. An alternate interpretation is the 0.67 μM tubulin was not appreciably dissociated. Finally, a Kd in the nanomolar or lower range might be expected for the tubulin dimer since the Kd is equal to 3 nM for formation of single-stranded intersubunit bonds with the tubulin homologue FtsZ (Romberg et al., 2001).
There are several reasons for concern about the relatively high Kds that have been reported. First, these predict that cells will contain significant amounts of tubulin monomer. For example, 9.5% of dimeric tubulin is dissociated even when the dimer concentration is equal to 100 times Kd (i.e., Kd = (0.095 TubulinTotal)2/(1 − 0.095) TubulinTotal). As described above, the nonmicrotubule pool of tubulin subunits is between 1 and 8 μM. With Kd equal to 0.7 μM (Detrich and Williams, 1978) the concentration of monomer would be 0.56 μM with 1 μM subunit tubulin and 2.04 μM with 8 μM subunit tubulin. Because β-tubulin subunits form aberrant polymers and are toxic in yeast, it is not unlikely that these high concentrations of monomer would have a pathological effect in cells.
Concern about the reported high Kd values also comes from the properties of the α-subunit's nonexchangeable and nonhydrolyzeable GTP (N-site) that is located at the interface with the β-subunit (Nogales et al., 1998). The half-life for dissociation of N-site GTP is 33 h in CHO cells (Spiegelman et al., 1978). A 16-h half-time was determined for the reaction in vitro, from a change in the 32P/3H ratio in E-site GTP (Zeeberg and Caplow, 1978) that resulted when GTP at the N-site dissociated and differentially diluted the specific activity of the GDP and γ-Pi moieties of E-site GTP. The slow dissociation rate for N-site GTP contrasts with GTP bound at the E-site that is located at the β-subunit's interface with solvent. The Kd and rate constant for E-site GTP are 23 nM and ∼0.1 s−1, respectively (Zeeberg and Caplow, 1978; Brylawski and Caplow, 1983). Because the detailed architecture of the E-site and N-site are similar (Nogales et al.,1998), it is expected that the rate and equilibrium for GTP binding would be similar for the dimer and for the α-monomer. Therefore, if significant tubulin exists as monomer when the dimer concentration is 0.67 μM (Shearwin et al., 1994), the rates of nucleotide dissociation would not differ almost 10,000-fold.
The relatively large range of Kd values that have been reported for dimer dissociation may result because the monomer/dimer reaction was not at equilibrium when measurements were made. This is not unlikely because dimer dissociation is very slow (Table 1), and work with tubulin is done expeditiously to avoid protein aggregation. Measurements of the Kd may also be problematic because the presence of nonnative monomer will lead to an overestimation of the dimer Kd. Sedimentation equilibrium analysis with tubulin at varying concentrations can detect the presence of denatured monomer as well as determine whether a mixture of dimer and monomer are at chemical equilibrium. However, these studies are limited by the low sensitivity of optical methods for measuring protein, so that protein concentrations for centrifugation studies generally significantly exceed the Kd, and very little dissociation is seen. For example, in a study with tubulin-GDP in which a Kd equal to 2.08 nM was reported (Shearwin et al. 1994), the 0.82–2.27 μM tubulin used was 2.7–4.9% dissociated; it was 16–27% dissociated in a reaction where the Kd was increased by EDTA.
SUMMARY
The Kd for the tubulin dimer appears to be sufficiently small that measurements of this constant take one to the limit of most detection systems. In addition, the dissociation is slow, so that attainment of chemical equilibrium requires considerable time. Measurements can be further complicated by formation of inactive monomer and tubulin aggregates. We believe that our plasmon resonance and gel filtration results are not subject to these limitations so they provide an accurate estimate of the dimer Kd.
ACKNOWLEDGMENTS
The authors are grateful to Harold Erickson, Andy Hunter, and Joe Howard for critical comments on the manuscript and to Barry Zeeberg for very helpful discussion. This work was supported by National Institutes of Health grant GM59231.
Footnotes
Article published online ahead of print. Mol. Biol. Cell 10.1091/mbc.E01–10–0089. Article and publication date are at www.molbiolcell.org/cgi/doi/10.1091/mbc.E01–10–0089.
REFERENCES
- Archer JE, Magendantz M, Vega LR, Solomon F. Formation and function of the Rbl2p-beta-tubulin complex. Mol Cell Biol. 1998;18:1757–1762. doi: 10.1128/mcb.18.3.1757. [DOI] [PMC free article] [PubMed] [Google Scholar]
- Bhamidipati A, Lewis SA, Cowan NJ. Adp ribosylation factor-like protein 2 (Arl2) regulates the interaction of tubulin-folding cofactor D with native tubulin. J Cell Biol. 2000;149:1087–1096. doi: 10.1083/jcb.149.5.1087. [DOI] [PMC free article] [PubMed] [Google Scholar]
- Brylawski BP, Caplow M. Rate for nucleotide release from tubulin. J Biol Chem. 1983;258:760–763. [PubMed] [Google Scholar]
- Burke D, Gasdaska P, Hartwell L. Dominant effect of tubulin overexpression in Saccharomyces cerevisiae. Mol Cell Biol. 1989;9:1049–1059. doi: 10.1128/mcb.9.3.1049. [DOI] [PMC free article] [PubMed] [Google Scholar]
- Canziani G, Zhang W, Cines D, Rux A, Willis S, Cohen G, Eisenberg R, Chaiken I. Exploring biomolecular sensors. Methods (Duluth) 1999;19:253–269. doi: 10.1006/meth.1999.0855. [DOI] [PubMed] [Google Scholar]
- Caplow M, Shanks J. Evidence that a single monolayer tubulin-GTP cap is both necessary and sufficient to stabilize microtubules. Mol Biol Cell. 1996;7:663–675. doi: 10.1091/mbc.7.4.663. [DOI] [PMC free article] [PubMed] [Google Scholar]
- Caplow M, Ruhlen RL, Shanks J. The free energy for hydrolysis of a microtubule-bound nucleotide triphosphate is near zero: all of the free energy for hydrolysis is stored in the microtubule lattice. J Cell Biol. 1994;127:779–788. doi: 10.1083/jcb.127.3.779. [DOI] [PMC free article] [PubMed] [Google Scholar]
- Correia JJ, Baty LT, Williams RC., Jr Mg2+ dependence of guanine nucleotide binding to tubulin. J Biol Chem. 1987;262:17278–17284. [PubMed] [Google Scholar]
- Detrich HW, 3d, Williams RC, Jr, Wilson L. Effect of colchicine binding on the reversible dissociation of the tubulin dimer. Biochemistry. 1982;21(10):2392–2400. doi: 10.1021/bi00539a018. [DOI] [PubMed] [Google Scholar]
- Detrich HW, 3d, Williams RC. Reversible dissociation of the alpha beta dimer of tubulin from bovine brain. Biochemistry. 1978;17:3900–3907. doi: 10.1021/bi00612a002. [DOI] [PubMed] [Google Scholar]
- Fleming JA, Vega LR, Solomon F. Function of tubulin binding proteins in vivo. Genetics. 2000;156:69–80. doi: 10.1093/genetics/156.1.69. [DOI] [PMC free article] [PubMed] [Google Scholar]
- Gao Y, Vainberg IE, Chow RL, Cowan NJ. Two cofactors and cytoplasmic chaperonin are required for the folding of alpha- and beta-tubulin. Mol Cell Biol. 1993;13:2478–2485. doi: 10.1128/mcb.13.4.2478. [DOI] [PMC free article] [PubMed] [Google Scholar]
- Giraudel A, Lafanechere L, Ronjat M, Wehland J, Garel JR, Wilson L, Job D. Separation of tubulin subunits under nondenaturing conditions. Biochemistry. 1998;37:8724–8734. doi: 10.1021/bi972747g. [DOI] [PubMed] [Google Scholar]
- Guggenheim EA. On the determination of the velocity constant of a unimolecular reaction. Phil Mag. 1926;2:538–543. [Google Scholar]
- Hirata D, Masuda H, Eddison M, Toda T. Essential role of tubulin-folding cofactor D in microtubule assembly and its association with microtubules in fission yeast. EMBO J. 1998;17:658–666. doi: 10.1093/emboj/17.3.658. [DOI] [PMC free article] [PubMed] [Google Scholar]
- Hoyle HD, Turner FR, Brunick L, Raff EC. Tubulin sorting during dimerization in vivo. Mol Biol Cell. 2001;12:2185–2194. doi: 10.1091/mbc.12.7.2185. [DOI] [PMC free article] [PubMed] [Google Scholar]
- Hoyt MA, Stearns T, Botstein D. Chromosome instability mutants of Saccharomyces cerevisiae that are defective in microtubule-mediated processes. Mol Cell Biol. 1990;10:223–234. doi: 10.1128/mcb.10.1.223. [DOI] [PMC free article] [PubMed] [Google Scholar]
- Hoyt MA, Macke JP, Roberts BT, Geiser JR. Saccharomyces cerevisiae PAC2 functions with CIN1, 2 and 4 in a pathway leading to normal microtubule stability. Genetics. 1997;146:849–857. doi: 10.1093/genetics/146.3.849. [DOI] [PMC free article] [PubMed] [Google Scholar]
- Hyman A, Drechsel D, Kellogg D, Salser S, Sawin K, Steffen P, Wordeman L, Mitchison T. Preparation of modified tubulins. Methods Enzymol. 1991;196:478–485. doi: 10.1016/0076-6879(91)96041-o. [DOI] [PubMed] [Google Scholar]
- Martin L, Fanarraga ML, Aloria A, Zabala JC. Tubulin cofactor D is a microtubule destabilizing protein. FEBS Lett. 2000;470:93–95. doi: 10.1016/s0014-5793(00)01293-x. [DOI] [PubMed] [Google Scholar]
- Mejillano MR, Himes RH. Tubulin dimer dissociation detected by fluorescence anisotropy. Biochemistry. 1989;28:6518–6524. doi: 10.1021/bi00441a053. [DOI] [PubMed] [Google Scholar]
- Melki R, Rommelaere H, Leguy R, Vandekerckhove J, Ampe C. Cofactor A is a molecular chaperone required for beta-tubulin folding: functional and structural characterization. Biochemistry. 1996;35:10422–10435. doi: 10.1021/bi960788r. [DOI] [PubMed] [Google Scholar]
- Menendez M, Rivas G, Diaz JF, Andreu JM. Control of the structural stability of the tubulin dimer by one high affinity bound magnesium ion at nucleotide N-site. J Biol Chem. 1998;273:167–176. doi: 10.1074/jbc.273.1.167. [DOI] [PubMed] [Google Scholar]
- Minotti AM, Barlow SB, Cabral F. Resistance to antimitotic drugs in Chinese hamster ovary cells correlates with changes in the level of polymerized tubulin. J Biol Chem. 1991;266:3987–3994. [PubMed] [Google Scholar]
- Nogales E, Wolf SG, Downing KH. Structure of the αβ tubulin dimer by electron crystallography. Nature. 1998;391:199–203. doi: 10.1038/34465. [DOI] [PubMed] [Google Scholar]
- Nogales E, Whittaker M, Milligan RA, Downing KH. High-resolution model of the microtubule. Cell. 1999;96:79–88. doi: 10.1016/s0092-8674(00)80961-7. [DOI] [PubMed] [Google Scholar]
- Northrup SH, Erickson HP. Kinetics of protein-protein association explained by Brownian dynamics computer simulation. Proc Natl Acad Sci USA. 1992;89:3338–3342. doi: 10.1073/pnas.89.8.3338. [DOI] [PMC free article] [PubMed] [Google Scholar]
- Panda D, Roy S, Bhattacharyya B. Reversible dimer dissociation of tubulin S and tubulin detected by fluorescence anisotropy. Biochemistry. 1992;31:9709–9716. doi: 10.1021/bi00155a026. [DOI] [PubMed] [Google Scholar]
- Radcliffe PA, Garcia MA, Toda T. The cofactor-dependent pathways for alpha- and beta-tubulins in microtubule biogenesis are functionally different in fission yeast. Genetics. 2000;156:93–103. doi: 10.1093/genetics/156.1.93. [DOI] [PMC free article] [PubMed] [Google Scholar]
- Romberg L, Simon M, Erickson HP. Polymerization of FtsZ, a bacterial homolog of tubulin. Is assembly cooperative. J Biol Chem. 2001;276:11743–11753. doi: 10.1074/jbc.M009033200. [DOI] [PubMed] [Google Scholar]
- Sackett DL, Knutson JR, Wolff J. Hydrophobic surfaces of tubulin probed by time-resolved and steady-state fluorescence of nile red. J Biol Chem. 1990;265:14899–14906. [PubMed] [Google Scholar]
- Sackett DL, Lippoldt RE. Thermodynamics of reversible monomer-dimer association of tubulin. Biochemistry. 1991;30(14):3511–3517. doi: 10.1021/bi00228a023. [DOI] [PubMed] [Google Scholar]
- Sackett DL, Zimmerman DA, Wolff J. Tubulin dimer dissociation and proteolytic accessibility. Biochemistry. 1989;28(6):2662–2667. doi: 10.1021/bi00432a045. [DOI] [PubMed] [Google Scholar]
- Sarkar N, Mukhopadhyay K, Parrack PK, Bhattacharyya B. Aging of tubulin monomers using 5,5′-bis(8-anilino-1-naphthalenesulfonate) as a probe. Biochemistry. 1995;34:13367–13373. doi: 10.1021/bi00041a013. [DOI] [PubMed] [Google Scholar]
- Shearwin KE, Perez-Ramirez B, Timasheff SN. Linkages between the dissociation of alpha beta tubulin into subunits and ligand binding: the ground state of tubulin is the GDP conformation. Biochemistry. 1994;33(4):885–893. doi: 10.1021/bi00170a006. [DOI] [PubMed] [Google Scholar]
- Shearwin KE, Timasheff SN. Effect of colchicine analogues on the dissociation of alpha beta tubulin into subunits: the locus of colchicine binding. Biochemistry. 1994;33(4):894–901. doi: 10.1021/bi00170a007. [DOI] [PubMed] [Google Scholar]
- Spiegelman BM, Penningroth SM, Kirschner MW. Turnover of tubulin and the N site GTP in Chinese hamster ovary cells. Cell. 1978;12:587–600. doi: 10.1016/0092-8674(77)90259-8. [DOI] [PubMed] [Google Scholar]
- Stearns T, Hoyt MA, Botstein D. Yeast mutants sensitive to antimicrotubule drugs define three genes that affect microtubule function. Genetics. 1990;124:251–262. doi: 10.1093/genetics/124.2.251. [DOI] [PMC free article] [PubMed] [Google Scholar]
- Tian GL, Bhamidipati A, Cowan NJ, Lewis SA. Tubulin folding cofactors as GTPase-activating proteins—GTP hydrolysis and the assembly of the alpha/beta-tubulin heterodimer. J Biol Chem. 1999;274:24054–24058. doi: 10.1074/jbc.274.34.24054. [DOI] [PubMed] [Google Scholar]
- Tian G, Lewis SA, Feierbach B, Stearns T, Rommelaere H, Ampe C, Cowan NJ. Tubulin subunits exist in an activated conformational state generated and maintained by protein cofactors. J Cell Biol. 1997;138:821–832. doi: 10.1083/jcb.138.4.821. [DOI] [PMC free article] [PubMed] [Google Scholar]
- Vassilev A, Kimble M, Silflow CD, LaVoie M, Kuriyama R. Identification of intrinsic dimer, and overexpressed monomeric forms of gamma-tubulin in Sf9 cells infected with baculovirus containing the Chlamydomonas gamma-tubulin sequence. J Cell Sci. 1995;108:1083–1092. doi: 10.1242/jcs.108.3.1083. [DOI] [PubMed] [Google Scholar]
- Vega LR, Fleming JA, Solomon F. An α-tubulin mutant destabilizes the heterodimer: phenotypic consequences and interactions with tubulin-binding proteins. Mol Biol Cell. 1998;9:2349–2360. doi: 10.1091/mbc.9.9.2349. [DOI] [PMC free article] [PubMed] [Google Scholar]
- Walker RA, O'Brien ET, Preyer NK, Soboeiro MF, Voter WA, Erickson HP. Dynamic instability of individual microtubules analyzed by video light microscopy: rate constants and transition frequencies. J Cell Biol. 1988;107:1437–1448. doi: 10.1083/jcb.107.4.1437. [DOI] [PMC free article] [PubMed] [Google Scholar]
- Weinstein B, Solomon F. Phenotypic consequences of tubulin overproduction in Saccharomyces cerevisiae: differences between alpha-tubulin and beta-tubulin. Mol Cell Biol. 1990;10:5295–5304. doi: 10.1128/mcb.10.10.5295. [DOI] [PMC free article] [PubMed] [Google Scholar]
- Zeeberg B, Caplow M. Determination of free and bound microtubular protein and guanine nucleotide under equilibrium conditions. Biochemistry. 1979;18:3880–3886. doi: 10.1021/bi00585a007. [DOI] [PubMed] [Google Scholar]
- Zeeberg B, Cheek J, Caplow M. Preparation and characterization of [3H]ethyltubulin. Anal Biochem. 1980;104:321–327. doi: 10.1016/0003-2697(80)90082-2. [DOI] [PubMed] [Google Scholar]
- Zeeberg B, Caplow M. Reactions of tubulin-associated guanine nucleotides. J Biol Chem. 1978;253:1984–1990. [PubMed] [Google Scholar]
- Zhai Y, Borisy GG. Quantitative determination of the proportion of microtubule polymer present during the mitosis-interphase transition. J Cell Sci. 1994;107:881–890. doi: 10.1242/jcs.107.4.881. [DOI] [PubMed] [Google Scholar]